Embed Size (px)
Citation preview

University of New MexicoUNM Digital Repository
Electrical and Computer Engineering ETDs Engineering ETDs
Fall 11-15-2017
Modeling of a Battery Storage System on aDistribution FeederAaron M. GriegoUniversity of New Mexico
Follow this and additional works at: https://digitalrepository.unm.edu/ece_etds
Part of the Electrical and Computer Engineering Commons
This Thesis is brought to you for free and open access by the Engineering ETDs at UNM Digital Repository. It has been accepted for inclusion inElectrical and Computer Engineering ETDs by an authorized administrator of UNM Digital Repository. For more information, please [email protected].
Recommended CitationGriego, Aaron M.. "Modeling of a Battery Storage System on a Distribution Feeder." (2017). https://digitalrepository.unm.edu/ece_etds/387

i
Aaron Griego Candidate
Electrical Engineering
Department
This thesis is approved, and it is acceptable in quality and form for publication:
Approved by the Thesis Committee:
Dr. Jane Lehr, Chair
Dr. Olga Lavrova, Co-Chair
Dr. Eirini Eleni Tsiropoulou
ii
MODELING OF A BATTERY STORAGE SYSTEM ON A
DISTRIBUTION FEEDER
By
AARON GRIEGO
B.S., Electrical Engineering, University of New Mexico, 2013
THESIS
Submitted in Partial Fulfillment of the Requirements for the Degree of
Master of Science Electrical Engineering
The University of New Mexico
Albuquerque, New Mexico
December, 2017

iii
DEDICATIONS
This thesis is dedicated to my wife Elizabeth Griego, who has supported me and has been
my driving force to finish my thesis.

iv
ACKNOWLEDGMENTS
I would like to thank all of my committee members. I want to give special thanks to my
advisor Dr. Lavrova for providing me with support and guidance during my time with her
in the master’s program. Thanks to her support I was able to develop a curriculum path
that allowed me to accomplish my goals of achieving my master in electrical engineering
while working full time. I would like to also thank my committee Chair and faculty
advisor, Dr. Lehr who has also supported me in my academics.

v
Modeling of a Battery Storage System on a Distribution Feeder
By Aaron Griego
B.S., Electrical Engineering, University of New Mexico, 2013
M.S., Electrical Engineering, University of New Mexico, 2017
Abstract
Driven by the need to reduce harmful emissions and the desire to move away from our
dependency on fossil fuels, we have seen a sharp increase in alternative energy research
and development within the last decade. Amongst the many alternative energy sources,
photovoltaics (PV) is becoming more commonplace on the power utility system.
With these new sources of renewable energy being widely adopted, there are causes for
concern that power utility companies must address. One of the more present issues that
has been noted is the reliability of the power being delivered; in particular with PV
systems. Studies have shown sharp changes in the power output of PV systems during
cloudy and partially cloudy weather. With larger PV sites, this can lead to power quality
issues, making solar less reliable for dispatch. To increase both power quality and
reliability, various storage systems, such as batteries, are used in conjunction with PV
systems. This has led researchers and utilities to see how these storage systems can aid in
other reliability concerns.
The study outlined in this document is concerned with the siting and commissioning of a
1MW/1MWh battery storage system connected to a distribution feeder. While PV
shifting and smoothing with storage systems was been modeled, this study will focus on
voltage regulation, which has not been a focus for storage units. To assist with this study
OpenDSS, an open source electric power distribution system simulator, was utilized.
vi
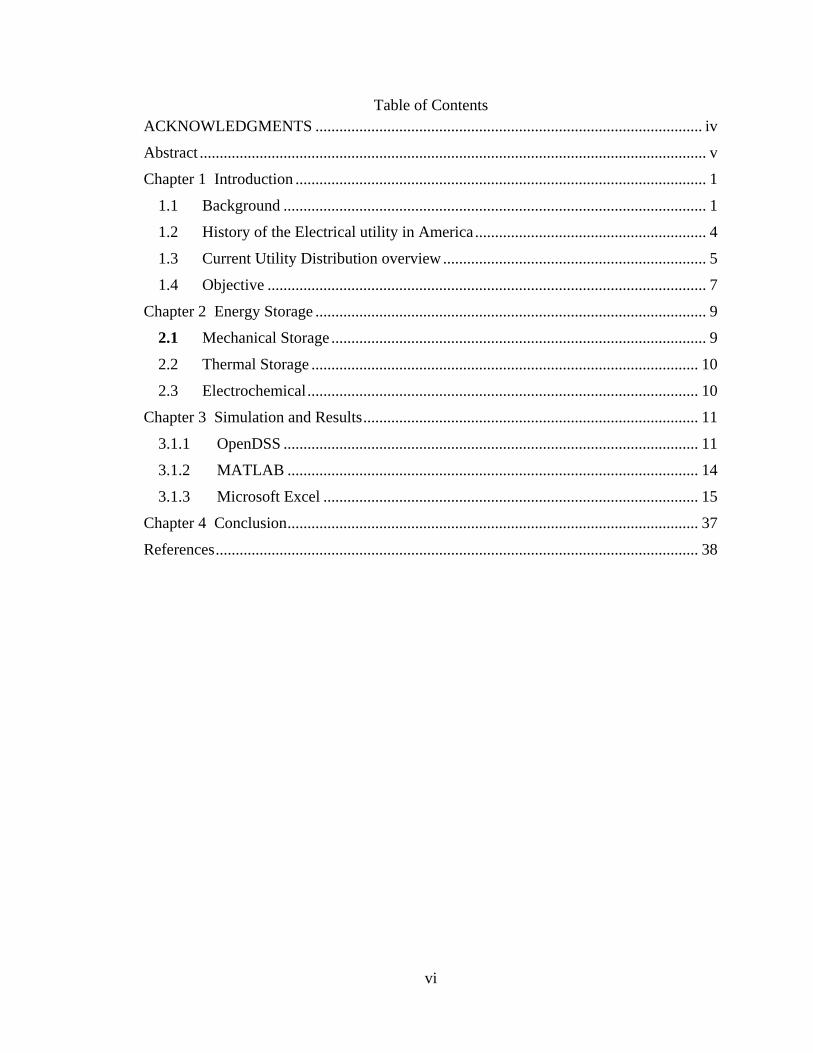
Table of Contents
ACKNOWLEDGMENTS ................................................................................................. iv
Abstract ............................................................................................................................... v
Chapter 1 Introduction ....................................................................................................... 1
1.1 Background .......................................................................................................... 1
1.2 History of the Electrical utility in America .......................................................... 4
1.3 Current Utility Distribution overview .................................................................. 5
1.4 Objective .............................................................................................................. 7
Chapter 2 Energy Storage .................................................................................................. 9
2.1 Mechanical Storage .............................................................................................. 9
2.2 Thermal Storage ................................................................................................. 10
2.3 Electrochemical .................................................................................................. 10
Chapter 3 Simulation and Results .................................................................................... 11
3.1.1 OpenDSS ........................................................................................................ 11
3.1.2 MATLAB ....................................................................................................... 14
3.1.3 Microsoft Excel .............................................................................................. 15
Chapter 4 Conclusion ....................................................................................................... 37
References ......................................................................................................................... 38

vii
Table of Figures FIGURE 1: SOLAR GROWTH IN THE UNITED STATES [3] .................................................................................. 2 FIGURE 2: SOLAR IRRADIANCE DATA IN ALBUQUERQUE [5] ........................................................................... 3 FIGURE 3: REPRESENTATION OF THE TRANSMISSION AND DISTRIBUTION OF ELECTRICAL POWER
THROUGH THE BES FROM THE GENERATING STATION TO THE CUSTOMER ......................................... 7 FIGURE 4 VISUAL REPRESENTATION OF THE COM INTERFACE WITH THE OPENDSS MAIN SIMULATION
ENGINE ................................................................................................................................................. 13 FIGURE 5 MATLAB GRAPHICAL USER INTERFACE .......................................................................................... 14 FIGURE 6 ONE-LINE DIAGRAM OF THE FEEDER AND STORAGE UNIT BEING MODELED IN OPENDSS. ......... 16 FIGURE 7 REAL POWER SIMULATION VALUES COMPARED TO THE METERING DATA GATHERED FROM THE
FIELD. ................................................................................................................................................... 18 FIGURE 8 REACTIVE POWER SIMULATION VALUES COMPARED TO FIELD GATHERED VALUES. ................... 19 FIGURE 9 COMPARING VOLTAGE VALUES BETWEEN THE OPENDSS MODEL AND THE ACTUAL READINGS
SHOWS THE MODEL NEEDS TO BE RE-EVALUATED. ............................................................................ 19 FIGURE 10 ONE-LINE DIAGRAM REPRESENTING A TYPICAL INSTALLATION SIDE FOR A BATTERY STORAGE
SYSTEM ................................................................................................................................................ 22 FIGURE 11: BASIC CONCEPT OF THE OPENDSS STORAGE ELEMENT. ............................................................ 24 FIGURE 12: STORAGE CONTROLLER CONCEPT .............................................................................................. 27 FIGURE 13 OVERVIEW OF SMART INVERTER FOR PVSYSTEM CONTROL WITHIN OPENDSS ......................... 28 FIGURE 14 FLOW CHART OF SMART INVERTER VOLTAGE REGULATOR PROCESS ........................................ 31 FIGURE 15 VISUAL REPRESENTATION OF THE FOUR OPERATING MODES OF THE SMART INVERTER. ......... 32 FIGURE 16 VOLTAGES OF THE DIFFERENT OPERATING MODES COMPARED TO THE BASE CASE OF THE
FEEDER ................................................................................................................................................. 33 FIGURE 17 STORAGE DISCHARGE RATES DURING EACH OPERATING MODE. ............................................... 34 FIGURE 18 COMPLETE CHARGE/DISCHARGE FOR ALL OPERATING MODES. ................................................ 34 FIGURE 19 SAMPLE OF VOTAGE, CURRENT, AND REAL POWER FOR ONE DAY PRIOR TO COMMSSIONING 35 FIGURE 20 METER DATA GATHERED AFTER THE COMMISSIONING OF THE 1MW STORAGE SYSTEM. ........ 36

1
Chapter 1
Introduction
1.1 Background
With the increasing concern of harmful emissions being released into our atmosphere,
there has been a focus on shifting away from our current dependency on fossil fuels and
searching for alternative, clean, and renewable forms of energy. This has led to a sharp
increase in the research and development of these sources over the past decade. Amongst
these sources, utilities have seen a rise in the amount of PV and wind generation being
added to their systems.
A contributing factor that has increased the rate of renewable energy sources has been
government incentives. Within the United States, government agencies at both the state
and federal levels have been offering homeowners and companies tax incentives to install
renewable generation. As an example, and according to the Energy Conservation and
Management Division (ECMD) website, the state of New Mexico offers the New Mexico
Solar Market Development Tax Credit, or Solar Tax Credit (STC).This tax credit will pay
up to 10% (up to $9,000) for a solar PV or solar thermal system. In addition to the STC,
the federal government will pay 30% in tax credits for a solar system. [1]
In addition to customer and developer incentives, government agencies are also
mandating utility companies to increase the percentage of renewable generation that are
interconnected to their system. In accordance with the New Mexico Public Regulation
Commission’s (NMPRC) Renewable Energy Act (REA), Chapter 62, Article 16 section 4
(Renewable Portfolio Standard), Public utility companies in New Mexico must meet
2
timelines of increasing percentages of renewable energy. According to the REA, no later
than January 1st 2020, utilities shall comprise of no less than 20 percent in renewable
energy of the total retail sales to New Mexico customers. [2]
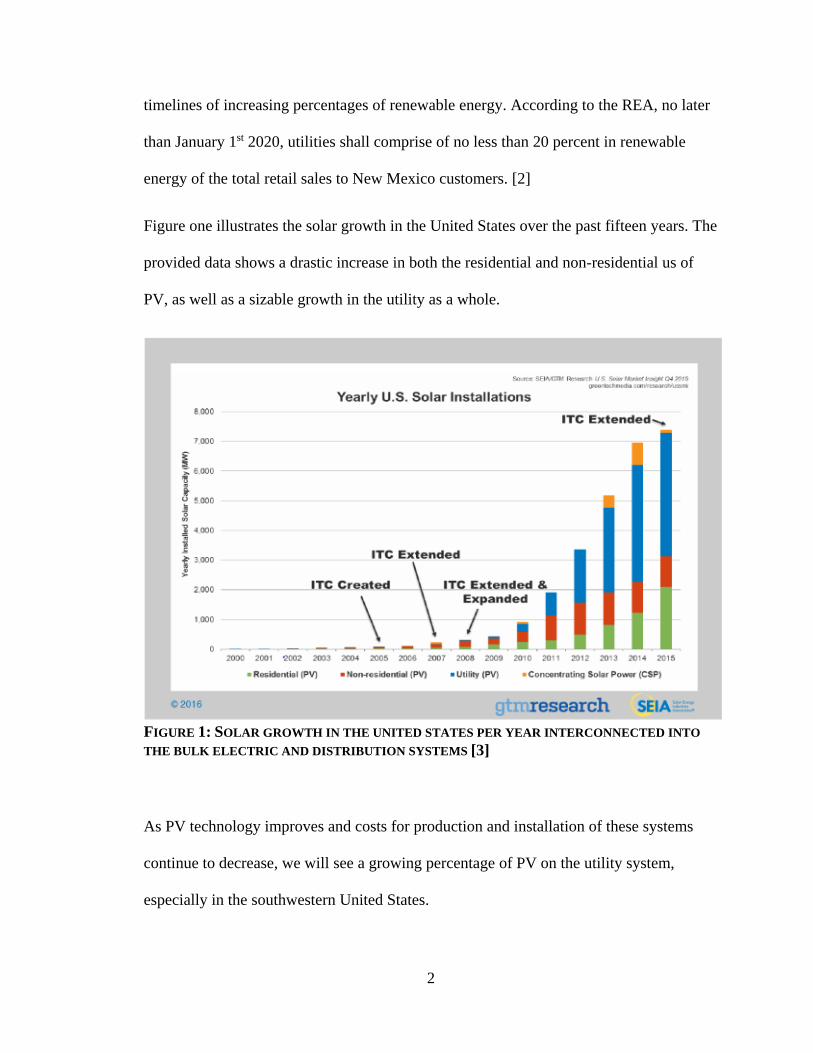
Figure one illustrates the solar growth in the United States over the past fifteen years. The
provided data shows a drastic increase in both the residential and non-residential us of
PV, as well as a sizable growth in the utility as a whole.
FIGURE 1: SOLAR GROWTH IN THE UNITED STATES PER YEAR INTERCONNECTED INTO
THE BULK ELECTRIC AND DISTRIBUTION SYSTEMS [3]
As PV technology improves and costs for production and installation of these systems
continue to decrease, we will see a growing percentage of PV on the utility system,
especially in the southwestern United States.

3
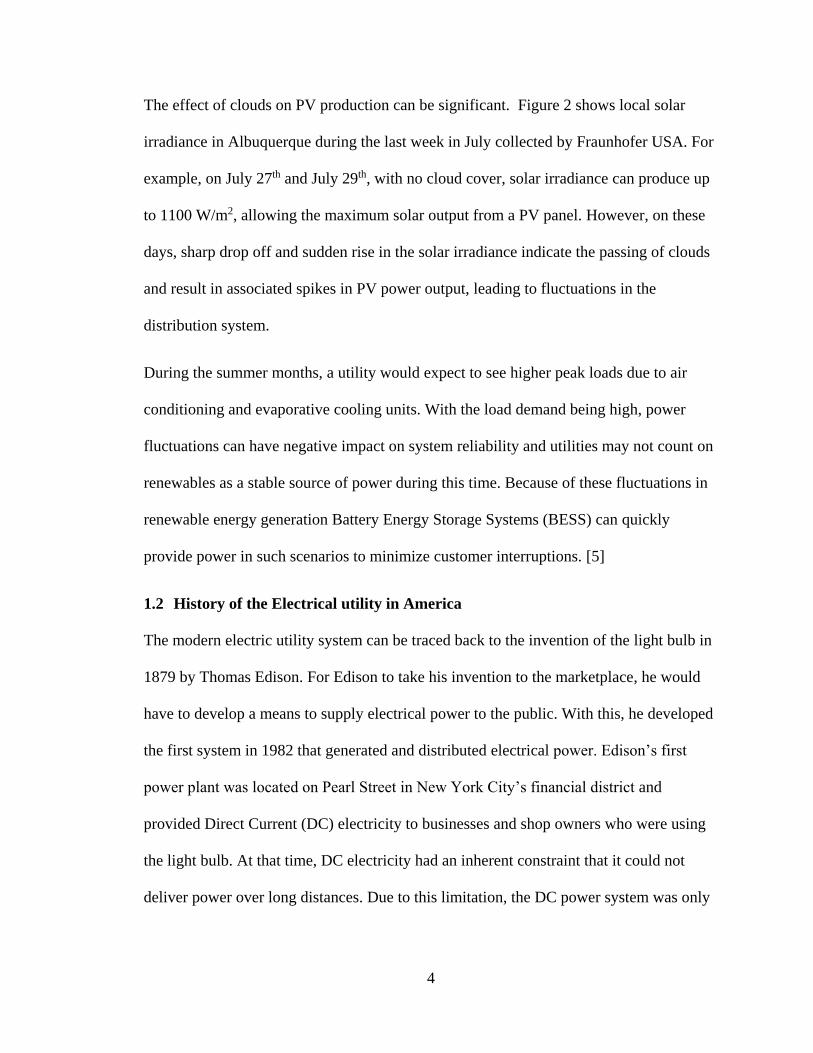
However, solar power’s inherent intermittency poses challenges in terms of power quality
and reliability. Weather conditions throughout the day can fluctuate, taking a PV
system’s output from nominal to negligible levels within a very short period of time.
These fluctuations can adversely affect the grid in the form of voltage sags unless steps
are taken to quickly counteract the change in the power generation. In small power
systems, system frequency can also be adversely affected [4].
FIGURE 2: MEASURED SOLAR IRRADIANCE DATA IN ALBUQUERQUE TAKEN DURING THE
LAST WEEK OF JULY [4]
4
The effect of clouds on PV production can be significant. Figure 2 shows local solar
irradiance in Albuquerque during the last week in July collected by Fraunhofer USA. For
example, on July 27th and July 29th, with no cloud cover, solar irradiance can produce up
to 1100 W/m2, allowing the maximum solar output from a PV panel. However, on these
days, sharp drop off and sudden rise in the solar irradiance indicate the passing of clouds
and result in associated spikes in PV power output, leading to fluctuations in the
distribution system.
During the summer months, a utility would expect to see higher peak loads due to air
conditioning and evaporative cooling units. With the load demand being high, power
fluctuations can have negative impact on system reliability and utilities may not count on
renewables as a stable source of power during this time. Because of these fluctuations in
renewable energy generation Battery Energy Storage Systems (BESS) can quickly
provide power in such scenarios to minimize customer interruptions. [5]
1.2 History of the Electrical utility in America
The modern electric utility system can be traced back to the invention of the light bulb in
1879 by Thomas Edison. For Edison to take his invention to the marketplace, he would
have to develop a means to supply electrical power to the public. With this, he developed
the first system in 1982 that generated and distributed electrical power. Edison’s first
power plant was located on Pearl Street in New York City’s financial district and
provided Direct Current (DC) electricity to businesses and shop owners who were using
the light bulb. At that time, DC electricity had an inherent constraint that it could not
deliver power over long distances. Due to this limitation, the DC power system was only

5
able to supply power to customers within a one mile radius and having multiple power
stations serving a city was common. [6]
The electrical power system in America was being designed and built around DC power.
While in Europe, several Alternating-Current (AC) Systems were being developed.
George Westinghouse, an American inventor and industrialist, imported a set of Gaulard-
Gibbs transformers and a Siemens AC generator in 1885. Along with the AC technology
from Europe, Westinghouse also purchased Nikola Tesla’s AC motor patents and hired
Tesla to help improve and modify the motor for use in his power system. The benefit to
the AC system over DC is its ability to deliver power over long distances.
With the emergence of the AC power system, Edison and other advocates of the DC
power system began a campaign to discredit the AC system and to try and convince the
public that AC was a dangerous power source which should not be used. In a show to the
public of the dangers of AC, Edison arranged for the first execution by electric chair in
1890 of the convicted murderer William Kemmler. The power supplied for the Electric
execution was a Westinghouse AC generator. However, all the efforts made against AC
would fail. In 1893 Westinghouse won the bid to supply the World’s Fair in Chicago with
power, leading to our current AC electrical distribution system we know today.
1.3 Current Utility Distribution overview
The current electrical distribution system can be separated into three sections: generation,
transmission and distribution. Power plants are typically located in remote areas and
generate power to feed a large area. The powers generated at these stations are at a lower
voltage level than what they are transmitted at. The power will normally be passed
through a step-up transformer and connect to the transmission system. The Bulk Electric
6
System (BES) is the name designated for the vast majority of the electric power system in
the United States. The BES consists of power generating plants, the majority of the high
voltage transmission lines, and any facility directly connected to the BES that is
responsible for maintaining system reliability and stability. The BES, for simplicity, can
be defined as any generator, transmission line, or facility that is rated for 100kV or above.
To deliver power to the customer, the power transmitted through the BES is then stepped
down to a lower voltage at substations. These substations can be noted as the point of
demarcation between transmission and distribution. From the substation, the power is
distributed throughout a smaller area for residential, commercial and industrial use. For
most cases, the distributed power will have another step down in voltage.
As an example, power delivered to the Albuquerque area comes from the San Juan
generating facility, located in the “Four Corners” where New Mexico, Colorado, Utah
and Arizona meet. The majority of the power delivered to Albuquerque is an amplitude
of 345kV and switching stations within Albuquerque convert the voltage to 115kV for
transmission within the city. These transmission lines have radial feeds to substations and
are stepped down once again to 12.47kV for distribution around the city. The voltage
level is stepped down one more time to 120/240/480V, depending on the customer’s
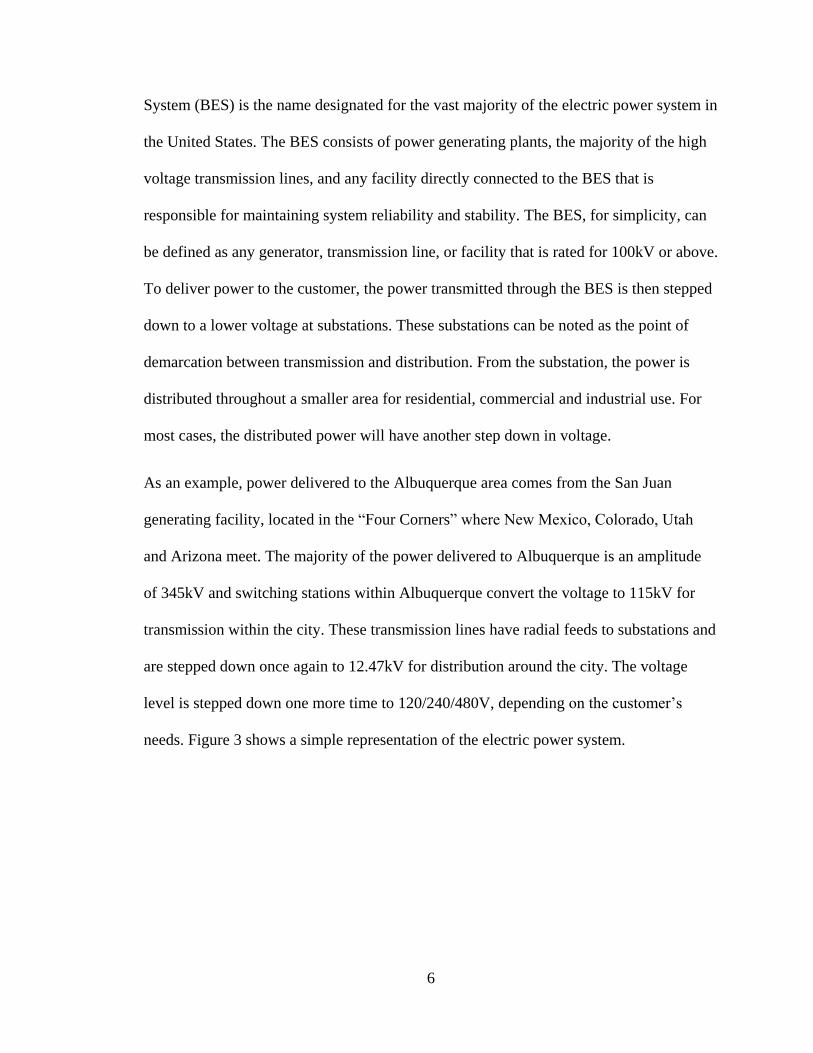
needs. Figure 3 shows a simple representation of the electric power system.
7
FIGURE 3: REPRESENTATION OF THE TRANSMISSION AND DISTRIBUTION OF ELECTRICAL
POWER THROUGH THE BES FROM THE GENERATING STATION TO THE CUSTOMER
Our current power grid is based on Alternating Current (AC) power. While AC proved to
be superior at delivering power over a larger distance, due to the impedance of
transmission lines, AC still experiences power losses. The conductor spacing, types, and
sizes determine the series impedance and shunt admittance of the transmission line.
Series impedance affects line-voltage drops, I2R losses and stability limits. Shunt
admittance, which is primarily capacitive, affects line-charging currents which injects
reactive power into the system. To help counteract these effects in the power system,
shunt reactance and capacitors are placed on the system and switched into service
whenever an over- or under-voltage occurs.
1.4 Objective
An electric power utility will install a 1MW/1MWh battery storage system to support an
existing 1 MW PV solar system. This study concerns the commissioning of this battery
energy storage system, to be located near the PV installation.

8
At the request of a utility, the University of New Mexico and the Electric Power Research
Institute (EPRI) use OpenDSS, an open source power distribution system simulator
developed by EPRI, to model the capabilities of the battery storage system to supply
voltage support. Other aspects of PV support have already been modeled in OpenDSS,
such as PV smoothing (to assist with the intermittences caused by passing clouds) and
peak shaving to reduce the load seen by the utilities generation. Voltage support,
however, is not currently modeled in OpenDSS, requires the development of a controller
outside of the OpenDSS power flow engine. These results will be used in comparison
with gathered field data after commissioning.

9
Chapter 2
Energy Storage
Electrical energy storage can be defined as the methods and techniques used for storing
generated electrical energy from a primary source in a form that may be used at a later
time [7]. Energy storage can be categorized based on the method or medium in which the
energy is being stored. A few of the types of storages systems used today are mechanical,
thermal, and electrochemical.
2.1 Mechanical Storage
There are a few different technologies being used today that can be categorized as
mechanical storage. Pumped hydro-electric storage uses off-peak power to pump large
amounts of water to an elevated reservoir. When the energy is needed, the pumped water
is then discharged through turbines which generate electricity that can be used for grid
support. As an advantage, pumped hydro-electric storage has the capability of storing
massive amounts of energy. However, this technology is limited to the environment in
which it can be placed. Even with the physical limitations of pump hydro-electric, nearly
all of the current U.S. storage capacity (20.38 GW of 21.39 total) is in the form of
pumped hydropower storage. In addition of pumped-hydro being limited to certain
geographical sites, there is also an initial high cost associated with it.
Flywheels are another form of mechanical storage. Flywheel technology takes advantage
of Newton’s first law of motion. Off-peak electrical power is used to speed up the
rotation of a heavy weight around an axel. The energy can be collected by using the
momentum of the rotating mass to generate electrical or mechanical power. To increase

10
the performance of the flywheel, the spinning weight is kept in a vacuum and uses low
friction bearings.
Compressed air technology also falls under the mechanical storage category. It uses off-
peak energy to pump air into a containment area such as an underground mine, then when
needed, the compressed air is released through a combustion engine to generate
electricity.
2.2 Thermal Storage
The process of thermal storage involves the heating of a substance which will retain its
temperature until the heat is needed. A well-known technology for thermal energy
storage is the use of hot water tanks. Another form of thermal storage is “molten salt.”
Molten salt is currently being used in Nevada. The heat stored in the molten salt is used
to produce steam to generate electricity when the demand for additional power is needed.
2.3 Electrochemical
Battery storage technology is part of the electrochemical storage classification. Battery
storage technology includes sodium sulfur (NaS), Lithium-ion (Li-ion), and Lead acid
(Pb-acid). Due to the flexibility of location placement, this makes an ideal storage choice
for solar energy.
With an established BES, battery storage systems provide greater flexibility for
integration. Since battery systems do not require a specific geography, but rather a
reasonable size of space to accommodate all equipment associated with the storage unit,
battery storage can be placed in areas that will better accommodate the utility company.
This makes it ideal for use with wind and solar sites that are located in rural areas.

11
Chapter 3
Simulation and Results
This chapter will cover the simulation efforts involved in modeling a 1MW battery
storage system. Discussed herein is the simulation of the battery storage system that was
performed using OpenDSS and MATLAB.
3.1.1 OpenDSS
OpenDSS is an open source distribution system simulator provided by the Electric Power
Research Institute (EPRI).The OpenDSS program is a comprehensive electrical system
simulation tool used for electrical utility distribution systems. OpenDSS is can perform
multiple types of studies for electrical distribution. These studies include distribution
planning analysis, general multi-phase AC circuit analysis, solar PV system simulations,
storage modeling, harmonic and inter-harmonic distortion analysis, and neutral-to-earth
voltage simulations.
OpenDSS varies from other power flow tools that are used in the utility industry.
Proprietary programs, such as CYME and Synergi, are widely used for distribution power
flow and protection studies and use a graphical interface for creating models and
performing power flow solutions. OpenDSS uses a text interface. Each piece of
equipment must be typed on an individual line in a text editor. This can be quite the task
when developing a full distribution feeder. With each line, or piece of equipment, that
must be added, the correct connection configuration must be verified. If a conductor is
not correctly connected to the appropriate node in a circuit, the solution will fail. Care
must be taken when organizing feeder equipment and connections. OpenDSS provides a

12
means of plotting a created circuit which depends on the information added in by the
user. Users must also create scripts for performing studies. This leads to creating a master
file to perform the study.
To gather power flow data, meters are also required to be added to the circuit. These
meters are passive devices that do not add any additional load loss or impedance to the
system, but are required for reading data from the circuit. Meters can be placed
throughout the feeder as the user desires.
OpenDSS also has several built-in solution modes. In this study; the Snapshot power
flow, Daily power flow and Yearly power flow solution modes were used. The Snapshot
mode is a one-time simulation that calculates the power flow throughout the circuit. The
daily and yearly solution modes can provide a system simulation over a period of time,
taking into account the load profile of the circuit being simulated. The Yearly power flow
solution mode was used in this study and will provide a better representation of the
interaction of the battery storage system on the utility’s distribution feeder.
While OpenDSS is the main power flow analysis tool for this study, there are features
that are not developed in the main simulation engine. For this, OpenDSS includes a COM
interface that allows for external software such as MATLAB, Visual Basic for
Applications (VBA) and C#, to run the main simulation engine. This feature allows the
user to design and execute custom solution modes and features in a language that is
familiar to them without having to manipulate the main structure of the OpenDSS engine
or create DLL’s. Through the COM interface, users can directly access the text-based
command interface to create and edit OpenDSS scripts using a third-party program. The
COM interface also allows users to extract results calculated by OpenDSS to be used in
13
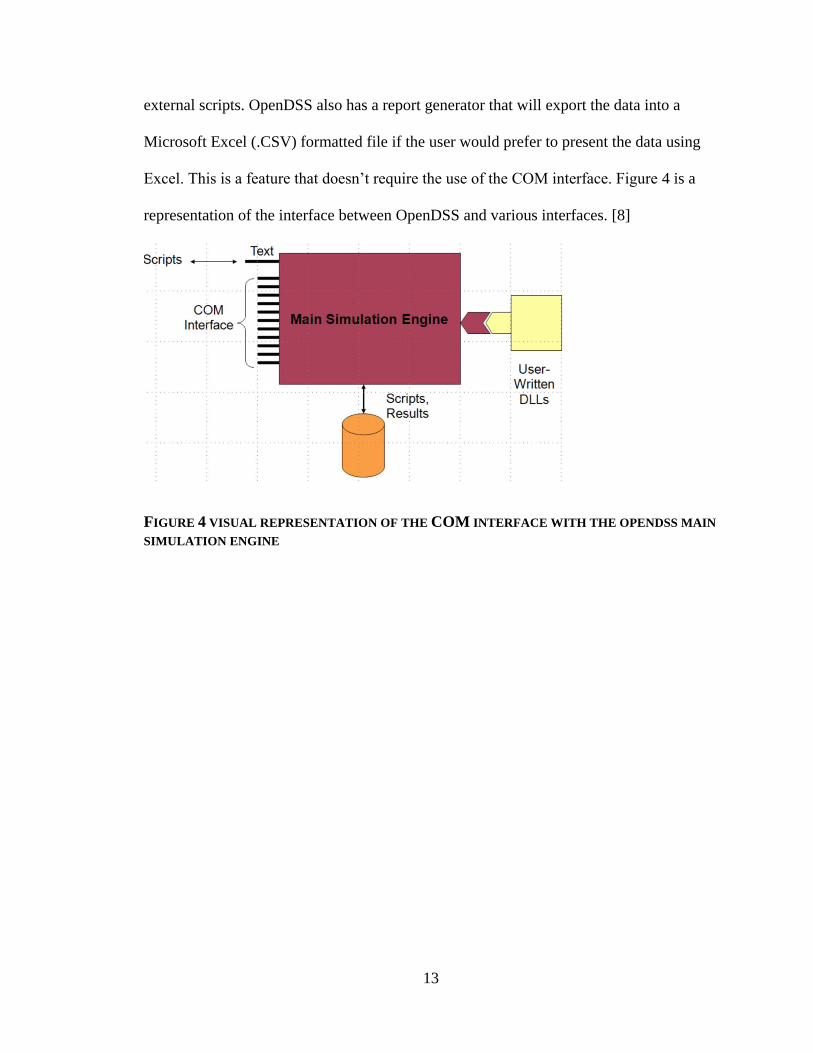
external scripts. OpenDSS also has a report generator that will export the data into a
Microsoft Excel (.CSV) formatted file if the user would prefer to present the data using
Excel. This is a feature that doesn’t require the use of the COM interface. Figure 4 is a
representation of the interface between OpenDSS and various interfaces. [8]
FIGURE 4 VISUAL REPRESENTATION OF THE COM INTERFACE WITH THE OPENDSS MAIN
SIMULATION ENGINE
14
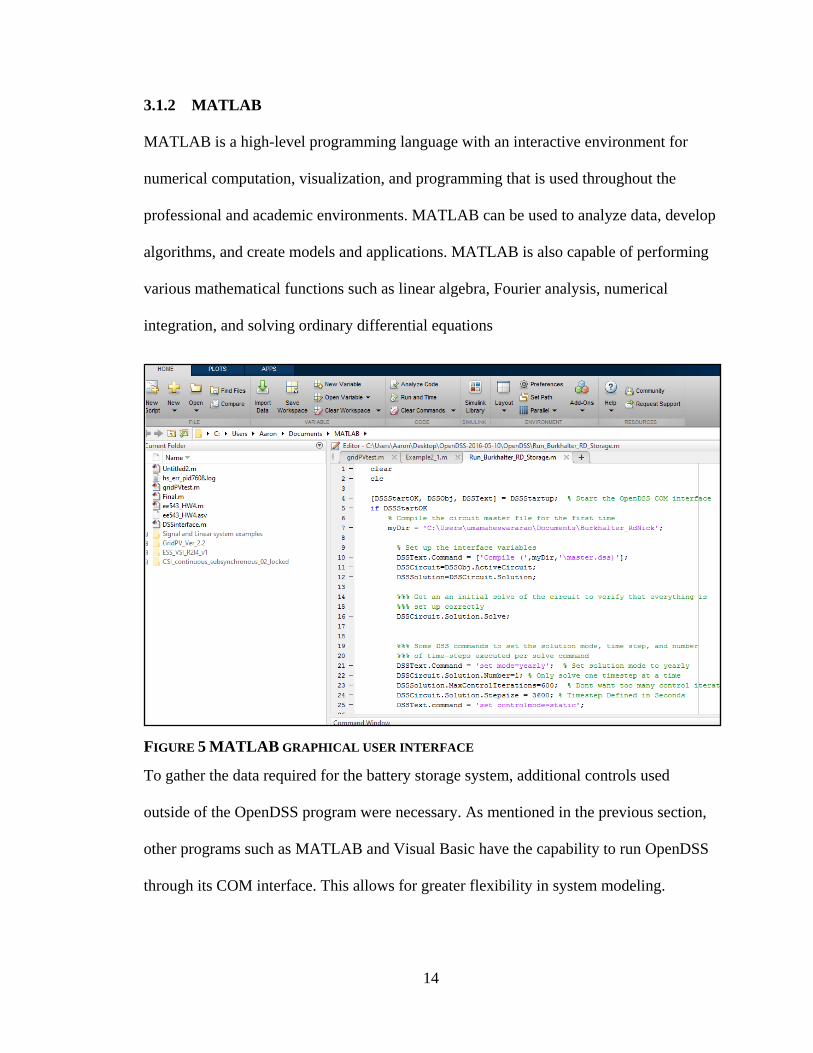
3.1.2 MATLAB
MATLAB is a high-level programming language with an interactive environment for
numerical computation, visualization, and programming that is used throughout the
professional and academic environments. MATLAB can be used to analyze data, develop
algorithms, and create models and applications. MATLAB is also capable of performing
various mathematical functions such as linear algebra, Fourier analysis, numerical
integration, and solving ordinary differential equations
FIGURE 5 MATLAB GRAPHICAL USER INTERFACE
To gather the data required for the battery storage system, additional controls used
outside of the OpenDSS program were necessary. As mentioned in the previous section,
other programs such as MATLAB and Visual Basic have the capability to run OpenDSS
through its COM interface. This allows for greater flexibility in system modeling.

15
Outlined in the OpenDSS user’s manual, there are several 3rd party software that are
compatible with the OpenDSS COM interface. MATLAB was chosen as the 3rd party
software for several different reasons; 1) MATLAB is a software that is widely used
throughout UNM’s Electrical Engineering curriculum in both course work and research,
and in the engineering industry, 2) Programming with MATLAB’s interactive
environment is easy to use, 3) MATLAB can handle complex numbers, making the
software compatible for use with the power utility industry, and 4) with experience in
programming in the MATLAB environment, time during the study can be focused on
developing the algorithm and learning to use the OpenDSS COM link, rather than
learning a new programming language.
3.1.3 Microsoft Excel
While MATLAB and OpenDSS are both capable of presenting and graphing the recorded
data, Excel was chosen for analyzing the data. OpenDSS is capable of exporting its data
into an Excel spreadsheet, we found this program would be the best method in analyzing
our results. Excel is more flexible in organizing the data exported from OpenDSS and can
easily be used to create graphs for visual representation of the data.
16
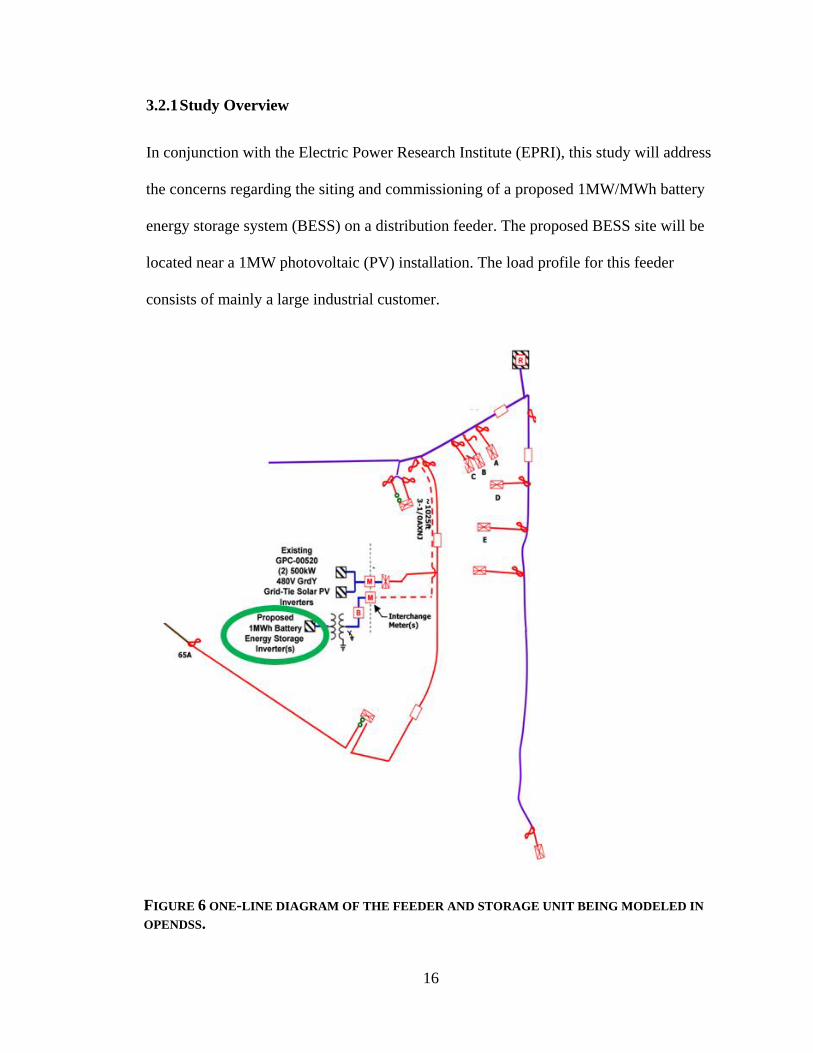
3.2.1 Study Overview
In conjunction with the Electric Power Research Institute (EPRI), this study will address
the concerns regarding the siting and commissioning of a proposed 1MW/MWh battery
energy storage system (BESS) on a distribution feeder. The proposed BESS site will be
located near a 1MW photovoltaic (PV) installation. The load profile for this feeder
consists of mainly a large industrial customer.
FIGURE 6 ONE-LINE DIAGRAM OF THE FEEDER AND STORAGE UNIT BEING MODELED IN
OPENDSS.

17
Figure 6 is the one-line diagram of the feeder that was used for the study. In this ,
transformers labeled A thru E provide the power to the large industrial load. This
customer’s load accounts for approximately90 percent of the total load on the feeder,
with the location of the load located near the substation and both the PV and battery
storage systems being further downstream.
The BESS is intended to provide shifting of the PV resource as well as voltage regulation
to the associated feeder.
3.2.2 Feeder Model Setup
OpenDSS is a text based interface that requires users to create models using scripts and a
text editor rather than a graphical interface that allows users to draw out and place
elements into a model. To create the model in OpenDSS, users must define an infinite
source, all of the elements that make up the model, including all of the element’s
parameters and terminal connections, and all nodes used for connecting all of the
elements within the modeled feeder.
Utilities commonly use proprietary software, such as CYME and Synergi, to perform
loading, power flow, and fault calculations. One of the benefits in using these programs is
the graphical user interface (GUI); the GUI allows the user to draw out the model while
automatically connected all of the elements when drawn correctly. The feeder provided
for this study was originally modeled in CYME. Rather than creating the entire feeder
model in OpenDSS, the original CYME model was translated into OpenDSS using an
automated system. Both voltages and fault currents from CYME and OpenDSS were
compared to validate the initial conversion process.

18
To provide more accurate modeling data to the utility, high resolution measurements of
voltage (V), real power (P), and reactive power (Q) were taken at the substation using a
DRANETZ power explorer PQ meter. With the utility-provided real time measurements,
taken at one second intervals, load-shapes were developed for a time series analysis. The
power flow model was validated with the measured data. The close match in both real
and reactive power indicated the feeder topology and loading characteristics are
accurately represented in the OpenDSS model.
FIGURE 7 REAL POWER SIMULATION VALUES COMPARED TO THE METERING DATA
GATHERED FROM THE FIELD.
19
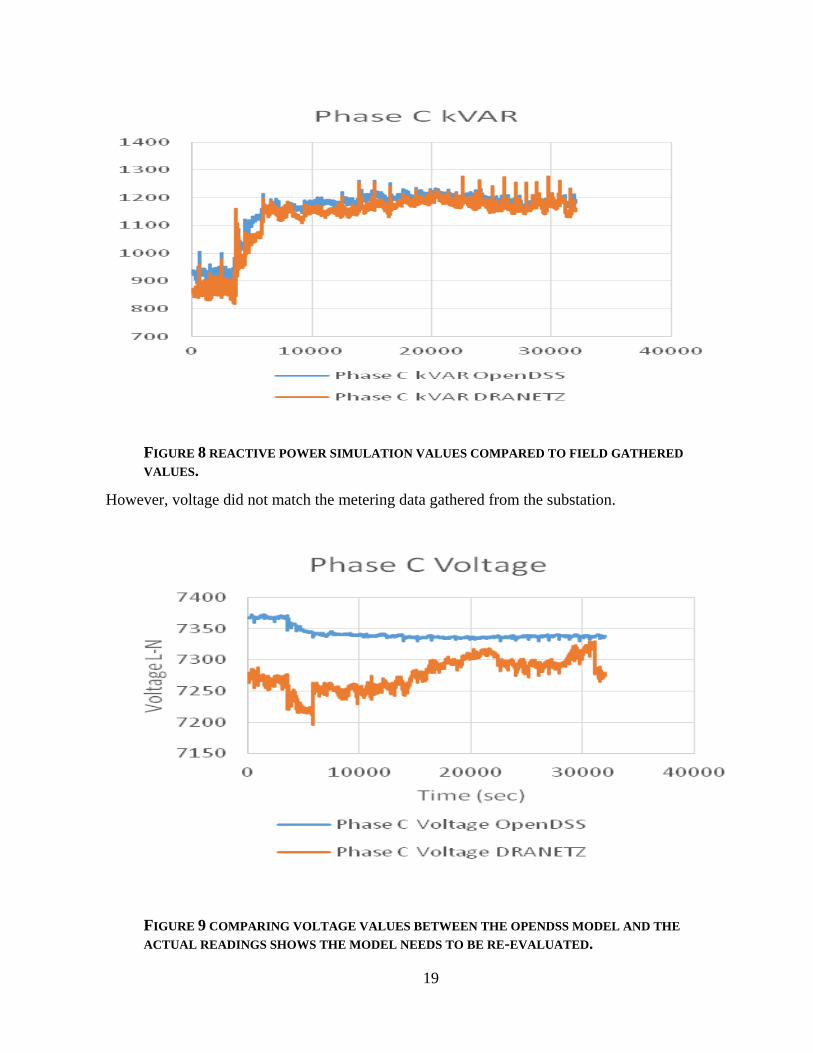
FIGURE 8 REACTIVE POWER SIMULATION VALUES COMPARED TO FIELD GATHERED
VALUES.
However, voltage did not match the metering data gathered from the substation.
FIGURE 9 COMPARING VOLTAGE VALUES BETWEEN THE OPENDSS MODEL AND THE
ACTUAL READINGS SHOWS THE MODEL NEEDS TO BE RE-EVALUATED.

20
Possible sources of error include parallel feeder loading or sub-transmission instability. To
correct for the voltage mismatch, a parallel feeder load was used to mimic the voltage
variability in the model while maintaining correct power flow.
1.2.2. Battery and Battery Energy Management System (BEMS)
For this study, ABB’s PCS100 ESS, grid connected interface for energy storage systems, was
used as the interfacing device for the1MWh/1MW battery storage to the utility distribution
feeder. The PCS100 ESS allows control of both real and reactive power based on the system
requirement. The converter behaves together with the power system like a traditional
synchronous machine. This is achieved through power electronic control since there are no large
spinning masses. Inertia is modelled with the system enabling it to deliver or to draw power
from the grid dependent on the rate of change of system frequency [9]. A demand controller,
Programmable Logic Control (PLC), can be used for overriding control for specific applications
and may contain both a battery management system and an application control. Other features
include high and low voltage ride through, black start option, and grid stabilization features,

21
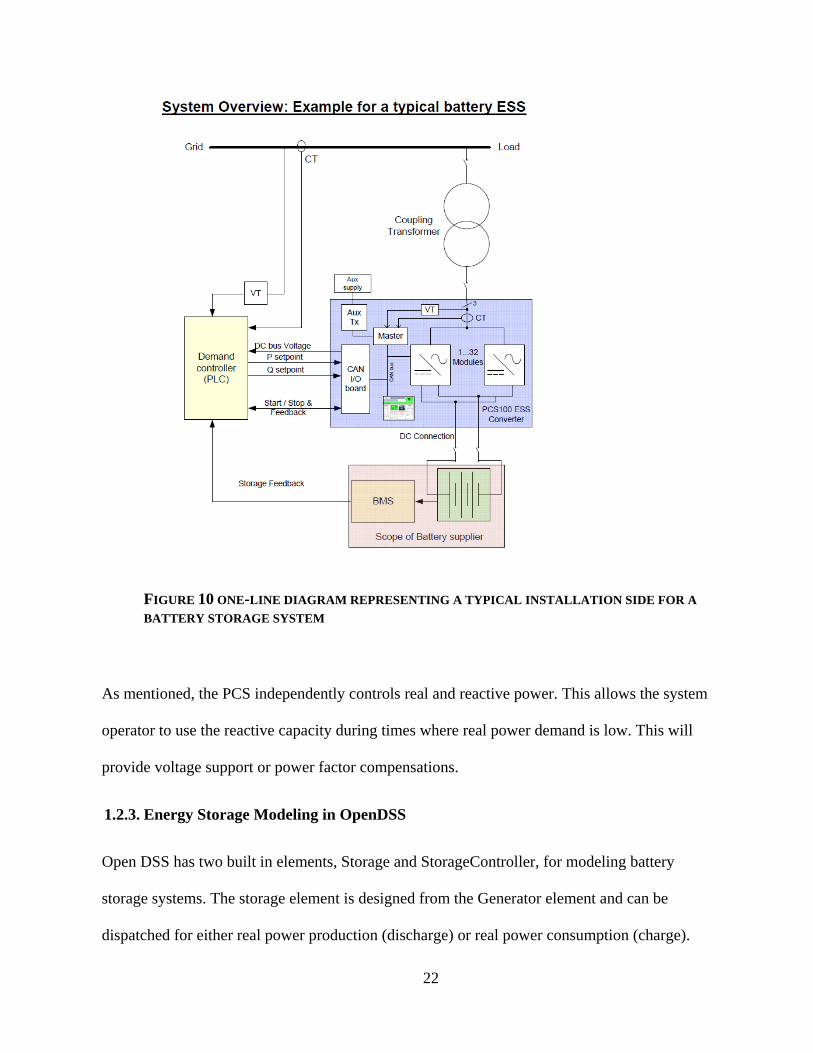
such as synthetic inertia and active damping. Figure 10 provides a system diagram of the
PCS100 interconnecting a BSS to the utility feeder.
The PCS100 provides the user with the ability to provide power system load leveling as well as
increase network stability and transmission capacity, and allows for multiple energy storage
devices to be coupled to the grid. . The PCS100 delivers grid compliance for renewable
generation systems and dampens disturbances and oscillations in critical system configurations.
The PCS100 can be configured to operate in various modes depending on the applications.
These operating modes include Current source and Voltage source modes.
The current source mode provides balanced three phase sinusoidal currents to the grid,
regardless of the grids conditions such as unbalance or harmonics. The current source mode also
provides rapid sub cycle response to power commands for highly dynamic system requirements.
Examples where current source mode would be used is together with wind parks were fast
support for the grid is required in the event of a low voltage event. [9]
The voltage source mode is a unique operating mode for a power electronic converter whereby
the converter mimics the behavior of regular rotary generators. For this mode, the PCS100
interfaces to the grid with a balanced three phase voltage. The benefit of this is a natural
correction of grid unbalance and harmonics by the ESS. Physical inertia is also modelled into
the PCS100 control system, providing a damping response to the frequency in the grid via the
storage connected to the PCS100 ESS. [9]
22
FIGURE 10 ONE-LINE DIAGRAM REPRESENTING A TYPICAL INSTALLATION SIDE FOR A
BATTERY STORAGE SYSTEM
As mentioned, the PCS independently controls real and reactive power. This allows the system
operator to use the reactive capacity during times where real power demand is low. This will
provide voltage support or power factor compensations.
1.2.3. Energy Storage Modeling in OpenDSS
Open DSS has two built in elements, Storage and StorageController, for modeling battery
storage systems. The storage element is designed from the Generator element and can be
dispatched for either real power production (discharge) or real power consumption (charge).
23
The amount of power produced or consumed will be within the rating and energy capacity of
the device. These values are set when creating the element. The Storage element can also
deliver or absorb reactive power (var) within the kVA rating of the inverter. A storage controller
can request a specific amount of kvar to provide to the system, as long as it’s within the defined
capacity of the Storage element. The storage element can either operate independently or be
controlled using the StorageController element.
The storage element can be used in various solution modes; Snapshot, Daily, Yearly, and
DutyCycle. During these modes, the storage element can be in one of the following operational
states: IDLING, CHARGING, or DISCHARGING. While in the Snapshot mode, the state of
the element can be selected prior to solving the circuit power flow. During the time-varying
modes, Daily, Yearly, and DutyCycle, the storage element will change states as the storage
controller requests dispatch. If there is available capacity within the controller, power will be
dispatched, real or reactive. However, power will not be available for discharge if the power
lever is lower than the specified reserve level. Also, the storage element will only take charge
when the kWhStored value is less than the kWhRated. The rate of discharge and charge for the
element can also be specified. [10]

24
FIGURE 11: BASIC CONCEPT OF THE OPENDSS STORAGE ELEMENT.
The element also includes losses to help with evaluating storage schemes. Different efficiencies
may be specified for charging and discharging. In addition, idling losses may also be specified.
These losses may represent various equipment within a storage unit, such as control systems,
heaters, coolers, and any other electrically powered piece of equipment required to maintain
constant temperatures and overall battery performance and health.
The Storage element in OpenDSS has five dispatch mode; DEFAULT, FOLLOW,
EXTERNAL, LOADLEVEL, and PRICE. There are also two triggers associated with these
modes: ChargeTrigger and DischargeTrigger. The values applied to these triggers will interact
differently depending on the mode selected.
Each mode has various operations for simulation. The DEFAULT mode dispatches power based
on a load curve and the set trigger points. During operation, when the load curve goes above the
specified DischargeTrigger, the storage device will deliver power until all of the stored energy
is depleted, or until the load drops below the DischargeTrigger. The same applies for the
ChargeTrigger. Once the load shape drops below the ChargeTrigger, the storage device will add

25
additional load by charging. Again, the charging mode will only be applicable until the Storage
element is fully charged. A TimedChargeTrigger is also available. This trigger can be set to
charge the Storage element at a specific time of day. This allows the unit to be at full capacity
for the next high load event. This is beneficial for planning next day events.
In FOLLOW mode, the output of the storage element follows the loadshape multiplier. The
element will continue to provide power until the storage element is depleted. During a positive
multiplier of load the element will discharge. Likewise, when the loadshape multiplier is
negative, the storage element will begin to charge. Both discharge and charge cycles will be
limited to the capacity of the unit. For example, if the loadshape is positive and the storage
element is depleted beyond the reserve limit, the storage element will be placed into an idling
state. Similarly, if the unit reaches full capacity during the negative portion of the loadshape the
Storage element will no longer be capable of absorbing power. While this dispatch mode is
helpful for delivering power during rises in load, if the loadshape multiplier does not go below
zero, the storage unit will not be able to absorb power (charge) and will not be able to produce
energy when needed. [10]
LOADLEVEL and PRICE are both dispatch modes that can be set with a fixed value for
discharging the storage unit. LOADLEVEL requires a daily or yearly loadshape file and a load
multiplier value that is set as a global value. The same applies to the PRICE dispatch mode,
with both Price signal and Price curve being a global define. [10]
EXTERNAL dispatch mode allows for the controller element to take control of the storage
device. When a controller is used, the controller will provide the storage element with the state
of which the controller will need to be in. As well as having a controller element, the COM

26
module can also be used to control the modes of the storage element, allowing for additional
study functionality. [10]
The StorageController element may be used in conjunction with the Storage element. Its main
purpose is to provide greater versatility when utilizing energy storage. The StorageController
can be used to control a single storage element with more dispatch options or a fleet of storage
elements. There are various limitations of the placement of a storage facility location:
accessibility, right of way, land limitations, and cost may play a role when selecting a location
along a feeder’s path. Given these reasons, a storage element may not be placed in a location
where it can monitor load behavior and produce support at the desired location. The
StorageController element is one solution that has been developed to manage these types of
situations. An example of this type of setup is the use of a storage element located near a large
load customer to help reduce the load seen by the feeder during large or unexpected spikes. The
controller can monitor the power being supplied at the feeder to determine when the feeder
would require support and set the state of the storage element accordingly. With this concept,
the controller’s capacity for support may increase with a larger array of storage devices located
throughout the feeder.

27
FIGURE 12: STORAGE CONTROLLER CONCEPT
Built in dispatch modes include Peakshave, Follow, Support, Loadshape, and Time; as well as
Loadshape and Time for charging modes. Again, with the controller being in control of the
storage devices, these will be the modes available for modeling use. For Peakshave, follow, and
support modes, a deadband controller concept is used, where a target values is set and a band
around the target value is specified. For example, a KWTarget may be set with a percentage
variance from the target is given, two (2) percent by default. While Volt/VAR support has been
developed into the OpenDSS software using s smart inverter module, this module is only
available with the PV model and not currently available in the current StorageController
element. [10]
28
For the purpose of this study, we need to be able to provide voltage control. This will require
an additional controller. The created controller will need mimic the inverter controller already
created for PV systems.
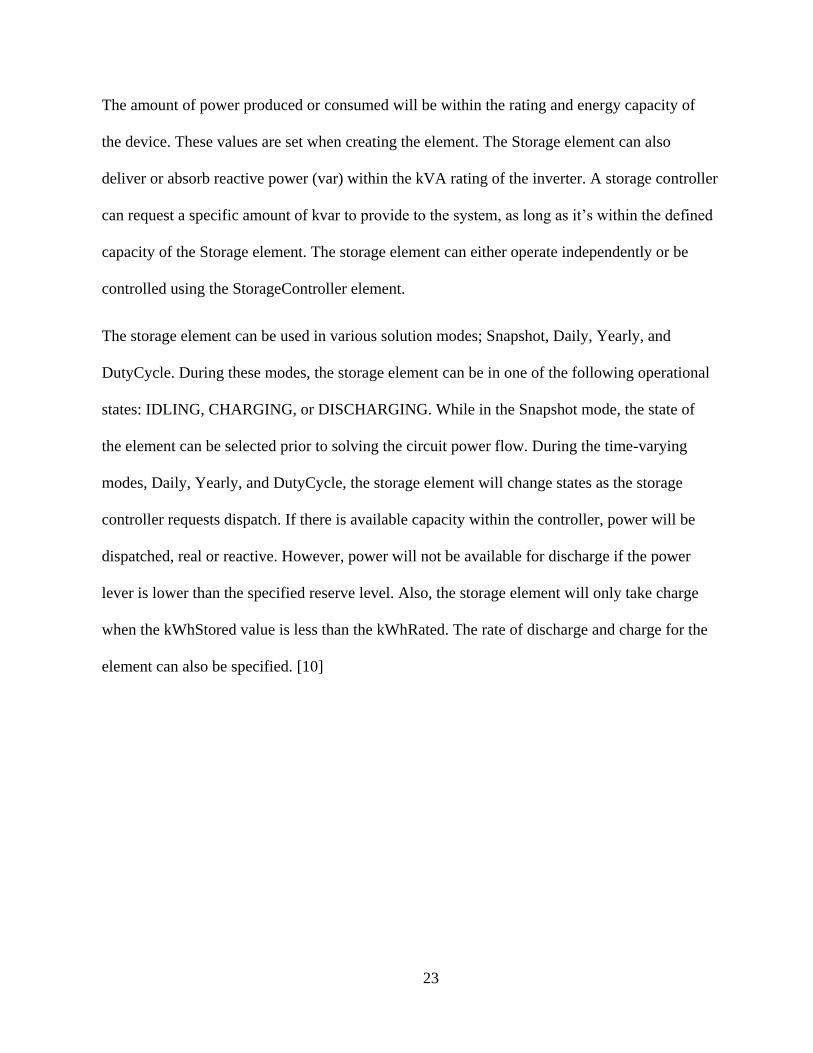
The Current inverter control element works with the PVSystem objects and can operate in the
following modes: VOLTVAR, VOLTWATT, and DYNAMICCREACURR. In VOLTVAR
(default) mode, the controller will attempt to dispatch the vars according to one or two volt-var
curves, depending on the local terminal voltage, present active power output, and the
capabilities of the PVSystem. VOLTWATT operates in the same manner, utilizing local
terminal voltage and the PVSystem capabilities to dispatch watts according to a defined volt-
var curve. [11]
FIGURE 13 OVERVIEW OF SMART INVERTER FOR PVSYSTEM CONTROL WITHIN
OPENDSS
For the purpose of this study, the development of the PCS controller was modelled after the
smart inverter control used for OpenDSS’s PVsystems. As mentioned, using OpenDSS’s COM
module as an interface into the OpenDSS software, we developed a control system within

29
MatLab that mimics the voltage support seen with the smart inverter, but focused on
controlling the state of the Storage element. Creating the Storage element smart inverter using
the MATLAB software allows for easier and faster integration with the OpenDSS software
while having the flexibility to debug the new code before incorporating the code into the
OpenDSS source code. All Circuit definitions and parameters were created using a text editor
following the correct format required for OpenDSS’s power flow calculations. A master file
was created that established the main circuit parameters, to include voltage bases, sequence
impedances, per unit, and base KV. The master file also contained the redirect commend.
These commands were used to bring in, line parameters, line geometries, loads, regulators,
capacitors, loadshapes, and monitors. The master file will also generate the map in powerbase
for the feeder. [8]
1.2.4. The MATLAB Smart inverter with Voltage control program
There were two separate MATLAB programs created for this study. The first program, titled
DSSStartup, establishes communications with the OpenDSS software. This program was
created from the example program provided in the OpenDSS example documents. The second
and main program houses the smart inverter with voltage control algorithm. On the initial run
of the main program, the DSSStartup program is called to establish communications through
the COM module interface. The DSSStartup passes back confirmation to the main program of
successful communication. After successful communications, the program then uses the COM
interface commands to compile the OpenDSS master file and set the parameters for the power
flow study. The solution setup was established with MATLAB using the com interface
commands. For the purposes of this study, the yearly solution mode was used. Since we are
controlling the Storage element’s mode based on voltage at a given instantaneous value, we set

30
the number of solutions to one so that only one time step is solved for each time the solve
command is given. The control mode of the power flow was set to static. For voltage control,
the algorithm is designed for PCS “clamping.” This mode provides a deadband around a
specified voltage, which can set based on user preference. With the voltage stabilization of this
feeder the deadband was set to +/- .005 percent of 7.25 KV. This establishes the upper
boundary at 7.28 kV and the lower boundary at 7.22kV.
During the control loop, an initial “solve” is performed. This initial power flow solution will
set the bases for the system and allows for initial system voltages to be read as a comparison.
During each iteration of the control loop, a “solve” command is performed and results are
feedback to the control loop for voltage evaluation. The loop advances to the next iteration
after a check on voltage is complete. During the first two iterations, the smart inverter will
determine if the Storage element will remain in the idling state or be set to the
discharging/charging state. The state will be change as long as the storage capacity is capable
of providing the needed support.
After these iterations, the controller will evaluate the current voltage and the previous state of
the storage element to determine if the controller should place the storage element back into the
idling state. The conditions of this check are the current iteration voltage and the state of the
controller. If the monitored line voltage is within the bandwidth, and as long as the controller
isn’t already in the idling state, the controller will evaluate if the storage element should be
placed in idle. A NoControl mode solution is run to suppress the time step from advancing.
This allows the controller to determine of placing the controller into an idle state will cause the
voltage to convert back to a condition of being outside the bandwidth. If the voltage appears to
be out of bandwidth with the storage element in idle, the controller will keep the storage

31
element in its current state for an additional iteration of the control loop. This process will take
place until the voltage has returned to a safe level within the bandwidth.
FIGURE 14 FLOW CHART OF SMART INVERTER VOLTAGE REGULATOR PROCESS
Once the controller checks for voltages within bandwidth, the controller will check to see if the
storage element is needed for voltage support. Again, this check will require the current
voltage input and the status of the storage element. If voltage is seen to be above the threshold,
the capacity is available, and the device wasn’t already in the charging state, the storage
element will be dispatched as a load and be placed into the charging state. The same evaluation
will continue through the subsequent iterations and the voltage will be evaluated to see if it has
dropped below the threshold. If this is the case and the Storage element isn’t already in the
32
discharging state, the Storage element will be dispatched and its state set to discharging. All the
results from the study were exported to a .CSV file and compared using Microsoft excel.
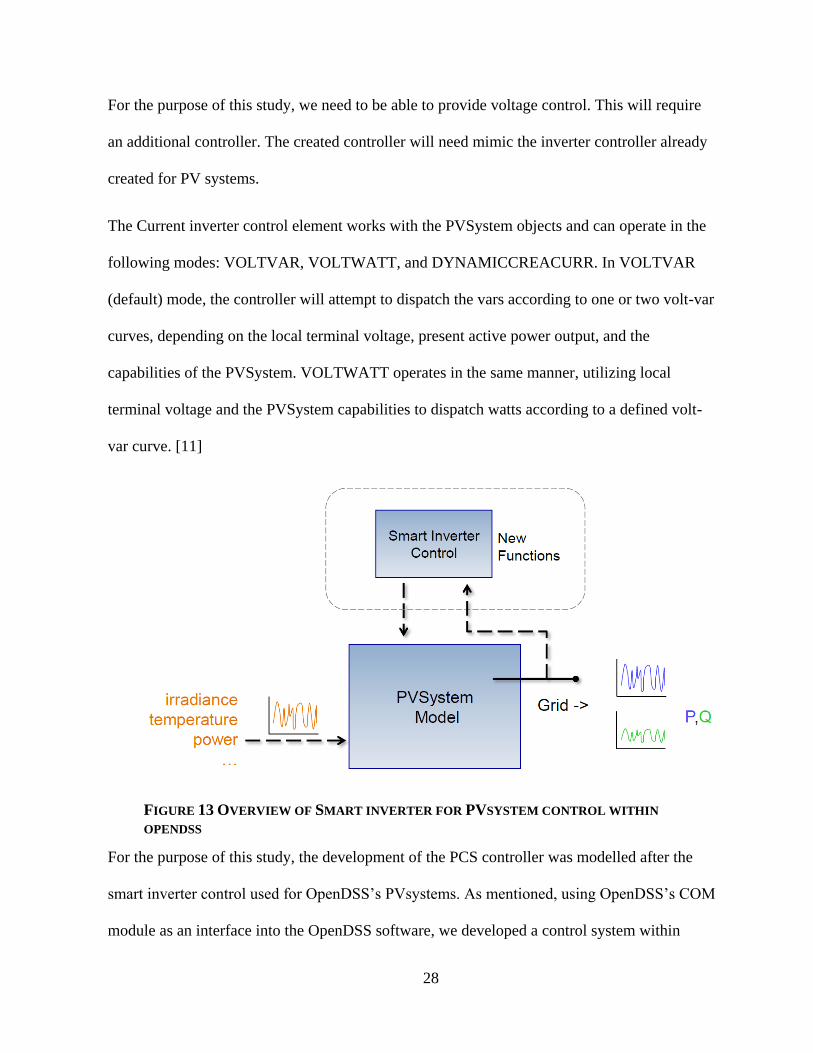
During the process of voltage adjustment, there were 4 different operating modes that were
utilized for voltage “clamping.” The first mode was Volt/Watt control. The real power is
determined by the voltage feedback and the reactive component is not actively adjusted. The
second mode is Constant VAR: the real power is determined by the voltage feedback and the
reactive component is set to a constant value. VAR support will be inductive when the storage
element is charging and capacitive when it is discharging. Third mode is Volt/VAR. In this
mode, the real power is determined by the voltage feedback and the reactive component is
determined with a Volt/VAR curve. As with the constant VAR mode, the storage element is
inductive during charge and capacitive while discharging. The fourth mode is constant power
factor. The real power is determined by voltage feedback and the ratio of real power to reactive
is constant, and will be inductive during charge and capacitive when discharging.
FIGURE 15 VISUAL REPRESENTATION OF THE FOUR OPERATING MODES OF THE SMART
INVERTER.
33
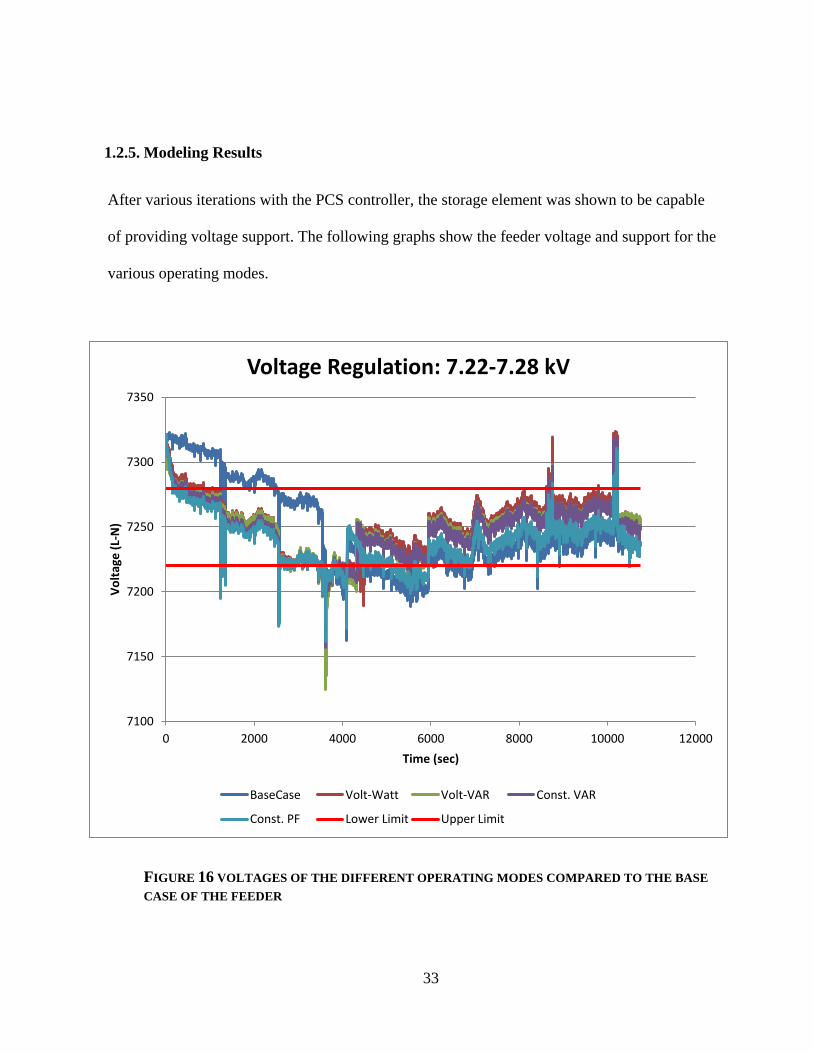
1.2.5. Modeling Results
After various iterations with the PCS controller, the storage element was shown to be capable
of providing voltage support. The following graphs show the feeder voltage and support for the
various operating modes.
FIGURE 16 VOLTAGES OF THE DIFFERENT OPERATING MODES COMPARED TO THE BASE
CASE OF THE FEEDER
7100
7150
7200
7250
7300
7350
0 2000 4000 6000 8000 10000 12000
Vo
ltag
e (
L-N
)
Time (sec)
Voltage Regulation: 7.22-7.28 kV
BaseCase Volt-Watt Volt-VAR Const. VAR
Const. PF Lower Limit Upper Limit

34
FIGURE 17 STORAGE DISCHARGE RATES DURING EACH OPERATING MODE.
FIGURE 18 COMPLETE CHARGE/DISCHARGE FOR ALL OPERATING MODES.
The results show that the storage device is capable to provide voltage support. This also
indicate that the size of the storage device and inverter will determine the extent of voltage
regulation capabilities.

35
1.2.6. Commissioning Results
Prior to the commissioning of the Storage facility, a DRANETZ power explorer PQ meter was
installed at the substations primary to monitor PQ attributes. The values were logged at one
second intervals. This information was collected to analyze the baseline characteristics of the
feeder. The following plots below show line voltages, currents, real and reactive power,
voltage, and current unbalances. These values were taken for five days leading up to the
commissioning.
FIGURE 19 SAMPLE OF VOTAGE, CURRENT, AND REAL POWER FOR ONE DAY PRIOR TO
COMMSSIONING

36
The same data was collected after the commissioning of the site.
FIGURE 20 METER DATA GATHERED AFTER THE COMMISSIONING OF THE 1MW STORAGE
SYSTEM.
The storage element is able to provide real and reactive power to provide support for voltage control.
As shown in this study, support will only be supplied for the duration of the capacity of the storage
unit. When the voltage drops below the threshold, the storage device is dispatched and constant
power is applied to bring the voltage back into the threshold. This process repeats until the capacity
of the storage device is reached. With this we can see that the size of the storage unit will have a
significant role in its ability to provide voltage support.

37
1 Chapter 4
Conclusion
As demonstrated through both simulation and field verification, battery storages systems have the
capability to provide additional utility reliability with voltage support. With the storage system
having the ability to provide voltage support, the capacity in which they can provide this support is
limited on the size of the battery storage and the inverter’s specifications. Due to lack of operational
experience of energy storage systems, additional research will be required to assist utilities with
planning and analysis to understand the best practices and utilization of large-scale storage systems.
The development of this MATLAB program, along with the OpenDSS model, can assist utilities with
sizing storage systems to best suit their needs for both PV generation stabilization and feeder
reliability.

38
References
[1] "Energy Conservation and Management Division," [Online]. Available:
http://www.emnrd.state.nm.us/ECMD/. [Accessed 24, Dec. 2016].
[2] "New Mexico Public Regulation Commission," [Online]. Available:
http://www.nmprc.state.nm.us/utilities/renewable-energy-act/04.html. [Accessed
25, Dec. 2016].
[3] "Solar Energy Industries Association," [Online]. Available:
http://www.seia.org/research-resources/solar-industry-data. [Accessed 25, Dec.
2016].
[4] "Fraunhofer USA," [Online]. Available: http://www.cse.fraunhofer.org/pv-
technology/weather-data. [Accessed 26, Dec. 2016].
[5] M. S. D. C. H. G. M. G. Cody H., "Battery Energy Storage for Enabling Integration
of Distributed Soalr Power Generation," IEEE Transactions on Smart Grid, vol. 3,
no. 2, pp. 850-857, 2012.
[6] "Amarican History," [Online]. Available:
http://americanhistory.si.edu/powering/past/h1main.htm. [Accessed 16, Jan. 2017].
[7] "An Introduction To the Energy Storage and Stationary Battery Committee," IEEE
Power & Energy Society, [Online]. Available: https://www.ieee-
pes.org/images/files/pdf/Energy_Storage_and_Stationary_Battery_2015-0802.pdf.
[Accessed 09 10 2017].
[8] R. C. Dugan, "The Open Distribution System Simulator (OpenDSS) Reference
Guide," 2013.
[9] ABB, "PCS100 ESS Grid Connected Interface for ENergy Storage Systems
100kVA to 10MVA Technical Catalogue".
[10] "OpenDSS STORAGE Element and STORAGECONTROLLER Element," 2011.
[11] E. P. M. J. Smith, "Modeling High-Penetration PV for Distribution Interconnection
Studies," 2013.
[12] Reno, Matthew J; Quiroz, Jimmy E; Lavrova, Olga; Byrne, Raymond H;
“Evaluation of communication requirements for voltage regulation control
with advanced inverters”, North American Power Symposium (NAPS), 2016, 6-
Jan 2016,IEEE

39
[13] Jones, C Birk; Martínez-Ramón, Manel; Smith, Ryan; Carmignani, Craig K;
Lavrova, Olga; Robinson, Charles; Stein, Joshua S; “Automatic fault classification
of photovoltaic strings based on an in situ IV characterization system and a
Gaussian process algorithm”, Photovoltaic Specialists Conference (PVSC), 2016
IEEE 43rd, 1708-1713,2016, IEEE
[14] Lockridge, Britny P; Lavrova, Olga; Hobbs, William B; “Comparison of
electroluminescence image capture methods”, Photovoltaic Specialists Conference
(PVSC), 2016 IEEE 43rd, 0876-0879, 2016, IEEE
[15] Byrne, Raymond H; Concepcion, Ricky J; Neely, Jason; Wilches-Bernal, Felipe;
Elliott, Ryan T; Lavrova, Olga; Quiroz, Jimmy E; “Small signal stability of the
western North American power grid with high penetrations of renewable
generation”, Photovoltaic Specialists Conference (PVSC), 2016 IEEE 43rd, 1784-
1789, 2016,IEEE
[16] Arellano, B., Sena, S., Abdollahy, S., Lavrova, O., Stratton, S., & Hawkins, J.
(2013, June). Analysis of electric vehicle impacts in New Mexico urban utility
distribution infrastructure. In Transportation Electrification Conference and Expo
(ITEC), 2013 IEEE (pp. 1-6). IEEE.
[17] Lavrova, Olga, Quiroz, Jimmy, Flicker, Jack, Gooding Renee, “Updated
evaluation of shock hazards to firefighters working in proximity of PV systems”,
In Photovoltaic Specialists Conference (PVSC), 2017 IEEE 44th, IEEE
[18] Jones, C. B., King, B.H., Stein, J. S., Lavrova, O., “Quantify PV Module
Degradation based on Model Coefficients Extracted from an Embedded Data
Acquisition Devices”, In Photovoltaic Specialists Conference (PVSC), 2017 IEEE
44th
[19] Hamzavy, Babak, Grieco, William, Fields, Brian, Libby, Cara, Hobbs, William,
Lavrova, Olga, Jones C. Birk, “Study of PV module degradation rate prediction
through correlation of field-aged and accelerated-aged module degradation
data”,In Photovoltaic Specialists Conference (PVSC), 2017 IEEE 44th, IEEE
[20] Behzadirad, Mahmoud, Olga Lavrova, and Tito Busani. "Demonstration of 99%
capacity retention in Li/S batteries with a porous hollow carbon cap nanofiber–
graphene structure through a semi-empirical capacity fading model." Journal of
Materials Chemistry A 4.20 (2016): 7830-7840.

40
[21] Chen, Tairen, Olga Lavrova, and Jane Lehr. "The optimal planning and dynamic
operation of distributed generation method based on modified multiobjective
optimization in power distribution system." Green Energy and Systems Conference
(IGESC), 2015 IEEE. IEEE, 2015.
[22] Korotkevich, A. O., Galochkina, Z. S., Lavrova, O., & Coutsias, E. A. (2015). On
the comparison of energy sources: Feasibility of radio frequency and ambient light
harvesting. Renewable Energy, 81, 804-807.
[23] Abdollahy, Shahin, Olga Lavrova, and Andrea Mammoli. "Coordinated
collaboration between heterogeneous distributed energy resources." Journal of
Solar Energy 2014 (2014).
[24] Korotkevich, A. O., Galochkina, Z. S., Lavrova, O., & Coutsias, E. A. (2015). On
the comparison of energy sources: Feasibility of radio frequency and ambient light
harvesting. Renewable Energy, 81, 804-807.
[25] Abdollahy, S., Lavrova, O., Heine, N., Mammoli, A., & Poroseva, S. (2013,
August). Integrating heterogeneous distributed energy resources to manage
intermittent power at low cost. In Technologies for Sustainability (SusTech), 2013
1st IEEE Conference on (pp. 223-229). IEEE.
[26] West, J., Imani, S., Lavrova, O., Cavanaugh, W., Ju, J., Pupuhi, K., ... & Zarkesh-
Ha, P. (2014, June). Reconfigurable power management using novel
monolithically integrated CMOS-on-PV switch. In Photovoltaic Specialist
Conference (PVSC), 2014 IEEE 40th (pp. 1389-1392). IEEE.
[27] Lavrova, O., Matthies, G., Mitkova, T., Polevikov, V., & Tobiska, L. (2003).
Finite element methods for coupled problems in ferrohydrodynamics.
In Challenges in Scientific Computing-CISC 2002 (pp. 160-183). Springer, Berlin,
Heidelberg.
[28] Kim, B., & Lavrova, O. (2013, May). Optimal power flow and energy-sharing
among multi-agent smart buildings in the smart grid. In Energytech, 2013
IEEE (pp. 1-5). IEEE.
[29] Lavrova, O., Matthies, G., & Tobiska, L. (2008). Numerical study of soliton-like
surface configurations on a magnetic fluid layer in the Rosensweig
instability. Communications in Nonlinear Science and Numerical
Simulation, 13(7), 1302-1310.

41
[30] Lavrova, O. A., & Blumenthal, D. J. (2000). Accelerated aging studies of multi-
section tunable GCSR lasers for dense WDM applications. Journal of lightwave
technology, 18(12), 2196-2199.
[31] Mammoli, A., Jones, C. B., Barsun, H., Dreisigmeyer, D., Goddard, G., &
Lavrova, O. (2012, May). Distributed control strategies for high-penetration
commercial-building-scale thermal storage. In Transmission and Distribution
Conference and Exposition (T&D), 2012 IEEE PES (pp. 1-7). IEEE.
[32] Li, N. Y., Collins, D., Jatar, S., Lavrova, O., Helms, C., Luo, W., ... & Wang, C.
(2007, February). Design and manufacturing of 10G GenX VCSELs at Emcore.
In Vertical-Cavity Surface-Emitting Lasers XI (Vol. 6484, p. 648402).
International Society for Optics and Photonics.
[33] Kim, B., & Lavrova, O. (2013, April). Two hierarchy (home and local) smart grid
optimization by using demand response scheduling. In Innovative Smart Grid
Technologies Latin America (ISGT LA), 2013 IEEE PES Conference On (pp. 1-8).
IEEE.
[34] Lavrova, O., Cheng, F., Abdollahy, S., Mammoli, A., Willard, S., Arellano, B., &
Van Zeyl, C. (2011, October). Modeling of pv plus storage for public service
company of new mexico’s prosperity energy storage project. In In2011 Electrical
Energy Storage Applications & Technologies Conference (EESAT), San Diego,
CA.
[35] Jones, C. B., King, B.H., Stein, J. S., Lavrova, O., “Quantify PV Module
Degradation based on Model Coefficients Extracted from an Embedded Data
Acquisition Devices”, In Photovoltaic Specialists Conference (PVSC), 2017 IEEE
44th
[36] Babak T. Hamzavy, William J. Grieco, Brian J. Fields, Cara S. Libby, William B.
Hobbs, Olga Lavrova, and C. Birk Jones, “Study of PV module degradation rate
prediction through correlation of field-aged and accelerated-aged module
degradation data ” In Photovoltaic Specialists Conference (PVSC), 2017 IEEE
44th