Embed Size (px)
Citation preview

RadTherm Battery ModelingUGM 2011- Antti Jussila
22Confidential
AgendaAgenda
Battery Design Issues Physical Description Model Description
Approach Implementation
Model Inputs Development Status
3
RadTherm Battery SimulationRadTherm Battery Simulation
3
1D System Tools Concept 1D Component Models Long Transients solved quickly
RadTherm Simple 1D, 2D or Detailed 3D Geometry Radiation, Conduction, Convection Long Transient Rapid Trade Studies
CFD Highly Detailed 3D Geometry Complex Flow Steady State or Short Transient
Optimization
Geo
met
ryD
etai
l
Simulated Time
1D SystemTools
Meshing & FEA
CFD RadTherm
CAE Coupling & Integration1D Tools – AMESim, Matlab, …CFD – Fluent, PowerFLOW, STAR-CCM+, …Optimization – Isight, modeFRONTIER, …Meshing – ANSA, Hypermesh, PowerDELTA,FEA – ABAQUS, NASTRAN
Confidential
44Confidential
Thermal IssuesThermal Issues
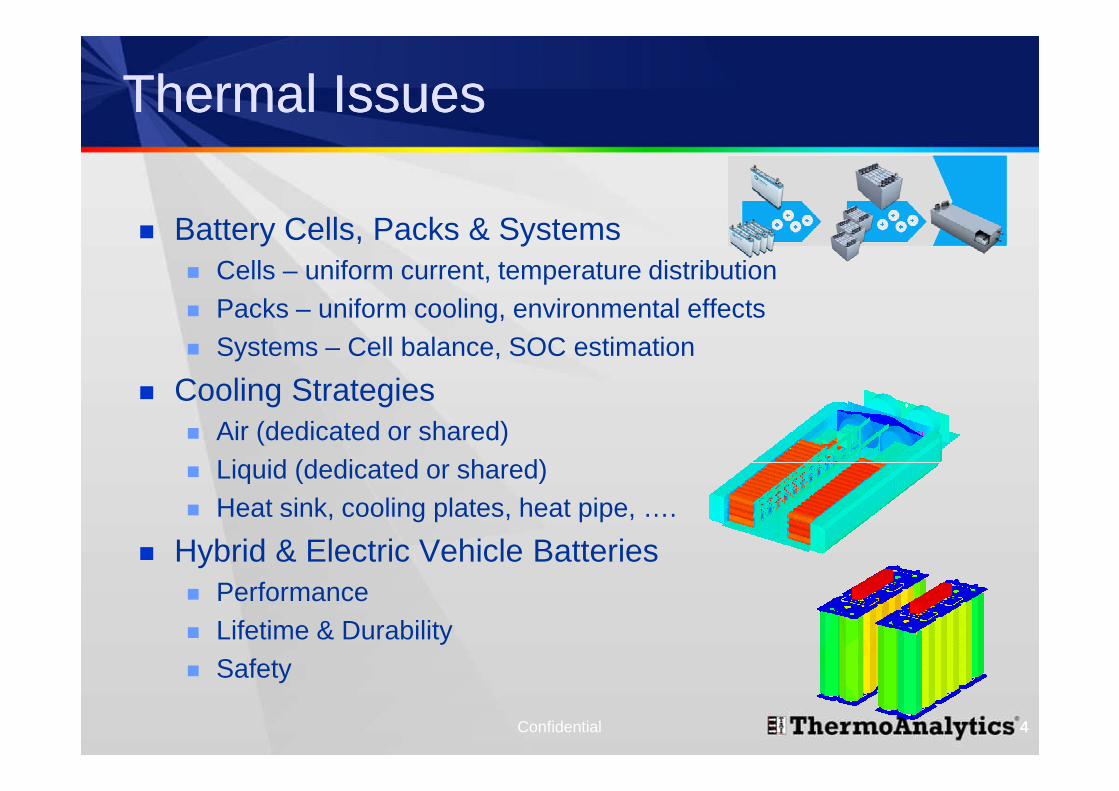
Battery Cells, Packs & Systems Cells – uniform current, temperature distribution Packs – uniform cooling, environmental effects Systems – Cell balance, SOC estimation
Cooling Strategies Air (dedicated or shared) Liquid (dedicated or shared) Heat sink, cooling plates, heat pipe, ….
Hybrid & Electric Vehicle Batteries Performance Lifetime & Durability Safety
55Confidential
Thermal ScenariosThermal Scenarios
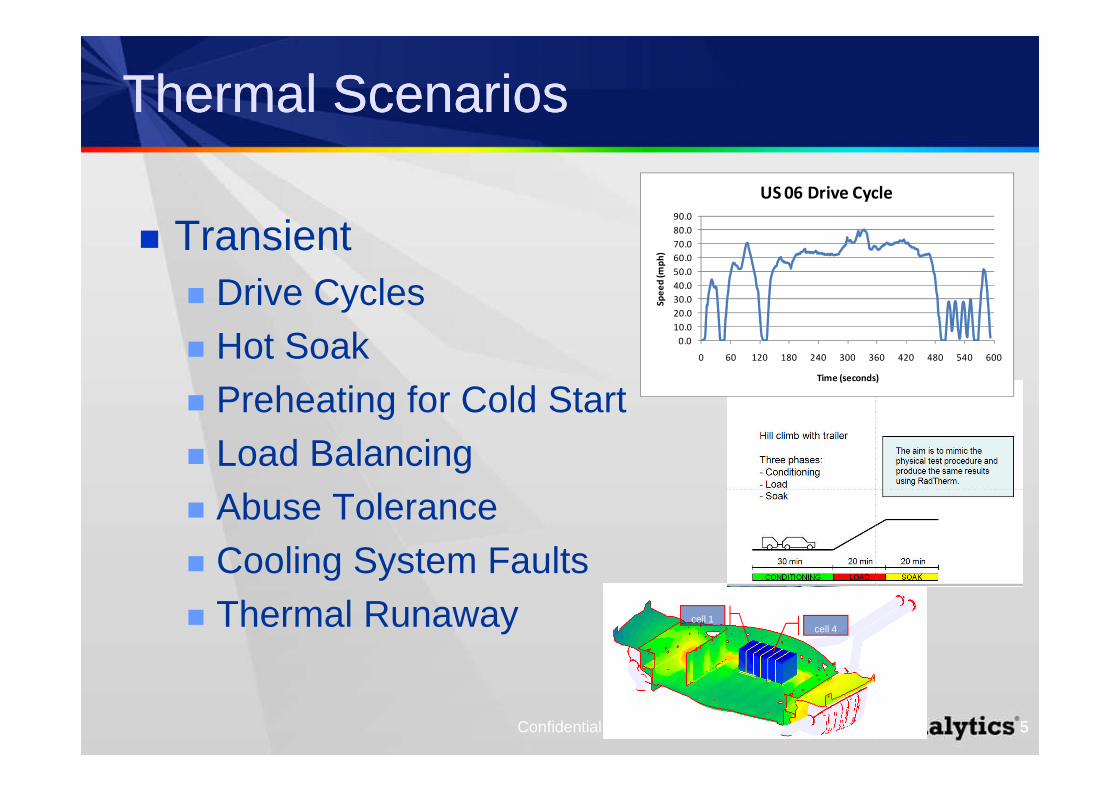
Transient Drive Cycles Hot Soak Preheating for Cold Start Load Balancing Abuse Tolerance Cooling System Faults Thermal Runaway t = 120
min.cell 1cell 4
0.010.020.030.040.050.060.070.080.090.0
0 60 120 180 240 300 360 420 480 540 600
Spee
d(m
ph)
Time (seconds)
US 06 Drive Cycle
66
Battery Modeling DescriptionBattery Modeling Description
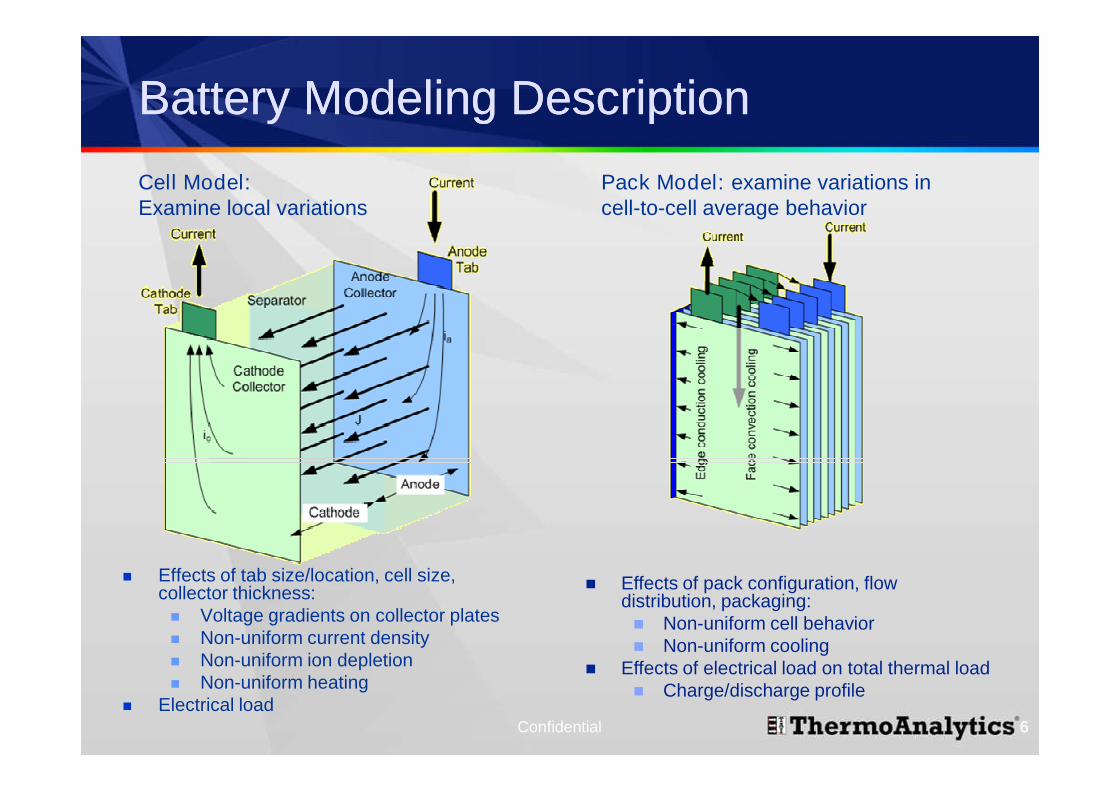
Effects of tab size/location, cell size,collector thickness: Voltage gradients on collector plates Non-uniform current density Non-uniform ion depletion Non-uniform heating
Electrical load
Effects of pack configuration, flowdistribution, packaging: Non-uniform cell behavior Non-uniform cooling
Effects of electrical load on total thermal load Charge/discharge profile
Cell Model:Examine local variations
Pack Model: examine variations incell-to-cell average behavior
Confidential
7
idischarge
7
Battery Model Implemented in RadThermBattery Model Implemented in RadTherm
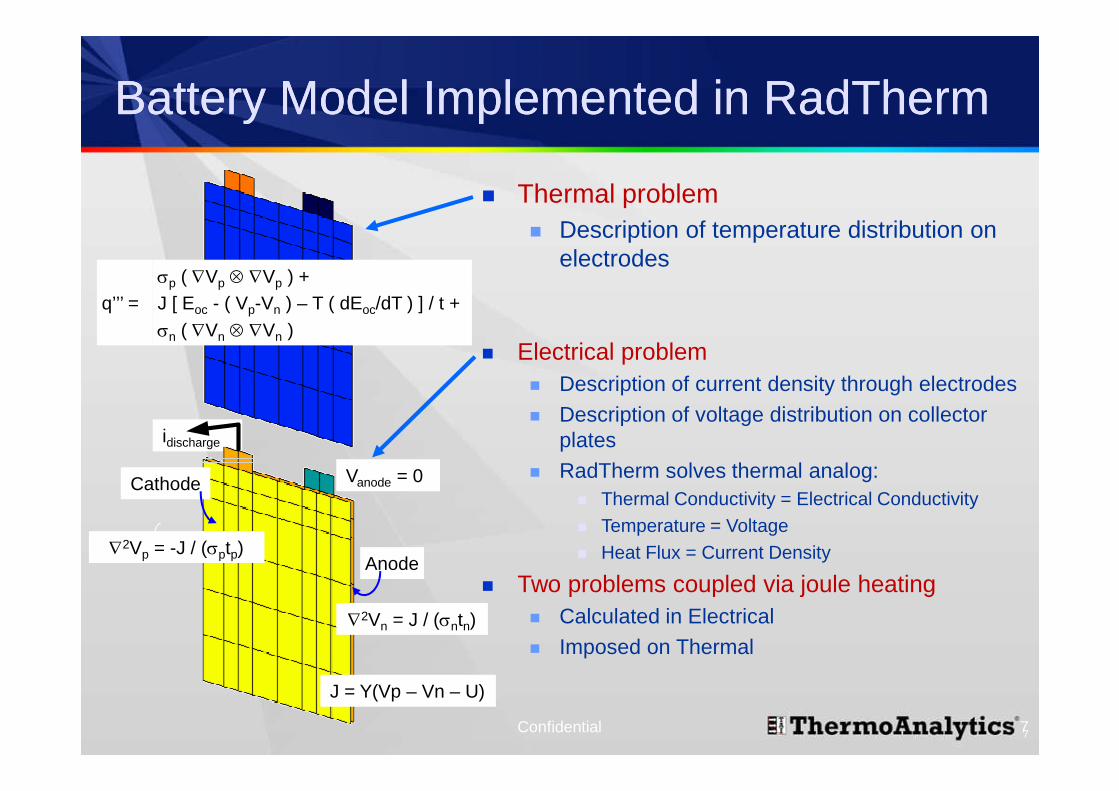
Thermal problem Description of temperature distribution on
electrodes
Confidential
Cathode
Anode
Vanode = 0
2Vn = J / (sntn)
J = Y(Vp – Vn – U)
2Vp = -J / (sptp)
sp ( Vp Vp ) +J [ Eoc - ( Vp-Vn ) – T ( dEoc/dT ) ] / t +sn ( Vn Vn )
q’’’ =
Electrical problem Description of current density through electrodes Description of voltage distribution on collector
plates RadTherm solves thermal analog:
Thermal Conductivity = Electrical Conductivity Temperature = Voltage Heat Flux = Current Density
Two problems coupled via joule heating Calculated in Electrical Imposed on Thermal
88
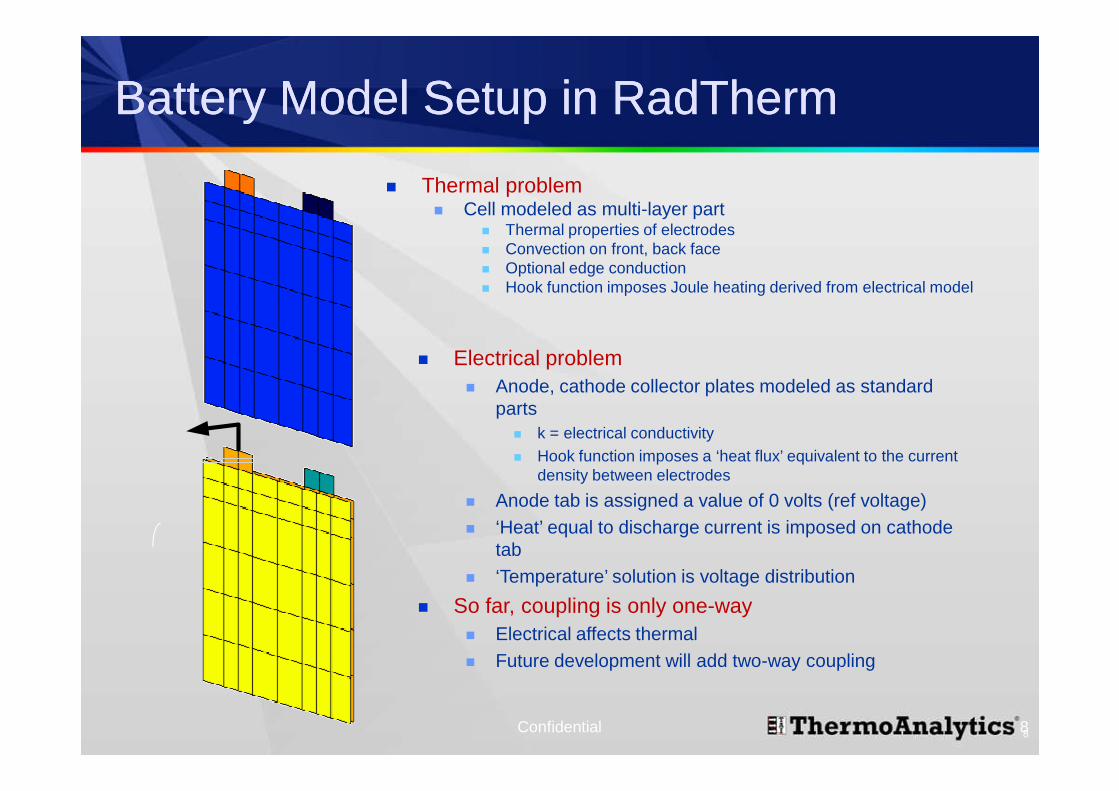
Battery Model Setup in RadThermBattery Model Setup in RadTherm
Thermal problem Cell modeled as multi-layer part
Thermal properties of electrodes Convection on front, back face Optional edge conduction Hook function imposes Joule heating derived from electrical model
Confidential
Electrical problem Anode, cathode collector plates modeled as standard
parts k = electrical conductivity Hook function imposes a ‘heat flux’ equivalent to the current
density between electrodes
Anode tab is assigned a value of 0 volts (ref voltage) ‘Heat’ equal to discharge current is imposed on cathode
tab ‘Temperature’ solution is voltage distribution
So far, coupling is only one-way Electrical affects thermal Future development will add two-way coupling
99
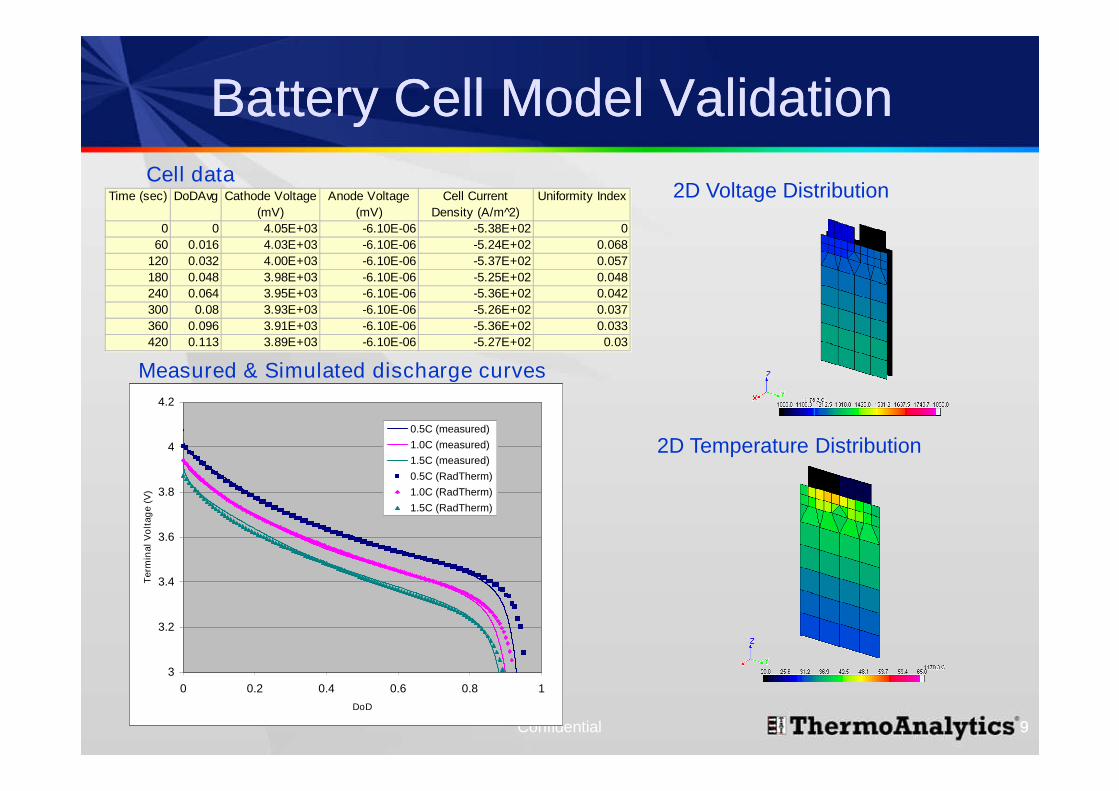
Battery Cell Model ValidationBattery Cell Model ValidationCell data
Measured & Simulated discharge curves
2D Voltage Distribution
2D Temperature Distribution
Time (sec) DoDAvg Cathode Voltage(mV)
Anode Voltage(mV)
Cell CurrentDensity (A/m^2)
Uniformity Index
0 0 4.05E+03 -6.10E-06 -5.38E+02 060 0.016 4.03E+03 -6.10E-06 -5.24E+02 0.068
120 0.032 4.00E+03 -6.10E-06 -5.37E+02 0.057180 0.048 3.98E+03 -6.10E-06 -5.25E+02 0.048240 0.064 3.95E+03 -6.10E-06 -5.36E+02 0.042300 0.08 3.93E+03 -6.10E-06 -5.26E+02 0.037360 0.096 3.91E+03 -6.10E-06 -5.36E+02 0.033420 0.113 3.89E+03 -6.10E-06 -5.27E+02 0.03
Confidential
3
3.2
3.4
3.6
3.8
4
4.2
0 0.2 0.4 0.6 0.8 1DoD
Ter
min
alV
olt
age
(V)
0.5C (measured)1.0C (measured)1.5C (measured)
3
3.2
3.4
3.6
3.8
4
4.2
0 0.2 0.4 0.6 0.8 1
DoD
Ter
min
alV
olt
age
(V)
0.5C (measured)1.0C (measured)1.5C (measured)0.5C (RadTherm)1.0C (RadTherm)1.5C (RadTherm)
1010
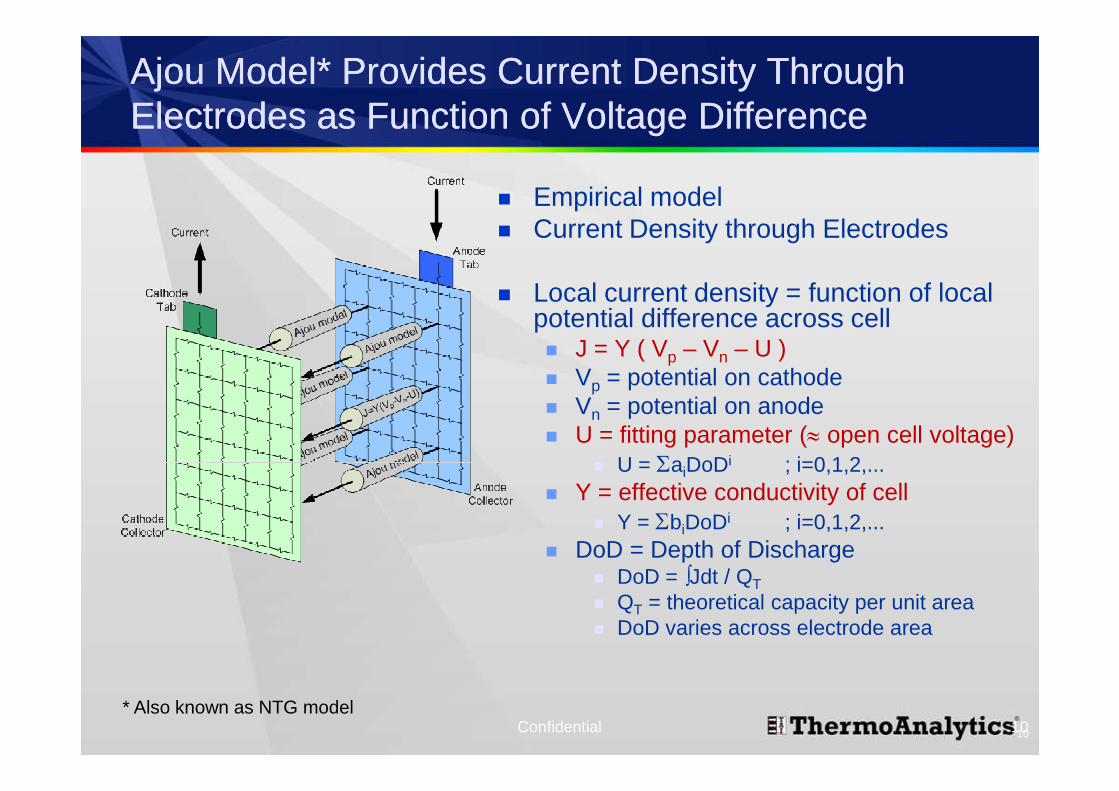
Ajou Model* Provides Current Density ThroughAjou Model* Provides Current Density ThroughElectrodes as Function of Voltage DifferenceElectrodes as Function of Voltage Difference
Empirical model Current Density through Electrodes
Local current density = function of localpotential difference across cell J = Y ( Vp – Vn – U ) Vp = potential on cathode Vn = potential on anode U = fitting parameter ( open cell voltage)
U = aiDoDi ; i=0,1,2,... Y = effective conductivity of cell
Y = biDoDi ; i=0,1,2,... DoD = Depth of Discharge
DoD = Jdt / QT QT = theoretical capacity per unit area DoD varies across electrode area
Confidential* Also known as NTG model
1111
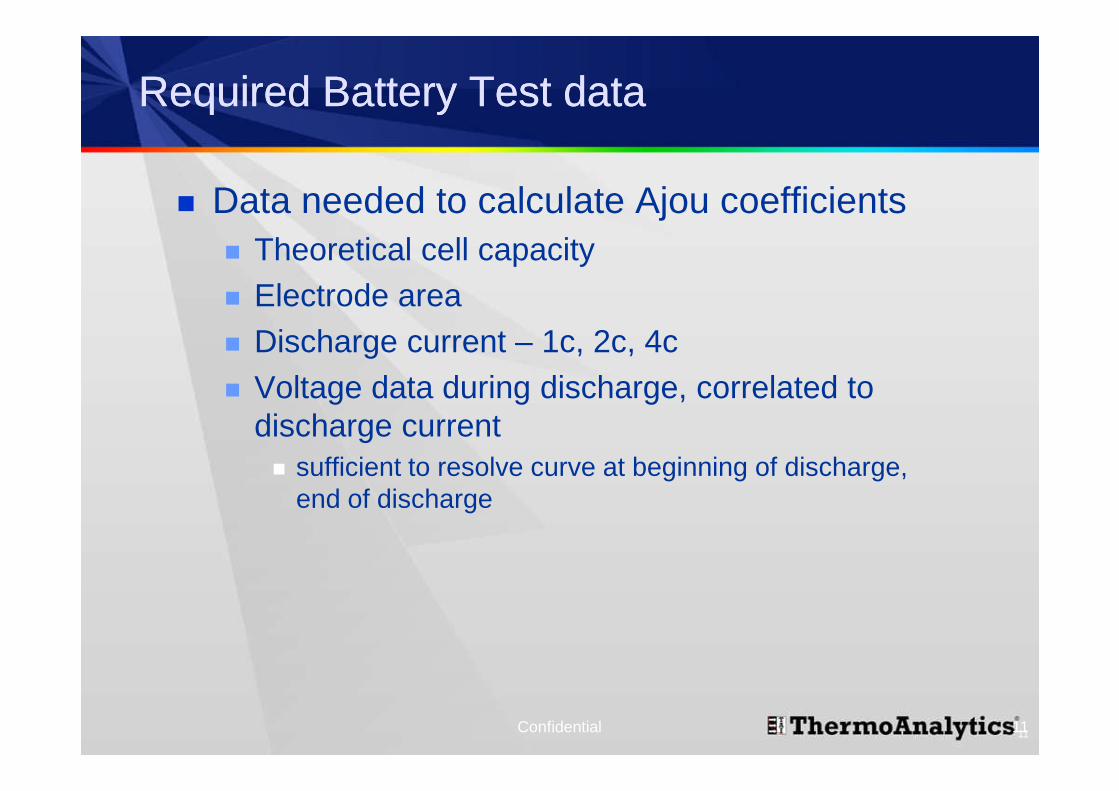
Required Battery Test dataRequired Battery Test data
Data needed to calculate Ajou coefficients Theoretical cell capacity Electrode area Discharge current – 1c, 2c, 4c Voltage data during discharge, correlated to
discharge current sufficient to resolve curve at beginning of discharge,
end of discharge
Confidential
1212
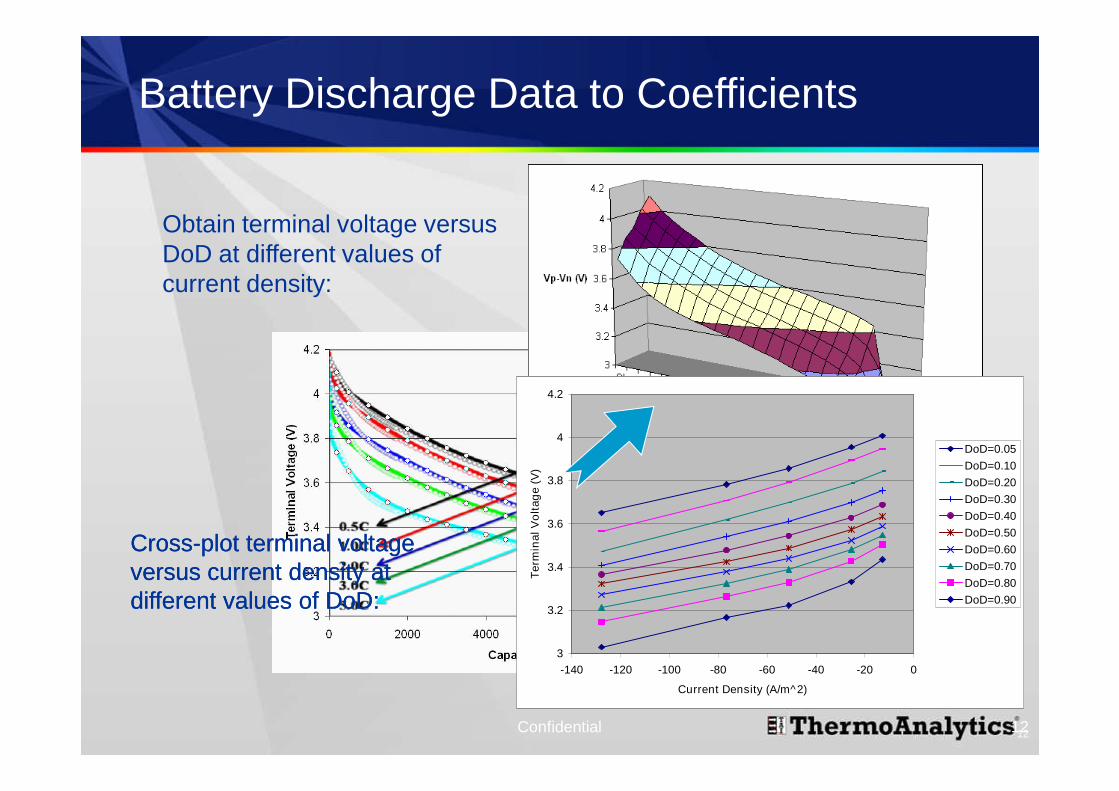
Battery Discharge Data to Coefficients
Obtain terminal voltage versusDoD at different values ofcurrent density:
Confidential
CrossCross--plot terminal voltageplot terminal voltageversus current density atversus current density atdifferent values of DoD:different values of DoD:
3
3.2
3.4
3.6
3.8
4
4.2
-140 -120 -100 -80 -60 -40 -20 0
Current Density (A/m^2)
Ter
min
alV
olt
age
(V)
DoD=0.05DoD=0.10DoD=0.20DoD=0.30DoD=0.40DoD=0.50DoD=0.60DoD=0.70DoD=0.80DoD=0.90
1313
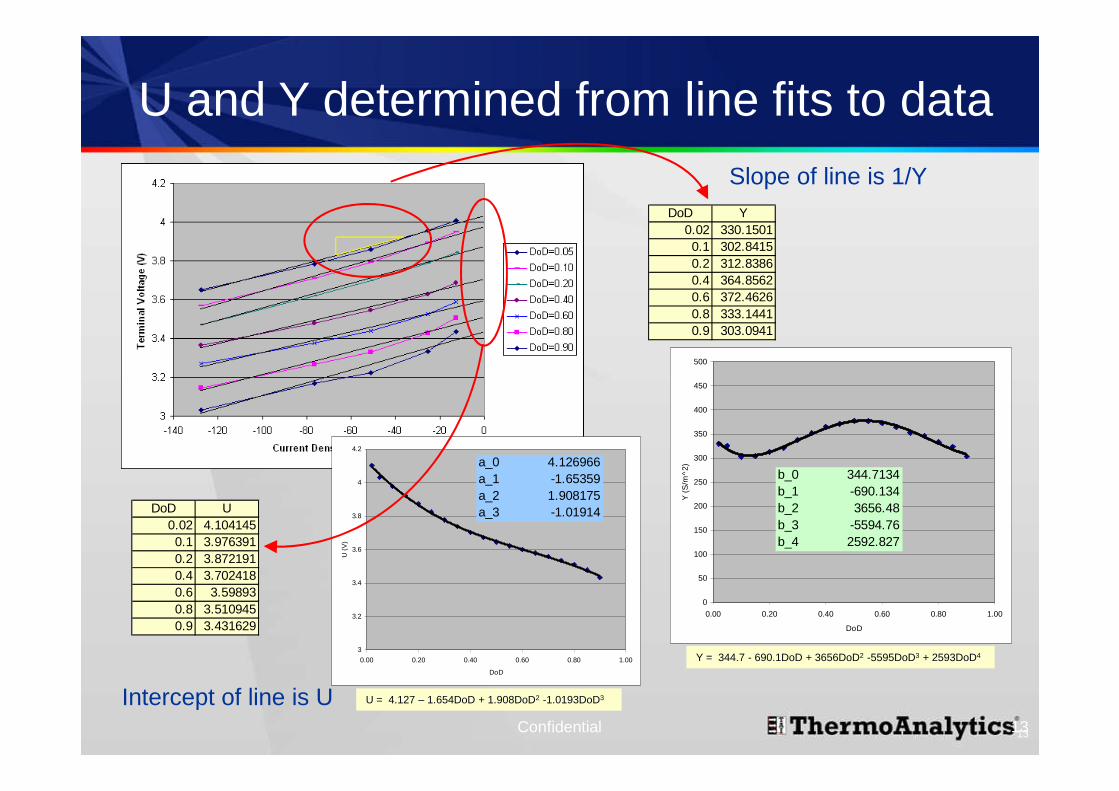
U and Y determined from line fits to data
Confidential
Slope of line is 1/YDoD Y
0.02 330.15010.1 302.84150.2 312.83860.4 364.85620.6 372.46260.8 333.14410.9 303.0941
0
50
100
150
200
250
300
350
400
450
500
0.00 0.20 0.40 0.60 0.80 1.00
DoD
Y(S
/m^2
)
b_0 344.7134b_1 -690.134b_2 3656.48b_3 -5594.76b_4 2592.827
Y = 344.7 - 690.1DoD + 3656DoD2 -5595DoD3 + 2593DoD4
U = 4.127 – 1.654DoD + 1.908DoD2 -1.0193DoD3
3
3.2
3.4
3.6
3.8
4
4.2
0.00 0.20 0.40 0.60 0.80 1.00
DoD
U(V
)
a_0 4.126966a_1 -1.65359a_2 1.908175a_3 -1.01914DoD U
0.02 4.1041450.1 3.9763910.2 3.8721910.4 3.7024180.6 3.598930.8 3.5109450.9 3.431629
Intercept of line is U
1414ThermoAnalytics Proprietary
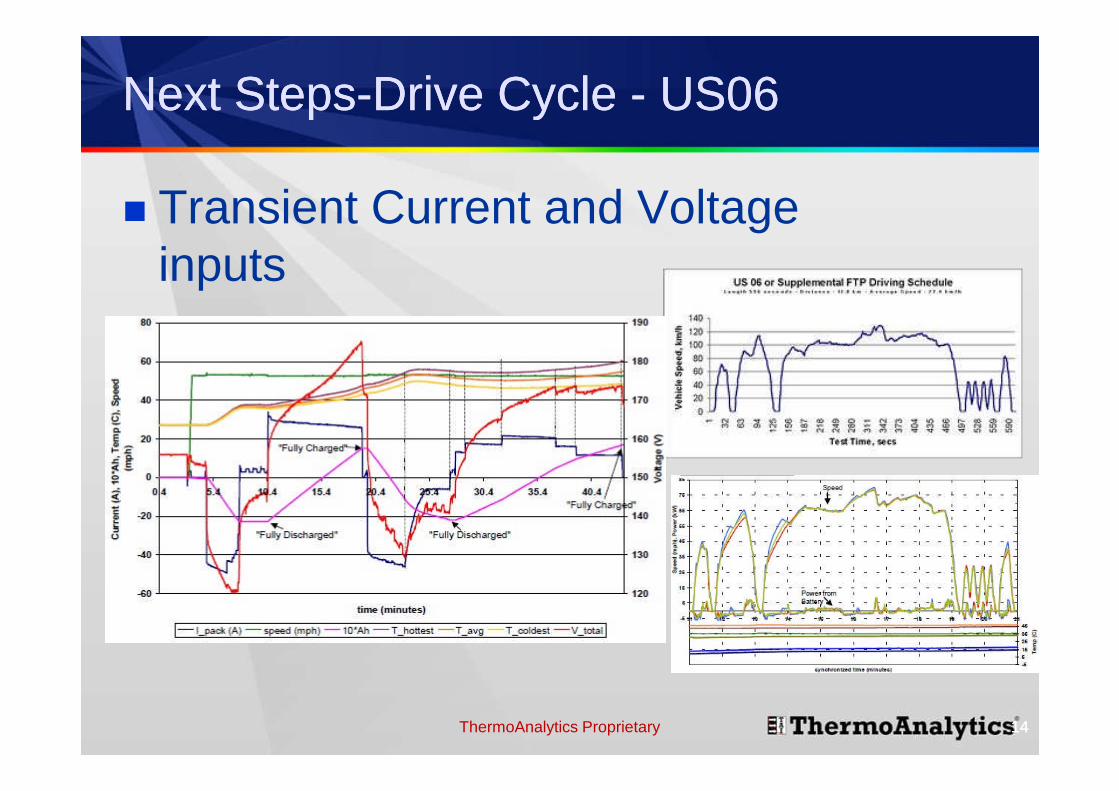
Next StepsNext Steps--Drive CycleDrive Cycle -- US06US06
Transient Current and Voltageinputs
1515
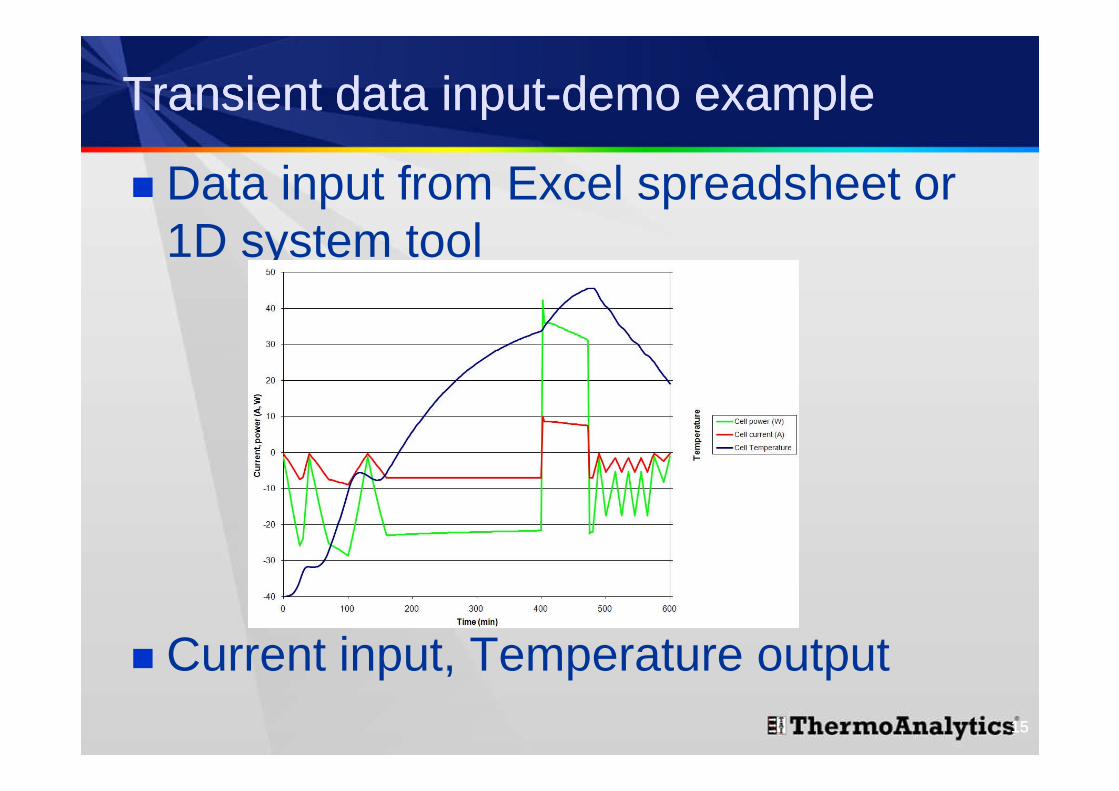
Data input from Excel spreadsheet or1D system tool
Current input, Temperature output
Transient data inputTransient data input--demo exampledemo example