Embed Size (px)
Citation preview

Modeling HOT LanesTPB’s Approach
AMPO Travel Modeling Group March 21, 2006
I:\ateam\meetings_conf\ampo_tms\2006-03-20\Hot_Lane_Pres_to_AMPO_Final.ppt

04/20/23 2
Highway Pricing in the Capital Region
• Few existing tolled facilities, limited observed data
• Highway pricing now viewed as a ‘solution’ – Term ‘HOT Lanes’ is now common in the media
– Viewed as an additional revenue source for expansion
– Viewed as management vehicle for existing highway supply
– Viewed as an additional travel option for those willing to pay
• Hybrid/SOVs can use HOV Lanes in VA under current law– Hybrid volume levels in HOV lanes have been increasing
• Planning interest in highway pricing is now intense

04/20/23 3
Recent Developments
• Public Private Transportation Act (PPTA) in Virginia has facilitated two privately financed construction proposals
• HOT lanes on the Capital Beltway in Virginia (4 Lanes, 15 miles)• HOT lanes on I-395/I-95 in Virginia (2/3 lanes, 50-60 miles)
• TPB Value Pricing Task Force Established – Goals formulated for implementing a system of HOT Lanes
1. Seamless connections between jurisdictions
2. Transition from HOV to HOT lanes
3. Integration and financing of transit
• HOT lane network being studied on entire freeway system
04/20/23 4
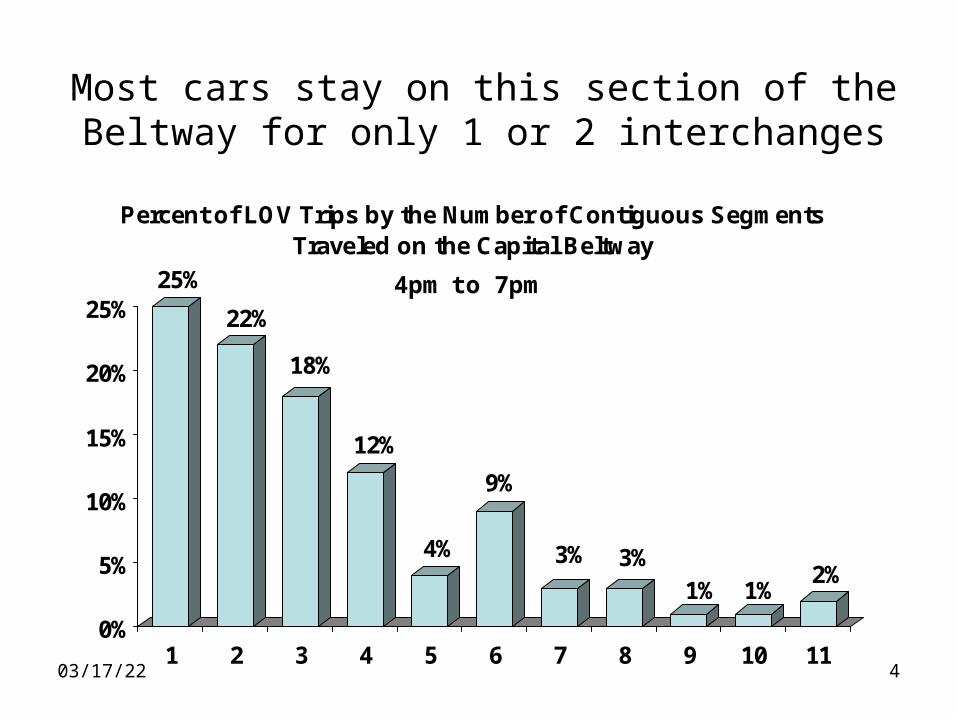
Most cars stay on this section of the Beltway for only 1 or 2 interchanges
25%
22%
18%
12%
4%
9%
3% 3%1% 1%
2%
0%
5%
10%
15%
20%
25%
1 2 3 4 5 6 7 8 9 10 11
Percent of LOV Trips by the Number of Contiguous Segments Traveled on the Capital Beltway
4pm to 7pm

04/20/23 5
Approach For Modeling Highway Pricing
• Travel Time Equivalent Approach: Converting monetary toll value to an equivalent travel time that is added to the ‘normal’ travel time used to develop paths– The toll is an added impedance along a given path– The travel time savings on the tolled path must offset the toll impedance
• Advantage: – Reasonable / Easy to explain– Can readily incorporate into existing 4-step model
• Disadvantages:– No accounting for unobserved benefits
• Safety, Reliability, Security of having the option available, etc. • Toll Revenue expectation: underestimated

04/20/23 6
Equivalent Travel Time Use in the Travel Model
Model Step
How Equivalent Highway Time is Considered
Trip Generation Not considered
Trip Distribution Equivalent Time Added to Gravity Model Impedance in Path Development by Income Quartile
Mode Choice
Equivalent time added to normal drive time in path development of highway time skims; Toll value added to Highway Cost
Time-of-Day Not considered
Traffic Assignment
Equivalent Time which is added to normal drive time in Path Development; Equivalent time varies by Vehicle Type (SOV, HOV, Truck, Airport-Related)

04/20/23 7
Deriving Equivalent Travel TimeBy Income Level, Purpose
Work & Non-Work Time – Dollar Equivalents by Income Level
Derived from 2000 Census, Washington, DC PMSA (A) (B)
Annual Household Income Quartile Range
Mid-Point of HH Income Range
Hourly Rate per Worker (A) / (2,650)
Work Equivalent min./dollar
60.0 / (0.50 *(B))
Non-Work Equivalent min/dollar
60.0/ (0.35 *(B))
$ 0 - $ 34,999 $17,500 $6.60 18.2 26.0 $ 35,000 - $ 59,999 $47,500 $17.93 6.7 9.6 $ 60,000 - $ 99,999 $80,000 $30.19 4.0 5.7
$100,000 + $160,000 $60.39 2.0 2.8 median income: $62,216

04/20/23 8
Deriving Equivalent Travel TimeBy Vehicle Type, Time Period
Peak/Off-Peak Time – Dollar Equivalents (Minutes/Dollar) by Vehicle Type
Derived from 2000 Census, Washington, DC PMSA
Vehicle Type Peak Period Equivalent
(min./dollar) Off-Peak Period Equivalent
(min./dollar)
Airport Auto 2.0 60.0 /$30.19 2.0 60.0 /$30.19 Single Occupant Auto 4.0 60.0 / (0.50 * $30.19) 5.7 60.0 / (0.35 * $30.19) Multi-Occupant Auto 5.0 60.0 / (0.40 * $30.19) 6.6 60.0 / (0.30 * $30.19)
Truck 10.0 2.5 times SOV equiv. 14.3 2.5 times SOV equiv.

04/20/23 9
HOT Lane Modeling Paradox
• You Already Know the Output:– HOT LANE Speed: 50 – 60 mph– HOT Lane Volume 1,800 – 2,000 vpl
• …So What’s the Input?– The toll value/rate, on a segment-by-segment basis,
that will result in the desired output
• ‘Trial / Error’ needed to hone in on a segment by segment toll rate ($/mi)
04/20/23 10
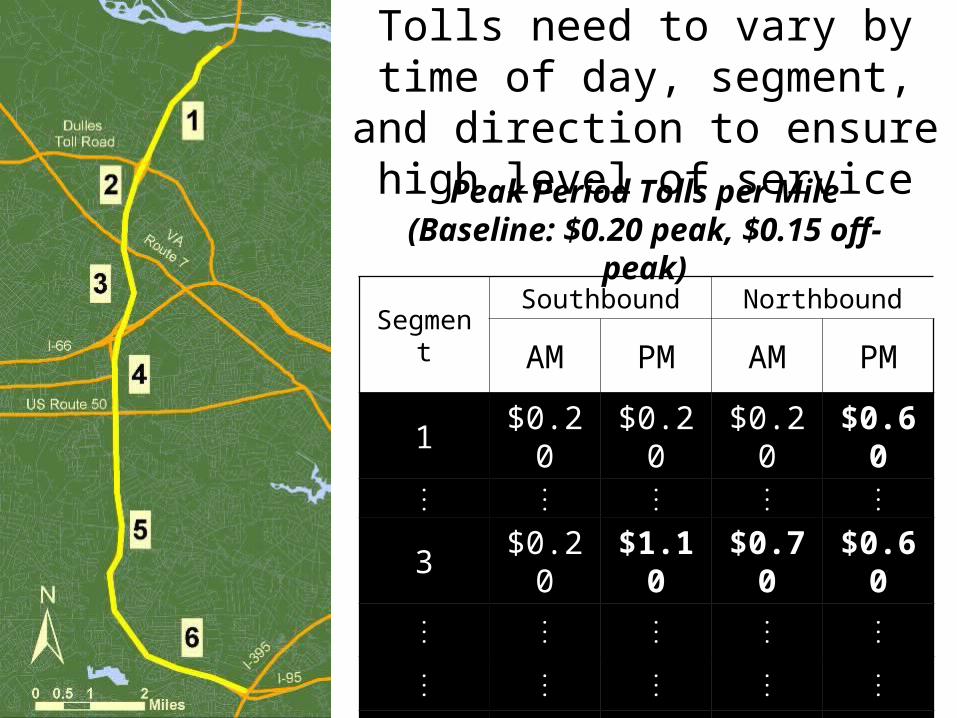
Tolls need to vary by time of day, segment, and direction to
ensure high level of service
SegmentSouthbound Northbound
AM PM AM PM
1 $0.20 $0.20 $0.20 $0.60...
.
.
....
.
.
....
3 $0.20 $1.10 $0.70 $0.60...
.
.
....
.
.
....
.
.
....
.
.
....
.
.
.
6 $0.20 $0.40 $0.20 $0.60
Peak Period Tolls per Mile(Baseline: $0.20 peak, $0.15 off-peak)
04/20/23 11
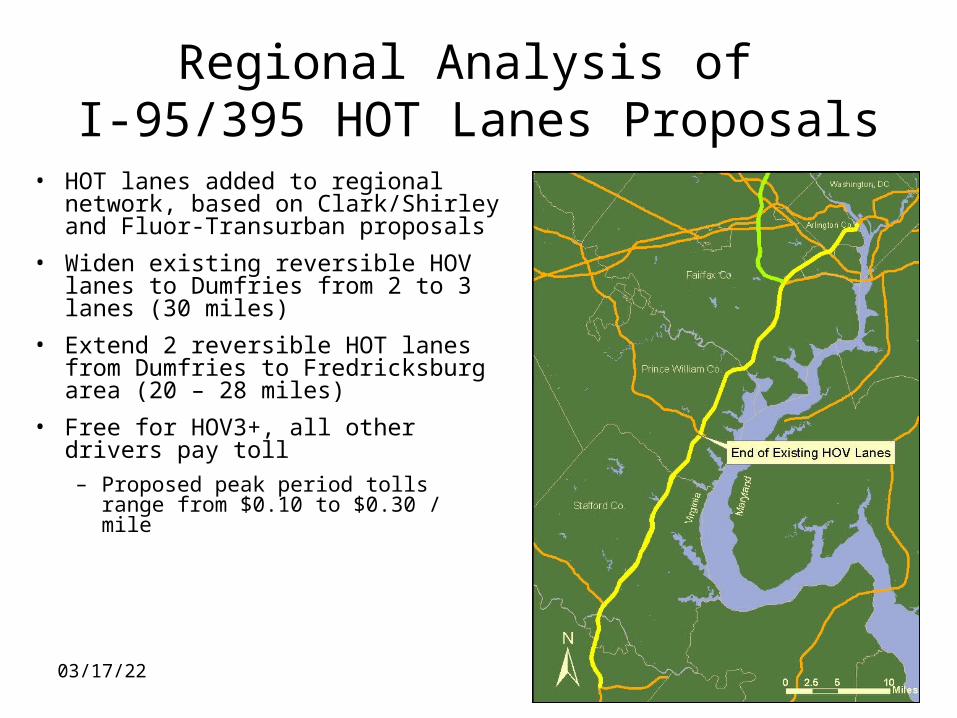
Regional Analysis of I-95/395 HOT Lanes Proposals
• HOT lanes added to regional network, based on Clark/Shirley and Fluor-Transurban proposals
• Widen existing reversible HOV lanes to Dumfries from 2 to 3 lanes (30 miles)
• Extend 2 reversible HOT lanes from Dumfries to Fredricksburg area (20 – 28 miles)
• Free for HOV3+, all other drivers pay toll– Proposed peak period tolls range
from $0.10 to $0.30 / mile
04/20/23 12
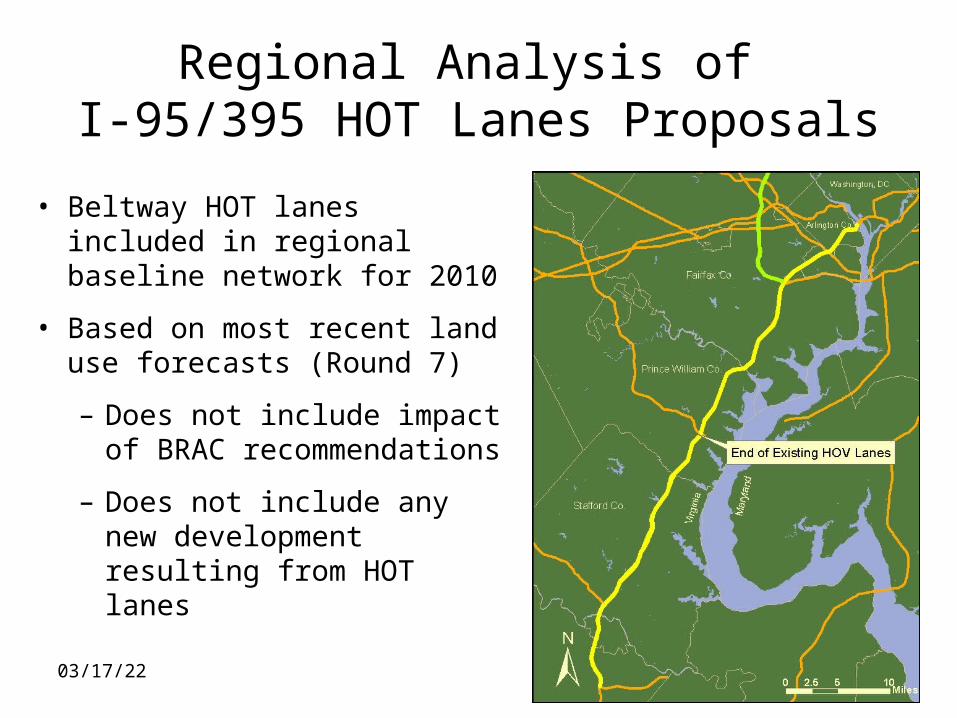
Regional Analysis of I-95/395 HOT Lanes Proposals
• Beltway HOT lanes included in regional baseline network for 2010
• Based on most recent land use forecasts (Round 7)
– Does not include impact of BRAC recommendations
– Does not include any new development resulting from HOT lanes
04/20/23 13
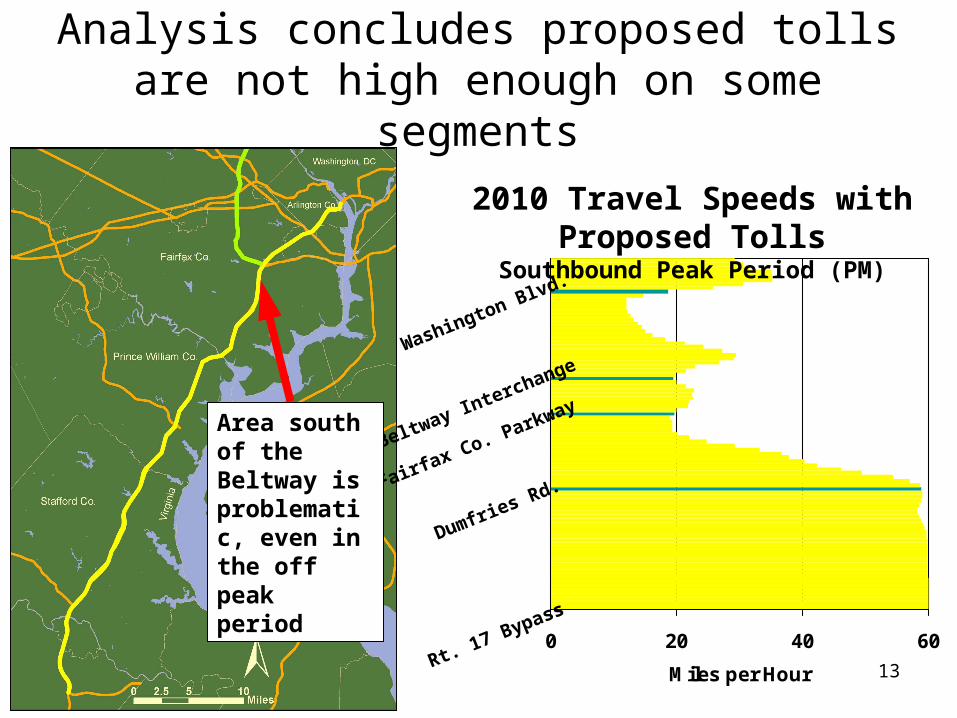
Analysis concludes proposed tolls are not high enough on some segments
0 20 40 60
Miles per Hour
Beltway Interchange
Fairfax Co. Parkway
Washington Blvd.
Dumfries Rd.
Rt. 17 Bypass
2010 Travel Speeds with Proposed TollsSouthbound Peak Period (PM)
Area south of the Beltway is problematic, even in the off peak period
04/20/23 14
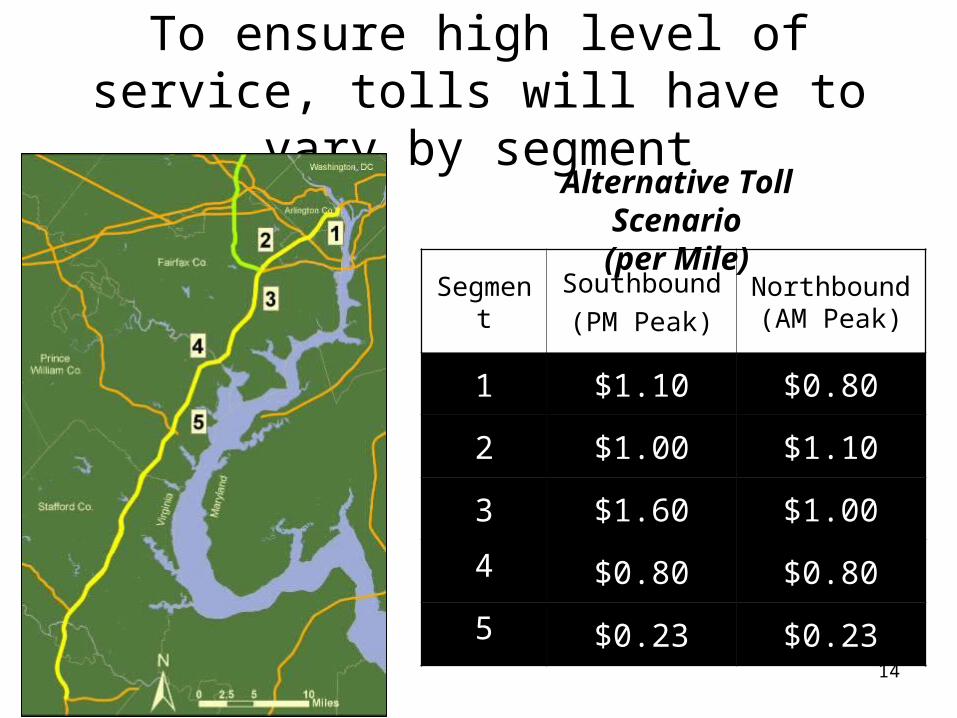
To ensure high level of service, tolls will have to vary by segment
SegmentSouthbound
(PM Peak)Northbound (AM Peak)
1 $1.10 $0.80
2 $1.00 $1.10
3 $1.60 $1.00
4 $0.80 $0.80
5 $0.23 $0.23
Alternative Toll Scenario(per Mile)

04/20/23 15
If high service level is maintained, HOV volumes will increase on some segments, relative to 2010 baseline
2010 HOV Traffic Volumes with Alternative Toll Scenario
Southbound Peak Period (PM)
Beltway Interchange
Fairfax Co. Parkway
Washington Blvd.
Dumfries Rd.
Rt. 17 Bypass
0 2 4 6 8 10
Alternative Toll Scenario2010 Baseline
Traffic volume (Thousands)

04/20/23 16
Limited capacity for toll-paying vehicles at chokepoint south of Beltway
0 5 10 15
Traffic Volume (Thousands)
HOV Toll-paying vehicles
2010 Traffic Volumes with Alternative Toll Scenario
Southbound Peak Period (PM)
Beltway Interchange
Fairfax Co. Parkway
Washington Blvd.
Dumfries Rd.
Rt. 17 Bypass

04/20/23 17
Synergy with the Capital Beltway
26%26% 32%32%
42%42%
2010 HOT Lane Traffic VolumesNorthbound Peak Period (AM)
04/20/23 18
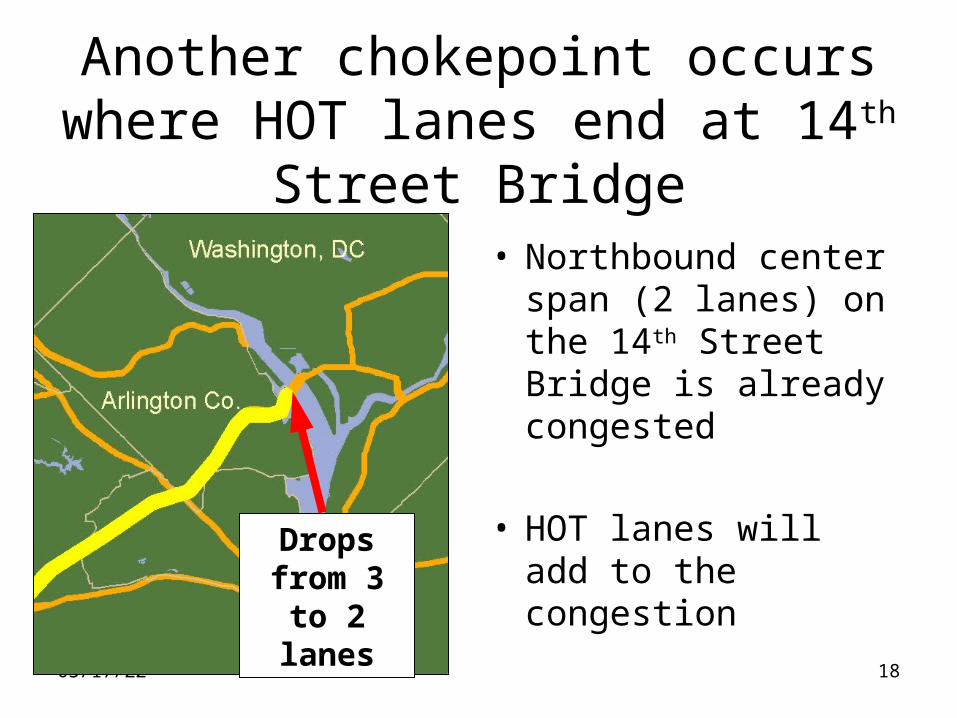
Another chokepoint occurs where HOT lanes end at 14th Street Bridge
• Northbound center span (2 lanes) on the 14th Street Bridge is already congested
• HOT lanes will add to the congestionDrops from
3 to 2 lanes

04/20/23 19
Observations
• Tolls will have to be significantly higher than proposed on certain segments to maintain high levels of service
• Increased transit (bus service on HOT lanes and commuter rail) should be studied as an integral part of the I-95/395 project
• Chokepoint south of the Beltway limits capacity for toll-paying vehicles
• HOT lanes add to northbound congestion on the 14th Street Bridge center span (2 lanes)
04/20/23 20
Observations
• Based on California’s experience, drivers will pay an additional premium for the reliability of HOT lanes, and some will pay to use HOT lanes even when conventional lanes are not congested
• Revenue implications of alternative toll scenarios need to be studied for 2010 and future years
• Microsimulation modeling may be needed to examine capacity at entry and exit points