Embed Size (px)
DESCRIPTION
Study on the environmental benefits of silvopasture agroforestry in Europe.
Citation preview

Modeling environmental benefits of silvoarable agroforestry in Europe
J.H.N. Palma a,*, A.R. Graves b, R.G.H. Bunce c, P.J. Burgess b, R. de Filippi a, K.J. Keesman d,H. van Keulen e, F. Liagre f, M. Mayus g, G. Moreno h, Y. Reisner i, F. Herzog a
a Agroscope Reckenholz Tanikon Research Station ART, Reckenholzstrasse 191, 8046 Zurich, Switzerlandb Institute of Water and Environment, Cranfield University, Silsoe MK45 4DT, UK
c ALTERRA – Green World Research, P.O. Box 47, 6700 AA Wageningen, The Netherlandsd Systems & Control Group, Wageningen UR, P.O. Box 17, 6700 AA Wageningen, The Netherlands
e Plant Production Systems Group, Wageningen UR, P.O. Box 430, 6700 AK Wageningen, The Netherlandsf Assemble Permanent des Chambres d’Agriculture, 9 Avenue George V, 75008 Paris, France
g INRA, Centre de Recherche de Montellier, 2 Place Pierre Viala, 34060 Montpellier Cedex 1, Franceh Universidad de Extremadura, Centro Universitario de Plasencia, 10600 Plasencia, Spain
i Swiss College of Agriculture, Laenggasse 85, 3052 Zollikofen, Switzerland
Received 2 November 2005; received in revised form 7 July 2006; accepted 26 July 2006
Available online 25 September 2006
www.elsevier.com/locate/agee
Agriculture, Ecosystems and Environment 119 (2007) 320–334
Abstract
Increased adoption of silvoarable agroforestry (SAF) systems in Europe, by integrating trees and arable crops on the same land, could offer
a range of environmental benefits compared with conventional agricultural systems. Soil erosion, nitrogen leaching, carbon sequestration and
landscape biodiversity were chosen as indicators to assess a stratified random sample of 19 landscape test sites in the Mediterranean and
Atlantic regions of Europe. At each site, the effect of introducing agroforestry was examined at plot-scale by simulating the growth of one of
five tree species (hybrid walnut Juglans spp., wild cherry Prunus avium L., poplar Populus spp., holm oak Quercus ilex L. subsp. ilex and stone
pine Pinus pinea L.) at two tree densities (50 and 113 trees ha�1) in combination with up to five crops (wheat Triticum spp., sunflower
Helianthus annuus L., oilseed rape Brassica napus L., grain maize and silage maize Zea mays L.). At landscape-scale, the effect of introducing
agroforestry on 10 or 50% of the agricultural area, on either the best or worst quality land, was examined. Across the 19 landscape test sites,
SAF had a positive impact on the four indicators with the strongest effects when introduced on the best quality land. The computer simulations
showed that SAF could significantly reduce erosion by up to 65% when combined with contouring practices at medium (>0.5 and
<3 t ha�1 a�1) and high (>3 t ha�1 a�1) erosion sites. Nitrogen leaching could be reduced by up to 28% in areas where leaching is currently
estimated high (>100 kg N h�1 a�1), but this was dependent on tree density. With agroforestry, predicted mean carbon sequestration through
immobilization in trees, over a 60-year period, ranged from 0.1 to 3.0 t C h�1 a�1 (5–179 t C h�1) depending on tree species and location.
Landscape biodiversity was increased by introducing SAF by an average factor of 2.6. The implications of this potential for environmental
benefits at European-scale are discussed.
# 2006 Elsevier B.V. All rights reserved.
Keywords: Alley cropping; Carbon sequestration; Erosion; Landscape diversity; Land use; Nitrogen leaching; Agri-environmental policy
1. Introduction
Since the 1950s, agricultural productivity has increased
dramatically in Europe. This has been a major result of the
Common Agricultural Policy (CAP) of the European Union
* Corresponding author. Tel.: +41 44 377 7664; fax: +41 44 377 7201.
E-mail address: [email protected] (J.H.N. Palma).
0167-8809/$ – see front matter # 2006 Elsevier B.V. All rights reserved.
doi:10.1016/j.agee.2006.07.021
(EU) and has successfully provided consumers with an
abundant supply of agricultural products, while simulta-
neously the proportion of household income expended on
food has declined (Grubler, 1994).
Increased agricultural output per unit of area and per unit
of labor has been achieved using improved genetic material,
increased inputs and modern management techniques, for
example, new crop varieties, the use of fertilizer and other

J.H.N. Palma et al. / Agriculture, Ecosystems and Environment 119 (2007) 320–334 321
agrochemicals, and large-scale specialized machinery.
These practices were implemented together with land
consolidation programs to increase the size of agricultural
parcels. To some extent, however, the gains in efficiency of
production were achieved at the expense of the environment.
In many places, semi-natural and natural habitats were
removed, resulting in reduced farmland biodiversity. Soil
erosion and compaction and the pollution of ground- and
surface water with nitrates and pesticides are other
undesirable consequences of modern, intensified agricul-
tural production (Bouma et al., 1998; Mermut and Eswaran,
2001).
Agroforestry is a form of multi-cropping which involves
combining at least one woody-perennial species with a crop
which results in ecological and economic interactions
between the two components. Such systems are typically
associated with a variety of environmental benefits and
although agroforestry systems were common in Europe
(Olea and Figuera, 1999; Eichhorn et al., 2006) they have
strongly declined because of agricultural intensification
(Dupraz and Newman, 1997; Herzog, 1998).
In Europe, environmental benefits are expected from new
land-use systems (Baldock et al., 1993). Since the 1990s,
research projects have demonstrated that novel temperate
agroforestry systems can operate with modern technology
while preserving some of the environmental benefits
associated with traditional agroforestry (Auclair and
Dupraz, 1998). One form of agroforestry, here referred to
as silvoarable agroforestry (SAF), is the practice of growing
an arable crop between spatially zoned trees in rows (Dupraz
and Newman, 1997; Burgess et al., 2004b). However,
investigating the environmental performance of SAF
through field experiments is expensive and time-consuming
because trees take decades to mature and as a consequence,
the initiation of such experiments is difficult (Poulton,
1995). Computer models provide one method for over-
coming these problems. They can extrapolate research
results to new combinations of biophysical and management
conditions that are too complex to be studied in field
experiments (Mobbs et al., 2001).
A modeling approach was developed by Palma et al. (in
press) to assess the environmental performance of SAF
systems. It comprised examining the impact of SAF on soil
erosion by water (hereafter called erosion), nitrogen
leaching, carbon sequestration and landscape biodiversity,
and uses tree and crop yields derived from a biophysical
model called Yield-SAFE (from ‘‘YIeld Estimator for Long
term Design of Silvoarable AgroForestry in Europe’’).
Yield-SAFE was developed with as few equations and
parameters as possible to allow model parameterization
under constrained availability of data from long-term
experiments (van der Werf et al., in press).
The objective of this paper is to assess the potential
environmental performance of SAF in representative
climatic conditions of southern Europe (Mediterranean
Spain), western Europe (France), and northern Europe (the
Netherlands) at the scale of farms/small landscapes using
models and algorithms of appropriate spatial and thematic
resolution and complexity (Palma et al., in press).
2. Material and methods
Randomly selected landscape test sites (LTS) in Spain,
France and the Netherlands were used to model tree and crop
yields on hypothetical farms for SAF at two densities (50
and 113 trees ha�1, 40 m � 5 m and 22 m � 4 m, respec-
tively) on 10 and 50% of the total agricultural area, starting
with either the best and worst quality land. Current
agricultural land use was also modeled to provide a
comparison with the status quo. Yield-SAFE (van der Werf
et al., in press) was used to generate crop yields for typical
crop rotations (combinations with up to five crops; wheat
Triticum spp., sunflower Helianthus annuus L., oilseed rape
Brassica napus L., grain maize and silage maize Zea mays
L.) at each LTS over a 60-year time horizon. The same crop
rotations were then incorporated in SAF systems that
included holm oak (Quercus ilex subsp. ilex L.) and stone
pine (Pinus pinea L.) in Spain, hybrid walnut (Juglans sp.),
wild cherry (Prunus avium L.) and poplar (Populus spp.) in
France and the Netherlands. An initial stage of the
investigation involved characterizing the LTS to provide
inputs for the Yield-SAFE model and environmental
assessment algorithms.
2.1. Data acquisition and processing
Based on an environmental classification of Europe,
which resulted from a statistical analysis of climatic and
topographic data (Metzger et al., 2005), 21 LTS of
4 km � 4 km each were selected in the dominant
environmental classes of Spain (9), France (9) and The
Netherlands (3). The selection was random, but was
restricted to agricultural areas according to the PELCOM
land cover classification (Mucher, 2000). Two LTS in
France were later discarded due to lack of associated data,
bringing the total to 19 LTS. In Spain the sites ranged from
Alcala la Real in Andalucia in the south to St Maria del
Paramo in Castilla y Leon in the north. In France, the sites
ran across central France from Champdeniers in Poitou
Charentes in the west to Champlitte in Franche Comte in
the east. In the Netherlands the sites were located in the
central (Gelderland) and eastern (Overijssel) parts of the
country (Fig. 1).
In Spain, aerial ortho-images were obtained from the SIG
Oleıcola Espanol (MAPYA, 1999) and digital land-use data
were obtained from the REDPARES project (Bolanos et al.,
2003). During field surveys, land use was updated and soil
samples were taken to produce soil maps in combination
with topographic details. Digital elevation models (DEM)
were developed by digitizing the contour lines of
topographic maps. In France, aerial photographs and

J.H.N. Palma et al. / Agriculture, Ecosystems and Environment 119 (2007) 320–334322
Fig. 1. Landscape test sites selected covering wide biophysical characteristics based on the European environmental classification (Metzger et al., 2005). See
Table 1 for the site codes.
DEM were acquired from IGN#, and the land-use digitized.
Digital soil maps were acquired from various regional
institutions. In the Netherlands, aerial photographs and land-
use data were obtained from the EU GREENVEINS project
consortium (Bugter et al., 2001). Digital elevation models
were acquired from DLG# and digital soil maps from
GeoDesk#. For each LTS, daily and monthly weather data
(temperature, precipitation and solar radiation) were
generated using Cligen 5.2 (Lane and Nearing, 1995) based
on reference data from the weather station nearest to the LTS
(GDS, 2005). All spatial information was stored and
processed in geographic information systems (ArcGIS—
ArcInfo# and ArcInfo WorkStation# 8.3).
Data on temperature, radiation, precipitation and soil
water availability are required to generate tree and crop
yields in Yield-SAFE. Precipitation and temperature were
considered to be homogenous within each LTS, while solar
radiation was considered to vary depending on the direction
and angle of the slopes described by the DEM. A solar
radiation grid was calculated for 1 year in each LTS with
DiGEM (Conrad, 1998) and transformed into a percentage
by dividing the radiation in each grid cell by the radiation

J.H.N. Palma et al. / Agriculture, Ecosystems and Environment 119 (2007) 320–334 323
obtained in a flat, un-shaded grid cell. From the soil
information, available water content was estimated based on
soil depth and texture to which were associated ‘‘van
Genuchten’’ parameters assessed by Wosten et al. (1999)
and volumetric water content calculated with the van
Genuchten equation (1980).
To account for spatial variability in solar radiation and
available soil water content within each LTS, both maps
were processed using the isocluster analysis function in
ArcInfo# 8.3 (Ball and Hall, 1965; Richards, 1986)
resulting in up to four clusters or land units (LU). Each
LU was then characterized by its mean radiation and its
major soil texture and soil depth (Fig. 2). The cluster
analysis resulted in 42 LU for the 19 LTS, each potentially
producing different tree and crop yields (Table 1). All
Fig. 2. GIS landscape data processing for each landscape test site (LTS) to cre
agricultural land of a farm (Torrijos LTS example).
analyses, except that for landscape biodiversity, were
restricted to agricultural land within LU, since this land
was considered to be the target area for SAF. Within each
LTS, LUs were ranked according to their potential
productivity. When more than two LUs were present, an
intermediate quality was also given (medium). Crop
rotations and agroforestry tree species were determined
for each LU in workshops with experts and local
stakeholders (Table 1).
Hypothetical farms were also devised for each LTS,
using farm structure data from FADN (EC, 2003) and
local statistics to define the total size of the farm. The
area of each LU within each hypothetical farm was
derived from the proportion of each LU within each LTS
(Fig. 2).
ate homogeneous land units (LU), corresponding to different qualities of

J.H.N. Palma et al. / Agriculture, Ecosystems and Environment 119 (2007) 320–334324
Table 1
Biophysical and management characteristics of the landscape test sites in Spain, France and the Netherlands and corresponding land units (LU)
Site Site
code
Altitude
(m)
Mean
temperature
(8C)
Area of
farm (ha)
Rainfall
(mm)
LU—
quality
Area of
LU (ha)
Radiation
(%)
Soil
texture
(FAO)
Soil
depth
(cm)
Tree Crop
rotation
Spain
Alcala la real ALC 1000 15 73 355 LU1-B 58 97 M 140 Oak w/w/f
LU2-W 15 86 M 50 Oak w/w/f
Torrijos TOR 500 15 63 348 LU1-W 10 101 M 140 Oak w/f
LU2-B 56 100 M 140 Oak w/w/f
Ocana OCA 700 15 66 316 LU1-na 66 100 M 140 Oak w/w/f
Almonacid
de Zorita
ALM 900 13 66 404 LU1-B 59 97 M 140 Oak w/f
LU2-W 7 83 F 140 Oak s/s/s/s/s/w/f
Cardenosa
El Espinar
CAR 1000 12 58 404 LU1-W 23 93 M 140 Oak w/w/w/f
LU2-B 35 101 F 140 Oak w/w/w/f
Fontiveros FON 900 12 58 393 LU1-B 49 99 C 140 Oak w/w/w/w/f
LU2-W 9 98 C 140 Pine w/w/w/w/f
Olmedo OLM 750 12 57 410 LU1-M 5 100 C 140 Pine w/s/f
LU2-B 34 100 M 140 Oak w/s/f
LU3-W 18 99 C 140 Oak w/s/f
St Maria
del Campo
CAM 800 10 58 530 LU1-W 44 99 C 140 Pine w/w/w/f
LU2-B 14 99 M 140 Oak w/w/w/w/w/f
St Maria
del Paramo
PAR 800 10 59 519 LU1-B 4 100 M 140 Oak w/w/w/s/f
LU2-M 34 100 M 140 Oak w/w/w/s/f
LU3-W 21 101 M 140 Oak w/w/w/s/f
France
Champdeniers CHD 200 11 94 648 LU1-B 67 100 F 80 Cherry w/w/s/w/o/s
LU2-W 27 100 M 120 Walnut w/w/s/w/o/s
Chateauroux CHT 150 11 152 587 LU1-M 32 102 F 80 Walnut w/w/o/w/o/s
LU2-B 23 102 F 40 Cherry w/w/o/w/o/s
LU3-M 86 102 M 120 Walnut w/w/o
LU4-W 11 100 F 40 Cherry w/w/o/w/o/s
Fussy FUS 200 10 80 626 LU1-W 10 101 F 40 Cherry w/o
LU2-B 43 103 M 80 Poplar w/w/o
LU3-M 27 102 F 120 Cherry w/o
Sancerre SAN 400 11 98 724 LU1-M 37 103 F 40 Cherry o/w/s/w/w/w/o
LU2-W 10 102 VF 140 Poplar o/w/s/w/w/w/o
LU3-B 44 101 VF 120 Cherry o/w/s/w/w/w/o
LU4-B 7 100 C 80 Cherry o/w/s/w
Champlitte CMP 300 8 130 773 LU1-W 68 103 M 140 Cherry w/w/o
LU2-B 62 103 MF 35 Walnut w/w/w/w/w/gm
Dampierre DAM 300 10 130 1072 LU1-M 64 98 M 140 Cherry w/w/gm
LU2-W 43 97 F 35 Cherry w/w/w/gm
LU3-B 23 95 MF 60 Poplar w/gm
Vitrey VIT 400 9 120 1084 LU1-W 46 103 M 60 Cherry w/w/o
LU2-B 74 103 MF 60 Poplar w/w/gm
The Netherlands
Balkbrugg BAL 0 9 40 818 LU1-na 40 100 C 140 Poplar sm
Bentelo BEN 0 9 40 729 LU1-na 40 100 C 140 Walnut w/w/sm
Scherpenzeel SCH 0 9 10 801 LU1-na 10 100 C 140 Poplar sm
Land units (LU): B: best; M: medium; W: worst; na: not applicable. Soil type: C: coarse; M: medium; MF: medium-fine; F: fine; VF: very-fine. Crops: w: wheat;
f: fallow; o: oilseed rape; s: sunflower; gm: grain maize; sm: silage maize.

J.H.N. Palma et al. / Agriculture, Ecosystems and Environment 119 (2007) 320–334 325
2.2. Biophysical modeling
The radiation, temperature, rainfall, soil depth and
texture data for each LU were used as inputs in a daily
time-step bio-physical model of tree and crop production,
based on competition for light and water (Yield-SAFE, van
der Werf et al., in press) and implemented in Microsoft
Excel# by Burgess et al. (2004a) to predict annual tree and
crop yields.
The parameters used in Yield-SAFE to describe the
growth of each tree and crop species were determined from
published material (e.g. yield tables) and calibrations. An
initial calibration for ‘‘potential’’ monoculture yields (van
Ittersum and Rabbinge, 1997) was undertaken against
datasets of tree volume and crop yields under high yielding
conditions in the Atlantic and Mediterranean zones,
assuming that light and temperature but not water, limited
growth (Burgess et al., 2004a). Then at each LU and
assuming light, temperature, and water limited growth
within the model, the values of three parameters (harvest
index, water use efficiency and a management factor) were
adjusted within acceptable boundaries so that the output
from the model over the duration of the tree component
matched an ‘‘actual’’ monoculture tree and crop yield (van
Ittersum and Rabbinge, 1997). The tree and crop manage-
ment defined previously for the monocultures and ‘‘refer-
ence’’ soil depth and texture were also used. The
monoculture management and actual and reference values
were determined for each LTS during workshops held in
each country (Herzog et al., 2004; Palma and Reisner, 2004;
Reisner, 2004).
In Spain, the actual timber volumes for oak and stone pine
in all the LTS in year 60 were assumed to be 0.22 m3 and
0.26 m3 tree�1, respectively, indicating slow growth. In
France, wild cherry (1.04–1.06 m3 tree�1) and walnut
(1.04 m3 tree�1) for the same rotation were comparatively
fast growing trees. Poplar was the fastest growing tree with
actual yields of 1.46–1.51 m3 tree�1 after 20 years. In Spain,
actual yields for (non-irrigated) wheat were comparatively
low (1.62–3.71 t ha�1) compared to those in France (6.5–
8.0 t ha�1) and the Netherlands (7.8 t ha�1). Actual sun-
flower yields were lower in Spain (0.60–1.09 t ha�1) than in
France (2.3–2.5 t ha�1). Actual yields for oilseed (3.2–
4.0 t ha�1) and grain maize (7.5–8.0 t ha�1) were assumed
only for France and an actual yield for fodder maize
(12 t ha�1) assumed only for the Netherlands.
2.3. Data analysis
The environmental assessment was performed in each LU
assuming a 60-year rotation for the agroforestry system. For
poplar, which was assumed to have a rotation of 20 years,
three successive tree crops were included. Because crop
yields within an agroforestry system decline over time as the
trees increase in size and compete with the crops, it was
assumed that farmers would stop arable cropping when it
became unprofitable. The cut-off point was estimated from a
5-year moving average of profitability as described by
Graves et al. (in press).
For each scenario, soil erosion, nitrogen leaching, carbon
sequestration and landscape biodiversity were examined
using the method described by Palma et al. (in press).
Erosion was modeled with the revised universal soil loss
equation (RUSLE, Renard et al., 1997), where SAF was
considered to mimic strip cropping, which could be
implemented with or without an erosion control measure,
in this case contouring. Nitrogen leaching was modeled
using an equation proposed by Feldwisch et al. (1998),
which uses an annual water exchange factor in the soil and
the excess nitrogen potentially available for leaching.
Annual excess nitrogen was estimated from tree and crop
productivity, assuming optimized nitrogen fertilization,
taking into account nitrogen contents of crop–tree biomass,
of the soil and the nitrogen recovery capacity by crops (van
Keulen, 1982). Crop and tree yields were computed by
Graves et al. (in press) and van der Werf et al. (in press) for
each LU using Yield-SAFE. The model also provided an
estimation for groundwater recharge required to compute
annual nitrogen leaching. Carbon sequestration was
calculated for SAF systems only, based on the Intergovern-
mental Panel on Climate Change (IPCC, 1996) and Gifford
relationships (2000a,b) for tree biomass predicted by the
Yield-SAFE model. A broad evaluation of the effects of SAF
implementation on landscape biodiversity was conducted,
based on the share of habitats available to wildlife in an
agricultural landscape, classifying each LTS into ‘‘habitat’’
(e.g. hedgerows, permanent grassland, traditional orchards)
and ‘‘non-habitat’’ (the arable matrix).
Each environmental assessment for each LU in each LTS
was then used to calculate a weighted mean at the farm-
scale, based on the proportion of land occupied by each LU
within each LTS representing a hypothetical farm. These
were then aggregated to provide an overall assessment of
environmental effect for each scenario at each LTS/farm.
Modeled results are representations of reality that can be
statistically compared (Kleijnen, 1987). LU- and LTS-scale
results were compared with general linear models (GLM) in
STATISTICA#. Multiple comparisons between scenarios
were tested with Tukey Honest significant difference (HSD).
3. Results and discussion
The resulting environmental assessments for each
scenario in each LTS are summarized in Table 2. Although
the results are presented as mean annual values to facilitate
interpretation, the annual rates are not constant over the 60
years time horizon because of variation in weather, crop
rotations, and the growth of trees in the SAF systems. For
example, in SAF systems, soil erosion was greatly reduced
when a grass fallow was introduced at the termination of
profitable cropping, since such cover is an effective means of

J.H.N
.P
alm
aet
al./A
gricu
lture,
Eco
systems
an
dE
nviron
men
t1
19
(20
07
)3
20
–3
34
32
6Table 2
Projected effect of the introduction of silvoarable agroforestry (SAF) on erosion, nitrate leaching, carbon sequestration and landscape biodiversity at fa /landscape-scale for different tree densities (50 and
113 trees ha�1) on 10 and 50% of the farmland on two land qualities
Indicator Scenarios Landscape test sites
Erosion
control
practices
SAF density
(trees ha�1)
SAF
area (%)
Land
quality
Spain France Netherlands
ALC TOR OCA ALM CAR FON OLM CAM PAR CHD CHT FUS SAN DAM CMP VIT SCH BEN BAL
Erosion
(t ha�1 a�1)
Without
contouring
practices
Arable
(status quo)
6.0 1.6 0.0 3.4 3.4 1.2 0.0 0.7 0.3 0.4 0.4 1.1 2.1 2.9 1.3 9.7 0.5 0.5 0.3
SAF 50 10 Worst 5.9 1.6 0.0 3.3 3.4 1.2 0.0 0.6 0.3 0.4 0.4 1.1 2.1 2.8 1.3 9.7 0.5 0.4 0.2
Best 6.0 1.6 0.0 3.3 3.4 1.2 0.0 0.7 0.3 0.4 0.4 1.0 2.0 2.5 1.2 8.8 0.5 0.4 0.2
50 Worst 5.7 1.4 0.0 3.1 3.3 1.2 0.0 0.6 0.3 0.4 0.4 1.1 2.0 2.4 1.2 8.5 0.3 0.3 0.2
Best 5.9 1.4 0.0 3.1 3.4 1.1 0.0 0.6 0.3 0.4 0.4 0.7 1.5 2.2 0.9 5.0 0.3 0.3 0.2
SAF 113 10 Worst 5.9 1.6 0.0 3.3 3.4 1.2 0.0 0.6 0.3 0.4 0.4 1.1 2.1 2.8 1.2 9.6 0.5 0.4 0.2
Best 5.9 1.6 0.0 3.3 3.4 1.2 0.0 0.7 0.3 0.4 0.4 1.0 2.0 2.5 1.2 8.7 0.5 0.4 0.2
50 Worst 5.5 1.4 0.0 2.9 3.3 1.1 0.0 0.5 0.2 0.3 0.4 1.1 2.0 2.4 1.0 8.0 0.3 0.3 0.1
Best 5.7 1.4 0.0 2.9 3.3 1.1 0.0 0.5 0.3 0.4 0.4 0.7 1.5 2.0 0.9 4.8 0.3 0.3 0.1
With
contouring
practices
Arable 4.4 0.9 0.0 2.3 2.2 0.7 0.0 0.4 0.1 0.2 0.2 0.6 1.1 1.6 0.7 5.3 0.3 0.3 0.2
SAF 50 10 Worst 3.9 0.9 0.0 2.2 2.0 0.6 0.0 0.4 0.1 0.2 0.2 0.5 1.1 1.4 0.6 5.1 0.3 0.2 0.1
Best 4.2 0.8 0.0 1.8 2.1 0.6 0.0 0.4 0.1 0.2 0.2 0.5 1.0 1.3 0.6 4.7 0.3 0.2 0.1
50 Worst 2.1 0.6 0.0 1.8 1.5 0.5 0.0 0.3 0.1 0.2 0.2 0.4 0.8 1.0 0.5 4.0 0.2 0.2 0.1
Best 3.3 0.6 0.0 1.8 1.7 0.5 0.0 0.3 0.1 0.2 0.2 0.3 0.7 1.0 0.4 2.4 0.2 0.2 0.1
SAF 113 10 Worst 3.9 0.9 0.0 2.2 2.0 0.6 0.0 0.4 0.1 0.2 0.2 0.5 1.1 1.4 0.6 5.1 0.3 0.2 0.1
Best 4.2 0.8 0.0 1.8 2.1 0.6 0.0 0.4 0.1 0.2 0.2 1.0 1.0 2.5 0.6 4.7 0.3 0.2 0.1
50 Worst 2.0 0.6 0.0 1.7 1.4 0.5 0.0 0.2 0.1 0.1 0.2 0.4 0.8 1.0 0.4 3.9 0.2 0.2 0.1
Best 3.2 0.6 0.0 1.7 1.6 0.5 0.0 0.2 0.1 0.2 0.2 0.3 0.7 1.0 0.4 2.3 0.2 0.2 0.1
N leaching
(kg ha�1 a�1)
Arable
(status quo)
4 0 0 0 0 0 1 7 0 37 70 48 59 137 109 134 155 124 149
SAF 50 10 Worst 0 0 0 0 0 0 1 7 0 37 71 49 61 132 107 136 151 103 131
Best 0 0 0 0 0 0 1 7 0 37 70 51 59 137 106 133 151 103 131
50 Worst 0 0 0 0 0 0 1 6 0 37 76 49 68 119 97 140 135 81 113
Best 0 0 0 0 0 0 1 6 0 36 74 60 61 136 91 130 135 81 113
SAF 113 10 Worst 0 0 0 0 0 0 1 6 0 36 70 47 60 131 102 132 146 99 125
Best 0 0 0 0 0 0 1 7 0 36 70 49 59 126 105 127 146 99 125
50 Worst 0 0 0 0 0 0 1 5 0 33 70 45 60 113 75 118 112 74 100
Best 0 0 0 0 0 0 1 6 0 33 69 50 59 108 88 99 112 74 100
Carbon
sequestration
(t C ha�1)
Arable
(status quo)
0 0 0 0 0 0 0 0 0 0 0 0 0 0 0 0 0 0 0
SAF 50 10 Worst 0 1 3 2 1 2 2 2 2 5 4 4 4 3 5 5 22 11 69
Best 1 1 3 2 2 1 3 3 2 5 5 20 29 14 6 26 22 11 69
50 Worst 3 6 14 12 7 8 11 10 9 26 22 31 22 19 25 48 108 22 139
Best 3 6 14 12 9 7 13 14 9 26 23 100 135 41 28 128 108 22 139
SAF 113 10 Worst 0 3 5 5 3 3 4 4 4 8 6 5 6.1 5 7 7 28 17 84
Best 1 2 5 3 4 3 5 6 3 7 8 25 39 16 9 31 28 17 84
50 Worst 7 12 25 23 15 16 20 21 17 38 29 39 29 29 32 63 141 34 168
Best 5 11 25 23 18 15 23 29 17 35 32 126 179 54 44 155 141 34 168
rm

J.H.N. Palma et al. / Agriculture, Ecosystems and Environment 119 (2007) 320–334 327
Fig. 3. Predicted annual nitrate leaching at land unit scale in the Chateaur-
oux landscape test site over a 60-year period with walnut and a wheat–
wheat–oilseed rotation. Arable reference scenario (Arable, average annual
leaching 17 kg N ha�1 a�1), silvoarable scenario with 50 trees ha�1
(SAF50, 16 kg N ha�1 a�1), silvoarable scenario with 113 trees ha�1
(SAF113, 12 kg N ha�1 a�1).Hab
itat
index
[%]
Ara
ble
(sta
tus
qu
o)
81
31
86
17
54
65
01
11
82
41
17
33
21
11
61
61
SA
F5
0o
r
SA
F1
13
10
na
83
38
17
65
77
52
55
20
26
12
14
20
16
12
38
20
24
25
11
50
na
90
66
54
80
87
73
75
55
59
51
52
56
53
51
66
56
58
58
51
No
tes:
na,
no
tap
pli
cab
le.
See
Tab
le1
for
lan
dsc
ape
test
site
sco
des
.
preventing soil loss (Morgan, 1995; Reisner and Freyer,
2006). Similarly, nitrogen leaching is reduced (Whitehead,
1995). An example of the annual variability in nitrogen
leaching is shown for a walnut SAF system for the LTS at
Champdeniers in France (Fig. 3).
In interpreting the results, we focused on the relative
differences between scenarios, rather than on the absolute
values. However, absolute values have been tabulated to
indicate the order of magnitude of the computed values.
3.1. Erosion
Predicted erosion rates at the 19 LTS for the status quo
arable systems ranged from 0 to 9.7 t ha�1 a�1 (Table 2).
These are of a similar magnitude than those indicated in the
European soil erosion map for individual LTS locations (van
der Knijff et al., 2000). Although absolute values from an
empirical model that has not been locally calibrated should
be interpreted with caution (Centeri, 2003), the outputs from
RUSLE can still be indicative of relative differences in soil
erosion between alternative land-use types (van Remortel
et al., 2001).
Introduction of SAF reduced erosion at all LTS in
comparison with the arable status quo, especially when
contouring was practiced (Table 2). To test significance, we
grouped the LU and LTS into categories of low
(<0.5 t ha�1 a�1), medium (0.5–3 t ha�1 a�1) and high
(>3 t ha�1 a�1) erosion sites (Table 3). Contouring is an
important erosion control measure. However, the imple-
mentation of contouring alone did not significantly reduce
erosion, nor did the implementation of SAF alone. Only
when both measures were combined, statistical analysis
suggests significant reductions in erosion at medium (0.5–
3 t ha�1 a�1) and high (>3 t ha�1 a�1) erosion sites. Results
at the LU-scale suggest that on medium erosion sites,
combining SAF and contouring could significantly reduce
erosion by up to 80% (from 1.6 to 0.3 t ha�1 a�1) for both
tree densities and land types studied (Table 3a). Approxi-
mately the same order of magnitude of reduction was

J.H.N. Palma et al. / Agriculture, Ecosystems and Environment 119 (2007) 320–334328
Table 3
Effect on average soil loss (t ha�1 a�1) of non-contour and contouring practices with arable cropping, and silvoarable agroforestry with 50 trees ha�1 (SAF50)
and 113 trees ha�1 (SAF113), for low, medium, and high erosion sites on (a) the best and worst quality land at plot (land unit) scale and (b) on 10 and 50% of the
worst or best quality land at the farm (landscape test site) scale
Low (<0.5 t ha�1) Medium High (>3 t ha�1)
Worst Best Worst Best Worst Best
(a) Land unit scale
Non-contouring
Arable 0.4 0.3 1.5b 1.6b 5.8ab 7.0b
SAF50 0.3 0.3 1.2ab 1.3ab 5.2ab 4.2ab
SAF113 0.3 0.3 1.1ab 1.1ab 4.7ab 3.8ab
Contouring
Arable 0.1 0.2 0.9ab 0.9ab 3.8ab 4.5ab
SAF50 0.1 0.1 0.3a 0.3a 1.4a 1.1a
SAF113 0.1 0.1 0.3a 0.3a 1.3a 1.0a
n 4 5 7 5 4 5
Statistically significant NS * ***
(b) Landscape test site scale
Non-contouring
Arable 0.3 1.7c 5.6
SAF50 10% 0.3 0.3 1.7bc 1.6abc 5.6 5.4
SAF50 50% 0.3 0.3 1.6abc 1.3abc 5.2 4.3
SAF113 10% 0.3 0.3 1.7abc 1.6abc 5.5 5.3
SAF113 50% 0.2 0.3 1.5abc 1.3abc 4.9 4.2
Contouring
Arable 0.2 0.9c 3.6
SAF50 10% 0.2 0.2 0.9abc 0.8abc 3.3 3.2
SAF50 50% 0.1 0.1 0.7abc 0.6ab 2.3 2.3
SAF113 10% 0.1 0.2 0.9abc 1.1abc 3.3 3.2
SAF113 50% 0.1 0.1 0.6abc 0.6a 2.3 2.2
n 8 7 4
Statistically significant NS * NS
Different letters (a–c) in the exponent indicate statistical difference (Tukey HSD) of the scenarios within each group (low, medium or high) at p < 0.05 (*) and
p < 0.001 (***); NS, not significant.
calculated for the high erosion sites for both tree densities,
but the effect was only significant ( p < 0.05) on the best
quality land.
When LU-scale results were aggregated to the farm-
scale, the only significant reduction occurred at medium
erosion sites, where soil erosion was reduced by up to 65%
when SAF was combined with contouring over 50% of the
farm, on the best quality land, and at both 50 and
113 trees ha�1 (Table 3b). A similar effect was expected at
high erosion sites. However, the number of samples
(n = 4) and the high variability of the results (between 3.4
and 9.7 t ha�1 a�1) prevented the results from being
statistically significant. Similar relative reductions in
erosion rates have been found after the introduction of
hedgerow intercropping, where soil erosion was reduced
by up to 90% on gentle slopes in Nigeria, and by 45–65%
on steep slopes in maize systems in Colombia (Young,
1989).
RUSLE does not account for gully erosion. In fact,
implementing SAF without contouring could increase the
probability of gully erosion along the tree strips, due to the
greater erosivity of water drops under the tree canopy
(Young, 1989; McDonald et al., 2003), reducing or negating
any positive impact of SAF systems on soil erosion.
Nevertheless, the orientation of tree lines along the contour
level would avoid this negative impact (Seobi et al., 2005).
An aspect, which we did not investigate, is the risk of land
slide processes, particularly important in slopes with soils
consisting of layered clays. Although not modeled, the
presence of trees in such areas could lower the risk of land
sliding (Sidle et al., 2006).
3.2. Nitrate leaching
Nitrate leaching to groundwater strongly depends on the
soil water balance. In regions or years of low rainfall, water
may not be transported below the root zone because
evapotranspiration exceeds precipitation (Lehmann and
Schroth, 2003). Such patterns of rainfall, typical of
Mediterranean areas, were found at the Spanish LTS
(Table 1), where for the arable status quo, nitrogen leaching
was at most minimal (Table 2, ALC and CAM). These
results agree with the general observation that leaching from
deep soils under rainfed agriculture in Mediterranean
climates is negligible (Seligman et al., 1992; Sadras,
2002). For the Atlantic zone, predicted nitrogen leaching in
J.H.N. Palma et al. / Agriculture, Ecosystems and Environment 119 (2007) 320–334 329
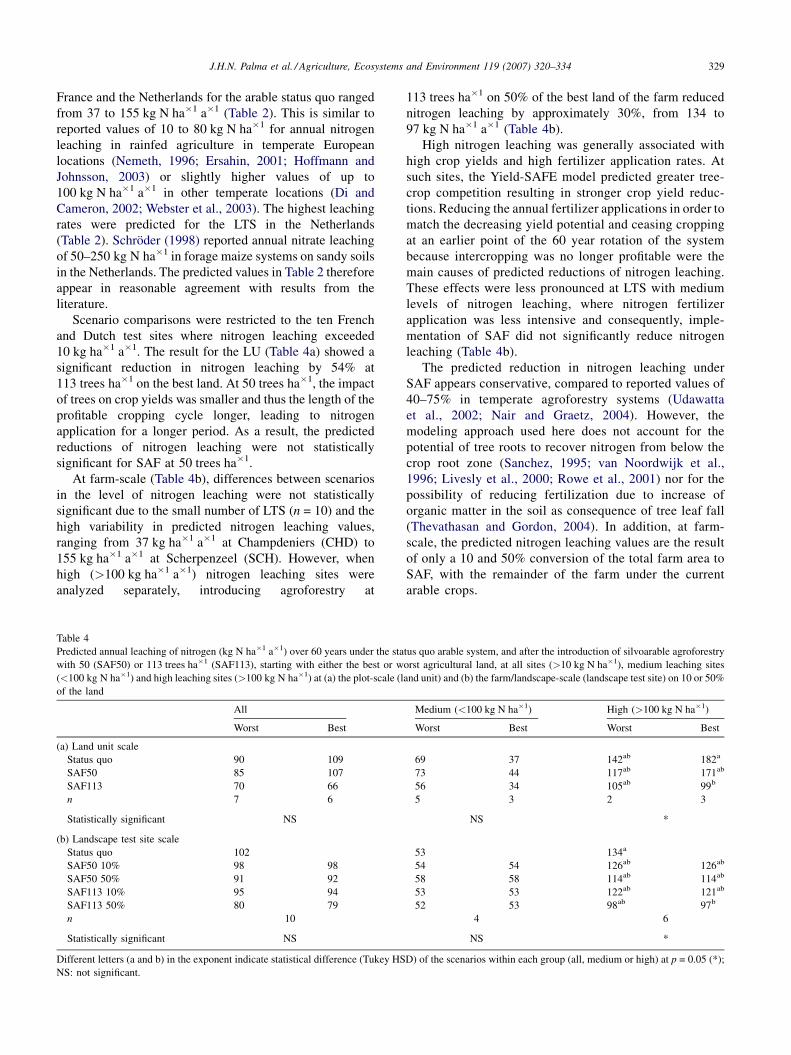
France and the Netherlands for the arable status quo ranged
from 37 to 155 kg N ha�1 a�1 (Table 2). This is similar to
reported values of 10 to 80 kg N ha�1 for annual nitrogen
leaching in rainfed agriculture in temperate European
locations (Nemeth, 1996; Ersahin, 2001; Hoffmann and
Johnsson, 2003) or slightly higher values of up to
100 kg N ha�1 a�1 in other temperate locations (Di and
Cameron, 2002; Webster et al., 2003). The highest leaching
rates were predicted for the LTS in the Netherlands
(Table 2). Schroder (1998) reported annual nitrate leaching
of 50–250 kg N ha�1 in forage maize systems on sandy soils
in the Netherlands. The predicted values in Table 2 therefore
appear in reasonable agreement with results from the
literature.
Scenario comparisons were restricted to the ten French
and Dutch test sites where nitrogen leaching exceeded
10 kg ha�1 a�1. The result for the LU (Table 4a) showed a
significant reduction in nitrogen leaching by 54% at
113 trees ha�1 on the best land. At 50 trees ha�1, the impact
of trees on crop yields was smaller and thus the length of the
profitable cropping cycle longer, leading to nitrogen
application for a longer period. As a result, the predicted
reductions of nitrogen leaching were not statistically
significant for SAF at 50 trees ha�1.
At farm-scale (Table 4b), differences between scenarios
in the level of nitrogen leaching were not statistically
significant due to the small number of LTS (n = 10) and the
high variability in predicted nitrogen leaching values,
ranging from 37 kg ha�1 a�1 at Champdeniers (CHD) to
155 kg ha�1 a�1 at Scherpenzeel (SCH). However, when
high (>100 kg ha�1 a�1) nitrogen leaching sites were
analyzed separately, introducing agroforestry at
Table 4
Predicted annual leaching of nitrogen (kg N ha�1 a�1) over 60 years under the sta
with 50 (SAF50) or 113 trees ha�1 (SAF113), starting with either the best or w
(<100 kg N ha�1) and high leaching sites (>100 kg N ha�1) at (a) the plot-scale (l
of the land
All
Worst Best
(a) Land unit scale
Status quo 90 109
SAF50 85 107
SAF113 70 66
n 7 6
Statistically significant NS
(b) Landscape test site scale
Status quo 102
SAF50 10% 98 98
SAF50 50% 91 92
SAF113 10% 95 94
SAF113 50% 80 79
n 10
Statistically significant NS
Different letters (a and b) in the exponent indicate statistical difference (Tukey HS
NS: not significant.
113 trees ha�1 on 50% of the best land of the farm reduced
nitrogen leaching by approximately 30%, from 134 to
97 kg N ha�1 a�1 (Table 4b).
High nitrogen leaching was generally associated with
high crop yields and high fertilizer application rates. At
such sites, the Yield-SAFE model predicted greater tree-
crop competition resulting in stronger crop yield reduc-
tions. Reducing the annual fertilizer applications in order to
match the decreasing yield potential and ceasing cropping
at an earlier point of the 60 year rotation of the system
because intercropping was no longer profitable were the
main causes of predicted reductions of nitrogen leaching.
These effects were less pronounced at LTS with medium
levels of nitrogen leaching, where nitrogen fertilizer
application was less intensive and consequently, imple-
mentation of SAF did not significantly reduce nitrogen
leaching (Table 4b).
The predicted reduction in nitrogen leaching under
SAF appears conservative, compared to reported values of
40–75% in temperate agroforestry systems (Udawatta
et al., 2002; Nair and Graetz, 2004). However, the
modeling approach used here does not account for the
potential of tree roots to recover nitrogen from below the
crop root zone (Sanchez, 1995; van Noordwijk et al.,
1996; Livesly et al., 2000; Rowe et al., 2001) nor for the
possibility of reducing fertilization due to increase of
organic matter in the soil as consequence of tree leaf fall
(Thevathasan and Gordon, 2004). In addition, at farm-
scale, the predicted nitrogen leaching values are the result
of only a 10 and 50% conversion of the total farm area to
SAF, with the remainder of the farm under the current
arable crops.
tus quo arable system, and after the introduction of silvoarable agroforestry
orst agricultural land, at all sites (>10 kg N ha�1), medium leaching sites
and unit) and (b) the farm/landscape-scale (landscape test site) on 10 or 50%
Medium (<100 kg N ha�1) High (>100 kg N ha�1)
Worst Best Worst Best
69 37 142ab 182a
73 44 117ab 171ab
56 34 105ab 99b
5 3 2 3
NS *
53 134a
54 54 126ab 126ab
58 58 114ab 114ab
53 53 122ab 121ab
52 53 98ab 97b
4 6
NS *
D) of the scenarios within each group (all, medium or high) at p = 0.05 (*);

J.H.N. Palma et al. / Agriculture, Ecosystems and Environment 119 (2007) 320–334330
3.3. Carbon sequestration
Carbon sequestration was calculated for SAF only, since
the primary difference in sequestration between arable and
SAF systems is due to carbon immobilization in tree
biomass (Alegre et al., 2004). Although additional carbon
can also be stored in the soil due to leaf fall (Dixon, 1995;
Montagnini and Nair, 2004) and in the vegetation strip along
the tree line, these processes were not considered and
therefore our values can be considered conservative. For the
estimates, belowground tree biomass was estimated from the
aboveground tree biomass calculated by Graves et al. (in
press) and van der Werf et al. (in press), using allometric
relationships Palma et al. (in press). Sequestration varied in
dependence of the tree species selected for each LTS. Under
the most favorable scenario (113 trees ha�1 on 50% in the
best quality land) sequestration varied from 0.08 to
0.47 t C ha�1 a�1 for slow growing trees (holm oak and
stone pine), from 0.54 to 0.89 t C ha�1 a�1 for moderately
fast growing trees (wild cherry and walnut), and from 2.1 to
3.0 t C ha�1 a�1 for fast growing trees (poplar). By year 60,
total sequestration was between 5 and 29 t C ha�1, 32 and
54 t C ha�1 and 126 and 179 t C ha�1 for slow, moderately
fast and fast growing trees, respectively (Table 2). These
values are within the range of 3–60 t C ha�1 (Kursten, 2000)
or 15–198 t C ha�1 (Dixon et al., 1994) for agroforestry
systems and 190 t C ha�1 in poplar forests reported for
typical tree rotations (van Kooten, 2000; van Kooten et al.,
2002; McKenney et al., 2004).
The overall analysis does not show statistically significant
differences between tree densities (Table 5a). Lower tree
densities result in higher biomass per tree (Balandier and
Dupraz, 1998; Graves et al., in press; van der Werf et al., in
Table 5
Predicted additional carbon sequestration (t C ha�1) after 60 years, relative to
113 trees ha�1(SAF113) is introduced on the worst or best quality land for slow gr
cherry, hybrid walnut and poplar) at (a) land unit or (b) landscape test site scale
All
Worst Best
(a) Land unit scale
Status quo 0
SAF50 61 45
SAF113 67 82
n 15 15
Statistically significant NS
(b) Landscape test site scale
Status quo 0
SAF50 10% 7.8a 11.7a
SAF50 50% 28.5bc 43.9bc
SAF113 10% 10.7a 15.5ac
SAF113 50% 39.9b 60b
n 19
Statistically significant *
Different letters (a–d) in the exponent indicate statistical difference (Tukey HSD
growing) at p = 0.05 (*); NS: not significant. The status quo scenario was not in
press), somewhat compensating for the low tree density.
However, for slow growing trees, carbon sequestration is
significantly higher for high tree densities (Table 5a) and
when SAF is implemented in a large portion (50%) of the farm
(Table 5b). With medium–fast growing tree species, these
significant differences do not occur due to a higher variability
of carbon sequestration of medium (hybrid walnut and wild
cherry) and fast growing trees (poplar). No differences in
sequestration were found between SAF systems established
on high or low quality land, although sequestration was
consistently somewhat higher on the best land. At farm-scale,
significant differences in sequestration were only found
between SAF on 10 or 50% of the farm (Table 5b).
3.4. Landscape biodiversity
The habitat index Ihab; Palma et al. (in press) expresses
landscape biodiversity by relating the share of natural and
semi-natural habitats to the total area of a given landscape.
The introduction of rows of trees in homogeneous arable
areas increases the structural diversity of the landscape,
which potentially increases its species diversity (Peng et al.,
1993; Burgess, 1999; Middleton, 2001; Smart et al., 2002).
The effect of SAF on 10 and 50% of the farm was examined
assuming that hypothetical farms were representative of land
use in the LTS.
The introduction of SAF increased Ihab for all LTS, with
the largest increase in areas of low shares of existing natural
or semi-natural habitat. The current Ihab of the LTS varied
from low values (Ihab < 10%) in homogeneous agricultural
landscapes (e.g. Table 2, OCA, CHT, BAL) to high values
(Ihab > 60%) in more heterogeneous areas (e.g. Table 2,
ALC, ALM, CAR). Ihab—values of around 10% increased
that in an arable control, when agroforestry with either 50 (SAF50) or
owing trees (holm oak and stone pine) and medium–fast growing trees (wild
Slow growing Medium–fast growing
Worst Best Worst Best
0 0
14a 16ab 81 106
27bc 31c 112 133
8 7 7 8
* NS
0 0
1.7a 1.8a 13.3a 20.7ad
8.9b 9.5b 46.1bcd 74.9bc
3.4a 3.5a 17.2a 26.3abd
17.3c 18.4c 60.1bc 96.5c
9 10
* *
) of the scenarios within each group (all, slow growing and medium–fast
cluded in the statistical analysis.

J.H.N. Palma et al. / Agriculture, Ecosystems and Environment 119 (2007) 320–334 331
by a factor of 4 (e.g. CAM), while Ihab—values of around
80% increased by about a factor of only 1.15 (e.g. ALC).
Mean Ihab of all LTS under the status quo was 25%. With
10% of the land under SAF, Ihab increased by a factor of 1.28,
but significant differences ( p < 0.01) were only found when
SAF was implemented on 50% of the farm, increasing Ihab
by a factor of 2.6 (Ihab = 62%).
The habitat index approach can be considered a general
and easy method for estimating landscape biodiversity,
because it follows the generally accepted principle that
landscape heterogeneity favors most taxa (Forman and
Godron, 1986). Trees can provide a habitat for some bird,
arthropod and small mammal species which otherwise
cannot inhabit arable landscapes (Peng et al., 1993; Klaa
et al., 2005). The grassy or herbaceous strips below the trees
consist of either sown plant species or arable weeds. Their
contribution to species diversity is equally important, but
will depend strongly on management (Griffiths et al., 1998;
Burgess et al., 2003); a factor not assessed here. The method
does not differentiate between SAF systems at different
densities. Subsequent analyses should refine the approach
and consider the characteristics and requirements of specific
landscapes.
3.5. European-scale implications
Reisner et al. (in press) identified 90 million ha (Mha) of
European arable land potentially suitable for SAF systems
using hybrid walnut, wild cherry, poplar, holm oak and stone
pine. Within this area, the study identified 65 Mha where SAF
could potentially reduce soil erosion and nitrogen leaching,
and increase landscape biodiversity. Our investigation
addresses the potential extent of those environmental benefits
of SAF systems, also including carbon sequestration.
Eight million hectares of European arable land are
seriously threatened by erosion (Reisner et al., in press) and
SAF, with one of the five tree species examined here, could
potentially be implemented on 2.6 Mha of this land (Reisner
et al., in press). If farmers in these areas would combine SAF
with contouring on the best 50% of their farm land, soil
erosion could be reduced by as much as 65%.
Nitrogen leaching could be reduced on 12 Mha of land
(Reisner et al., in press) through use of SAF, mainly in
central and northern Europe. These reductions could
potentially be as high as 28%, if SAF was implemented
at high densities (113 trees ha�1) on 50% of the best
farmland. In addition, nitrogen uptake below the root zone of
annual crops might further reduce nitrogen leaching at these
sites, although this has not been considered here and requires
future investigations.
Carbon sequestration could also be increased on the
90 Mha of European arable land potentially suitable for SAF
(Reisner et al., in press). The use of medium–fast growing
tree species in SAF systems, when implemented on 50% of
the agricultural land, could contribute 46–96 t C ha�1 (0.77–
1.6 t C ha�1 a�1) to sequestration over a 60-year period.
However, values up to 179 t C ha�1 (3 t C ha�1 a�1) are
potentially feasible. Our assessment of potential carbon
sequestration differs from that of the European Climate
Change Program (ECCP), which estimates that less than
1 million ha of land in Europe is suitable for agroforestry,
and that no net change in annual carbon balance will occur
by 2010 (ECCP, 2003). However, this represents a
medium-term perspective. The actual adoption of SAF
will depend on both, its profitability and its legal status,
which could change in the coming years, stimulating the
uptake of SAF systems by European farmers (Lawson
et al., 2004, 2005).
Monotonous arable landscapes, defined by Reisner et al.
(in press) as areas where arable land covers over 50% of the
total land area in a 25 km2 area, cover about 100 Mha in
Europe (Reisner et al., in press). Approximately 21 Mha of
this land would be suitable for SAF using one of the five tree
species tested here, which could significantly increase
landscape biodiversity. This broad assessment, however,
needs further refinement by taking into account specific
landscape characteristics on the one hand and target species
on the other hand. Baldi et al. (2005) and Stoate et al. (2003)
have shown that it is impossible to design a management
scheme that favors all species. Moreover, for some steppic
wildlife species, open rather than structured landscapes are
required (e.g. Otis tarda L.), and some regions, such as
Brandenburg (northern Germany) are traditionally char-
acterized by large open fields with specific combinations of
fauna and flora.
4. Conclusion
The results for 19 randomly selected LTS in Spain,
France, and the Netherlands showed that adoption of
silvoarable agroforestry systems can potentially lead to
reduced soil erosion and nitrogen leaching and increased
carbon sequestration and landscape biodiversity. The extent
of the modifications depends on the characteristics of
individual sites and the management of the SAF system
proposed for each location. Predicted environmental benefits
were highest when SAF was implemented on large areas (i.e.
50% of the farm/landscape) on high quality land, where
current agricultural practices are most intensive and thus
associated with higher levels of soil erosion and nitrogen
leaching. Tree density (50 or 113 trees ha�1) appears less
important, as in stands of lower density biomass production
per tree is higher, reducing the difference in values of the
indicators on an area basis.
Agroforestry systems are highly diverse. We only
examined five tree species in combination with five crops
but, of course, many more tree species and crop types can
and should be considered. Their choice and the manifold
possible layouts of the system with respect to the density and
arrangement need to be adapted to local conditions and
farmer’s preferences. All those options can only be fully
J.H.N. Palma et al. / Agriculture, Ecosystems and Environment 119 (2007) 320–334332
explored with modeling approaches. Such models, however,
must be validated on the basis of experimental data from
these systems and such data are scarce.
In Europe, new land-use systems should (also) yield
environmental benefits. The results presented here increase
our understanding of the environmental benefits that can
be expected from modern agroforestry systems and
complement an economic analysis of such systems by
Graves et al. (in press) for the same test sites. Further
analysis will address the integrated economic and
environmental evaluation of the benefits and drawbacks
of SAF systems.
Acknowledgements
Part of this study was funded through the European Union
5th Framework contract QLK5-2001-00560 and the Swiss
State Secretariat for Education and Research contract
00.0158. The authors wish to thank Ramon Elena Rosello
for authorizing the use of Spanish digital land cover data,
Juan Carlos Fernandez for assistance with Spanish LTS
digital data, Lucinda Laranjeiro for updating Spanish land-
use data, Klaas Metselaar for assisting with soil metadata,
two anonymous reviewers, and Christian Dupraz for project
guidance.
References
Alegre, J., Krishnamurthy, L., Callo-Concha, D., 2004.In: Carbon Seques-
tration by Amazonian Agroforestry Systems 1st World Congress
of Agroforestry—Book of Abstracts. University of Florida, Insti-
tute of Food and Agricultural Sciences, Orlando, USA, available at:,
p. 162.
Auclair, D., Dupraz, C., 1998. Untitled-preface. Agroforestry Syst. 43, 1–4.
Balandier, P., Dupraz, C., 1998. Growth of widely spaced trees. A case study
from young agroforestry plantations in France. Agroforestry Syst. 43,
151–167.
Baldi, A., Batary, P., Erdos, S., 2005. Effects of grazing intensity on bird
assemblages and populations of Hungarian grasslands. Agricult. Eco-
syst. Environ. 108, 251–263.
Baldock, D., Beaufoy, G., Bennet, G., Clark, J., 1993. Nature Conservation
and New Directions in the EC Common Agricultural Policy. HPC,
Arnhem.
Ball, G.H., Hall, D.J., 1965. A Novel Method of Data Analysis and Pattern
Classification. Stanford Research Institute, Menlo Park, California.
Bolanos, F., Garcia del Barrio, J., Gonzalez Avila, S., Elena-Rosello, R.,
2003. REDPARES—red de Paisajes Rurales Espanoles - una herra-
mienta basica para el estudio de los paisajes forestales de Espana.
Montes 73, 50–58.
Bouma, J., Varallyay, G., Batjes, N.H., 1998. Principal land use changes
anticipated in Europe. Agricult. Ecosyst. Environ. 67, 103–119.
Bugter, R.J.F., Burel, F., Cerny, M., Edwards, P.J., Herzog, F., Maelfait,
J.P., Klotz, S., Simova, P., Smulders, R., Zobel, M., 2001. Vulner-
ability of biodiversity in the agro-ecosystems as influenced by green
veining, land-use intensity: the EU project GREENVEINS. In: Man-
der, U., Printsmann, A., Palang, H. (Eds.), Development of European
Landscapes. Proceedings of the International Association for Land-
scape Ecology, vol. 92, Tartu, Publicationes Instituti Geographici
Universitatis Tartuensis, pp. 632–637.
Burgess, P., Graves, A., Metselaar, K., Stappers, R., Keesman, K., Palma, J.,
Mayus, M., van der Werf, W., 2004a. Description of Plot-SAFE Version
0.3. Cranfield University, Silsoe, UK, 52 pp., unpublished.
Burgess, P.J., 1999. Effects of agroforestry on farm biodiversity in the UK.
Scottish Forestry 53, 24–27.
Burgess, P.J., Incoll, L.D., Corry, D.T., Beaton, A., Hart, B.J., 2004b.
Poplar (Populus spp.) growth and crop yields in a silvoarable experi-
ment at three lowland sites in England. Agroforestry Syst. 63,
157–169.
Burgess, P.J., Incoll, L.D., Hart, B.J., Beaton, A., Piper, R.W., Seymour, I.,
Reynolds, F.H., Wright, C., Pilbeam, D.J., Graves, A.R., 2003. The
Impact of Silvoarable Agroforestry with Poplar on Farm Profitability
and Biological Diversity. Final Project report to DEFRA, available at:
http://sciencesearch.defra.gov.uk/Document.aspx?DocumentID=641.
Centeri, C., 2003. In situ soil erodibility values versus calculations. In:
Gabriels, D., Cornelis, W. (Eds.), 25 Years of Assessment of Erosion—
International Symposium, International Center for Eremology, Univer-
sity of Ghent, Ghent, pp. 135–140.
Conrad, O., 1998. Derivation of hydrologically significant parameters from
digital terrain models. Thesis. Department for Physical Geography,
University of Gottingen, Gottingen, available at: http://www.geo-
gr.uni-goettingen.de/pg/saga/digem/.
Di, H., Cameron, K., 2002. Nitrate leaching in temperate agroecosystems:
sources, factors and mitigating strategies. Nutr. Cycl. Agroecosyst. 64,
237–256.
Dixon, R.K., 1995. Agroforestry systems—sources or sinks of greenhouse
gases? Agroforestry Syst. 31, 99–116.
Dixon, R.K., Winjum, J.K., Andrasko, K.J., Lee, J.J., Schroeder, P.E., 1994.
Integrated land-use systems—assessment of promising agroforest and
alternative land-use practices to enhance carbon conservation and
sequestration. Clim. Change 27, 71–92.
Dupraz, C., Newman, S., 1997. Temperate agroforestry: the European way.
In: Gordon, A., Newman, S. (Eds.), Temperate Agroforestry Systems.
CAB International, Cambridge, pp. 181–236.
EC, 2003. FADN—Farm Accountancy Data Network, European Commis-
sion, available at: http://www.europa.eu.int/comm/agriculture/rica/dwh/
index_en.cfm.
ECCP, 2003. Working Group on Forest Sinks—Final Report. Conclusions
and Recommendations Regarding Forest Related Sinks & Climate
Change Mitigation. EU Comission, Brussels, available at: http://euro-
pa.eu.int/comm/environment/climat/pdf/forest_sinks_final_report.pdf.
Eichhorn, M., Paris, P., Herzog, F., Incoll, L., Liagre, F., Mantzanas, K.,
Mayus, M., Moreno Marcos, G., Pilbeam, D., 2006. Silvoarable Agri-
culture in Europe—Past, Present and Future. Agroforestry Syst. 67,
29–50.
Ersahin, S., 2001. Assessment of spatial variability in nitrate leaching to
reduce nitrogen fertilizer impact on water quality. Agricult. Water
Manage. 48, 179–189.
Feldwisch, N., Frede, H., Hecker, F., 1998. Verfahren zum Abschatzen der
Erosions und Auswaschungsgefahr. In: Frede, H., Dabbert, S. (Eds.),
Handbuch zum Gewasserschutz in der Landwirtschaft. Ecomed,
Landsberg, pp. 22–57.
Forman, R., Godron, M., 1986. Landscape Ecology. John Wiley & Sons,
New York/Chichester/Brisbane/Toronto/Singapore, 619 pp.
GDS, 2005. Database of Historical Climate Data Compiled by Global Data
Systems. United States Department of Agriculture World Weather
Board from World Meteorological Organisation Climate Reporting
Systems, available at: http://hydrolab.arsusda.gov/nicks/nicks.htm.
Gifford, R., 2000a. Carbon Content of Woody Roots: Revised Analysis and
a Comparison with Woody Shoot Components. National Carbon
Accounting System Technical Report No. 7 (Revision1). Australian
Greenhouse Office, Canberra, 10 pp.
Gifford, R., 2000b. Carbon Contents of Above-Ground Tissues of Forest and
Woodland Trees. National Carbon Accounting System, Technical
Report No. 22. Australian Greenhouse Office, Canberra, 24 pp.
Graves, A., Burgess, P., Palma, J., Herzog, F., Moreno, G., Bertomeu, M.,
Dupraz, C., Liagre, F., Keesman, K., van der Werf, W. The development

J.H.N. Palma et al. / Agriculture, Ecosystems and Environment 119 (2007) 320–334 333
and application of bio-economic modelling for silvoarable systems in
Europe. Ecol. Eng., in press.
Griffiths, J., Phillips, D.S., Compton, S.G., Wright, C., Incoll, L.D., 1998.
Responses of slug numbers and slug damage to crops in a silvoarable
agroforestry landscape. J. Appl. Ecol. 35, 252–260.
Grubler, A., 1994. Technology. In: Meyer, W., Turner, B. (Eds.), Changes in
Land Use and Land Cover. Cambridge University Press, Cambridge, pp.
287–328.
Herzog, F., 1998. Streuobst: a traditional agroforestry system as a model for
agroforestry development in temperate Europe. Agroforestry Syst. 42,
61–80.
Herzog, F., Reisner, Y., Palma, J.H.N., 2004. Working Visit Report on
Upscaling for Nine Landscape Test Sites in Spain. Agroscope FAL
Reckenholz, Zurich, unpublished.
Hoffmann, M., Johnsson, H., 2003. Test of a modelling system for estimat-
ing nitrogen leaching—a pilot study in a small agricultural catchment.
Environ. Model. Assessment 8, 15–23.
IPCC, 1996. Revised 1996 IPCC Guidelines for National Greenhouse Gas
Inventories: Reference Manual, available at: http://www.ipcc-nggip.i-
ges.or.jp/public/gl/guidelin/ch5ref3.pdf.
Klaa, K., Mill, P.J., Incoll, L.D., 2005. Distribution of small mammals in a
silvoarable agroforestry system in Northern England. Agroforestry Syst.
63, 101–110.
Kleijnen, J., 1987. Statistical Tools for Simulation Practicioners. Marcel
Dekker Inc., New York/Basel, p. 429.
Kursten, E., 2000. Fuelwood production in agroforestry systems for sus-
tainable land use and CO2-mitigation. Ecol. Eng. 16, S69–S72.
Lane, L., Nearing, M., 1995. USDA-Water Erosion Prediction Project
(WEPP): Hillslope Profile and Watershed Model Documentation.
NSERL Report #10. USDA-ARS, West Lafayette, 269 pp., available
at: http://topsoil.nserl.purdue.edu/nserlweb/weppmain/docs/readme.htm.
Lawson, G., Burgess, P., Crowe, R., Mantzanas, K., Mayus, M., Moreno, G.,
McAdam, J.H., Newman, S., Pisanelli, A., Schuman, F., Sibbald, A.R.,
Sinclair, F.L., Thomas, T., Waterhouse, A., 2004.In: Policy Support for
Agroforestry in the European Union 1st World Congress of Agrofor-
estry—Book of Abstracts. Orlando, USA, University of Florida,
Institute of Food and Agricultural Sciences, available at:, p. 189.
Lawson, G., Dupraz, C., Liagre, F., Moreno, G., Paris, P., Papanastasis, V.,
2005. Options for Agroforestry Policy in the European Union. Deliver-
able 9.3. SAFE—EU Research Project Contract QLK5-CT-2001-00560,
34 pp., available at: http://www.montpellier.inra.fr/safe/.
Lehmann, J., Schroth, G., 2003. Nutrient leaching. In: Schroth, G., Sinclair,
F. (Eds.), Trees, Crops and Soil Fertility. CABI Publishing, Wallingford,
pp. 151–166.
Livesly, S.J., Gregory, P.J., Buresh, R.J., 2000. Competition in tree row
agroforestry systems I. Distribution and dynamics of fine root length and
biomass. Plant Soil 227, 149–161.
MAPYA, 1999. SIG Oleıcola Espanol. MAPYA—Ministerio de Agricul-
tura, Pesca y Alimentacion, Madrid, available at: http://w3.mapya.es/
dinatierra_v3/.
McDonald, M., Lawrence, A., Shrestha, P., 2003. Soil erosion. In: Schroth,
G., Sinclair, F. (Eds.), Trees, Crops and Soil Fertility. CABI Publishing,
Wallingford, pp. 325–343.
McKenney, D., Yemshanov, D., Fox, G., Ramlal, E., 2004. Cost estimates
for carbon sequestration from fast growing poplar plantations in Canada.
Forest Policy Econ. 6, 345–358.
Mermut, A.R., Eswaran, H., 2001. Some major developments in soil science
since the mid-1960s. Geoderma 100, 403–426.
Metzger, M., Bunce, R., Jongman, R., Mucher, S., Watkins, J.W., 2005. A
climatic stratification of the environment of Europe. Global Ecol.
Biogeogr. 14, 549–563.
Middleton, H., 2001. Agroforestry and its effects on ecological guilds and
arthropod diversity. M.Sc. Thesis. Faculty of Forestry, University of
Toronto, Ontario.
Mobbs, D., Lawson, G., Brown, T., 2001. HyPARv4.1 Model for Agrofor-
estry Systems User Guide. Centre for Ecology and Hydrology, Edin-
burgh, available at: www.nbu.ac.uk/hypar/.
Montagnini, F., Nair, P.K.R., 2004. Carbon sequestration: An under-
exploited environmental benefit of agroforestry systems. Agroforestry
Syst. 61, 281–295.
Morgan, R.P.C., 1995. Soil Erosion and Conservation. Longman, Harlow,
UK, p. 198.
Mucher, C.A., 2000. Development of a Consistent Methodology to Derive
land Cover Information on a European Scale from Remote Sensing for
Environmental Modelling. PELCOM Project. Final Report. EU Con-
tract No. ENV4-CT96-0315, 299 pp.
Nair, V.D., Graetz, D.A., 2004. Agroforestry as an approach to minimizing
nutrient loss from heavily fertilized soils: the Florida experience.
Agroforestry Syst. 61, 269–279.
Nemeth, T., 1996. Nitrogen balances in long-term field experiments.
Fertilizer Res. 43, 13–19.
Olea, L., Figuera, F., 1999. Dehesa ecosystem: production and preservation.
In: Etienne, M. (Ed.), Dynamics and Sustainability of Mediterranean
Pastoral Systems. CIHEAM-IAMZ, Zaragoza, pp. 239–246.
Palma, J., Herzog, F., Reisner, Y., Graves, A., Burgess, P., Keesman, K., van
Keulen, H., Mayus, M., De Filippi, R., Bunce, R. Methodological
approach for the assessment of environmental effects of agroforestry
at the landscape scale. Ecol. Eng., in press.
Palma, J.H.N., Reisner, Y., 2004. Working Visit Report on Upscaling for
Seven Landscape Test Sites in France. Agroscope FAL Reckenholz,
Zurich, 15 pp., unpublished.
Peng, R.K., Incoll, L.D., Sutton, S.L., Wright, C., Chadwick, A., 1993.
Diversity of airborne arthropods in a silvoarable agroforestry system. J.
Appl. Ecol. 30, 551–562.
Poulton, R., 1995. The importance of long-term trials in understanding
sustainable farming systems: the Rothamsted experience. Aust. J. Exp.
Agricult. 35, 825–834.
Reisner, Y., 2004. Working Visit Report on Upscaling for Three Landscape
Test Sites in The Netherlands. Agroscope FAL Reckenholz. Zurich, 9
pp., unpublished.
Reisner, Y., De Filippi, R., Palma, J., Herzog, F. Target regions for
silvoarable agroforestry in Europe. Ecol. Eng., in press.
Reisner, Y., Freyer, B., 2006. Modelling a resource conserving agricultural
land use at regional scale. Agricult. Ecosyst. Environ., submitted for
publication.
Renard, K., Foster, G., Weesies, G., McCool, D., Yoder, D., 1997. Predicting
Soil Erosion by Water: A Guide to Conservation Planning with the
Revised Universal Soil Loss Equation (RUSLE). US Department of
Agriculture, USDA, Washington, DC (Agricultural Handbook No.703).
Richards, J.A., 1986. Remote Sensing Digital Image Analysis. An Intro-
duction. Springer-Verlag, Berlin/Heidelberg/New York.
Rowe, E.C., van Noordwijk, M., Suprayogo, D., Hairiah, K., Giller, K.E.,
Cadisch, G., 2001. Root distributions partially explain N-15 uptake
patterns in Gliricidia and Peltophorum hedgerow intercropping systems.
Plant Soil 235, 167–179.
Sadras, V., 2002. Interaction between rainfall and nitrogen fertilisation of
wheat in environments prone to terminal drought: economic and
environmental risk analysis. Field Crops Res. 77, 201–215.
Sanchez, P.A., 1995. Science in agroforestry. Agroforestry Syst. 30, 5–55.
Schroder, J., 1998. Towards improved nitrogen management in silage maize
production on sandy soils. Ph.D. Thesis. Wageningen Agricultural
University, Wageningen.
Seligman, N., van Keulen, H., Spitters, C., 1992. Weather, soil conditions and
the interannual variability of herbage production and nutrient uptake on
annual Mediterranean pastures. Agricult. Forest Meteorol. 57, 265–279.
Seobi, T., Anderson, S.H., Udawatta, S.H.P., Gantzer, C.J., 2005. Influence
of grass and agroforestry buffer strips on soil hydraulic properties for an
Albaqualf. Soil Sci. Soc. Am. J. 69, 893–901.
Sidle, R.C., Ziegler, A.D., Negishi, J.N., Nik, A.R., Siew, R., Turkelboom,
F., 2006. Erosion processes in steep terrain—truths, myths, and uncer-
tainties related to forest management in Southeast Asia. Forest Ecol.
Manage. 224, 199–225.
Smart, S.M., Bunce, R.G.H., Firbank, L.G., Coward, P., 2002. Do field
boundaries act as refugia for grassland plant species diversity in

J.H.N. Palma et al. / Agriculture, Ecosystems and Environment 119 (2007) 320–334334
intensively managed agricultural landscapes in Britain? Agricult.
Ecosyst. Environ. 91, 73–87.
Stoate, C., Araujo, M., Borralho, R., 2003. Conservation of European
farmland birds: abundance and species diversity. Ornis Hung. 12–13,
33–41.
Thevathasan, N.V., Gordon, A.M., 2004. Ecology of tree intercropping
systems in the North temperate region: experiences from southern
Ontario, Canada. Agroforestry Syst. 61, 257–268.
Udawatta, R.P., Krstansky, J.J., Henderson, G.S., Garrett, H.E., 2002.
Agroforestry practices, runoff, and nutrient loss: a paired watershed
comparison. J. Environ. Qual. 31, 1214–1225.
van der Knijff, J.M., Jones, R.J.A., Montanarella, L., 2000. Soil Erosion
Risk Assessment in Europe. European Soil Bureau, Space Applications
Institute, European Commission, European Communities, Brussels.
van der Werf, W., Keesman, K., Burgess, P., Graves, A., Pilbeam, D., Incoll,
L., Metselaar, K., Mayus, M., Stappers, R., van Keulen, H., Palma, J.,
Dupraz, C. Yield-SAFE: a parameter-sparse process-based dynamic
model for predicting resource capture, growth and production in agro-
forestry systems. Ecol. Eng., in press.
van Genuchten, M.T., 1980. A closed -form equation for predicting the
hydraulic conductivity of unsaturated soils. Soil Sci. Soc. Am. J. 44,
892–898.
van Ittersum, M., Rabbinge, R., 1997. Concepts in production ecology for
analysis and quantification of agricultural input-output combinations.
Field Crops Res. 52, 197–208.
van Keulen, H., 1982. Graphical analysis of annual crop response to
fertilizer application. Agricult. Syst. 9, 113–126.
van Kooten, G., Shaikh, S., Suchanek, P., 2002. Mitigating climate
change by planting trees: the transaction costs trap. Land Econ. 78,
559–572.
van Kooten, G.C., 2000. Economic dynamics of tree planting for carbon
uptake on marginal agricultural lands. Can. J. Agricult. Econ. 48,
51–65.
van Noordwijk, M., Lawson, G., Soumare, A., Groot, F., Hairiah, K., 1996.
Root distribution of trees and crops: competition and/or
complementary? In: Huxley, P. (Ed.), Tree-Crop Interaction: A Phy-
siological Approach. University Press, Cambridge, pp. 319–364.
van Remortel, R., Hamilton, M., Hickey, R., 2001. Estimating the LS factor
for RUSLE through iterative slope length processing of digital elevation
data within ArcInfo GRID. Cartography 30, 27–35.
Webster, C.P., Conway, J.S., Crew, A.P., Goulding, K.W.T., 2003. Nitrogen
leaching losses under a less intensive farming and environment (LIFE)
integrated system. Soil Use Manage. 19, 36–44.
Whitehead, D.C., 1995. Nitrogen Grassland. CAB International, Walling-
ford, p. 416.
Wosten, J., Lilly, A., Nemes, A., Le Bas, C., 1999. Development and use
of a database of hydraulic properties of European soils. Geoderma 90,
169–185.
Young, A., 1989. Agroforestry for Soil Conservation. CAB International,
Wallingford, UK.