Embed Size (px)
Citation preview

Quality of Life and Management of Living Resources
Silvoarable Agroforestry For Europe (SAFE)
An Introduction to the SAFE Project Database of Experimental Sites
This research was carried out as part o Europe) collaborative research proje
Quality of Life programme; contr
f the SAFE (Silvoarable Agroforestry forct. SAFE is funded by the EU under its act number QLK5-CT-2001-00560.
1

An Introduction to the SAFE Project Database Contents Introduction 3 Objectives of the database 4 Modelling silvoarable agroforestry 5 Database structure 6 Organising principles 6 Levels of information 7 Further enhancements 9 Accessing the database 11 Main Switchboard and functions 11 Maintenance and updating 13 Adding, changing and deleting records 13 General database maintenance 13 Maps and site pictures 14 Field sites 15 References 18 Credits 18
2

Introduction This booklet is a basic introduction to the contents, structure and usage of the Silvoarable Agroforestry For Europe (SAFE) Project database of experimental sites. It assumes a working knowledge of Microsoft Access, and does not contain detailed information on the experimental sites or measurement protocols, which can be obtained elsewhere (although some limited information is contained within the database itself). The database exists in two formats – Excel and Access. Due to the sheer volume of information, and the complex linkages between datasets, the use of the Excel version is not recommended. In addition, the intention is to continually update and enhance the Access database with new information over the duration of the project. Therefore it is important to use the Access version in order to ensure that the most reliable and up-to-date data is used. A full structure code in SQL 92 is also available on the SAFE website. There are two versions of the Access database, in Access 97 and 2000. These versions differ mainly in the manner in which picture files are embedded within them. For more information on linking the database to site pictures, see the ‘Maps and site pictures’ section, p. 15. It is not possible to anticipate the data extraction and processing requirements of future users of the database. This guide therefore only provides a brief summary of the available data, rather than instructions on how it may be analysed within the database itself. The overall structure of the database is described, and there are guidelines for manipulating and modifying the database, should this be necessary, on p. 14. Although trees can also be considered to produce crops (especially fruit), the term crop in this booklet and within the database itself is intended to refer to the short-lived arable or vegetable crops grown among trees within a silvoarable system. Markus Eichhorn School of Biology University of Leeds Leeds, UK LS2 9JT [email protected] 0113 343 3067
Francesco Agostini ADAS Wolverhampton Wergs Road Wolverhampton, UK WV6 8UZ [email protected] 01902 693 198
3
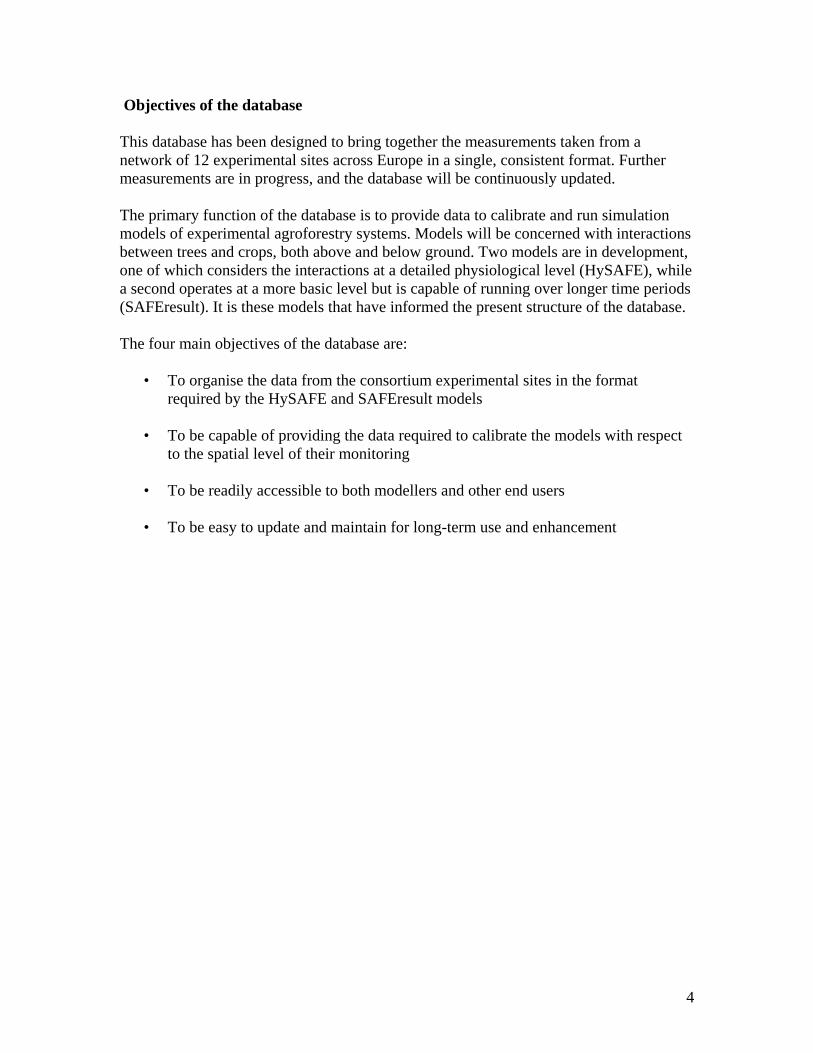
Objectives of the database This database has been designed to bring together the measurements taken from a network of 12 experimental sites across Europe in a single, consistent format. Further measurements are in progress, and the database will be continuously updated. The primary function of the database is to provide data to calibrate and run simulation models of experimental agroforestry systems. Models will be concerned with interactions between trees and crops, both above and below ground. Two models are in development, one of which considers the interactions at a detailed physiological level (HySAFE), while a second operates at a more basic level but is capable of running over longer time periods (SAFEresult). It is these models that have informed the present structure of the database. The four main objectives of the database are:
• To organise the data from the consortium experimental sites in the format required by the HySAFE and SAFEresult models
• To be capable of providing the data required to calibrate the models with respect
to the spatial level of their monitoring
• To be readily accessible to both modellers and other end users
• To be easy to update and maintain for long-term use and enhancement
4
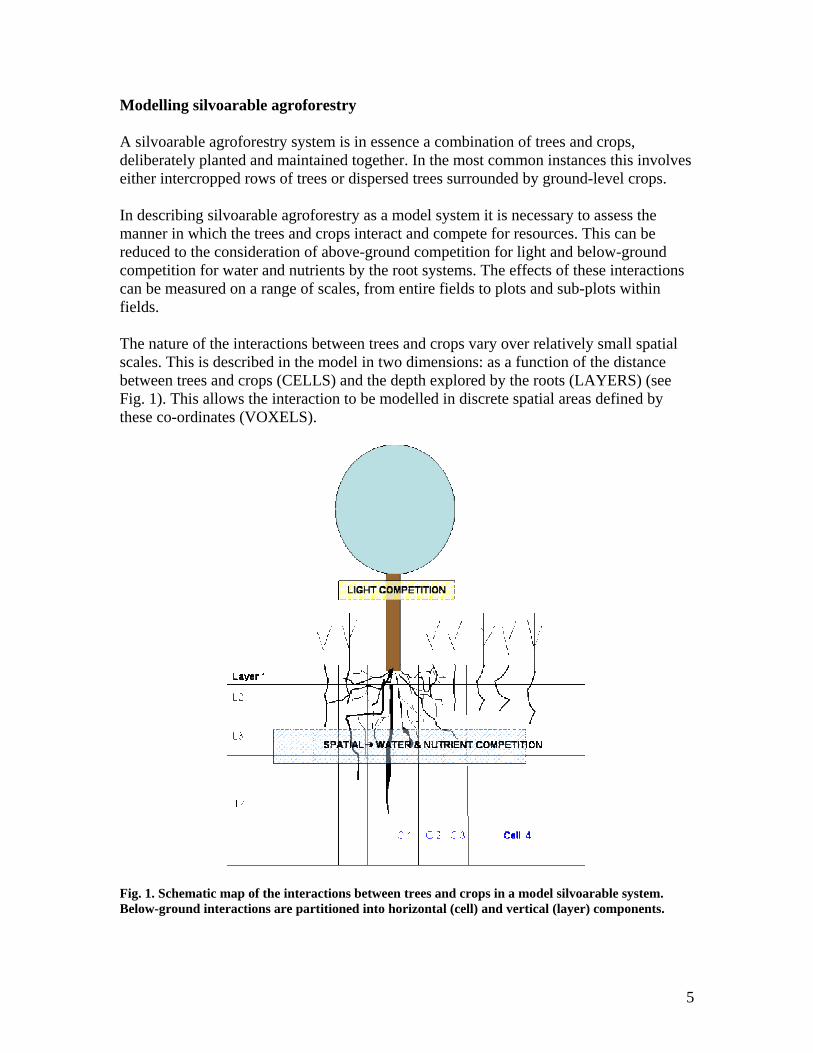
Modelling silvoarable agroforestry A silvoarable agroforestry system is in essence a combination of trees and crops, deliberately planted and maintained together. In the most common instances this involves either intercropped rows of trees or dispersed trees surrounded by ground-level crops. In describing silvoarable agroforestry as a model system it is necessary to assess the manner in which the trees and crops interact and compete for resources. This can be reduced to the consideration of above-ground competition for light and below-ground competition for water and nutrients by the root systems. The effects of these interactions can be measured on a range of scales, from entire fields to plots and sub-plots within fields. The nature of the interactions between trees and crops vary over relatively small spatial scales. This is described in the model in two dimensions: as a function of the distance between trees and crops (CELLS) and the depth explored by the roots (LAYERS) (see Fig. 1). This allows the interaction to be modelled in discrete spatial areas defined by these co-ordinates (VOXELS).
Fig. 1. Schematic map of the interactions between trees and crops in a model silvoarable system. Below-ground interactions are partitioned into horizontal (cell) and vertical (layer) components.
5

Database structure Organising principles The first step in organising a complex database is to group the variables into data families. These are intuitive combinations of related variables, defined partly by the objective of the measurements, but also the level at which they are recorded (Fig. 2). In the present case we are interested in biological (botanic data), environmental (climatic and pedogeographic data) and economic measurements, as well as descriptive measurements of the management techniques applied. These are augmented by ‘metadata’, which are the overall descriptive details of each plot.
Fig. 2. Data families as defined within the SAFE project database, with their logical connections.
6

Levels of information Although the general structure of the database is largely based upon common sense principles, it is necessary to describe it in accurate terminology in order to illustrate how such a simple schematic diagram translates into the current database. Data are organised into a Logical Data Structure (LDS), in which:
i. Each family of information is represented by one or more tables of data (‘entities’)
ii. Each variable (or descriptive label, e.g. species or management regime) is
stored in a single table column (‘attributes’)
iii. Individual data points (e.g. plots, sub-plots, trees) are stored in a single line of each table (‘records’)
iv. Data tables are linked via ‘keys’. These are variables used to link families of
data via shared attributes, and may be artificially created In effect, from a spreadsheet perspective, we have tables of data (‘entities’), divided into columns (‘attributes’) and rows (‘records’), and linked by common characteristics (‘keys’). A single record can be linked to one or more records in another table, and an attribute can be shared between several tables, thereby linking them. This is a very general draft structure for any database, and in the present context the database was constructed with the following key concepts in mind:
a. What variable is measured (e.g. tree height) b. How is it measured (units, equipment, methods, frequency, identity of the
measurer)
c. What objects are being measured
d. Locations of the objects (i.e. at what level was the measurement made – system, field, individual tree etc.)
e. Conditions (externally imposed variables whether natural, e.g. climate, or
deliberately imposed, e.g. management and experimental treatments)
f. Timing within a calendar of events For a plant-soil-environment system, such as the SAFE experimental sites, the underlying table structure can therefore be represented as shown in Fig. 3.
7
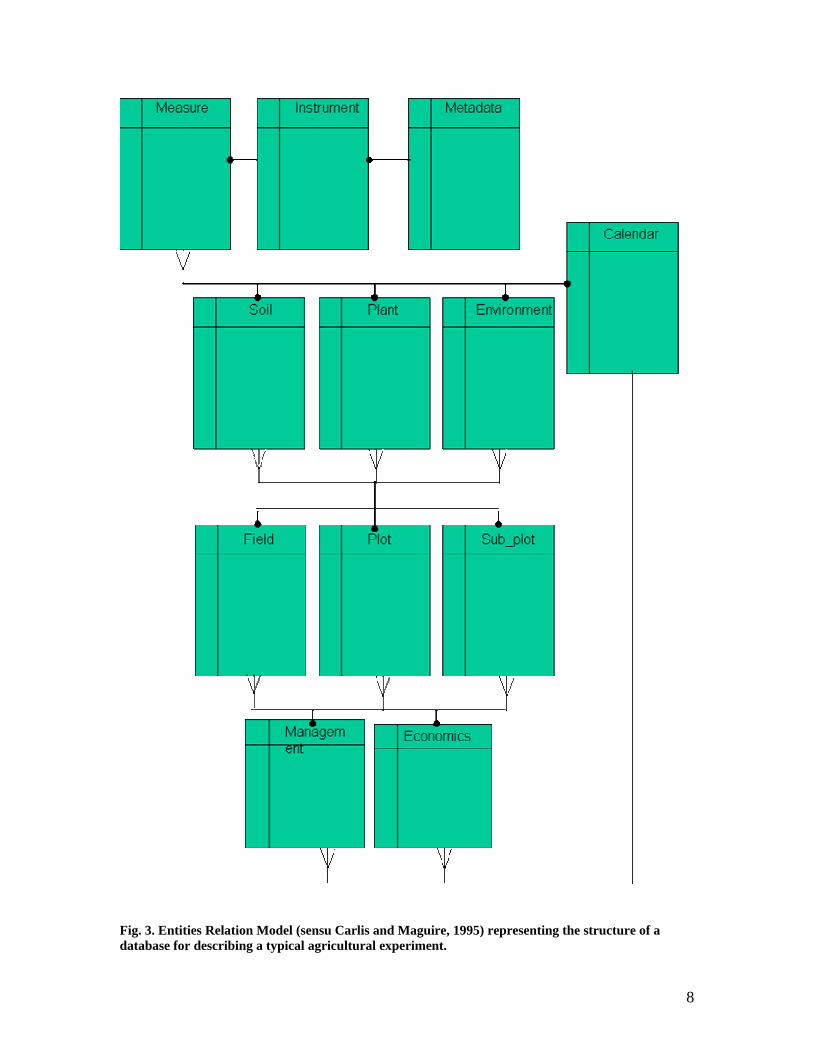
Fig. 3. Entities Relation Model (sensu Carlis and Maguire, 1995) representing the structure of a database for describing a typical agricultural experiment.
8

Further enhancements In order to improve the efficient operation of the database, various modifications to this overall design have been made.
i. Redundancy (i.e. duplication) of data within the database to increase the running speed of queries
ii. Partitioning of basic data tables (see Fig. 4)
iii. Novel keys added to records to enable linking between tables
Of necessity the resulting database therefore becomes quite complex in structure, and the final map of the SAFE database is laid out in Figure 4. From the preceding three diagrams (Figs. 2, 3 & 4) we can therefore see a transition from the simplistic Logical Data Structure (LDS) to an Entities Relation Model (ERM), and finally the specific pattern for the SAFE database. The physical structure of the database may seem some way from the original LDS but it contains the same basic information. Data are grouped according to the level of measurement, from site down to plot, cell and voxel (see Fig. 1). The descriptions of database objects and events are stored separately in linked tables. Data for model calibration have yet to be inserted (as of 13th July 2004). The structure of the database has been codified in the SQL 92 programming language and the full code can be accessed via the Excel version of the database. This has several advantages, including:
• The ability to run the database on a number of different operating systems, allowing for future software upgrades
• Data and metadata (i.e. text and image files) can be stored in the same
environment
• Query reports may be produced, which can export selected data in other formats as required by modellers and other end users
The base code should not be modified unless it is necessary to ensure compatibility with the database software being used.
9

T re eL is t
C ro p L is t
L a y e r D a ta
S o il
W e a th e r S ta tio n
S ite
C ro p Y ie ld
P lo t
T re e M e a su re s
M a n a g e m en tC ro p D a ta
T re e D a ta
C u lt iv a tio n L is t
C h e m ic a l L is t
F e rt i lis a tio n L is t
Irr ig a tio n L is t
C e ll
V o xe l
F o d d e r D a ta
W e a th e r D a y D a ta
W e a th e r H o u r D a ta
W a te r T ab le
S ite L e v e l
P lo t L e v e l
C e ll L e v e l
W e a th e r-S ite
P h e n o lo g y
P h e n o lo g y E v e n t
V o x e l L e v e l
K e y
D a ily s te p C a lib .M .
Y e a rly s te p C a lib .M .
G e n e ra l In fo
M u lti le v e l
M o d e l C a lib ra t io n
Fig 4. Final structure of the SAFE experimental database
10
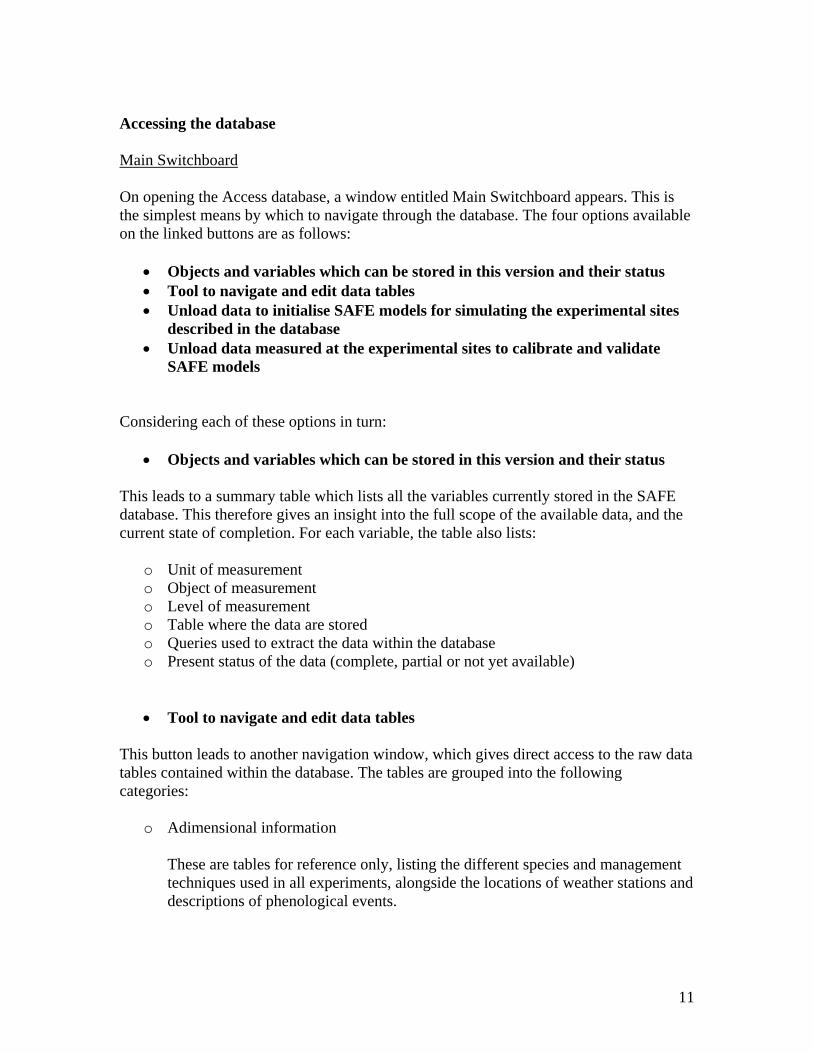
Accessing the database Main Switchboard On opening the Access database, a window entitled Main Switchboard appears. This is the simplest means by which to navigate through the database. The four options available on the linked buttons are as follows:
• Objects and variables which can be stored in this version and their status • Tool to navigate and edit data tables • Unload data to initialise SAFE models for simulating the experimental sites
described in the database • Unload data measured at the experimental sites to calibrate and validate
SAFE models Considering each of these options in turn:
• Objects and variables which can be stored in this version and their status This leads to a summary table which lists all the variables currently stored in the SAFE database. This therefore gives an insight into the full scope of the available data, and the current state of completion. For each variable, the table also lists:
o Unit of measurement o Object of measurement o Level of measurement o Table where the data are stored o Queries used to extract the data within the database o Present status of the data (complete, partial or not yet available)
• Tool to navigate and edit data tables This button leads to another navigation window, which gives direct access to the raw data tables contained within the database. The tables are grouped into the following categories:
o Adimensional information
These are tables for reference only, listing the different species and management techniques used in all experiments, alongside the locations of weather stations and descriptions of phenological events.
11
The purpose of these tables is to allow a consistent set of definitions to be applied when describing the characteristics of each individual experimental site within the database.
o Site level information
These tables provide data for each individual site as a whole. In most cases the details are provided in the form of numbers, referring to specific information (e.g. species identities, management practices) defined in the adimensional information tables above. For the code numbers used to refer to each individual site, and basic background information, see the Site table.
o Plot and sub-plot level information
These tables allow access to the individual field measurements made at the plot and sub-plot scales. These tables are therefore the raw data of the experiments, and some are of necessity large in size.
The tables for plot, cell and voxel refer to the spatial levels within the HySAFE and SAFEresult models (See Fig. 1).
o Mix level information
These tables are intended for usage in calibrating the HySAFE and SAFEresult models. At the present time they remain incomplete (13th July 2004).
• Unload data to initialise SAFE models for simulating the experimental sites
described in the database This leads to a further window, which accesses pre-existing database queries of use in extracting the data for initialising models. The ‘Available Sites’ function provides an overview of the metadata available for each individual experimental site, while the ‘PLOT: Structure’ function provides forms summarising the experimental design in each plot. Each button leads to a further form, which contains summarised data that can be conveniently copied into any other database package. This is the recommended way to obtain data from the database, rather than attempting to locate dispersed data within the main tables.
12

• Unload data measured at the experimental sites to calibrate and validate SAFE models
These standard queries are specifically intended for use in calibrating the HySAFE and SAFEresult models. Maintenance and updating The database can easily be updated with new information, particularly data from ongoing experiments. Some precaution must however be taken to avoid the potential loss of existing data, and the data formats should not be altered as this may corrupt the entire database. A sound working knowledge of Access is required. Adding, changing and deleting records This is a relatively simple operation, although some general guidelines should be observed.
1. Save the database onto a hard drive and rename it before making any changes. 2. Use the navigator-editor tool which was designed for the specific purpose of data
modification.
3. Update the information describing objects and variables in the ‘Objects and variables’ table (accessible from the main switchboard), especially the status column.
4. When adding adimensional information, e.g. a new tree species or management
technique, the new data must be linked to the relevant tables.
5. When working on site-level information, pay special attention to the updating of weather data, in particular the linked table for the weather station and the ‘SITE: Weather data’ query.
6. After updating, check that the data can be read by the relevant queries (the
‘Objects and variables’ table lists the queries associated with each table). General database maintenance Database maintenance involves the modification and redesigning of a database, and the file should not be seen as a fixed entity, but rather something that can be amended to suit the specific needs of the user. The present database may be used as a framework for future experimental databases.
13
Before altering the underlying structure of the database it is advisable to study the links between tables, which is easiest to do via the Excel version of the database. Good practice recommends testing the new structure independently with an Access file incorporating a subset of the database tables. To change the existing database:
1. Copy the database onto a hard drive and rename it to prevent changes to the original.
2. Tables can be modified via the navigation and query screens, but this is not
advisable as it reduces the degree of control.
3. Remember that modifying linked tables is not possible without temporarily deleting the links in the Relationships window. These links must be reinstated after modification is complete. Without doing this, any changes may be lost, or they may potentially corrupt other linked tables.
4. Test the functionality of the database after each major modification, especially
any related query forms. The ‘Objects and variables’ table (accessible from the main switchboard) lists the queries associated with each table.
5. The ‘Objects and variables’ table is independent of all other tables, and must be
modified separately to record any changes in the database. Maps and site pictures There are two versions of the Access database available – Access 97 and 2000. The main difference between the two versions is in how site pictures are embedded within the database. The ‘Site map picture’ is blank in the Access 97 version (accessed via the ‘CELL: Structure’ standard query for unloading data for model initialisation) due to limitations in file dimensions. In Access 2000 the necessary links are not yet in place. Site diagrams can easily be manually linked to the database on a local system. To do so, follow the ‘Tool to navigate and edit data tables’ link from the Main Switchboard within the database. Open the ‘Site’ table (in the ‘Site Level Information’ category), and enter local links to the pictures in the column labelled ‘Maps’. Detailed site maps are currently in preparation, and web links to them will be added to the database in due course (27th July 04).
14
Field sites Data from the following twelve experimental sites are contained within this database: Tadcaster Manager David Pilbeam [email protected] Institute University of Leeds
School of Biology Woodhouse Lane Leeds LS2 9JT
Region West Yorkshire Country United Kingdom Summary Poplar hybrids in rows, intercropped with cereals. Silsoe Manager Paul Burgess [email protected] Institute Cranfield University
Silsoe Bedfordshire MK45 4DT
Region Eastern England Country United Kingdom Summary Poplar hybrids in rows, intercropped with cereals. Identical in design to
plots at Leeds. Lézat-sur-Lèze Manager Andre Gavaland [email protected] Institute INRA-UAPF (Institut National de la Recherche Agronomique, Unité
Agroforesterie et Forêt Paysanne) BP 27 31326 Castanet Tolosan Cedex
Region Midi-Pyrénées Country France Summary Service tree (Sorbus domestica) and grey alder (Alnus incana) in rows,
intercropped with cereals or fodder legumes.
15
Grazac Manager Andre Gavaland [email protected] Institute INRA-UAPF (Institut National de la Recherche Agronomique, Unité
Agroforesterie et Forêt Paysanne) BP 27 31326 Castanet Tolosan Cedex
Region Midi-Pyrénées Country France Summary Hybrid walnut (Juglans spp.) and wild cherry (Prunis avium) in rows,
intercropped with cereals, sunflowers or fodder legumes. Pamiers Manager Andre Gavaland [email protected] Institute INRA-UAPF (Institut National de la Recherche Agronomique, Unité
Agroforesterie et Forêt Paysanne) BP 27 31326 Castanet Tolosan Cedex
Region Midi-Pyrénées Country France Summary Wild cherry (Prunus avium) in rows, intercropped with maize. Prades-le-Lez Manager Christian Dupraz [email protected] Institute INRA (Institut National de la Recherche Agronomique)
UMR Systèmes de Culture Méditerranéens et Tropicaux 2, Place Viala, 34060 Montpellier
Region Languedoc-Roussillon Country France Summary Walnut (Juglans regia) in rows, intercropped with cereals or oil seed rape.
16
Porano A & B Manager Piero Paris [email protected] Institute CNR (Consiglio Nazionale delle Ricerche)
Istituto per l’Agroselvicoltura Via G. Marconi, 2, 05010 Porano (TR)
Region Umbria Country Italy Summary Walnut (Juglans regia) in rows, intercropped with cereals or fodder
legumes. Monroy A & B Manager Gerardo Moreno [email protected] Institute UEX (Universidad de Extremadura)
E.U. de Ingenieria Tecnica Forestal Avd. Virgen del Puerto, 10600 Plasencia
Region Extremadura Country Spain Summary Scattered trees of holm oak (Quercus ilex), intercropped with cereals. Talaván A & B Manager Gerardo Moreno [email protected] Institute UEX (Universidad de Extremadura)
E.U. de Ingenieria Tecnica Forestal Avd. Virgen del Puerto, 10600 Plasencia
Region Extremadura Country Spain Summary Scattered trees of holm oak (Quercus ilex), intercropped with cereals.
17

References Carlis J.V. and J. Maguire, 1995. Data modelling using logical data structure, University of Minnesota, Minneapolis. Credits Database design and construction: F. Agostini I. Lecomte Data collection and organisation: F. Agostini D. J. Pilbeam L. D. Incoll Datasets: P. Burgess C. Dupraz A. Gavaland L. D. Incoll G. Moreno P. Paris Figures and background documentation: F. Agostini
18