Embed Size (px)
Citation preview

University of South FloridaScholar Commons
Graduate Theses and Dissertations Graduate School
March 2018
Modeling Corrosion Damage and Repair to a 3Joseph R. ScottUniversity of South Florida, [email protected]
Follow this and additional works at: http://scholarcommons.usf.edu/etd
Part of the Civil Engineering Commons
This Thesis is brought to you for free and open access by the Graduate School at Scholar Commons. It has been accepted for inclusion in GraduateTheses and Dissertations by an authorized administrator of Scholar Commons. For more information, please contact [email protected].
Scholar Commons CitationScott, Joseph R., "Modeling Corrosion Damage and Repair to a 3" (2018). Graduate Theses and Dissertations.http://scholarcommons.usf.edu/etd/7228
Modeling Corrosion Damage and Repair to a 3rd Scale Concrete Bridge Bent
by
Joseph R. Scott
A thesis submitted in partial fulfillment
of the requirements for the degree of
Master of Science in Civil Engineering
Department of Civil and Environmental Engineering
College of Engineering
University of South Florida
Major Professor: A. Gray Mullins, Ph.D.
Rajan Sen, Ph.D.
Michael J. Stokes, Ph.D.
Date of Approval:
March 7, 2018
Keywords: Deficiencies, Carbon Fiber Reinforcing Polymer, Prestress
Transfer Length, Area Loss of Steel, Lateral Deflection
Copyright © 2018, Joseph R. Scott

DEDICATION
To David Vincent.

ACKNOWLEDGMENTS
I am sincerely grateful of my experience in research engineering owed to Dr. Mullins, Dr.
Sen, Dr. Stokes and Dr. Sagüés, who have guided and equipped me with conceptual and practical
tools in skillful problem solving and logical development of scientific experimentation. Their
unsurpassed ability and dedication to facilitate learning in both classrooms and field environments
delivers a highly valued learning experience, which has undoubtedly broadened and positively
shaped my understanding of the engineering profession.
I am thankful for the opportunity to work with a dedicated, well distinguished, cohesive
team of bright minded individuals within the University of South Florida’s Structural/Geotechnical
engineering research group.
A special thanks to Michelle Nobel and Tom Zuppa from Sika Corporation, for donating
material and providing technical guidance that led toward success of this experiment.
i
TABLE OF CONTENTS
LIST OF TABLES iii
LIST OF FIGURES iv
ABSTRACT vii
CHAPTER 1: INTRODUCTION 1
1.1 Problem Statement 1
1.2 Organization of Thesis 3
CHAPTER 2: BACKGROUND 4
2.1 Corrosion 4
2.2 Corrosion Initiation 5
2.3 Corrosion Damage of Bridges 6
2.4 Rehabilitation Alternatives 7
2.5 Pilot Study 9
2.6 Scope of Study 16
CHAPTER 3: MODELING CORROSION DAMAGED PILE BENTS 18
3.1 FLPIER 18
3.2 Model Assumptions 19
3.3 Influencing Variables and Input Parameters 20
3.4 Modulus of Elasticity of Concrete 21
3.5 Prestress Transfer Length 24
3.6 Undamaged Control Model 26
3.7 Damaged Models 32
CHAPTER 4: MODELING FRP-REPAIRED PILE BENTS 40
4.1 CFRP Tensile Design Calculation 41
4.2 Repair Models and Carbon Shell Distribution 41
CHAPTER 5: CONCLUSIONS 47
5.1 Study Summary 47
5.2 Interpretations of Findings 49
5.3 Future Work 49
REFERENCES 50
APPENDIX A: PILE DEFICIENCY MAPPING 52

ii
APPENDIX B: OUTPUT RESULTS GRAPHS 58
iii
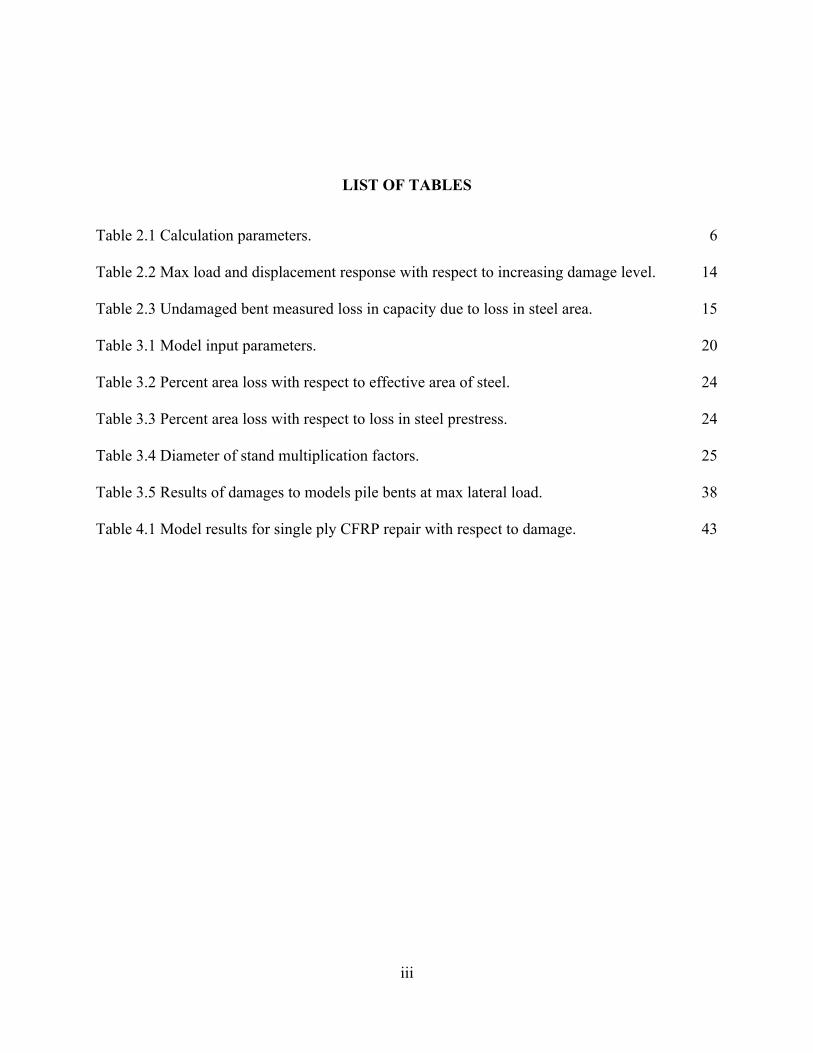
LIST OF TABLES
Table 2.1 Calculation parameters. 6
Table 2.2 Max load and displacement response with respect to increasing damage level. 14
Table 2.3 Undamaged bent measured loss in capacity due to loss in steel area. 15
Table 3.1 Model input parameters. 20
Table 3.2 Percent area loss with respect to effective area of steel. 24
Table 3.3 Percent area loss with respect to loss in steel prestress. 24
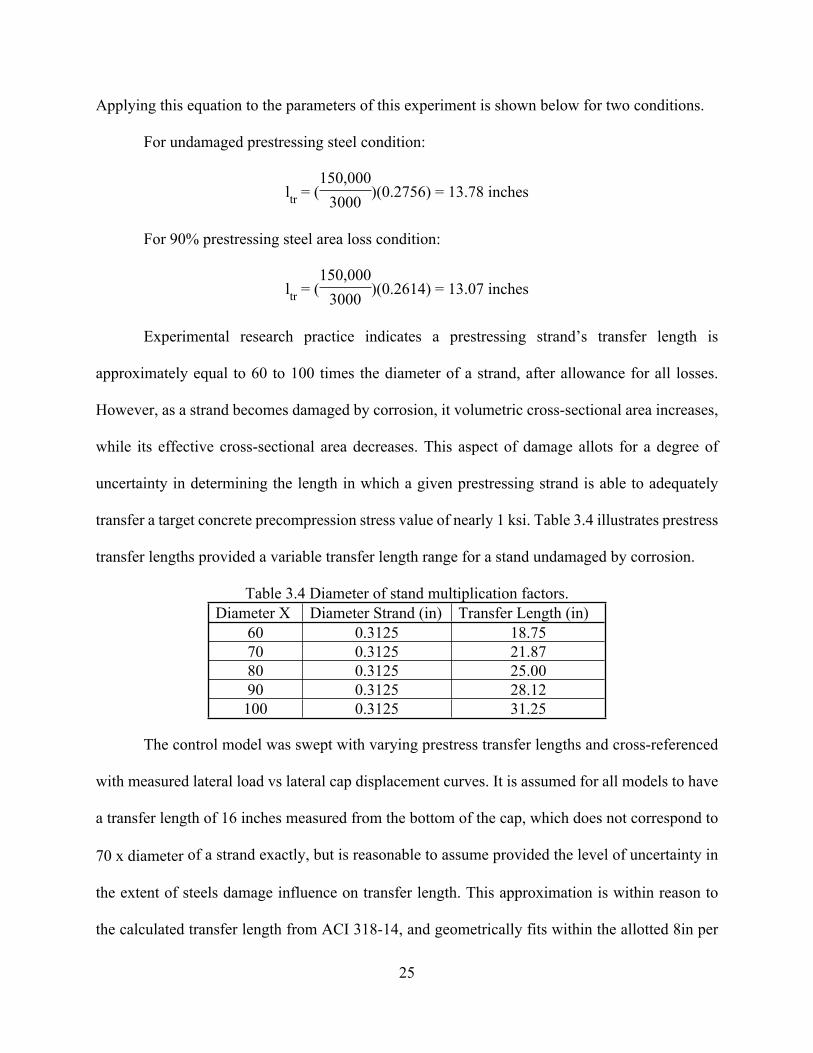
Table 3.4 Diameter of stand multiplication factors. 25
Table 3.5 Results of damages to models pile bents at max lateral load. 38
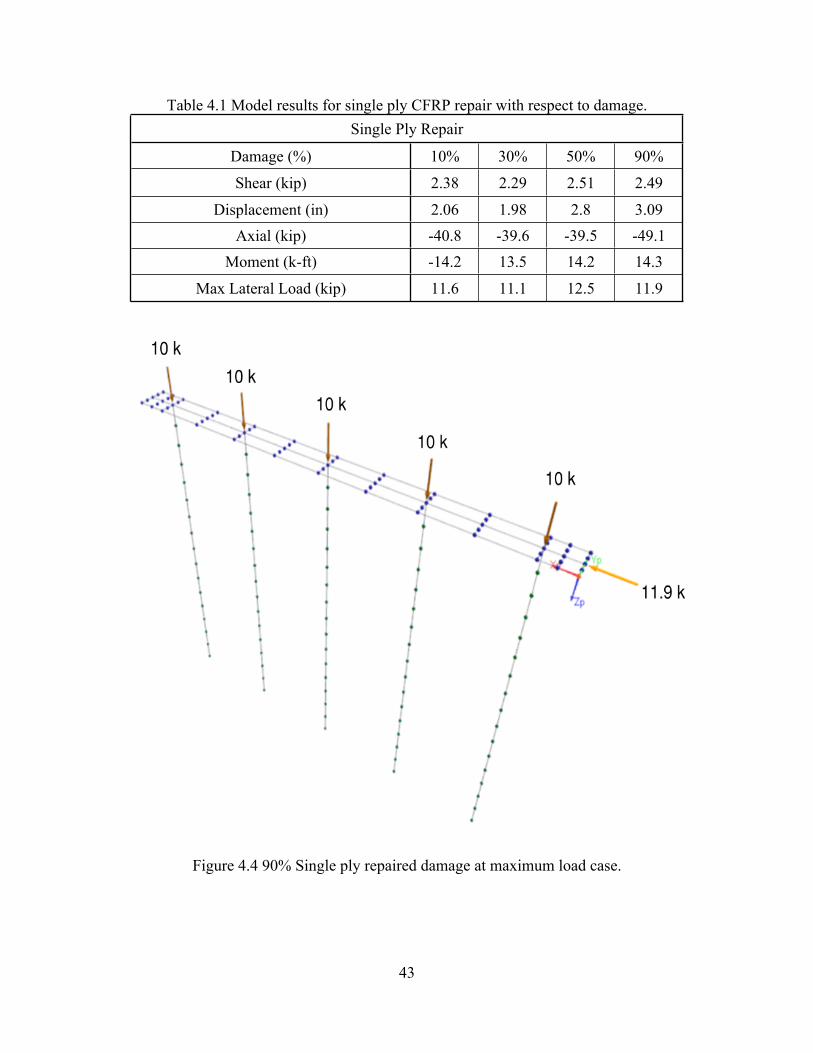
Table 4.1 Model results for single ply CFRP repair with respect to damage. 43
iv
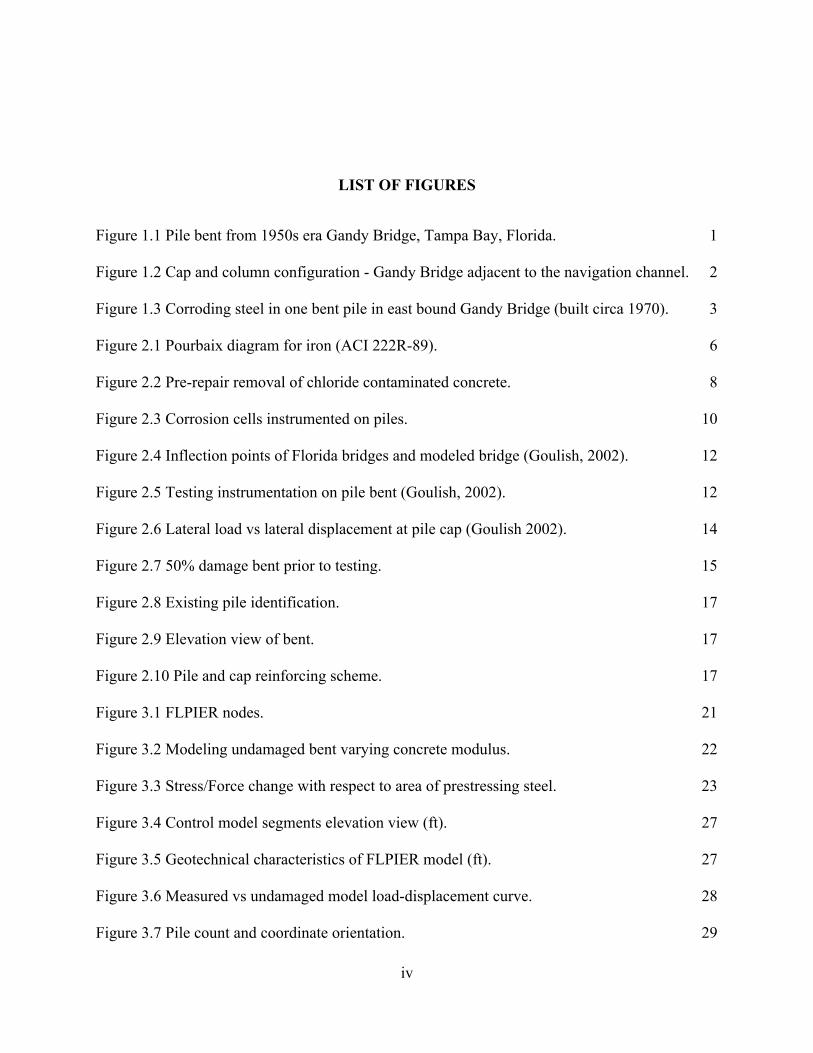
LIST OF FIGURES
Figure 1.1 Pile bent from 1950s era Gandy Bridge, Tampa Bay, Florida. 1
Figure 1.2 Cap and column configuration - Gandy Bridge adjacent to the navigation channel. 2
Figure 1.3 Corroding steel in one bent pile in east bound Gandy Bridge (built circa 1970). 3
Figure 2.1 Pourbaix diagram for iron (ACI 222R-89). 6
Figure 2.2 Pre-repair removal of chloride contaminated concrete. 8
Figure 2.3 Corrosion cells instrumented on piles. 10
Figure 2.4 Inflection points of Florida bridges and modeled bridge (Goulish, 2002). 12
Figure 2.5 Testing instrumentation on pile bent (Goulish, 2002). 12
Figure 2.6 Lateral load vs lateral displacement at pile cap (Goulish 2002). 14
Figure 2.7 50% damage bent prior to testing. 15
Figure 2.8 Existing pile identification. 17
Figure 2.9 Elevation view of bent. 17
Figure 2.10 Pile and cap reinforcing scheme. 17
Figure 3.1 FLPIER nodes. 21
Figure 3.2 Modeling undamaged bent varying concrete modulus. 22
Figure 3.3 Stress/Force change with respect to area of prestressing steel. 23
Figure 3.4 Control model segments elevation view (ft). 27
Figure 3.5 Geotechnical characteristics of FLPIER model (ft). 27
Figure 3.6 Measured vs undamaged model load-displacement curve. 28
Figure 3.7 Pile count and coordinate orientation. 29

v
Figure 3.8 Undamaged model with sustained service loads and at ultimate lateral load. 29
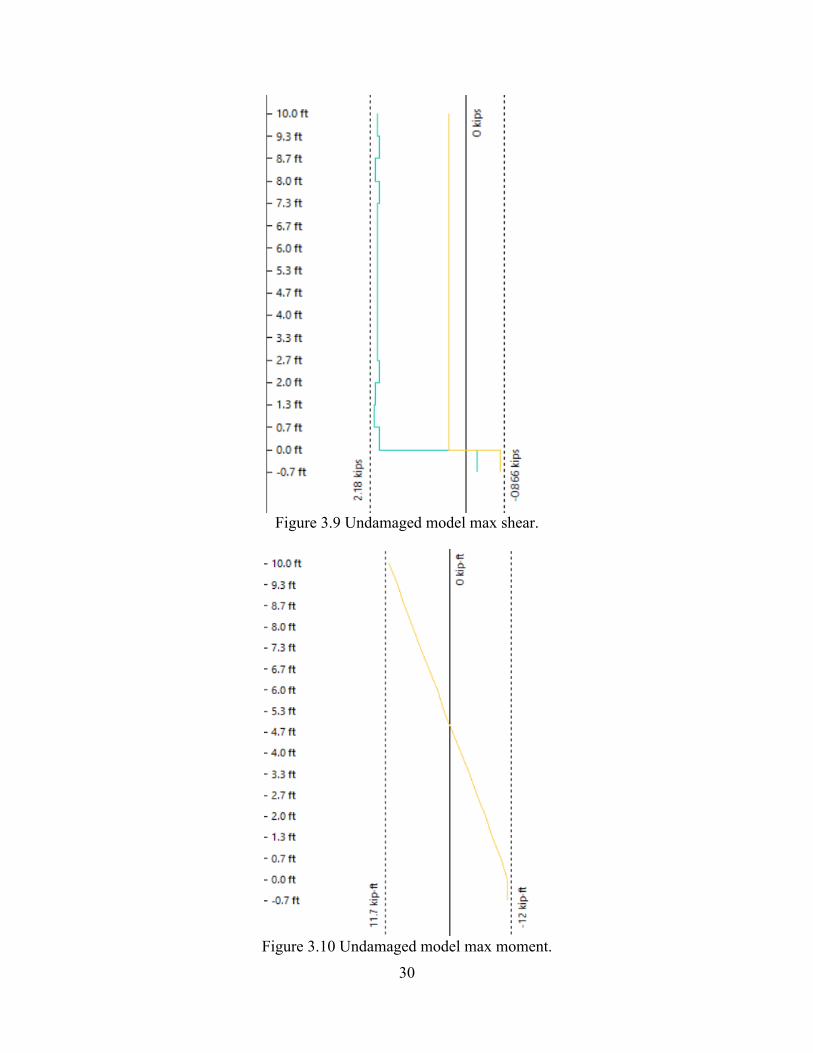
Figure 3.9 Undamaged model max shear. 30
Figure 3.10 Undamaged model max moment. 30
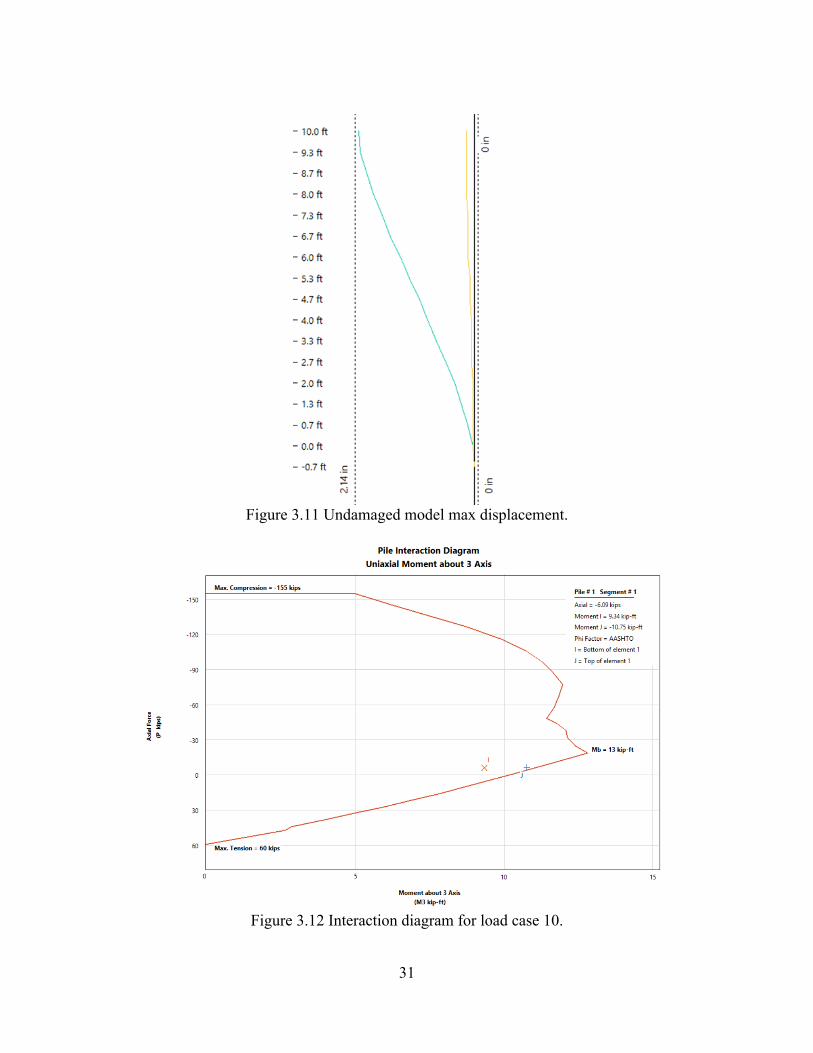
Figure 3.11 Undamaged model max displacement. 31
Figure 3.12 Interaction diagram for load case 10. 31
Figure 3.13 Response curves for all models. 32
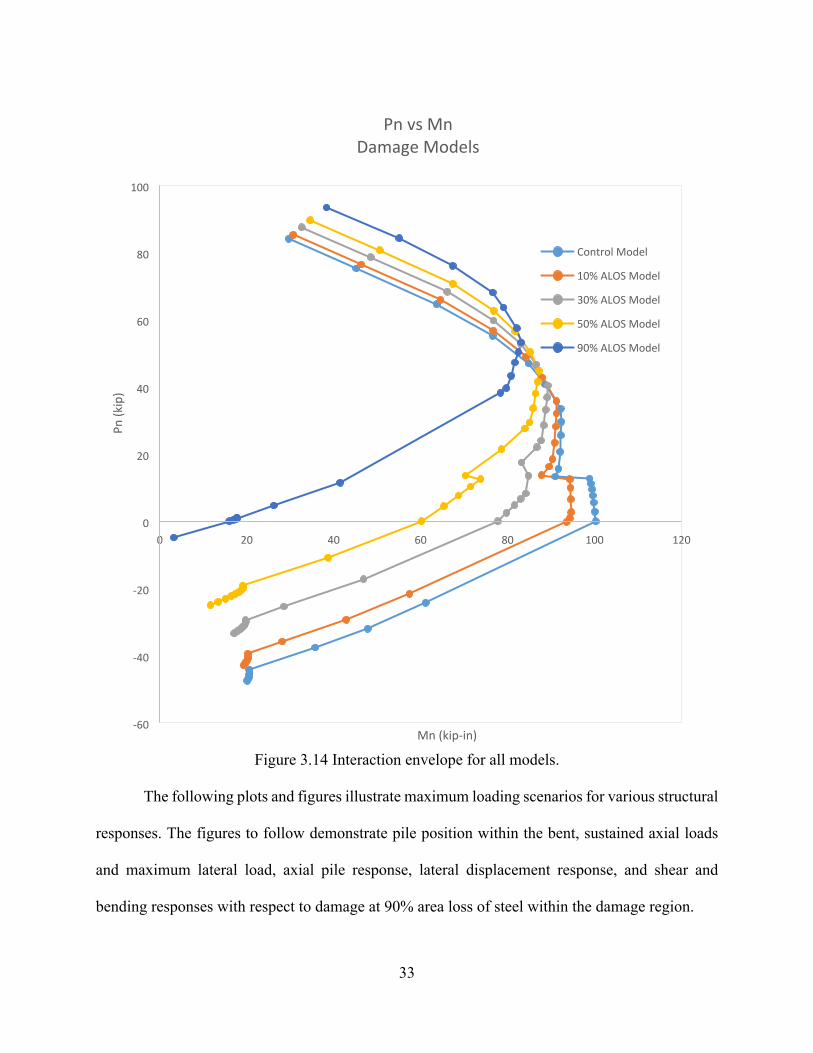
Figure 3.14 Interaction envelope for all models. 33
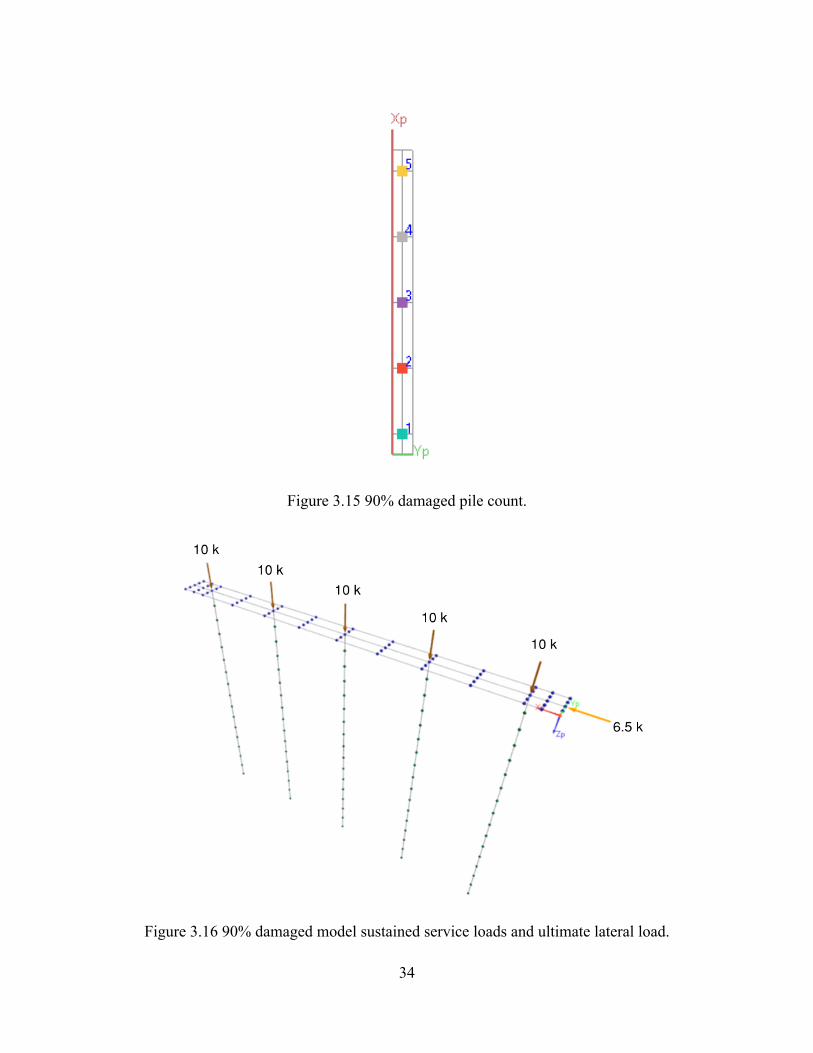
Figure 3.15 90% damaged pile count. 34
Figure 3.16 90% damaged model sustained service loads and ultimate lateral load. 34
Figure 3.17 90% damaged model max shear. 35
Figure 3.18 90% damaged model max moment. 35
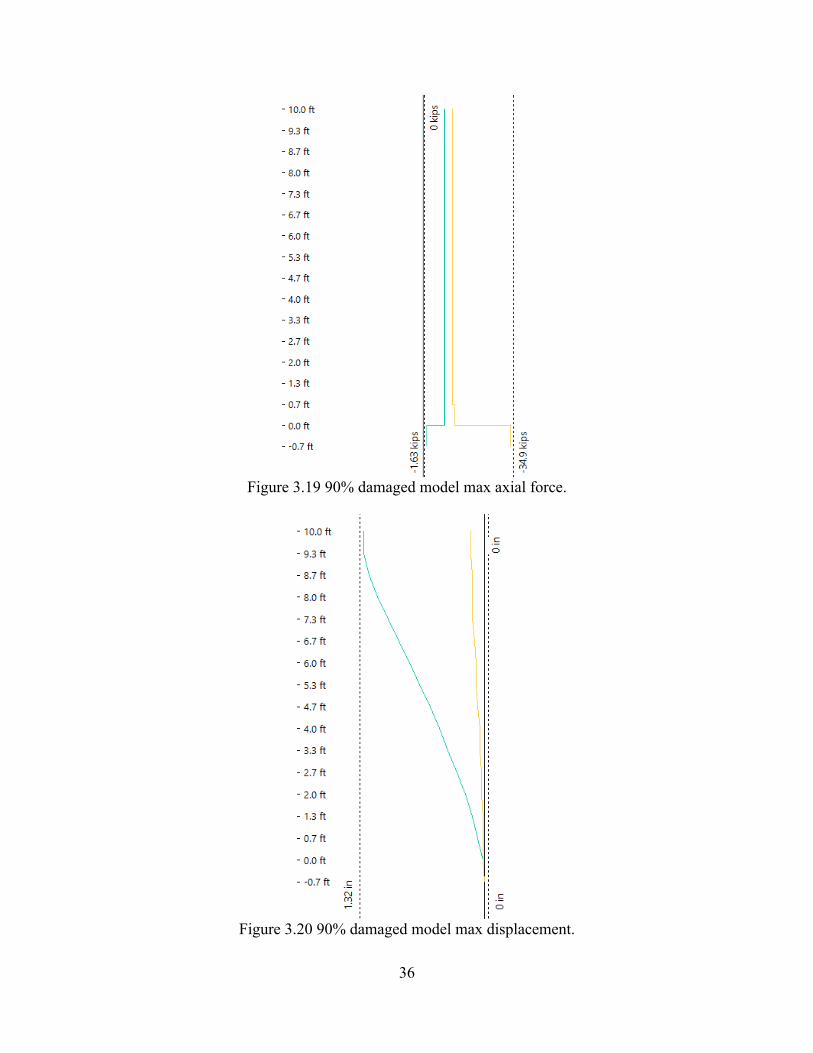
Figure 3.19 90% damaged model max axial force. 36
Figure 3.20 90% damaged model max displacement. 36
Figure 3.21 Interaction diagram 90% damaged model at load case 10. 37
Figure 3.22 Maximum applied lateral load with respect to loss in steel area. 38
Figure 3.23 Maximum moment in bent with respect to loss in steel area. 38
Figure 3.24 Maximum shear in bent with respect to loss in steel area. 39
Figure 3.25 Maximum lateral displacement in bent with respect to loss in steel area. 39
Figure 4.1 CFRP design schematic. 40
Figure 4.2 Strength requirements for repair material. 41
Figure 4.3 Square crosss section with custom reinforcement. 42
Figure 4.4 90% Single ply repaired damage at maximum load case. 43
Figure 4.5 90% single ply repaired damage at maximum load case. 44
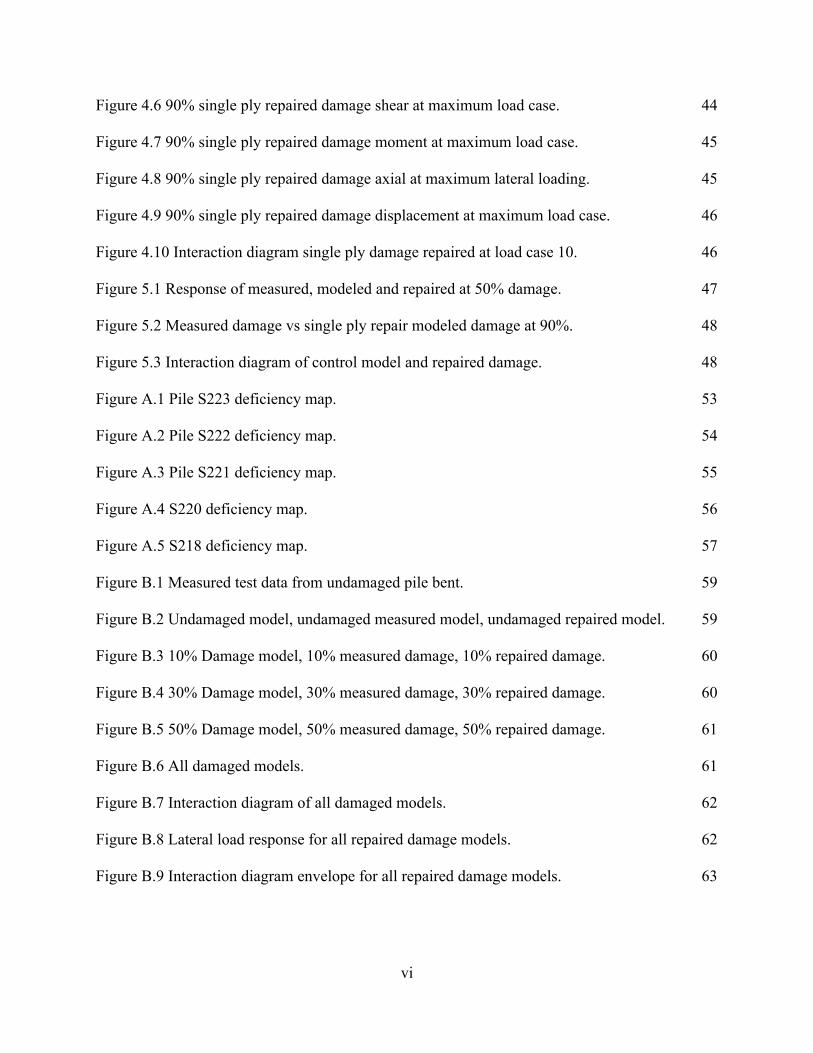
vi
Figure 4.6 90% single ply repaired damage shear at maximum load case. 44
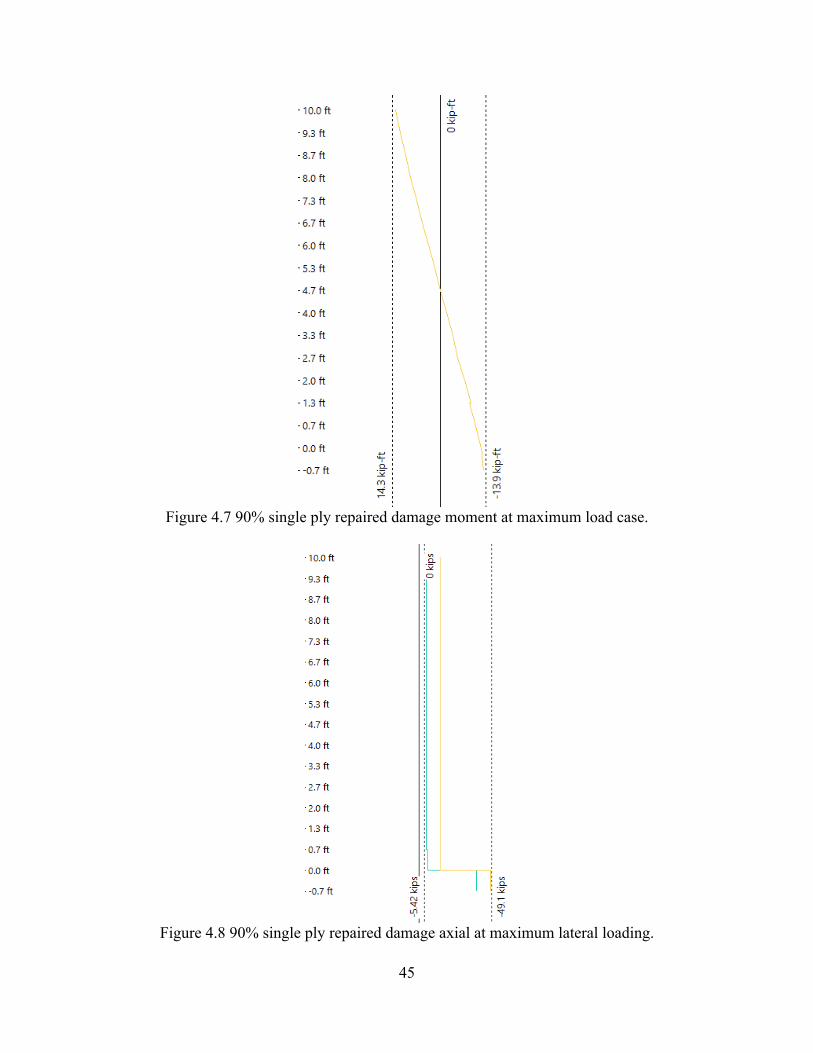
Figure 4.7 90% single ply repaired damage moment at maximum load case. 45
Figure 4.8 90% single ply repaired damage axial at maximum lateral loading. 45
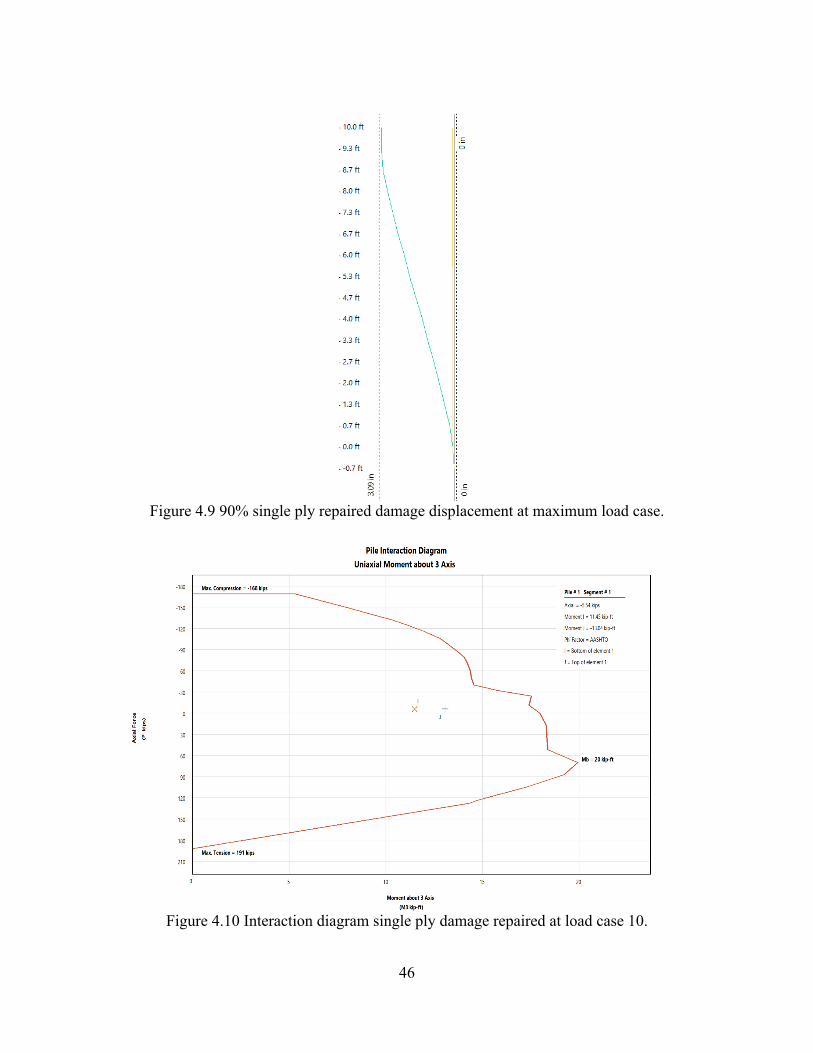
Figure 4.9 90% single ply repaired damage displacement at maximum load case. 46
Figure 4.10 Interaction diagram single ply damage repaired at load case 10. 46
Figure 5.1 Response of measured, modeled and repaired at 50% damage. 47
Figure 5.2 Measured damage vs single ply repair modeled damage at 90%. 48
Figure 5.3 Interaction diagram of control model and repaired damage. 48
Figure A.1 Pile S223 deficiency map. 53
Figure A.2 Pile S222 deficiency map. 54
Figure A.3 Pile S221 deficiency map. 55
Figure A.4 S220 deficiency map. 56
Figure A.5 S218 deficiency map. 57
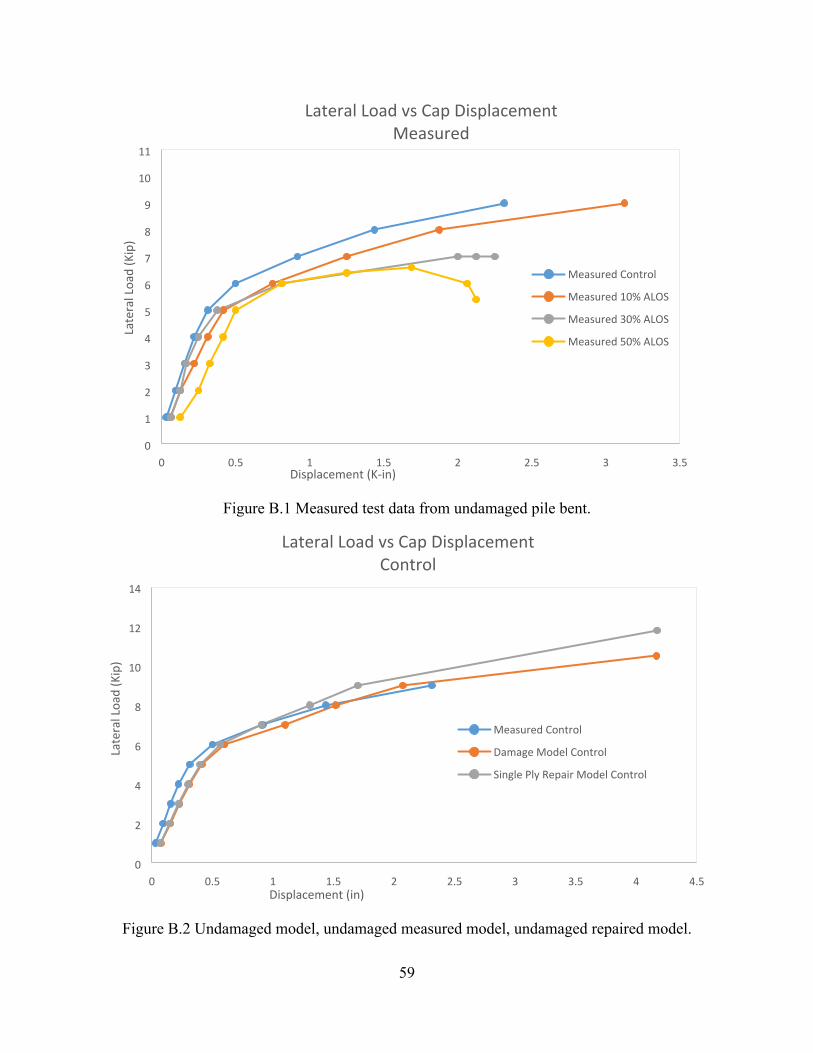
Figure B.1 Measured test data from undamaged pile bent. 59
Figure B.2 Undamaged model, undamaged measured model, undamaged repaired model. 59
Figure B.3 10% Damage model, 10% measured damage, 10% repaired damage. 60
Figure B.4 30% Damage model, 30% measured damage, 30% repaired damage. 60
Figure B.5 50% Damage model, 50% measured damage, 50% repaired damage. 61
Figure B.6 All damaged models. 61
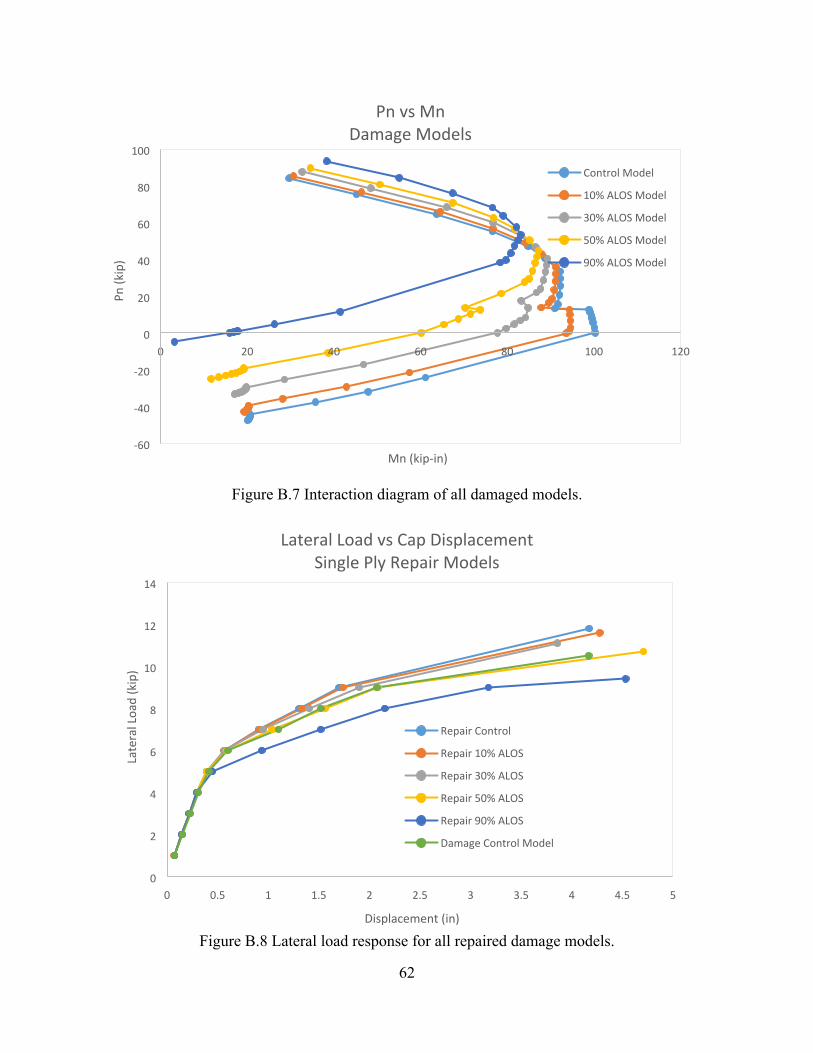
Figure B.7 Interaction diagram of all damaged models. 62
Figure B.8 Lateral load response for all repaired damage models. 62
Figure B.9 Interaction diagram envelope for all repaired damage models. 63

vii
ABSTRACT
The main purpose of this study was to investigate and implement a repair design for
corrosion damaged bridge bents in order to resist lateral loading, such as wind loads or ship impact.
Using the results from a one-third scale bridge bent constructed and tested for a previous study,
non-linear modeling was used to simulate the same corrosion damage and load response. The
principle variable considered was damage, represented as a percent of effective area loss of
prestressing steel within a designated damage zone along the length of piles. Other influencing
variables included: prestress transfer length, localized loss in prestress due to corrosion damage,
prestress force, and concrete modulus of elasticity.
Upon successful convergence of measured and modeled results, carbon fiber repair
schemes were then modeled to restore bents to their full capacity. Suitable repairs were judged on
the basis of restoration of capacity of the entire pile bent and the interaction diagrams of the
individual piles. Results of the modeled repairs suggested that a single layer of a commercially
available unidirectional carbon fiber would be sufficient when aligned longitudinally. No benefit
from accompanying transverse fibers were considered although such a repair was suggested by the
study findings.
Analysis indicated that longitudinally bonded carbon fiber reinforced polymer (CFRP) to
bridge piles increases a bent’s ability to resist bending moment due to lateral loading at the cap.
However, additional capacity to plastic region of the response curve indicated larger capacity gains
than by gains to elastic regions.
1
CHAPTER 1: INTRODUCTION
1.1 Problem Statement
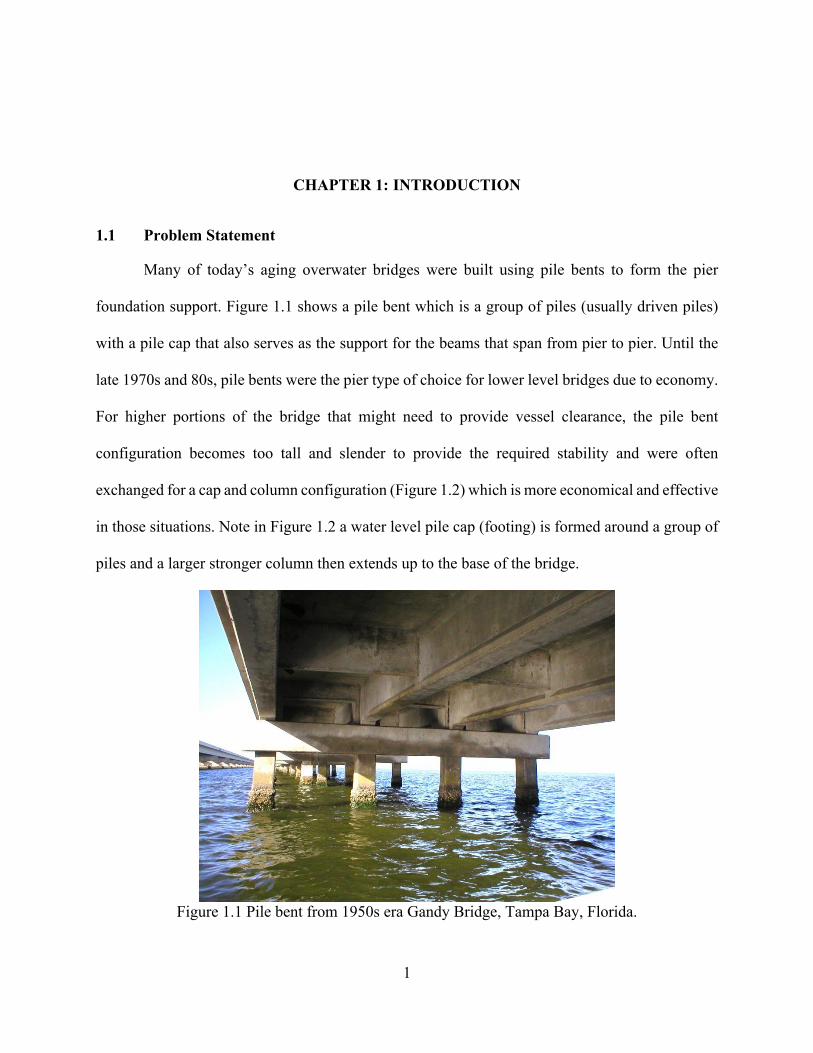
Many of today’s aging overwater bridges were built using pile bents to form the pier
foundation support. Figure 1.1 shows a pile bent which is a group of piles (usually driven piles)
with a pile cap that also serves as the support for the beams that span from pier to pier. Until the
late 1970s and 80s, pile bents were the pier type of choice for lower level bridges due to economy.
For higher portions of the bridge that might need to provide vessel clearance, the pile bent
configuration becomes too tall and slender to provide the required stability and were often
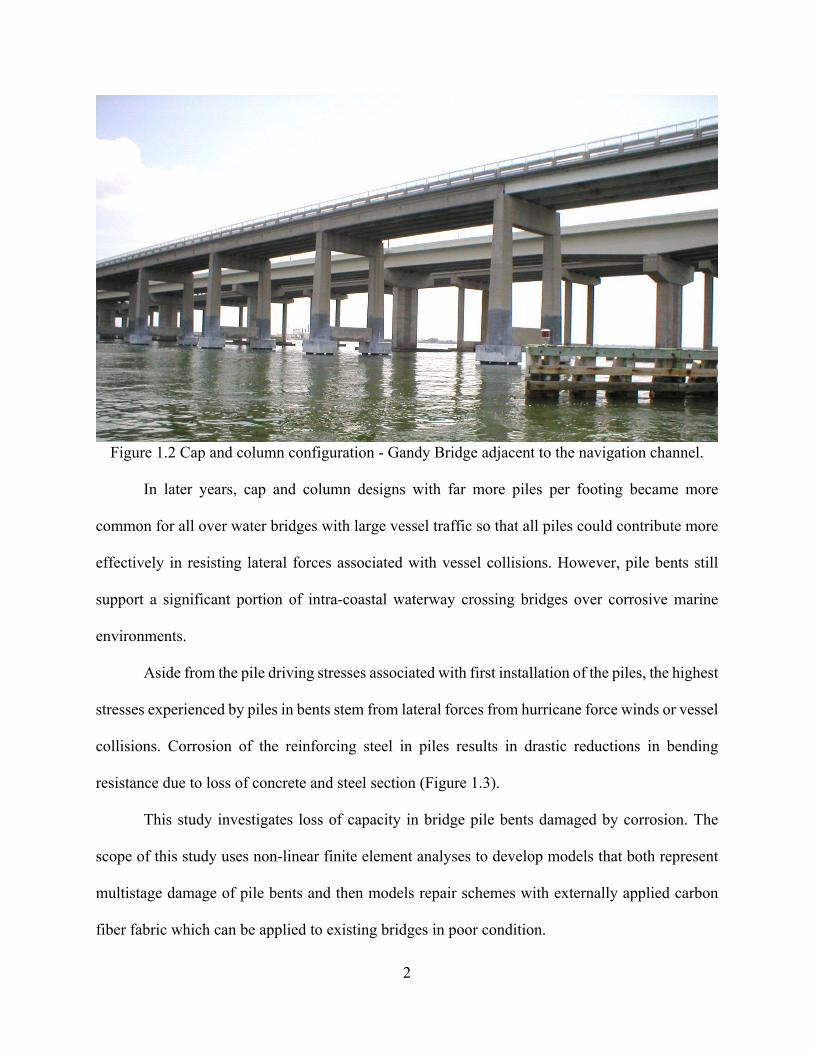
exchanged for a cap and column configuration (Figure 1.2) which is more economical and effective
in those situations. Note in Figure 1.2 a water level pile cap (footing) is formed around a group of
piles and a larger stronger column then extends up to the base of the bridge.
Figure 1.1 Pile bent from 1950s era Gandy Bridge, Tampa Bay, Florida.
2
Figure 1.2 Cap and column configuration - Gandy Bridge adjacent to the navigation channel.
In later years, cap and column designs with far more piles per footing became more
common for all over water bridges with large vessel traffic so that all piles could contribute more
effectively in resisting lateral forces associated with vessel collisions. However, pile bents still
support a significant portion of intra-coastal waterway crossing bridges over corrosive marine
environments.
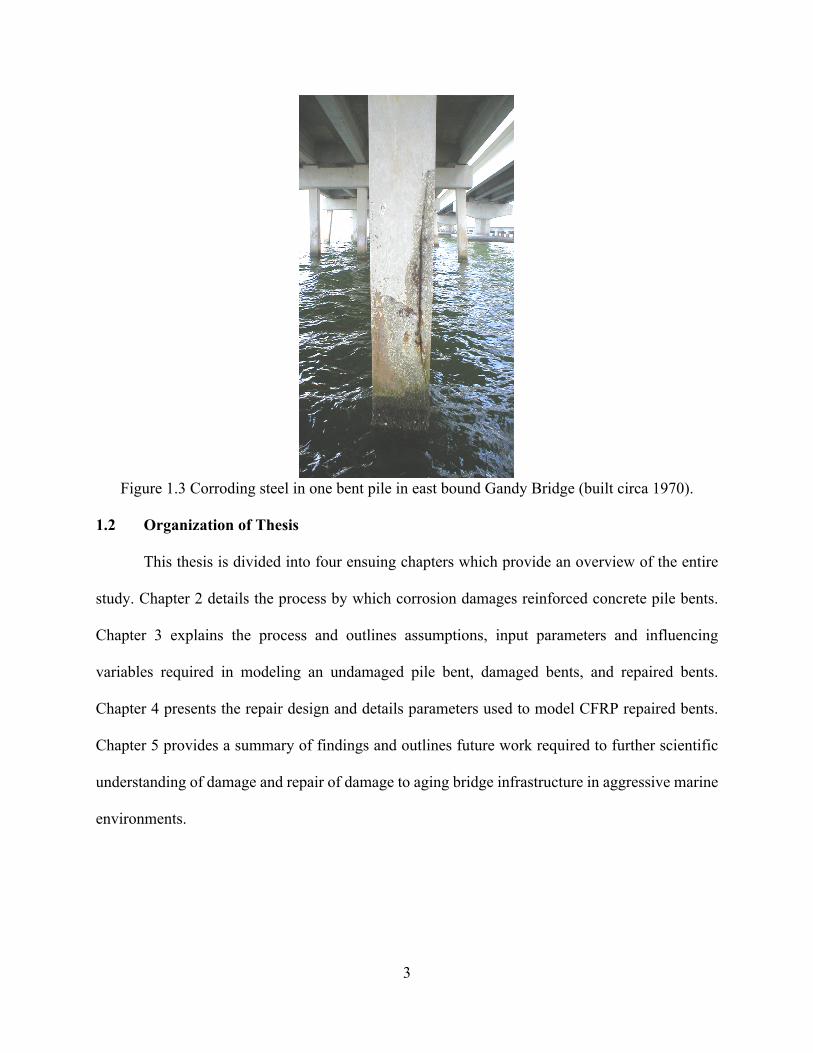
Aside from the pile driving stresses associated with first installation of the piles, the highest
stresses experienced by piles in bents stem from lateral forces from hurricane force winds or vessel
collisions. Corrosion of the reinforcing steel in piles results in drastic reductions in bending
resistance due to loss of concrete and steel section (Figure 1.3).
This study investigates loss of capacity in bridge pile bents damaged by corrosion. The
scope of this study uses non-linear finite element analyses to develop models that both represent
multistage damage of pile bents and then models repair schemes with externally applied carbon
fiber fabric which can be applied to existing bridges in poor condition.
3
Figure 1.3 Corroding steel in one bent pile in east bound Gandy Bridge (built circa 1970).
1.2 Organization of Thesis
This thesis is divided into four ensuing chapters which provide an overview of the entire
study. Chapter 2 details the process by which corrosion damages reinforced concrete pile bents.
Chapter 3 explains the process and outlines assumptions, input parameters and influencing
variables required in modeling an undamaged pile bent, damaged bents, and repaired bents.
Chapter 4 presents the repair design and details parameters used to model CFRP repaired bents.
Chapter 5 provides a summary of findings and outlines future work required to further scientific
understanding of damage and repair of damage to aging bridge infrastructure in aggressive marine
environments.
4
CHAPTER 2: BACKGROUND
2.1 Corrosion
Corrosion damage to marine infrastructure accounts for nearly 3.2% of the United States
gross domestic product. According to the ASCE 2017 infrastructure report card, America’s bridge
infrastructure grade is a C+, where 9.1% of the nation’s bridges were deemed structurally deficient
in 2016. Of the U.S.’s 614,378 bridges, nearly 4 in 10 are 50 years or older and Florida places
within the top 5% of structurally deficient bridges nationally (ASCE Report Card, 2017).
Corrosion damage is a primary concern when investigating the service life of aging bridge
infrastructure with regards towards the damaging effects chloride induced corrosion has on a
bridge bent stiffness, ductility and lateral capacity, especially when placed in bending under lateral
loading.
Steel reinforced concrete members in coastal environments undergo damages correlated to
chloride ingress, where salt is deposited unto the fascia of piles and piles are cyclically wetted
through tidal influence. Moreover, capacity losses accrue from damages attributed to internal
chloride ion concentrations within a reinforced concrete substructure, causing reinforcing steel to
debond from the concrete, which leads to delamination and/or spalling of cover concrete from the
pile or pile cap. Furthermore, substructure components in the tidal zone region, where piles are
wetted with salt water, undergoes a continuous evaporative chloride concentration loading process.
Salt accumulates on the surfaces of the pile faces and the evaporated seawater deposits an
increasing concentration of chloride on the pile faces during low tide. Hence, the tidal region or
splash zone in bridge bents often exhibit critical damage because it is highly susceptible to chloride

5
ingression and consequent corrosion damage. In Florida, the tidal region range is dependent upon
a bridge’s geographical location, Earth’s moon phase, and relevant storm influence. Overall, this
process is source of damage because it leads to the reduction of structural integrity, service life,
and limit state capacity of bridge substructures.
2.2 Corrosion Initiation
Degradation of reinforcing steel begins once concrete pore water, which is inherently
alkaline, is offset by an electrochemical interaction between chloride ions, steel, and concrete. A
protective film or passive layer surrounding the reinforcing steel deteriorates when a chloride
concentration at the interface of the steel, reaches a critical threshold value ranging from 0.037 -
0.075 lb Cl-/ft3 (Mindness et al. 2003). Aspects of chloride induced corrosion of steel in concrete
includes, the pore water within the concrete that serves as an electrolytic solution and the
reinforcing steel itself, that serves as both an anode and a cathode. A half-cell reaction takes place,
where oxidation occurs at the cathode and reduction occurs at the anode. Once all requirements
for steel to corrode in concrete are satisfied, active corrosion of the reinforcing steel initiates.
Upon meeting the critical threshold required for steel to de-passivate, Iron-oxide reaction
products form on the steel surface and volumetrically occupy several times the volume of iron
steel unsubverted by corrosion. Pourbaix diagrams for iron illustrate regions where iron in concrete
is actively corroding, immune to corrosion or is in a passive state, with respect to pH and voltage
potential (ACI 222R-3). The Pourbaix diagram for iron is illustration in Figure 2.1.
A radial tensile stress is exerted on the surrounding concrete as a result of steel actively
corroding within a concrete member. This internal stress ultimately spalls the concrete cover,
diminishes pretensioning, and circumferentially reduces reinforcing steel area. Concrete that has
spalled further exposes otherwise unaffected steel to an extremely aggressive environment.

6
Figure 2.1 Pourbaix diagram for iron (ACI 222R-89).
Shown below is an equation solving for the total time to develop “externally observable
damage, ts, on a reinforced concrete element. It’s relevance in predicting damage progression with
time in reinforced concrete structures subject to steel corrosion damage is important to design and
maintenance” (Sagüés 3). Quote, “The time to spall is a function of the ratio of cover to bar
diameter, the reinforcement spacing, and the concrete strength” (ACI 222R-3 11).
ts=
x2
4D[erf- 1(1 -
CT
Cs)]2+ ��
Table 2.1 Calculation parameters.x Average rebar cover 76 mm
D Average apparent chloride diffusion coefficient 2 × 10⁻⁷ cm2/s
CT ECR chloride concentration threshold 1.55 kg/m3
Cs Standard deviation of surface chloride concentration 14 kg/m3
tp Corrosion propagation time yrs
2.3 Corrosion Damage of Bridges
Construction practice for coastal bridges built throughout the twentieth century commonly
includes a series of collinear square prestress concrete piles, driven into subaqueous soils, until a
7
developed capacity satisfies required design load criteria. A reinforced concrete cap, cast
perpendicular atop a pile group, serves to unify the piles as a collective load-sharing structural bent
and transfers superstructure loads into substructure pile components.
Bridges in the northern part of the United States are subject to freeze thaw cycles, where
deicing salts are used to rid accumulated snow on the deck surface. Though practical from a
vehicular traffic stance, deicing salts essentially create chloride loading on the deck and the
concentration of salt at the deck surface eventually influences the reinforcing steel beneath the
cover. This ultimately leads to roadway deck cracking and concrete-steel deck delamination.
Bridges in the southern United States are subject to highly aggressive chloride
environments, in that they are located within regions of salt or brackish bodies of water and are
typically near or at sea level elevation. Consequently, bridge piles, foundations, footings, columns
and pier caps deteriorate with respect to the extent of chloride loading. Damage to these structural
elements depend on the height at which the element is from the mean high water level and the
frequency they undergo a salt deposition process.
2.4 Rehabilitation Alternatives
Commonly suggested repair practices involve the removal and replacement of all chloride
contaminated concrete with uncontaminated concrete before the application of a repair material.
This is often accompanied by sacrificial anodes used to administer cathodic protection to a
corrosion damaged structural system. Even with excellent project execution considered, this
method of repair requires extensive procedures that involve high labor costs, which often times
control the overall cost of a given bridge restoration project. When compared to an increase in a
structural service life, labor cost to remove contaminated concrete and uncertainty in the complete
removal of contaminated concrete, this conventional repair alternative is not often fiscally
conservative.
8
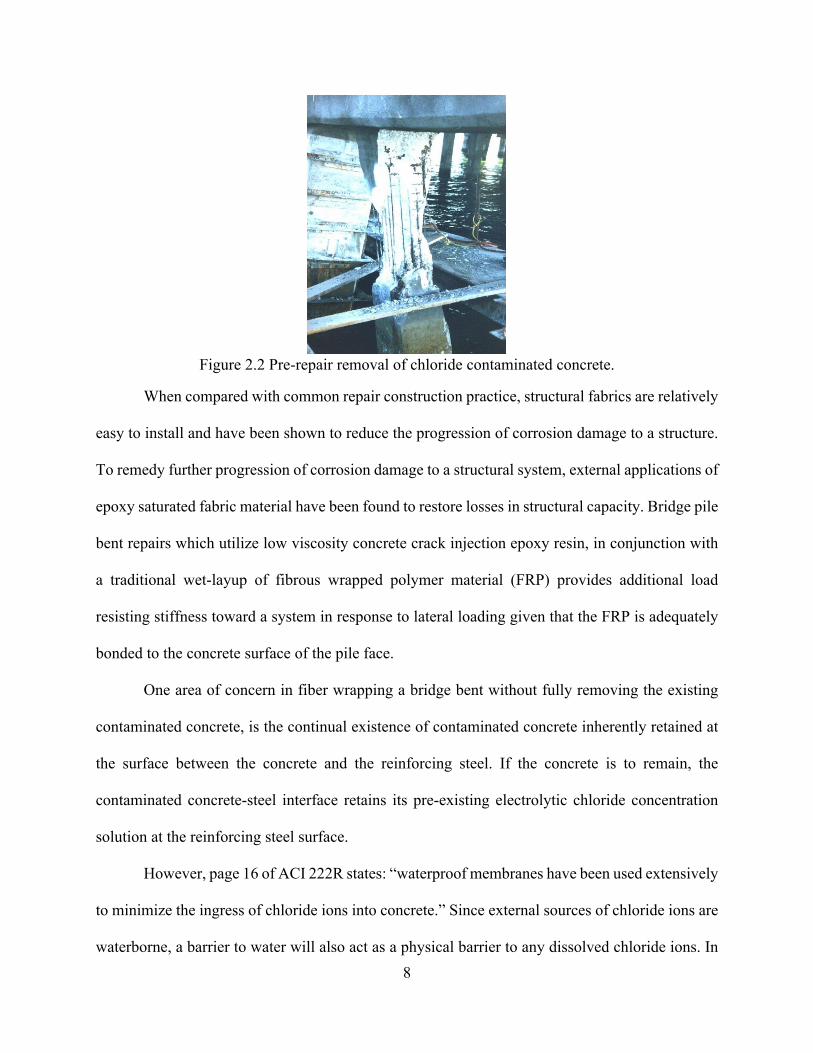
Figure 2.2 Pre-repair removal of chloride contaminated concrete.
When compared with common repair construction practice, structural fabrics are relatively
easy to install and have been shown to reduce the progression of corrosion damage to a structure.
To remedy further progression of corrosion damage to a structural system, external applications of
epoxy saturated fabric material have been found to restore losses in structural capacity. Bridge pile
bent repairs which utilize low viscosity concrete crack injection epoxy resin, in conjunction with
a traditional wet-layup of fibrous wrapped polymer material (FRP) provides additional load
resisting stiffness toward a system in response to lateral loading given that the FRP is adequately
bonded to the concrete surface of the pile face.
One area of concern in fiber wrapping a bridge bent without fully removing the existing
contaminated concrete, is the continual existence of contaminated concrete inherently retained at
the surface between the concrete and the reinforcing steel. If the concrete is to remain, the
contaminated concrete-steel interface retains its pre-existing electrolytic chloride concentration
solution at the reinforcing steel surface.
However, page 16 of ACI 222R states: “waterproof membranes have been used extensively
to minimize the ingress of chloride ions into concrete.” Since external sources of chloride ions are
waterborne, a barrier to water will also act as a physical barrier to any dissolved chloride ions. In

9
that, provided an adequate bond of FRP to salt-saturated concrete, the boundary of externally
applied carbon or glass fabrics (CFRP or GFRP), respectively, reduces the ingress of additional
moisture caused by tidal dependent evaporative cycles inherent of moisture laden environments.
Ease of installation, bond to substrate, material component compatibility, and maintained
impermeability, are requirements when considering an ideal waterproofing membrane (ACI 222R
p16). Furthermore, “field performance has been found to depend not only on the type of
waterproofing material used, but also on the quality of workmanship, weather conditions at time
of installation, design details, and the service environment” (ACI 222-3 p14).
Although FRP is not known to stop corrosion altogether, it has been shown to provide a
fiscally conservative means to inhibit and reduce the electrochemical processes, detrimental to the
service life of marine infrastructure (Winters et al. 2008). Thus, FRP repair may effectively reduce
the chloride concentration driving force by decreasing the chloride concentration gradient,
administered from build-up of salt deposits on the concrete pile face. Overall, the reduced cost of
labor and material in repairing a bent with epoxy-saturated fiber versus a conventional repair and
the demand to retrofit existing structures for loading conditions makes the application of FRP to
bridge bents a viable, feasible and economical repair alternative.
2.5 Pilot Study
The effect of corrosion damage on lateral pile capacity was investigated in the late 1990s
where four 1/3rd scale, five-pile, bridge bents (piers) were tested at various degrees of corrosion
distress at the University of South Florida, structural testing laboratory. The amount of steel
damage was the same for all piles in a given test and was estimated to be 10, 30 or 50% steel loss.
Another test was performed with piles having no steel loss. The bridge bents were subjected to an
increasing lateral load while maintaining constant vertical/gravity loads representative of lateral
live loading and service axial loading conditions, respectfully.
10
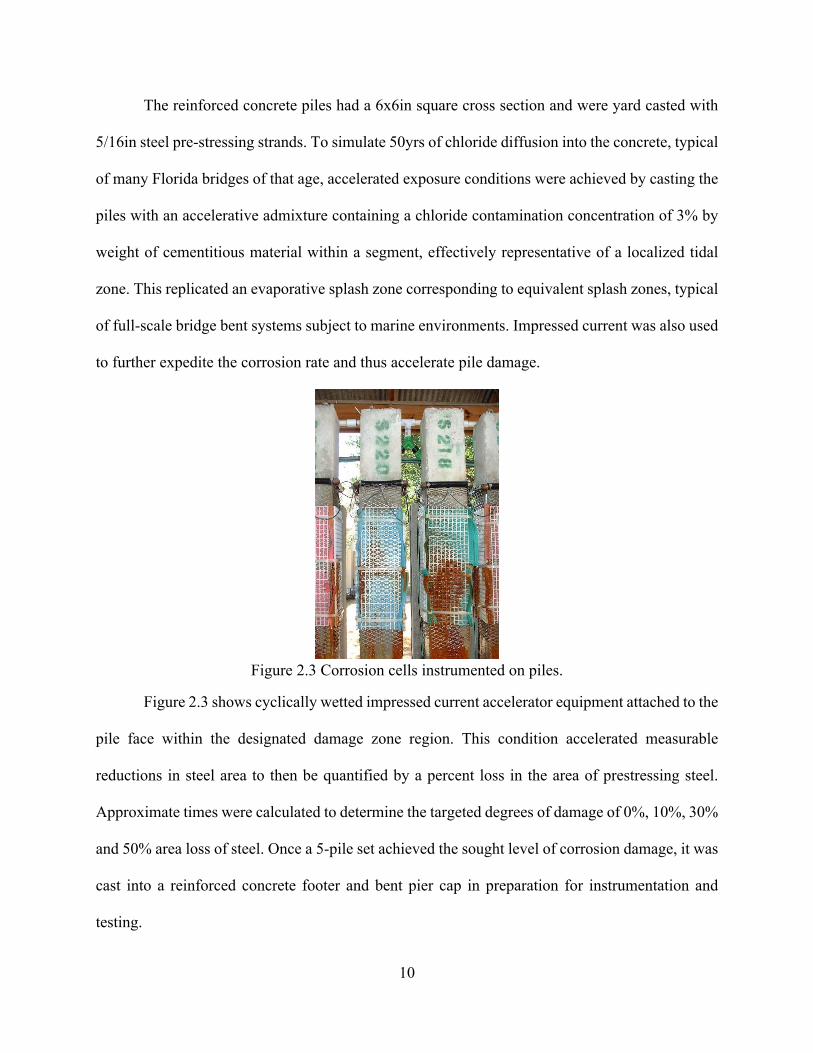
The reinforced concrete piles had a 6x6in square cross section and were yard casted with
5/16in steel pre-stressing strands. To simulate 50yrs of chloride diffusion into the concrete, typical
of many Florida bridges of that age, accelerated exposure conditions were achieved by casting the
piles with an accelerative admixture containing a chloride contamination concentration of 3% by
weight of cementitious material within a segment, effectively representative of a localized tidal
zone. This replicated an evaporative splash zone corresponding to equivalent splash zones, typical
of full-scale bridge bent systems subject to marine environments. Impressed current was also used
to further expedite the corrosion rate and thus accelerate pile damage.
Figure 2.3 Corrosion cells instrumented on piles.
Figure 2.3 shows cyclically wetted impressed current accelerator equipment attached to the
pile face within the designated damage zone region. This condition accelerated measurable
reductions in steel area to then be quantified by a percent loss in the area of prestressing steel.
Approximate times were calculated to determine the targeted degrees of damage of 0%, 10%, 30%
and 50% area loss of steel. Once a 5-pile set achieved the sought level of corrosion damage, it was
cast into a reinforced concrete footer and bent pier cap in preparation for instrumentation and
testing.
11
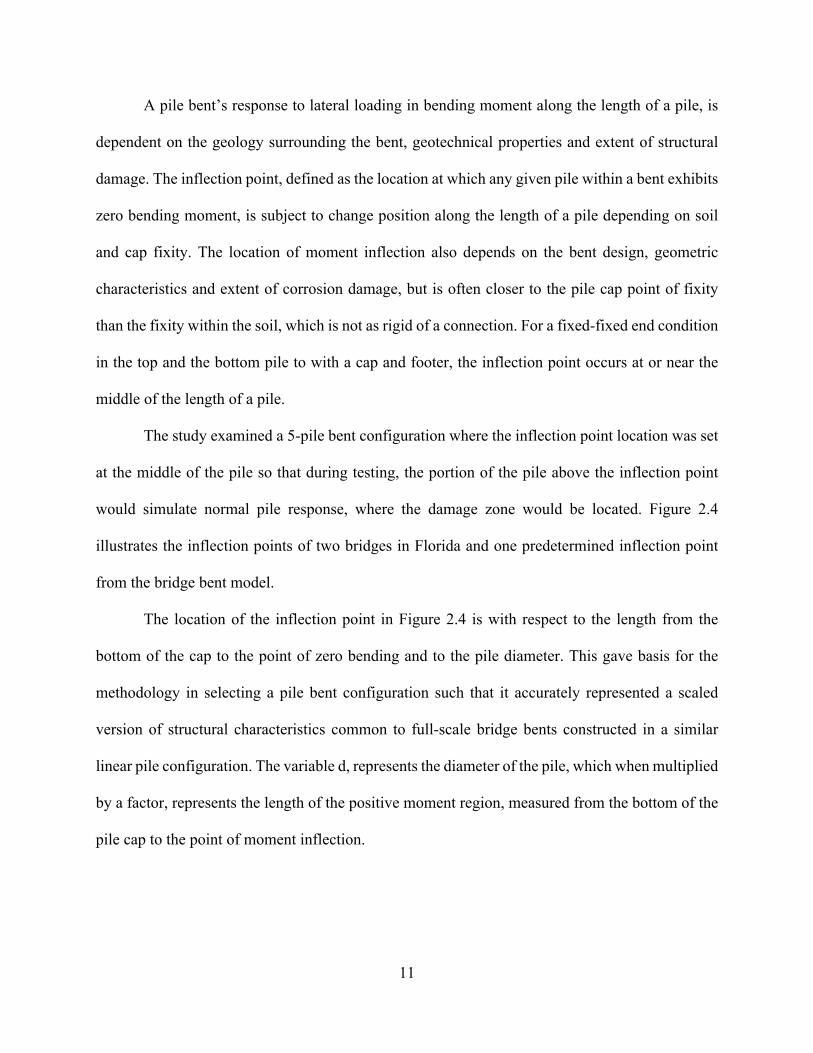
A pile bent’s response to lateral loading in bending moment along the length of a pile, is
dependent on the geology surrounding the bent, geotechnical properties and extent of structural
damage. The inflection point, defined as the location at which any given pile within a bent exhibits
zero bending moment, is subject to change position along the length of a pile depending on soil
and cap fixity. The location of moment inflection also depends on the bent design, geometric
characteristics and extent of corrosion damage, but is often closer to the pile cap point of fixity
than the fixity within the soil, which is not as rigid of a connection. For a fixed-fixed end condition
in the top and the bottom pile to with a cap and footer, the inflection point occurs at or near the
middle of the length of a pile.
The study examined a 5-pile bent configuration where the inflection point location was set
at the middle of the pile so that during testing, the portion of the pile above the inflection point
would simulate normal pile response, where the damage zone would be located. Figure 2.4
illustrates the inflection points of two bridges in Florida and one predetermined inflection point
from the bridge bent model.
The location of the inflection point in Figure 2.4 is with respect to the length from the
bottom of the cap to the point of zero bending and to the pile diameter. This gave basis for the
methodology in selecting a pile bent configuration such that it accurately represented a scaled
version of structural characteristics common to full-scale bridge bents constructed in a similar
linear pile configuration. The variable d, represents the diameter of the pile, which when multiplied
by a factor, represents the length of the positive moment region, measured from the bottom of the
pile cap to the point of moment inflection.

12
Figure 2.4 Inflection points of Florida bridges and modeled bridge (Goulish, 2002).
Figure 2.5 Testing instrumentation on pile bent (Goulish, 2002).
Figure 2.5 shows the instrumentation required to measure point specified displacements,
test equipment shear resistance, pile stresses and bent lateral translation and bent parallel
translation. Hydraulic actuators placed atop the concrete cap directly above the piles, sustained 10
kip axial loads on all five piles. This was regulated though pressure sensor transducers with an
automatic pump relay set to maintain 4000 psi in the hydraulic line. Linear variable displacement
gauges (LVDT) were placed at quarter points along the pile to measure lateral displacement.
13
Concrete strain gauges were mounted to determine pile stress in multiple locations along the length
of each pile. Shear load cells were used to calibrate lateral displacement of the cap due to friction
between the roller cap frame and the concrete specimen.
The prime objective of the study was to assess lateral capacity reduction in pile bents under
service dead loads due to lateral loads. The test results indicated that lateral capacity reductions
under these conditions were relatively small given the extraordinary level of damage. However,
there was considerable reduction in stiffness and ductility in specimens corroded to 30% and 50%
that led to sudden and catastrophic failure. Brief details are given below:
a. 10% Model Bent - the reduction of the ultimate lateral capacity of this bent was barely
noticeable at approximately 1% of loss. The load-displacement response however
demonstrated a softer response after yielding.
b. 30% Model Bent - the reduction of the ultimate lateral capacity was more severe at this
level of damage, proving to be 13% below the undamaged control. Although the initial
stiffness of the load-displacement response was similar to the control, the yield load was
reduced by 0.4 kips and its ultimate capacity achieved at a displacement that was 13 mm
(0.5 in) smaller. Catastrophic failure in three out of the five piles occurred at a displacement
of 89 mm (3.49 in).
c. 50% Model Bent - the reduction of the ultimate lateral capacity was found to be only 30%.
The stiffness of the pile bent was approximately half that of the control and the ultimate
capacity reached at a displacement that was 25 mm (1 in) less. Catastrophic failure occurred
in all five piles at a lateral displacement of 59 mm (2.31 in), more than 25 mm (1 in) less
than in the 30% model bent.

14
Provided the controlled setting of the experiment, specifically the extent and location of
subjected damage to the piles, Table 2.2 provides results from testing and illustrates the increasing
trend of capacity reduction with respect to increasing loss of area of prestressing steel. Figure 2.6
illustrates that as a bent is damaged by corrosion, the structure exhibits loss in stiffness, ductility
and lateral load carrying capacity. Decreased axial capacity, decreased lateral capacity, and
decreased maximum displacements are observable in Table 2.2 and dependent on percentage levels
of strand loss in each bent case.
Table 2.2 Max load and displacement response with respect to increasing damage level.Max. Lateral
Load PL
Displacement @
Max. Lateral Load
Maximum
DisplacementModel Bent
kips kN in. cm in. cm
Capacity
Reduction
Multiplier
Control 9.35 41.6 2.75 7 >5.5 >14.0 1
10% Mass Loss 9.26 41.2 4.17 10.6 >6 >15.2 0.99
30% Mass Loss 7.1 31.6 2.25 5.7 3.49 8.9 0.76
50% Mass Loss 6.58 29.3 1.88 4.8 2.31 5.9 0.7
Figure 2.6 Lateral load vs lateral displacement at pile cap (Goulish 2002).

15
Table 2.3 Undamaged bent measured loss in capacity due to loss in steel area.
Loss in Area of Steel
Percent Reduction of
Capacity
@Max Lateral Load
Percent Reduction of
Displacement
@ Max Lateral Load
0% 0% 0%
10% -1% 52%
30% -24% -18%
50% -30% -57%
One may conceive from Table 2.3 that as damage within the critical damage zone of pile
increases, lateral capacity decreases and the maximum displacement decreases, indicative of a
more brittle response to lateral loading as steel area decreases.
Figure 2.7 50% damage bent prior to testing.
Figure 2.7 shows the 50% damaged pile bent configuration inset within the testing frame
pre-test and post-test of pile cap severance. Approximately twenty years after the piles were
originally cast, a FRP pile repair scheme will be developed with the intent of fully restoring the
capacity of the piles and bridge bent to the uncorroded conditions.

16
2.6 Scope of Study
Five corrosion damaged piles, now with far greater than 50% steel loss remain at the
outdoor research compound at USF. These provide just enough pile specimens to test a bridge
bent, after being repaired with FRP technology. The damage states of the piles vary, but all exhibit
extensive cracking in the simulated splash zone. Piles are often times repaired through methods of
cracked concrete cover removal, then formed back to the original dimensions. This approach
however, cannot reintroduce existing structural load into the repair without jacking up the bridge
during repair, then releasing the load into the newly repaired piles.
To minimize disturbance to the cover material for at least four of the five piles, the
following steps are envisioned: cleaning, patching cracks at the surface, injecting internal cracks
with a highly mobile epoxy, and providing a structural CFRP wrap to restore the bending capacity,
assuming 100% steel loss might exist.
The objective of this study is to model and design the repair required to restore ultimate
axial and bending capacity to a heavily corroded one-third scale prestressed 5-pile bent. This would
then lay the groundwork for the future FRP repair and laboratory testing of the 1/3rd scale bridge
bent.
Figure 2.8 is a plan view of the existing piles that indicates their position at the USF civil
engineering research facility and their identification markings. Figure 2.9 is an elevation view of
the test bent. Figure 2.10 provides the reinforcing scheme of the pile cap for the test bent. Both
Figure 2.9 and 2.10 replicate the dimensioning used in the past experiment in order to isolate
variability in testing results.

17
Figure 2.8 Existing pile identification.
Figure 2.9 Elevation view of bent.
Figure 2.10 Pile and cap reinforcing scheme.
18
CHAPTER 3: MODELING CORROSION DAMAGED PILE BENTS
This chapter details the use of FLPIER software to model corrosion damage and the repair
of corrosion damage to bridge pile bents with respect to lateral capacity subsequent to loss in
effective area in prestressing steel. The variables considered to construct the model skeleton were
analyzed with respect to the degree in which they affected the models structural response. This is
in reference to the measured control structural response test data via lateral load-displacement
curves. Once a model satisfied a response within a tolerance from that of the measured control
bent testing response from the pilot experiment, it was designated as the control model. Models
that represent damage are subsidiary to the control model in that they possess identical control
variables and vary only in the severity of corrosion damage at which they are run.
3.1 FLPIER
FLPIER is a non-linear analysis software program that prompts users to input geological
soil profiles, geotechnical material properties, structural load combinations and structural material
properties. In specific, the program non-linearly, segmentally analyzes a structural response to user
defined load cases and input parameters. The purpose and application, within this study, is to
accurately model the measured experimental data (signal match) in order to institute an adequate
repair design, material selection, and testing procedure.
To be discussed are parametric evaluations and descriptions of model-runs, where the basis
of accuracy in observing model behavior directly references the measured lateral-load structural
response from the previous study. Therein, signal matching is the process whereby the measured
19
load vs displacement is used as a comparison and where a model is adjusted until modeled response
matches that with was measured.
3.2 Model Assumptions
To maintain tolerable and sound scientific reasoning for both damaged and repaired
models, while adhering to software limitations, it is assumed that a variety of structural response
influencing variables are simplified to geometrically designated segment lengths. After having
modeled the pile group to its exacting nature, the overlay of accounted variables and the nodes at
which FLPIER analyzes a structure, ultimately lead the model to indefinitely iterate. This gave
basis for simplification of both the control model and subsequently the damaged and repaired
models.
FLPIER is programmed to analyze a pile along its length with 17 nodes or 16 segments per
pile Figure 3.1 illustrates the nodal configuration for all designed models. The length of a pile in
FLPIER begins at the bottom of the substructure pile cap and ends at the toe of the pile. This
discretization also assigns one segment between the bottom of the pile cap and the beginning of
soil. The remaining 15 elements are equally spaced longitudinally within the highly indeterminate
soil layers.
For this project, eight segments with varied cross sectional parameters were overlain within
the 16 available sections. This provided a means to input changes in cross section strengths,
resulting from loss of steel, steel prestress and concrete precompression.
Influencing variables, including geometric characteristics, pre-stress transfer length,
moduli of elasticity, and steel stress levels, were simplified to reside within the confines of the
fixed-nodal characteristics governing FLPIER.
20
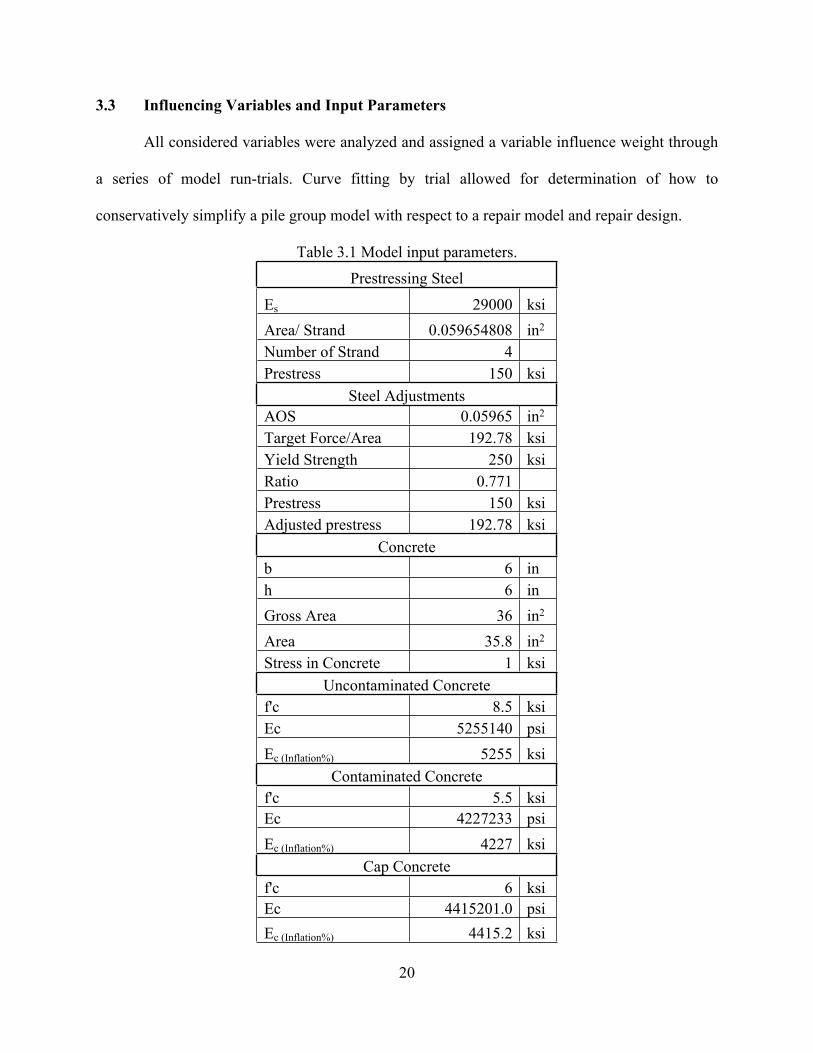
3.3 Influencing Variables and Input Parameters
All considered variables were analyzed and assigned a variable influence weight through
a series of model run-trials. Curve fitting by trial allowed for determination of how to
conservatively simplify a pile group model with respect to a repair model and repair design.
Table 3.1 Model input parameters.
Prestressing Steel
Es 29000 ksi
Area/ Strand 0.059654808 in2
Number of Strand 4
Prestress 150 ksi
Steel Adjustments
AOS 0.05965 in2
Target Force/Area 192.78 ksi
Yield Strength 250 ksi
Ratio 0.771
Prestress 150 ksi
Adjusted prestress 192.78 ksi
Concrete
b 6 in
h 6 in
Gross Area 36 in2
Area 35.8 in2
Stress in Concrete 1 ksi
Uncontaminated Concrete
f'c 8.5 ksi
Ec 5255140 psi
Ec (Inflation%) 5255 ksi
Contaminated Concrete
f'c 5.5 ksi
Ec 4227233 psi
Ec (Inflation%) 4227 ksi
Cap Concrete
f'c 6 ksi
Ec 4415201.0 psi
Ec (Inflation%) 4415.2 ksi

21
Table 3.1 represents parameters used in developing determining an adequate curve match
and provided the basis for values used within the FLPIER models to achieve a conservative CFRP
repair design. Figure 3.1 illustrates the nodes at which FLPIER performs analysis within the
constructed structural system.
Figure 3.1 FLPIER nodes.
3.4 Modulus of Elasticity of Concrete
The modulus of elasticity values used within the models had the most significant effect on
the model stiffness concerning the bents elastic response during lateral loading. Beyond the elastic
limit of the system, the models indicated a decreasing trend to a damaged bents ductility when
compared to increasing damage levels.
Section 19.2.2 of ACI 318-14 states that “The modulus of elasticity for concrete is sensitive
to the modulus of elasticity of aggregate and mixture proportions of the concrete. Measured elastic
modulus values can range from 80 to 120 percent of calculated values” (ACI 318-14 315).

22
From the above statement, the initial damage model’s cap and piles were swept with the
suggested measured elastic modulus percent range. The inflation and deflection percentage applied
to the average measure concrete compressive strength provided a range of curves that was used to
isolate an influencing variable that may result in deviations from accurate displacement model data
analysis. Figure 3.2 illustrates that within the elastic region of the curve, a model run with a
concrete compressive strength at the high range of 20% inflation, results in a curve that is
elastically similar to the measured undamaged control model. In subsequent repair models, no
moduli inflation percentages were considered as to apply a conservative assumed stiffness to the
repaired models.
0 0.5 1 1.5 2 2.5 3
0
1
2
3
4
5
6
7
8
9
10
11
Undamaged Measured
Undamaged Modeled
Undamaged Modeled 10%
Concrete Modulus Inflation
Undamaged Modeled 20%
Concrete Modulus Inflation
Lateral Response vs Concrete Modulus Inflation
Cap Displacement (in)
Late
ral
Loa
d (
kip
s)
Figure 3.2 Modeling undamaged bent varying concrete modulus.

23
Prestress input values in units of ksi within a designated segment were solved through the
force equilibrium between prestressing strand tension and concrete compression target and actual
stress. The target prestressing force in the pilot study and in modeling the study was 11.5 kips,
where within the model, a value of 1ksi is assumed for the target concrete precompression stress.
The mathematical model to follow (Figure 3.3), assumes adequate bond between the
prestressing strands and the core of the concrete. It represents prestress loss force equilibrium
accounting for loss in effective area of prestressing strands due to corrosion. Table 3.3 assumes a
70% prestress pull factor to 250 ksi prestressing strands and assumes no inflation percentage to
the concrete modulus in preparation for the input of conservative parameters leading toward the
repair design.
Figure 3.3 Stress/Force change with respect to area of prestressing steel.
24
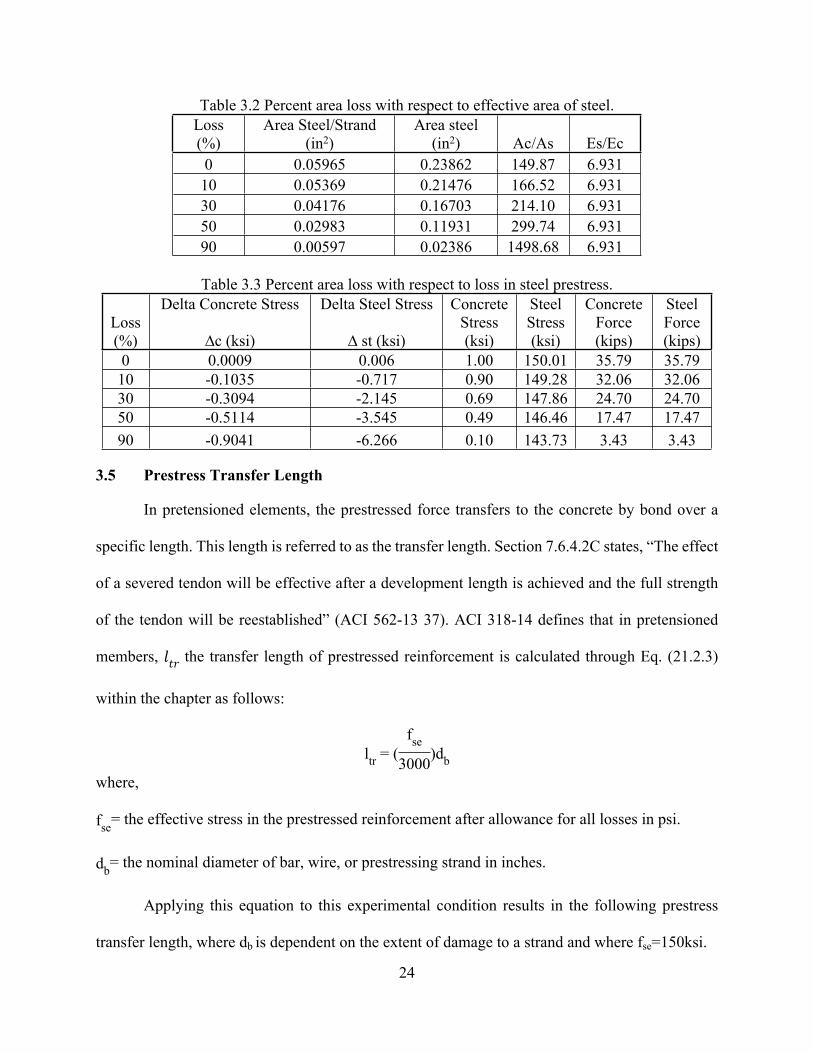
Table 3.2 Percent area loss with respect to effective area of steel.
Loss
(%)
Area Steel/Strand
(in2)
Area steel
(in2) Ac/As Es/Ec
0 0.05965 0.23862 149.87 6.931
10 0.05369 0.21476 166.52 6.931
30 0.04176 0.16703 214.10 6.931
50 0.02983 0.11931 299.74 6.931
90 0.00597 0.02386 1498.68 6.931
Table 3.3 Percent area loss with respect to loss in steel prestress.
Delta Concrete Stress Delta Steel Stress Concrete Steel Concrete Steel
Loss
(%) ∆c (ksi) ∆ st (ksi)
Stress
(ksi)
Stress
(ksi)
Force
(kips)
Force
(kips)
0 0.0009 0.006 1.00 150.01 35.79 35.79
10 -0.1035 -0.717 0.90 149.28 32.06 32.06
30 -0.3094 -2.145 0.69 147.86 24.70 24.70
50 -0.5114 -3.545 0.49 146.46 17.47 17.47
90 -0.9041 -6.266 0.10 143.73 3.43 3.43
3.5 Prestress Transfer Length
In pretensioned elements, the prestressed force transfers to the concrete by bond over a
specific length. This length is referred to as the transfer length. Section 7.6.4.2C states, “The effect
of a severed tendon will be effective after a development length is achieved and the full strength
of the tendon will be reestablished” (ACI 562-13 37). ACI 318-14 defines that in pretensioned
members, the transfer length of prestressed reinforcement is calculated through Eq. (21.2.3) ���within the chapter as follows:
ltr
= (
fse
3000)d
b
where,
= the effective stress in the prestressed reinforcement after allowance for all losses in psi.fse
= the nominal diameter of bar, wire, or prestressing strand in inches.db
Applying this equation to this experimental condition results in the following prestress
transfer length, where db is dependent on the extent of damage to a strand and where fse=150ksi.
25
Applying this equation to the parameters of this experiment is shown below for two conditions.
For undamaged prestressing steel condition:
ltr
= (150,000
3000)(0.2756) = 13.78 inches
For 90% prestressing steel area loss condition:
ltr
= (150,000
3000)(0.2614) = 13.07 inches
Experimental research practice indicates a prestressing strand’s transfer length is
approximately equal to 60 to 100 times the diameter of a strand, after allowance for all losses.
However, as a strand becomes damaged by corrosion, it volumetric cross-sectional area increases,
while its effective cross-sectional area decreases. This aspect of damage allots for a degree of
uncertainty in determining the length in which a given prestressing strand is able to adequately
transfer a target concrete precompression stress value of nearly 1 ksi. Table 3.4 illustrates prestress
transfer lengths provided a variable transfer length range for a stand undamaged by corrosion.
Table 3.4 Diameter of stand multiplication factors.
Diameter X Diameter Strand (in) Transfer Length (in)
60 0.3125 18.75
70 0.3125 21.87
80 0.3125 25.00
90 0.3125 28.12
100 0.3125 31.25
The control model was swept with varying prestress transfer lengths and cross-referenced
with measured lateral load vs lateral cap displacement curves. It is assumed for all models to have
a transfer length of 16 inches measured from the bottom of the cap, which does not correspond to
of a strand exactly, but is reasonable to assume provided the level of uncertainty in 70 x diameter
the extent of steels damage influence on transfer length. This approximation is within reason to
the calculated transfer length from ACI 318-14, and geometrically fits within the allotted 8in per
26
segment located 16 inches from the bottom of the cap to node 3. This length also takes into account
the 4 inches of pile embedment into the cap when referencing into FLPIER.
Conclusively, it was decided to set the overall prestress transfer length to equal the length
of two segments within the model, which corresponds to two 8 inch segments, totaling a 20 inches,
with a 4-inch pile cap embedment and a target prestress value of 150ksi. Therefore, cap embedment
included, the actual transfer length input used for all models equals 20in, which corresponds to
nearly 70 times the diameter of the strand.
3.6 Undamaged Control Model
The control model first consisted of 11 segments where all of the models variables were
input geometrically precise. Once the model was retrofit for the repair, the models would not
account for the exacting precision. Thus a decision to approximate the segments such that the
variables fit within reasonable tolerance of acceptable segment lengths. This resulted in a model
consisting of 8 segments, where there is one large segment after the prestress was considered fully
transferred. The damage region prestress values were edited with respect toward loss of effective
prestress due to loss of reinforcing steel area. Seven segments are 8 inches in length and one
segment is 72 inches in length.
This geometrical simplification allowed for accurate representation for all variables and
gave rise to the repair model baseline. Figure 3.5 illustrates the final pile segment configuration
used throughout all of the models. It is the result of simplification to segmentation of the model in
order to reflect all of the investigated influencing structural parameters with respect to the damaged
region and pile bent response when place under lateral load.
FLPIER analyzes a pile group only if the group is embedded in soil. Since the experimental
bent is not tested in soil, and instead has a footer, the soil used to replicate the experiment test
within the model reflects soil properties of which a pile group is essentially embedded into the
27
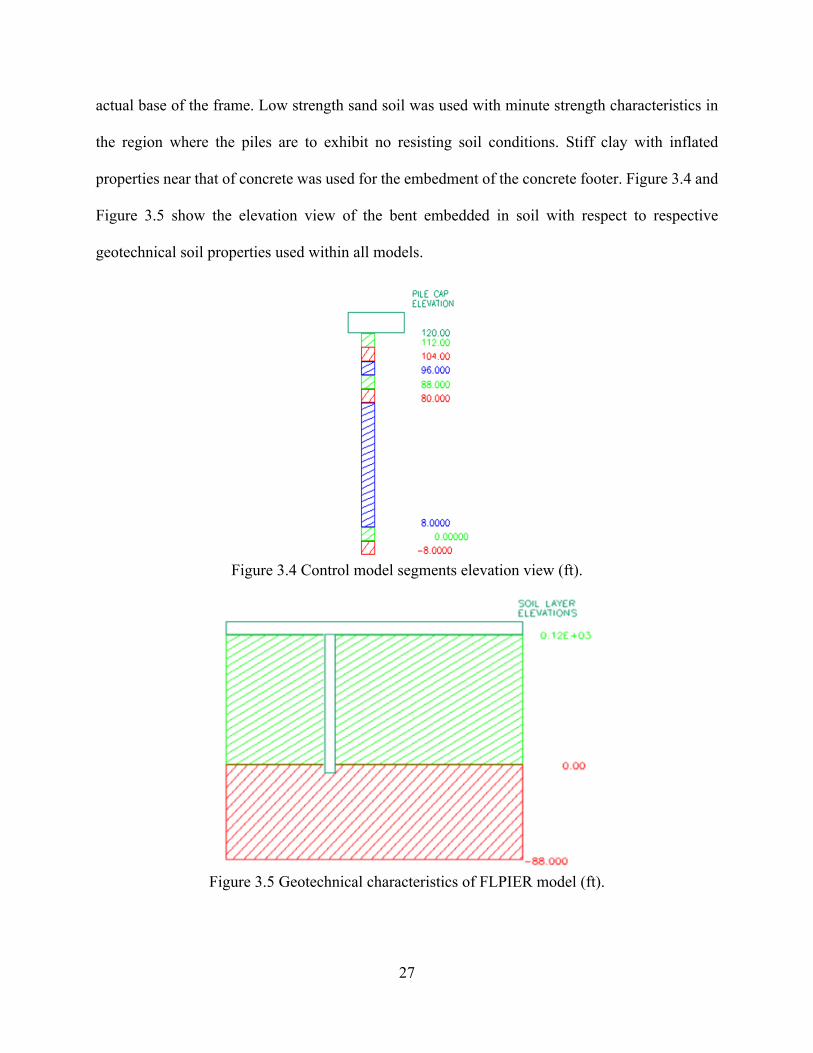
actual base of the frame. Low strength sand soil was used with minute strength characteristics in
the region where the piles are to exhibit no resisting soil conditions. Stiff clay with inflated
properties near that of concrete was used for the embedment of the concrete footer. Figure 3.4 and
Figure 3.5 show the elevation view of the bent embedded in soil with respect to respective
geotechnical soil properties used within all models.
Figure 3.4 Control model segments elevation view (ft).
Figure 3.5 Geotechnical characteristics of FLPIER model (ft).
28
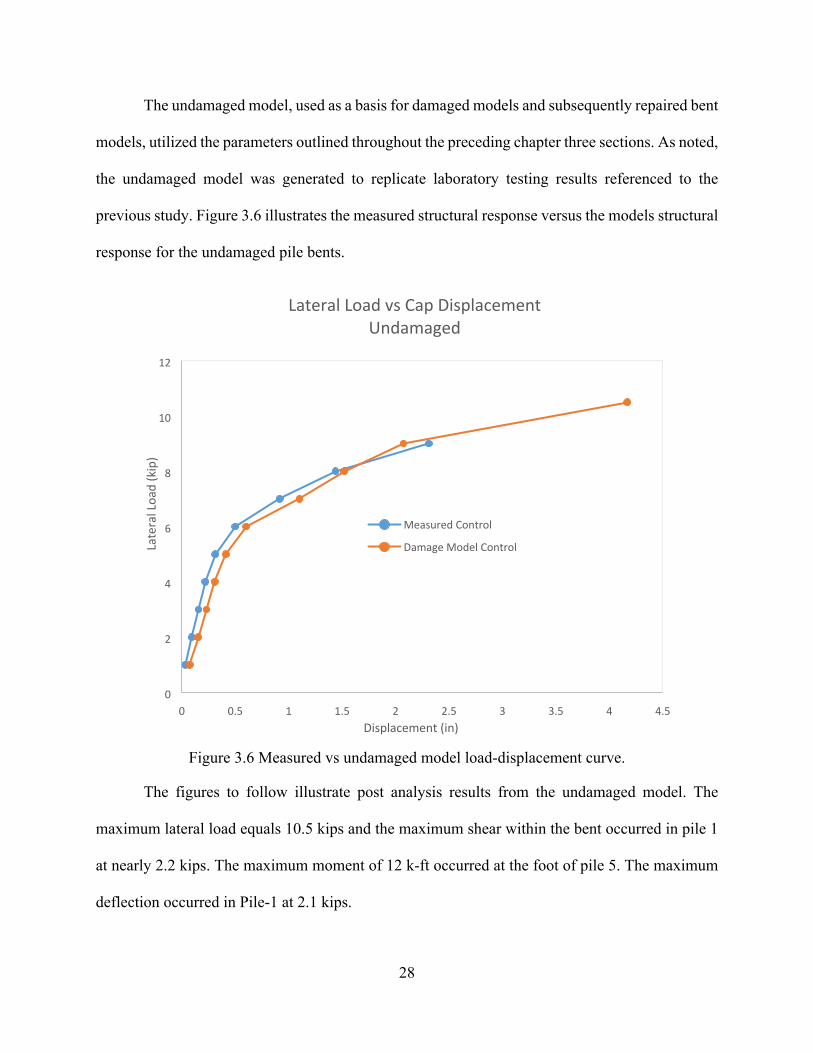
The undamaged model, used as a basis for damaged models and subsequently repaired bent
models, utilized the parameters outlined throughout the preceding chapter three sections. As noted,
the undamaged model was generated to replicate laboratory testing results referenced to the
previous study. Figure 3.6 illustrates the measured structural response versus the models structural
response for the undamaged pile bents.
0 0.5 1 1.5 2 2.5 3 3.5 4 4.5
0
2
4
6
8
10
12
Measured Control
Damage Model Control
Lateral Load vs Cap Displacement
Undamaged
Displacement (in)
Late
ral
Loa
d (
kip
)
Figure 3.6 Measured vs undamaged model load-displacement curve.
The figures to follow illustrate post analysis results from the undamaged model. The
maximum lateral load equals 10.5 kips and the maximum shear within the bent occurred in pile 1
at nearly 2.2 kips. The maximum moment of 12 k-ft occurred at the foot of pile 5. The maximum
deflection occurred in Pile-1 at 2.1 kips.

29
Figure 3.7 Pile count and coordinate orientation.
Figure 3.8 Undamaged model with sustained service loads and at ultimate lateral load.
30
Figure 3.9 Undamaged model max shear.
Figure 3.10 Undamaged model max moment.
31
Figure 3.11 Undamaged model max displacement.
Figure 3.12 Interaction diagram for load case 10.

32
3.7 Damaged Models
Once the determined control model was set as a basis, models were run with increasing
damage and lateral load vs displacement curves and interaction diagrams were generated and
compared with the control model. Figure 3.13 and Figure 3.14 illustrate the response to lateral
loading and the developed capacity with respect to increasing levels of damage, respectively.
0 0.5 1 1.5 2 2.5 3 3.5 4 4.5
0
2
4
6
8
10
12
Control Model
10% ALOS Model
30% ALOS Model
50% ALOS Model
90% ALOS Model
Lateral Load vs Cap Displacemenet
Damage Models
Displacement (in)
Late
ral
Loa
d (
kip
)
Figure 3.13 Response curves for all models.
33
0 20 40 60 80 100 120
-60
-40
-20
0
20
40
60
80
100
Control Model
10% ALOS Model
30% ALOS Model
50% ALOS Model
90% ALOS Model
Pn vs Mn
Damage Models
Mn (kip-in)
Pn
(k
ip)
Figure 3.14 Interaction envelope for all models.
The following plots and figures illustrate maximum loading scenarios for various structural
responses. The figures to follow demonstrate pile position within the bent, sustained axial loads
and maximum lateral load, axial pile response, lateral displacement response, and shear and
bending responses with respect to damage at 90% area loss of steel within the damage region.
34
Figure 3.15 90% damaged pile count.
Figure 3.16 90% damaged model sustained service loads and ultimate lateral load.

35
Figure 3.17 90% damaged model max shear.
Figure 3.18 90% damaged model max moment.
36
Figure 3.19 90% damaged model max axial force.
Figure 3.20 90% damaged model max displacement.
37
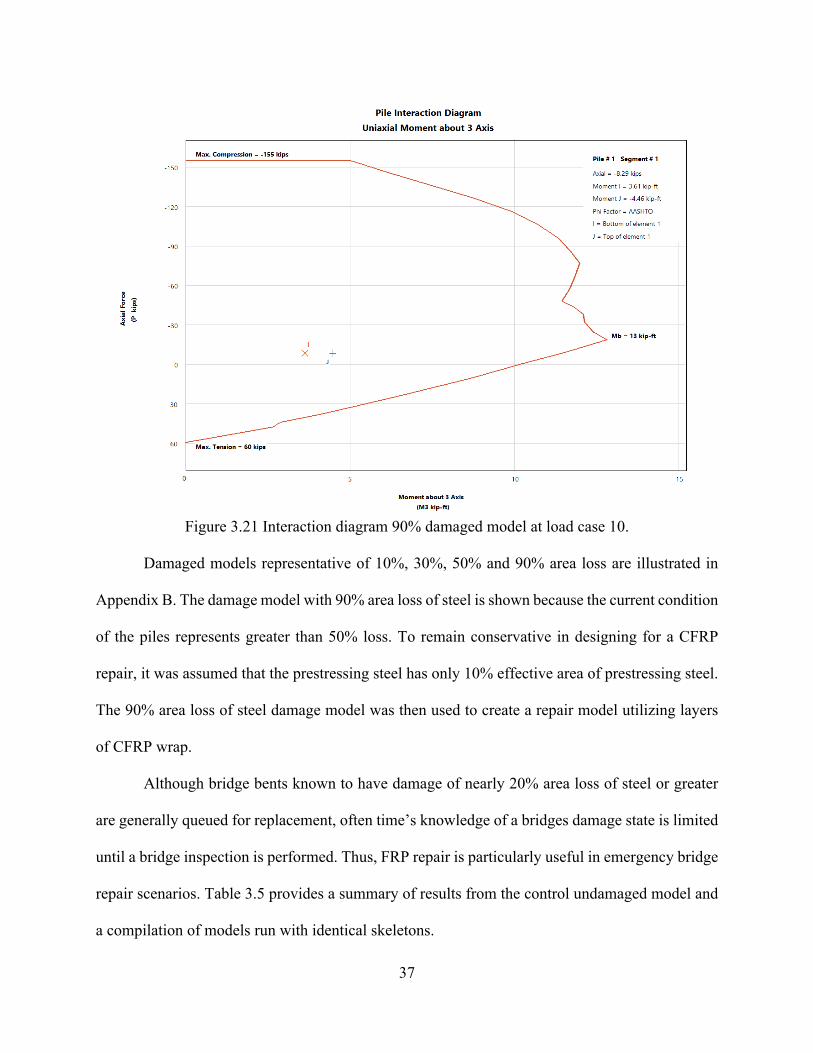
Figure 3.21 Interaction diagram 90% damaged model at load case 10.
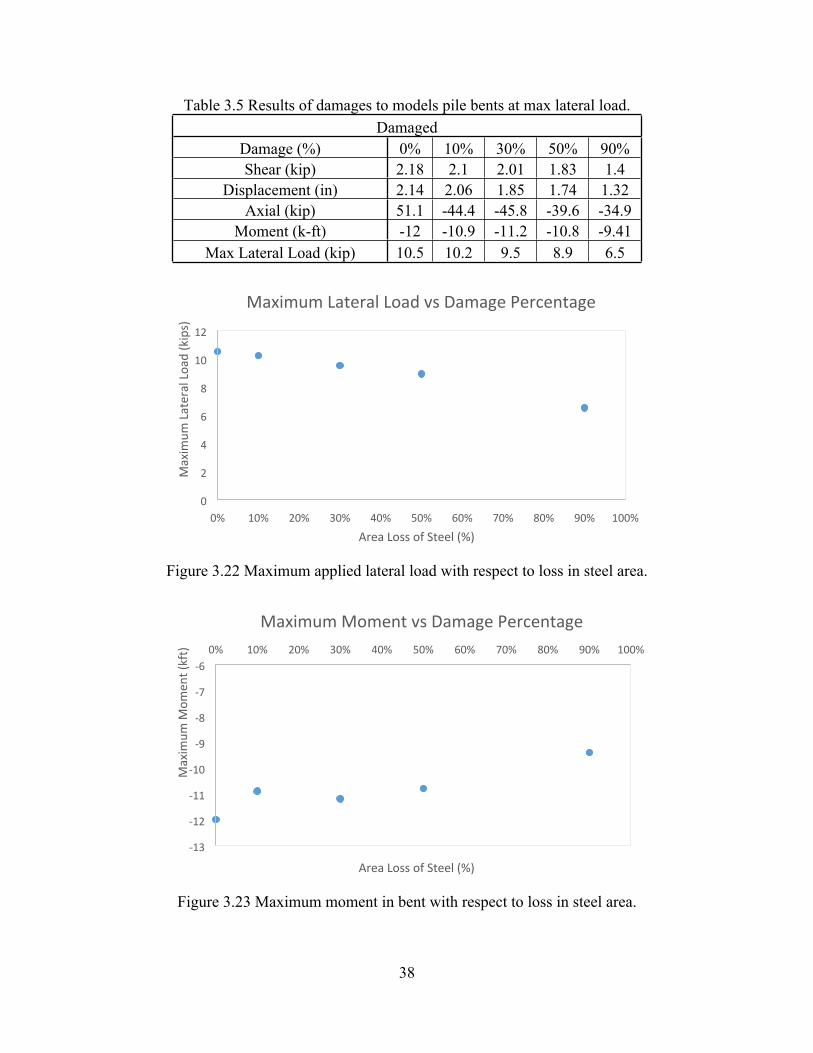
Damaged models representative of 10%, 30%, 50% and 90% area loss are illustrated in
Appendix B. The damage model with 90% area loss of steel is shown because the current condition
of the piles represents greater than 50% loss. To remain conservative in designing for a CFRP
repair, it was assumed that the prestressing steel has only 10% effective area of prestressing steel.
The 90% area loss of steel damage model was then used to create a repair model utilizing layers
of CFRP wrap.
Although bridge bents known to have damage of nearly 20% area loss of steel or greater
are generally queued for replacement, often time’s knowledge of a bridges damage state is limited
until a bridge inspection is performed. Thus, FRP repair is particularly useful in emergency bridge
repair scenarios. Table 3.5 provides a summary of results from the control undamaged model and
a compilation of models run with identical skeletons.
38
Table 3.5 Results of damages to models pile bents at max lateral load.
Damaged
Damage (%) 0% 10% 30% 50% 90%
Shear (kip) 2.18 2.1 2.01 1.83 1.4
Displacement (in) 2.14 2.06 1.85 1.74 1.32
Axial (kip) 51.1 -44.4 -45.8 -39.6 -34.9
Moment (k-ft) -12 -10.9 -11.2 -10.8 -9.41
Max Lateral Load (kip) 10.5 10.2 9.5 8.9 6.5
0% 10% 20% 30% 40% 50% 60% 70% 80% 90% 100%
0
2
4
6
8
10
12
Maximum Lateral Load vs Damage Percentage
Area Loss of Steel (%)
Ma
xim
um
La
tera
l Lo
ad
(k
ips)
Figure 3.22 Maximum applied lateral load with respect to loss in steel area.
0% 10% 20% 30% 40% 50% 60% 70% 80% 90% 100%
-13
-12
-11
-10
-9
-8
-7
-6
Maximum Moment vs Damage Percentage
Area Loss of Steel (%)
Ma
xim
um
Mo
me
nt
(kft
)
Figure 3.23 Maximum moment in bent with respect to loss in steel area.

39
0% 10% 20% 30% 40% 50% 60% 70% 80% 90% 100%
0
0.5
1
1.5
2
2.5
Maximum Shear vs Damage Percentage
Area Loss of Steel (%)
Ma
xim
um
Sh
ea
r (k
ips)
Figure 3.24 Maximum shear in bent with respect to loss in steel area.
0% 10% 20% 30% 40% 50% 60% 70% 80% 90% 100%
0
0.5
1
1.5
2
2.5
Maximum Lateral Displacement vs Damage Percentage
Area Loss of Steel (%)
Ma
xim
um
Dis
pla
cem
en
t (k
ips)
Figure 3.25 Maximum lateral displacement in bent with respect to loss in steel area.

40
CHAPTER 4: MODELING FRP-REPAIRED PILE BENTS
Interaction diagrams were developed and used to interpret the efficacy of the number of
CFRP plies for a satisfactory repair. Lateral load versus lateral displacement of the cap was
analyzed using FLPier to model the reinstatement of lateral capacity through use of CFRP near the
exterior of the cross section of the five piles.
Figure 4.1 illustrates the three layers of repair which effectively is modeled as two layers
because the third layer does not assume to provide bending resistance to the structural system but
instead provides passive confinement and shear resistance.
Figure 4.1 CFRP design schematic.

41
4.1 CFRP Tensile Design Calculation
A calculation for an approximation to determine the number of plies was performed in
conjunction with software analysis. The following calculation is for tensile capacity design
considerations assuming 100% loss in steel area.
Figure 4.2 Strength requirements for repair material.
Since the carbon fiber selected produces a tensile average ultimate strength value of
7.2kips/in width, then only one layer is required to satisfy the loading conditions. However, two
longitudinal layers were selected in order to reside within a conservative design.
4.2 Repair Models and Carbon Shell Distribution
CFRP properties were simulated within the repair models by defining arbitrary “mild steel”
with material properties of carbon fiber. A shell was created around the outside of the pile cross-
section through a calculation that provided a bar diameter equivalency. Fifty to 60 bars were tightly
spaced with properties corresponding to carbon fiber. The thickness of the material was used from
the specification sheet to define the area to be used to create the FRP shell.
42
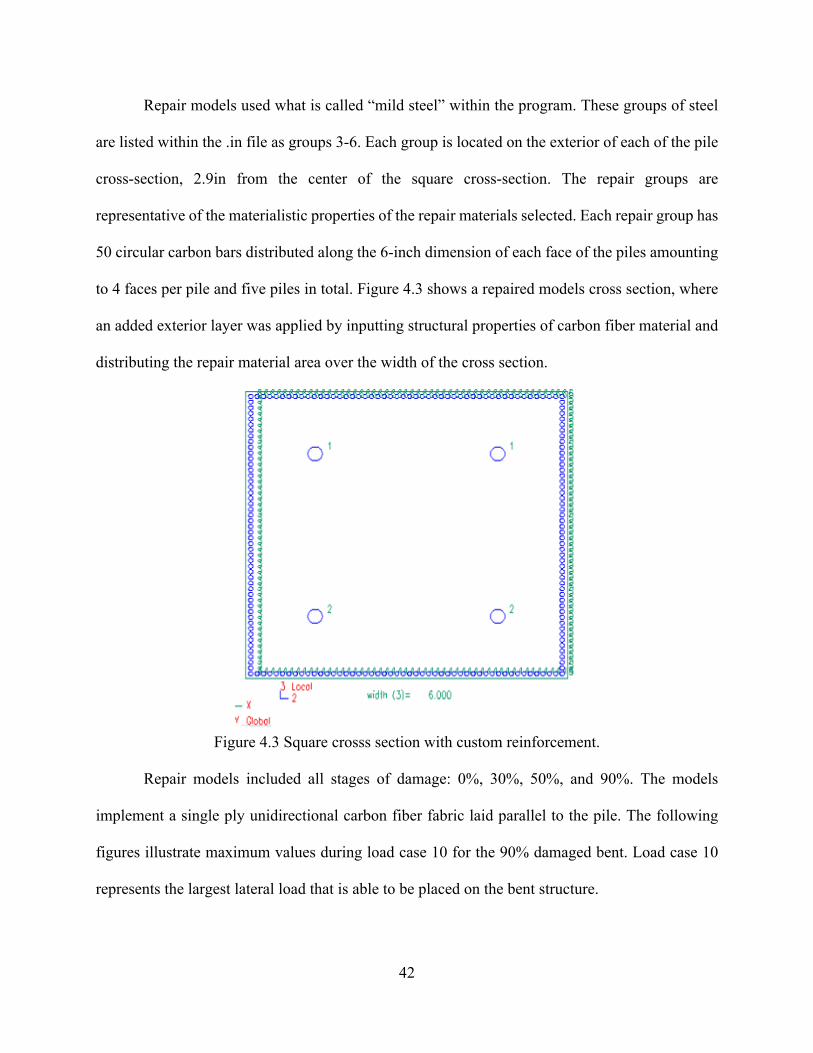
Repair models used what is called “mild steel” within the program. These groups of steel
are listed within the .in file as groups 3-6. Each group is located on the exterior of each of the pile
cross-section, 2.9in from the center of the square cross-section. The repair groups are
representative of the materialistic properties of the repair materials selected. Each repair group has
50 circular carbon bars distributed along the 6-inch dimension of each face of the piles amounting
to 4 faces per pile and five piles in total. Figure 4.3 shows a repaired models cross section, where
an added exterior layer was applied by inputting structural properties of carbon fiber material and
distributing the repair material area over the width of the cross section.
Figure 4.3 Square crosss section with custom reinforcement.
Repair models included all stages of damage: 0%, 30%, 50%, and 90%. The models
implement a single ply unidirectional carbon fiber fabric laid parallel to the pile. The following
figures illustrate maximum values during load case 10 for the 90% damaged bent. Load case 10
represents the largest lateral load that is able to be placed on the bent structure.
43
Table 4.1 Model results for single ply CFRP repair with respect to damage.
Single Ply Repair
Damage (%) 10% 30% 50% 90%
Shear (kip) 2.38 2.29 2.51 2.49
Displacement (in) 2.06 1.98 2.8 3.09
Axial (kip) -40.8 -39.6 -39.5 -49.1
Moment (k-ft) -14.2 13.5 14.2 14.3
Max Lateral Load (kip) 11.6 11.1 12.5 11.9
Figure 4.4 90% Single ply repaired damage at maximum load case.

44
Figure 4.5 90% single ply repaired damage at maximum load case.
Figure 4.6 90% single ply repaired damage shear at maximum load case.
45
Figure 4.7 90% single ply repaired damage moment at maximum load case.
Figure 4.8 90% single ply repaired damage axial at maximum lateral loading.
46
Figure 4.9 90% single ply repaired damage displacement at maximum load case.
Figure 4.10 Interaction diagram single ply damage repaired at load case 10.
47
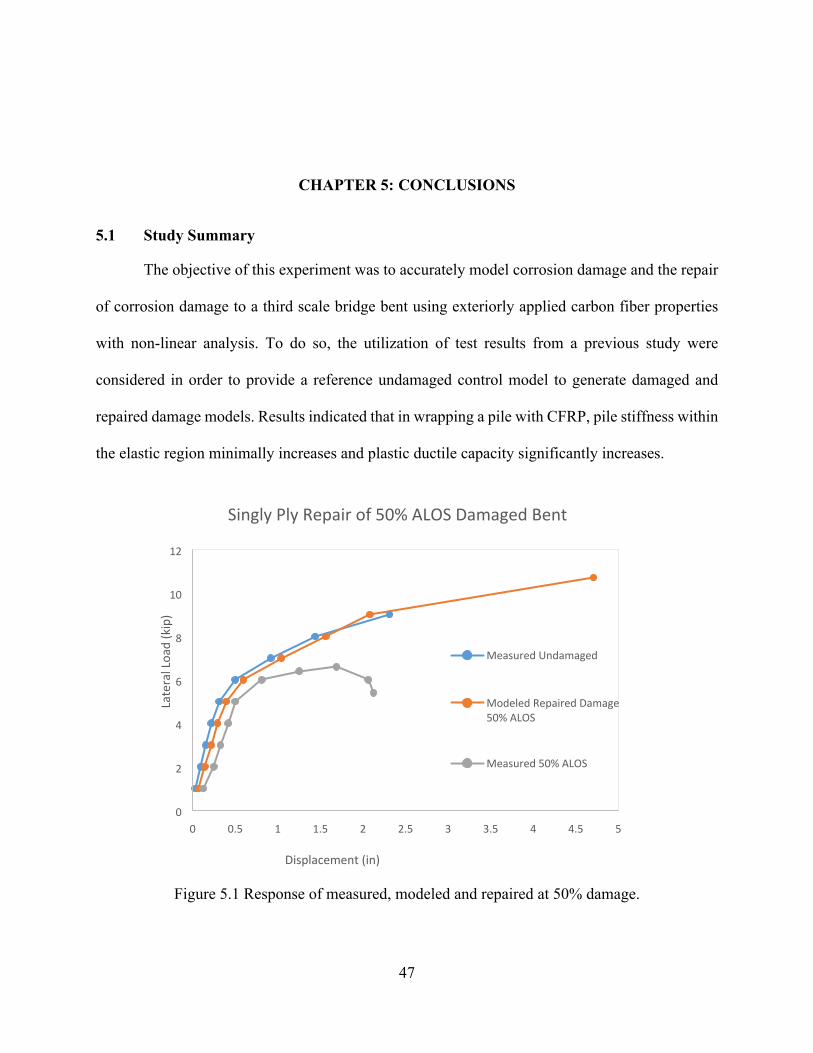
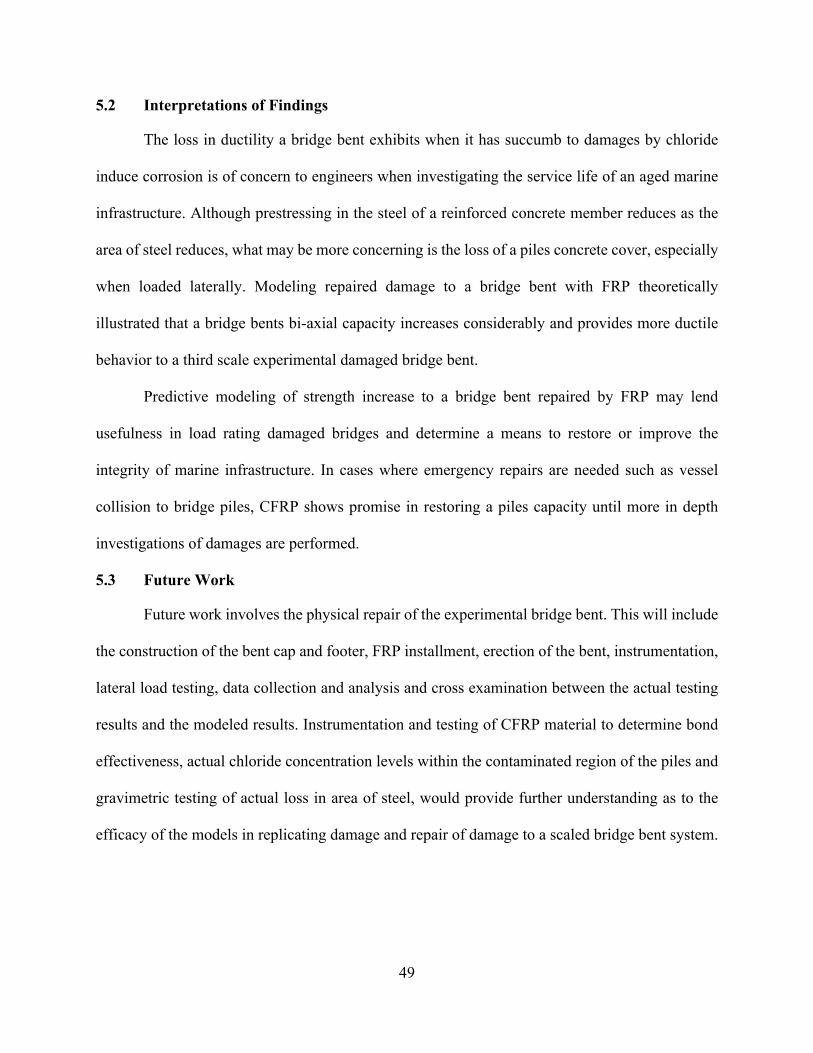
CHAPTER 5: CONCLUSIONS
5.1 Study Summary
The objective of this experiment was to accurately model corrosion damage and the repair
of corrosion damage to a third scale bridge bent using exteriorly applied carbon fiber properties
with non-linear analysis. To do so, the utilization of test results from a previous study were
considered in order to provide a reference undamaged control model to generate damaged and
repaired damage models. Results indicated that in wrapping a pile with CFRP, pile stiffness within
the elastic region minimally increases and plastic ductile capacity significantly increases.
0 0.5 1 1.5 2 2.5 3 3.5 4 4.5 5
0
2
4
6
8
10
12
Measured Undamaged
Modeled Repaired Damage
50% ALOS
Measured 50% ALOS
Singly Ply Repair of 50% ALOS Damaged Bent
Displacement (in)
Late
ral
Loa
d (
kip
)
Figure 5.1 Response of measured, modeled and repaired at 50% damage.
48
0 0.5 1 1.5 2 2.5 3 3.5 4 4.5 5
0
1
2
3
4
5
6
7
8
9
10
Measured Undamaged
Modeled Repaired Damage 90%
ALOS
Singly Ply Repair of 90% ALOS Repaired Bent
Displacement (in)
Late
ral
Loa
d (
kip
)
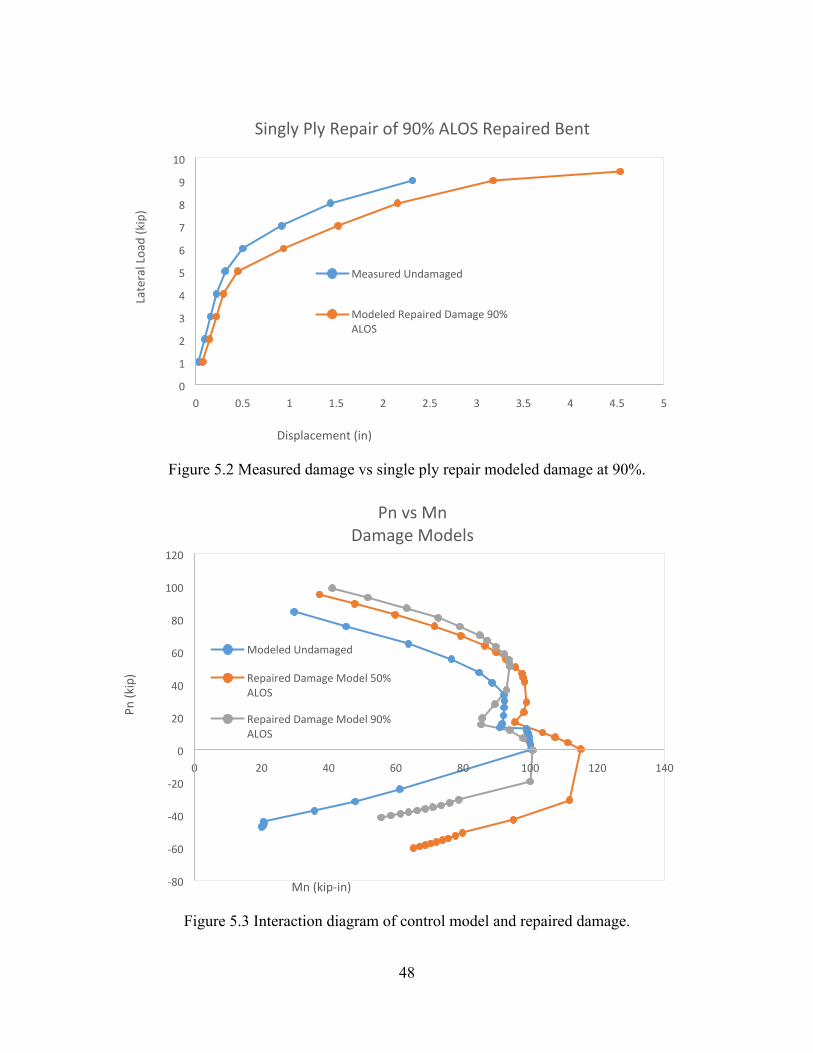
Figure 5.2 Measured damage vs single ply repair modeled damage at 90%.
0 20 40 60 80 100 120 140
-80
-60
-40
-20
0
20
40
60
80
100
120
Modeled Undamaged
Repaired Damage Model 50%
ALOS
Repaired Damage Model 90%
ALOS
Pn vs Mn
Damage Models
Mn (kip-in)
Pn
(k
ip)
Figure 5.3 Interaction diagram of control model and repaired damage.
49
5.2 Interpretations of Findings
The loss in ductility a bridge bent exhibits when it has succumb to damages by chloride
induce corrosion is of concern to engineers when investigating the service life of an aged marine
infrastructure. Although prestressing in the steel of a reinforced concrete member reduces as the
area of steel reduces, what may be more concerning is the loss of a piles concrete cover, especially
when loaded laterally. Modeling repaired damage to a bridge bent with FRP theoretically
illustrated that a bridge bents bi-axial capacity increases considerably and provides more ductile
behavior to a third scale experimental damaged bridge bent.
Predictive modeling of strength increase to a bridge bent repaired by FRP may lend
usefulness in load rating damaged bridges and determine a means to restore or improve the
integrity of marine infrastructure. In cases where emergency repairs are needed such as vessel
collision to bridge piles, CFRP shows promise in restoring a piles capacity until more in depth
investigations of damages are performed.
5.3 Future Work
Future work involves the physical repair of the experimental bridge bent. This will include
the construction of the bent cap and footer, FRP installment, erection of the bent, instrumentation,
lateral load testing, data collection and analysis and cross examination between the actual testing
results and the modeled results. Instrumentation and testing of CFRP material to determine bond
effectiveness, actual chloride concentration levels within the contaminated region of the piles and
gravimetric testing of actual loss in area of steel, would provide further understanding as to the
efficacy of the models in replicating damage and repair of damage to a scaled bridge bent system.
50
REFERENCES
American Association of State Highway and transportation Officials. (2012). Guide
Specifications for Design of Bonded FRP Systems for Repair and Strengthening of
Concrete Bridge Elements. Washington, DC.
American Concrete Institute. (1989). Corrosion of Metals in Concrete. Detroit, MI.
American Concrete Institute. (2002). Carbon Fiber-Reinforced Polymer Wraps for Corrosion
Control and Rehabilitation of Reinforced Concrete Columns. ACI Materials Journal,
129-137.
American Concrete Institute. (2008). Guide for the Design and Construction of Externally
Bonded FRP Systems for Strengthening Concrete Structures. Farmington Hills, MI.
American Concrete Institute. (2012). Guide Test Methods for Fiber-Reinforced Polymer (FRP)
Composites and Reinforcing or Strengthening Concrete and Masonry Structures.
Farmington Hills, MI.
American Concrete Institute. (2013). Code Requirements for Evaluation, Repair, and
Rehabilitation of Concrete Buildings (ACI 562-13). Farmington Hills, MI.
American Concrete Institute. (2014). Building Code Requirements for structural Concrete (ACI
318-14) and Commentary on Building Code Requirements for Structural Concrete (ACI
318R-14). Farmington Hills, MI.
Goulish, A. (2002). Lateral Capacity of Corrosion Damaged Pile Bents.
Hibbeler, R. C. (2012). Structural Analysis (8 ed.). Pearson Prentice Hall.
Mullins, G. A., Sen, R., & Goulish, A. J. (2002, May). Lateral Capacity of Corrosion Damaged
Pile Bents. Tampa, FL.
Mullins, G., Sen, R., Suh, K. S., & Winters, D. (2004). Underwater FRP Pile Wrap of the
Friendship Trails Bridge. Tampa, FL: University of South Florida.
Mullins, G., Sen, R., Suh, K., & Winters, D. (2005). Underwater Fiber-Reinforced Polymers
Repair of Prestressed Piles in the Allen Creek Bridge. Journal of Composites for
Construction, 136-146.
Nawy, E. G. (2001). High-Performance Concrete (2 ed.). John Wiley & Sons, Inc.
Wight, J. K. (2016). Reinforced Concrete Mechanics and Design (7 ed.). Pearson and Prentice
Hall.

51
Winters, D., Mullins, G., Sen, R., Schrader, A., & Stokes, M. (2008). Bond Enhancement for
FRP Repair in Tidal Waters. Journal of Composites for Construction, 334-343.

52
APPENDIX A: PILE DEFICIENCY MAPPING
53
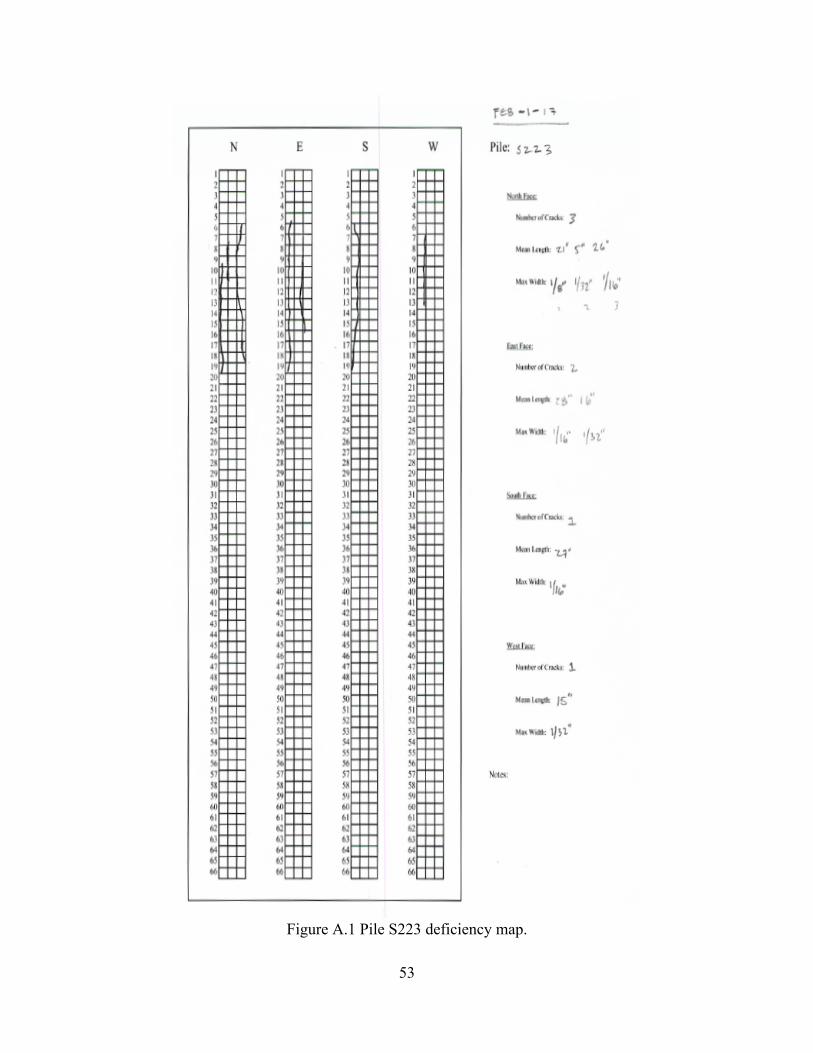
Figure A.1 Pile S223 deficiency map.
54
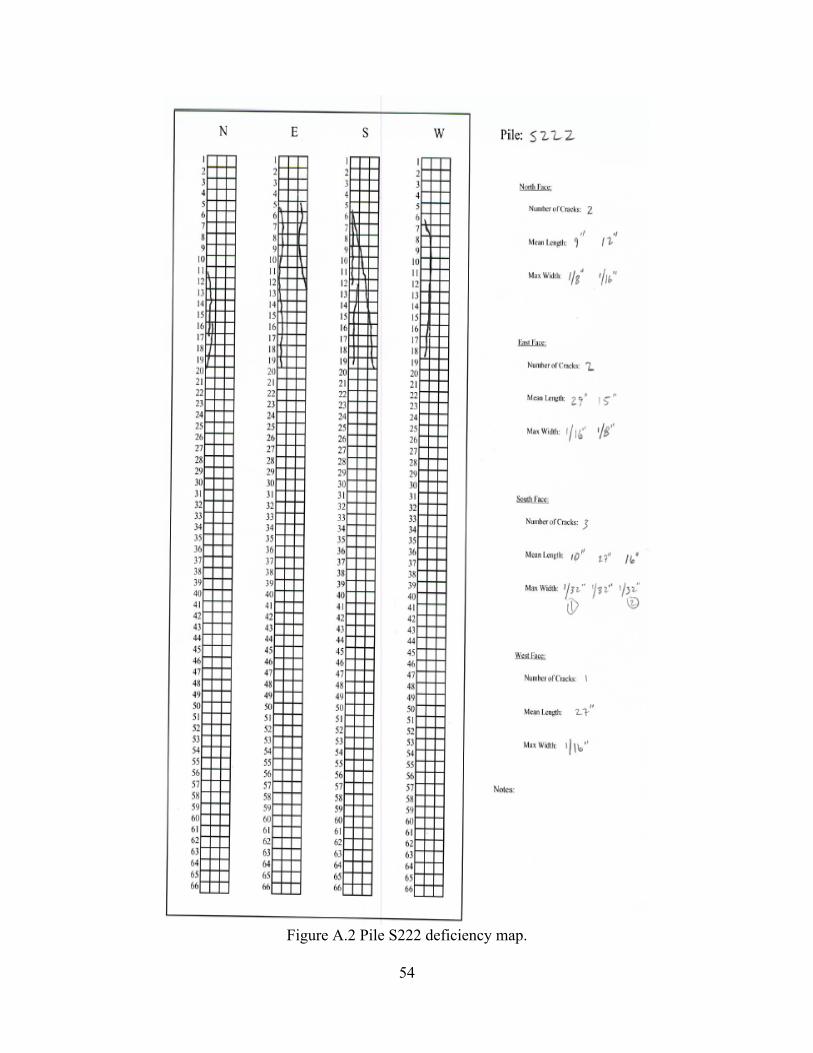
Figure A.2 Pile S222 deficiency map.
55
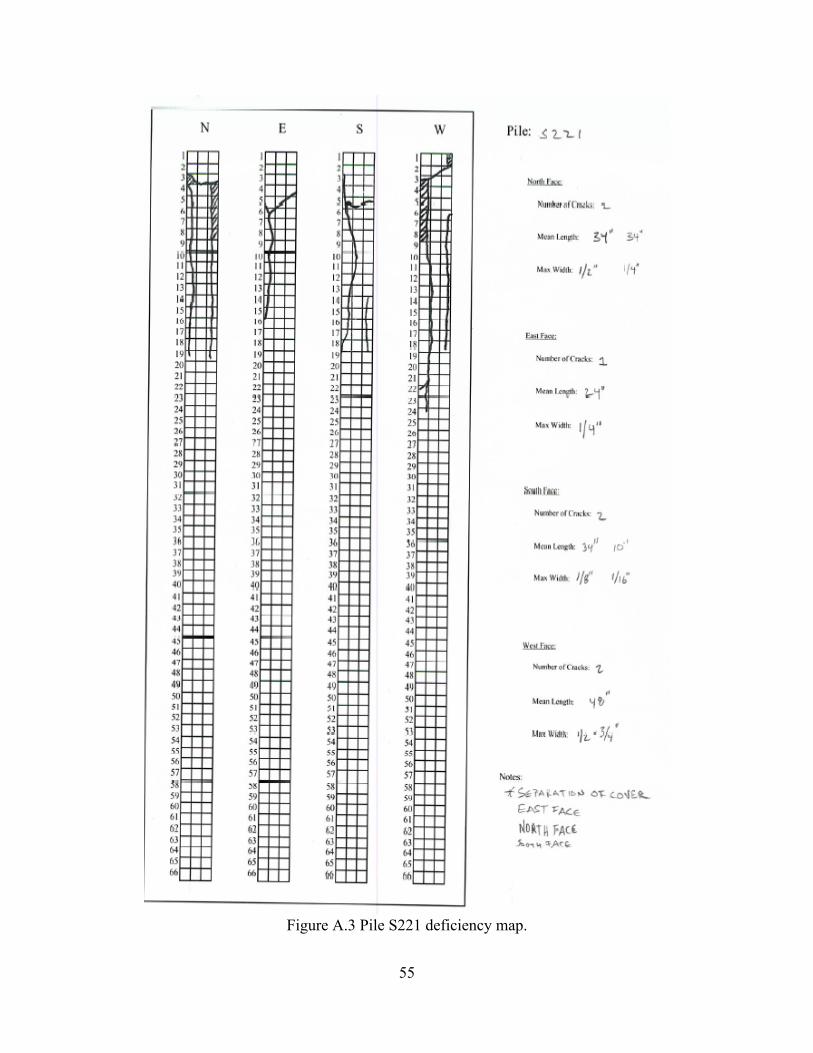
Figure A.3 Pile S221 deficiency map.
56
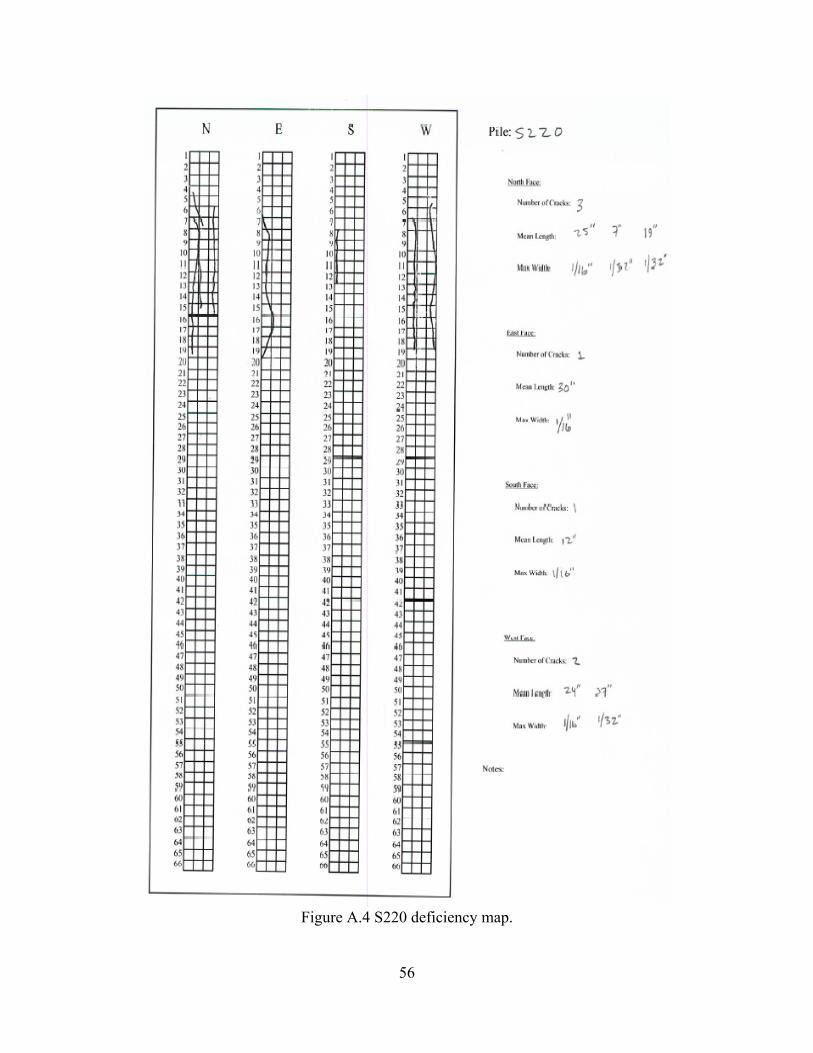
Figure A.4 S220 deficiency map.

57
Figure A.5 S218 deficiency map.

58
APPENDIX B: OUTPUT RESULTS GRAPHS
59
0 0.5 1 1.5 2 2.5 3 3.5
0
1
2
3
4
5
6
7
8
9
10
11
Measured Control
Measured 10% ALOS
Measured 30% ALOS
Measured 50% ALOS
Lateral Load vs Cap Displacement
Measured
Displacement (K-in)
Late
ral
Loa
d (
Kip
)
Figure B.1 Measured test data from undamaged pile bent.
0 0.5 1 1.5 2 2.5 3 3.5 4 4.5
0
2
4
6
8
10
12
14
Measured Control
Damage Model Control
Single Ply Repair Model Control
Lateral Load vs Cap Displacement
Control
Displacement (in)
Late
ral
Loa
d (
Kip
)
Figure B.2 Undamaged model, undamaged measured model, undamaged repaired model.

60
0 0.5 1 1.5 2 2.5 3 3.5 4 4.5
0
2
4
6
8
10
12
14
Measured 10% ALOS
Damage Model 10% ALOS
Single Ply Repair Model 10% ALOS
Lateral Load vs Cap Displacement
10% Area Loss of Steel
Displacement (in)
Late
ral
Loa
d (
Kip
)
Figure B.3 10% Damage model, 10% measured damage, 10% repaired damage.
0 0.5 1 1.5 2 2.5 3 3.5 4 4.5
0
2
4
6
8
10
12
Measured 30% ALOS
Damage Model 30% ALOS
Single Ply Repair Model 30% ALOS
Lateral Load vs Cap Displacement
30% Area Loss of Steel
Displacement (in)
Late
ral
Loa
d (
kip
)
Figure B.4 30% Damage model, 30% measured damage, 30% repaired damage.

61
0 0.5 1 1.5 2 2.5 3 3.5 4 4.5 5
0
2
4
6
8
10
12
Measured 50% ALOS
Damage Model 50% ALOS
Repair Model 50% ALOS
Lateral Load vs Cap Displacement
50% Area Loss of Steel
Displacement (in)
Late
ral
Loa
d (
Kip
)
Figure B.5 50% Damage model, 50% measured damage, 50% repaired damage.
0 0.5 1 1.5 2 2.5 3 3.5 4 4.5
0
2
4
6
8
10
12
Control Model
10% ALOS Model
30% ALOS Model
50% ALOS Model
90% ALOS Model
Lateral Load vs Cap Displacemenet
Damage Models
Displacement (in)
Late
ral
Loa
d (
kip
)
Figure B.6 All damaged models.
62
0 20 40 60 80 100 120
-60
-40
-20
0
20
40
60
80
100
Control Model
10% ALOS Model
30% ALOS Model
50% ALOS Model
90% ALOS Model
Pn vs Mn
Damage Models
Mn (kip-in)
Pn
(k
ip)
Figure B.7 Interaction diagram of all damaged models.
0 0.5 1 1.5 2 2.5 3 3.5 4 4.5 5
0
2
4
6
8
10
12
14
Repair Control
Repair 10% ALOS
Repair 30% ALOS
Repair 50% ALOS
Repair 90% ALOS
Damage Control Model
Lateral Load vs Cap Displacement
Single Ply Repair Models
Displacement (in)
Late
ral
Loa
d (
kip
)
Figure B.8 Lateral load response for all repaired damage models.

63
0 20 40 60 80 100 120 140
-100
-80
-60
-40
-20
0
20
40
60
80
100
120
Repair Control
Repair 10% ALOS
Repair 30% ALOS
Repair 50% ALOS
Repair 90% ALOS
Damage Control Model
Pn vs Mn
Single Ply Repair Models
Mn (kip-in)
Pn
(k
ip)
Figure B.9 Interaction diagram envelope for all repaired damage models.


![Other types of corrosion 1- Hydrogen damage · Third class - Corrosion of materials – Asst. Prof. Dr. Rana A. Majed [1] Other types of corrosion 1- Hydrogen damage Hydrogen damage](https://img.pdfslide.us/doc/110x75/5ebbc99da81273243929ec4b/other-types-of-corrosion-1-hydrogen-damage-third-class-corrosion-of-materials.jpg)