Embed Size (px)
DESCRIPTION
paper
Citation preview
Mr
YC
a
ARAA
KBTPHK
1
miolgotieitb
uit
0d
Journal of Analytical and Applied Pyrolysis 90 (2011) 140–154
Contents lists available at ScienceDirect
Journal of Analytical and Applied Pyrolysis
journa l homepage: www.e lsev ier .com/ locate / jaap
odeling biomass particle pyrolysis with temperature-dependent heat ofeactions
. Haseli ∗, J.A. van Oijen, L.P.H. de Goeyombustion Technology, Department of Mechanical Engineering, Eindhoven University of Technology, P.O. Box 513, 5600 MB Eindhoven, The Netherlands
r t i c l e i n f o
rticle history:eceived 14 August 2010ccepted 29 November 2010vailable online 10 December 2010
eywords:iomass particlehermal degradationyrolysis modeleat of reactioninetic constants
a b s t r a c t
An accurate formulation of energy conservation to model pyrolysis of a biomass particle needs to accountfor variations in the heat of reaction with temperature, usually neglected in most past studies. It is shownthat by including this effect in a pyrolysis model with three parallel reactions yielding char, gas and tar, awide range of experimental data can be accurately predicted. In particular, through comprehensive com-parisons of the simulation results with various measurements, a consistent and single value of 25 kJ/kgis obtained for enthalpy of pyrolysis, which represents a lumped heat of volatiles and char formation ata reference temperature. It is found that the kinetic parameters of Chan et al. [W.C. Chan, M. Kelbon, B.B.Krieger, Fuel 64 (1985) 1505–1513] and Thurner and Mann [F. Thurner, U. Mann, Ind. Eng. Chem. ProcessDes. Dev. 20 (1981) 482–488] provide reasonable agreement between the model predictions and experi-ments compared to other reported kinetic constants. These comparisons also indicate that inclusion of tar
cracking reactions to yield additional light gases does not give a better prediction of the process param-eters. The presented thermo-kinetic model is capable of successfully predicting various experimentalobservations such as the internal temperature peak reported in some past studies. It is shown that thesensible heat released due to the conversion of virgin biomass to the reaction products is responsiblefor this phenomenon. Simulation results reveal that a temperature peak at an internal location of theparticle may occur when the corresponding local temperature reaches the particle surface temperatureonve
while the local biomass c. Introduction
Increasing CO2 emissions and uncertainties related to the ulti-ate availability of fossil fuels are major concerns which push
ndustry and R&D sectors to seek solutions and new concepts tovercome these issues. Fossil fuel-based power plants, in particu-ar coal fired power plants, contribute significantly to greenhouseas emissions. A cost-effective CO2 reduction method is co-firingf a high fraction of biomass in coal fired power plants. Because ofhe existing infrastructure of coal fired power stations, the extranvestment costs for co-firing biomass takes advantage of the highfficiencies obtainable in large coal fired power plants. Therefore, its necessary to increase our understanding and predictive capabili-ies of biomass combustion with respect to emissions, fuel ignition,urnout and ash quality.
Combustion of a biomass particle is quite complex as itndergoes various physical and chemical successive processes
ncluding heating up, drying (in case of a wet particle), devolatiliza-ion/pyrolysis and char burnout. However, depending on the
∗ Corresponding author.E-mail address: [email protected] (Y. Haseli).
165-2370/$ – see front matter © 2010 Elsevier B.V. All rights reserved.oi:10.1016/j.jaap.2010.11.006
rsion is not finalized yet.© 2010 Elsevier B.V. All rights reserved.
heating conditions, particle size and composition, moisture con-tent, etc., some of the above mentioned processes may occursimultaneously. As concluded by Williams et al. [1], accuratemodeling of biomass combustion with quantitative reliability stillremains a challenge.
The thermal characteristics of the pyrolysis process as one ofthe unavoidable steps during thermal decomposition of a biomassparticle need to be carefully investigated at combustion conditions;even though this phenomenon has been previously studied theo-retically and experimentally by many researchers, e.g. Di Blasi [2,3],Gronli and Melaaen [4], Bharadwaj et al. [5] and Larfeldt et al. [6].During biomass pyrolysis, several physical and chemical processestake place including virgin biomass heating up, moisture evapo-ration and transportation, kinetics involving the decomposition ofbiomass to tar, char and light gases, heat and mass transfer, pres-sure build-up within the porous medium of the solid, convectiveand diffusive gas phase flow, variation of thermo-physical proper-ties with temperature and composition, and change in particle size,
i.e. shrinkage.The detailed models available in the literature for biomasspyrolysis are based on coupled time-dependent conservation equa-tions including kinetics of the biomass decomposition. In fact, thekinetic model directly influences the conservation equations. A lit-
Y. Haseli et al. / Journal of Analytical and A
Nomenclature
A pre-exponential or frequency factor, 1/scP specific heat, J/kg KE activation energy, kJ/mole surface emissivityh convective heat transfer coefficient, W/cm2 Khf enthalpy of formation, kJ/kg
h total enthalpy, kJ/kgK permeability, cm2
k reaction rate, 1/sk* effective thermal conductivity, W/cm KMW molecular weight, mol/gn Shape factorP pressure, PaQ source term in energy equation, J/cm3 sqx external heat flux, W/cm2
R particle radius, cmRg universal gas constant, kJ/mol Kr radial (sphere and cylinder), axial (slab) distance, cmT temperature, Kt time, su superficial gas velocity, cm/sYC fraction of char in the products
Greek lettersε porosity� density, g/cm3
�hB−g enthalpy of B → G and B → T reactions, kJ/kg�hB−C enthalpy of B → C reaction, kJ/kg�hT−g enthalpy of tar cracking reaction, kJ/kg� viscosity, kg/m s� Stephan–Boltzmann constant
Subscripts0 initial condition∞ surrounding conditionB biomassC charG light gasesg gas phase (tar + light gases)
epmoaiswdwwlwpscd3mf
the model of Shafizadeh and Chin [9]. Hence, the relevant kinetic
T tar
rature survey indicates that several kinetic schemes have beenroposed and applied by different authors. The one-step globalodel, as the simplest kinetic model, considers decomposition
f biomass into char and volatiles. This is the most frequentlypplied model, see for instance Galgano and Di Blasi [7]. Anmproved version of the one-step model with a single rate con-tant is a model according to which the main constituents ofood (cellulose, hemicelluloses and lignin) decompose indepen-ently into char and volatiles. Another decomposition scheme is theell-known Broido–Shafizadeh model for cellulose decomposition,hich assumes that the formation of an intermediate phase is fol-
owed by two competing reactions; in one reaction tar is produced,hile in the other one char and light gases are formed. The pro-osed mechanism of Koufopanos et al. [8] is similar to the kineticcheme of Broido–Shafizadeh, in which the virgin biomass is firstonverted into an intermediate material (reaction 1) which then
ecomposes to gases and volatiles (reaction 2), and char (reaction). Shafizadeh and Chin [9] proposed a primary wood degradationechanism which suggests three individual competitive reactionsorming light gases, tar and char.
pplied Pyrolysis 90 (2011) 140–154 141
Another kinetic model of biomass degradation assumes that inaddition to the primary reactions as suggested by Shafizadeh andChin [9], tar undergoes homogeneous degradation producing addi-tional light hydrocarbons and char. This is referred to as tar crackingor secondary reactions. This model was applied in detailed pyroly-sis simulations conducted by Gronli and Melaaen [4], Di Blasi [2,10],Hagge and Bryden [11], Bryden and Hagge [12], Bryden et al. [13],and Chan et al. [14]. Moreover, Koufopanos et al. [15] took intoaccount the nature of secondary reactions from a different view-point. In their model, virgin biomass undergoes primary reactionsto decompose into volatile and gases (reaction 1) and char (reac-tion 2). The primary pyrolysis products participate in secondaryreactions to produce also volatile, gases and char of different com-positions (reaction 3). The kinetic mechanism of Koufopanos et al.[15] has been applied, for instance, by Babu and Chaurasia [16] andSadhukhan [17,18] to model pyrolysis of biomass particles. In therecent comprehensive review studies by Di Blasi [19,20], the chem-ical kinetics of wood and biomass pyrolysis are critically discussed.The reader is also referred to the interesting paper by Di Blasi [21],in which the predictions of several kinetic mechanisms, which takeinto account the formation of char, tar and gas, are compared anddiscussed for the primary pyrolysis of cellulose and biomass.
Literature review indicates that there are also discrepancies inthe reported kinetics and thermo-physical data applied in differ-ent theoretical investigations for predicting thermal degradationof a biomass particle. We have found five different data sets foractivation energies and frequency factors of the primary reactionsof the Shafizadeh and Chin [9] kinetic scheme, which are usuallydescribed as first-order with an Arrhenius type of temperaturedependence. Moreover, the heat of these primary reactions is one ofthe most important parameters influencing the pyrolysis process,and it has been assigned various values. Hence, it remains a ques-tion for a pyrolysis modeler what set of kinetic constants and whichvalue for the heat of reactions must be utilized in the simulation.Our attempt is to find reasonable answers for these uncertaintiesin this paper.
On the other hand, discrepancies have also been found inmeasurements and experimental observations reported in varioussources. For instance, the particle inner temperature showed toexceed the surface temperature of the solid particle before reach-ing thermal equilibrium in the experimental studies of Koufopanoset al. [15], Park et al. [22] and Di Blasi et al. [23], whereas this phe-nomenon was not observed in measurements of other workers suchas Larfeldt et al. [6], Chan et al. [14], Tan and White [24], and Lu [25].
In the current paper, assuming that the biomass decompositiontakes place according to the Shafizadeh and Chin scheme, weinvestigate the accuracy of the pyrolysis models when using vari-ous kinetic parameters reported in the literature. The possibility ofa tar cracking reaction to produce lighter gases is also examined.Moreover, it is intended to highlight advantages of an accurateformulation of the conservation of energy that allows computingthe enthalpy of pyrolysis as a function of temperature. It will beshown that a pyrolysis model with the accurate energy equation iscapable of predicting a wide range of experimental data includingtemperature peaks at internal positions observed in some paststudies; e.g. [15].
2. Literature survey on kinetic parameters
The kinetic scheme utilized in our simulations assumes thatthe biomass particle decomposes to char, tar and gas according to
constants that have been obtained experimentally by various pastresearchers are summarized. The accuracy of the particle pyrolysismodel will be examined when using different sets of kinetic param-eters. Moreover, this section provides data of the kinetic parameters
142 Y. Haseli et al. / Journal of Analytical and Applied Pyrolysis 90 (2011) 140–154
Table 1Kinetic data of Chan et al. [14].
Reaction Frequency factor (1/s) Activation energy (kJ/mole)
Bio → Gas 1.30 × 10⁸ 140Bio → Tar 2.00 × 10⁸ 133Bio → Char 1.08 × 10⁷ 121
Table 2Kinetic data of Di Blasi and Branca [26].
Reaction Frequency factor (1/s) Activation energy (kJ/mol)
ooi
2
bddmtr
tofrw
aosH[iac
euts6FwFkdako
TK
Table 4Kinetic data of Font et al. [28].
Test Case Reaction Frequency factor(1/s)
Activation energy(kJ/mole)
Pyroprobe 100 Bio → Gas 1.52 × 10⁷ 139.3Bio → Tar 5.85 × 10⁶ 119Bio → Char 2.98 × 10³ 73.4
Bio → Gas 4.38 × 10⁹ 152.7Bio → Tar 1.08 × 10¹⁰ 148.0Bio → Char 3.27 × 10⁶ 111.7
f tar cracking into light gases, which were obtained by a numberf researchers. Also, a large scatter in the pyrolysis heat is reportedn the literature which will be discussed in Section 2.3.
.1. Primary reactions
Table 1 gives the kinetic data of primary reactions as reportedy Chan et al. [14] who compared their pyrolysis model pre-ictions with the experimental results from lodgepole pine woodevolatilization. These parameters were employed in the pyrolysisodel of Gronli and Melaaen [4]. The kinetic mechanism applied in
heir simulation of spruce wood pyrolysis was that of three primaryeactions with tar cracking producing merely additional gas.
Di Blasi and Branca [26] conducted experiments on beech woodo determine kinetic constants of wood pyrolysis. The weight lossf thin layers of beech wood powder (150 �m) were measuredor heating rates of 1000 K/min with reaction temperatures in theange of 587–720 K. Their findings are given in Table 2. These dataere used by Park et al. [22] for simulation of maple wood pyrolysis.
The third set of kinetic constants is of that reported by Thurnernd Mann [27] who studied the pyrolysis of oak sawdust in the rangef 573–673 K at atmospheric pressure. Table 3 lists kinetic con-tants of the primary reactions obtained from their experiments.agge and Bryden [11], Bryden and Hagge [12], and Bryden et al.
13] used these data to validate their pyrolysis model against exper-ments of Tran and White [24], who measured temperature historynd char yield of redwood, southern pine, red oak and basswood atonstant radiant heat flux.
The fourth and last set of kinetic constants is the data set of Fontt al. [28], obtained based on a comprehensive experimental studysing a fluidized bed reactor and a Pyroprobe 100 to investigatehe kinetics of the flash pyrolysis of almond shells and of almondhells impregnated with CoCl2. Experiments were conducted at73–733 K to study kinetics of the almond shells in a fluidized bed.or the kinetic study in the Pyroprobe 100 equipment, experimentsere carried out at 673–878 K. Table 4 summarizes the findings of
ont et al. [28]. Despite the apparent discrepancies in the reportedinetic parameters obtained from two test facilities, the predicted
ecomposition rate of biomass to individual products, i.e. gases, tarnd char, are approximately the same in both cases. The first set ofinetic constants was, for example, applied by Lu [25] for modelingf hardwood sawdust particles pyrolysis.able 3inetic data of Thurner and Mann [27].
Reaction Frequency factor (1/s) Activation energy (kJ/mol)
Bio → Gas 1.44 × 10⁴ 88.6Bio → Tar 4.13 × 10⁶ 112.7Bio → Char 7.38 × 10⁵ 106.5
Fluidized bed reactor Bio → Gas 6.80 × 10⁸ 155.6Bio → Tar 8.23 × 10⁸ 148.5Bio → Char 2.91 × 10² 61.4
Di Blasi [10] examined data of Chan et al. [14], Thurner and Mann[27], and (the first set of) Font et al. [28]. A good quantitative agree-ment was obtained between the experimental data of Lee et al.[29] and the predicted temperature profiles along the degradingbiomass particle using kinetic parameters of Thurner and Mann[27]. However, the author believed that such an agreement wasreached mainly due to the properties of char and biomass used inthe numerical simulation, which were those measured in experi-ments of Lee et al. Thus, no final conclusion was made in Di Blasi’sstudy concerning the importance of thermo-kinetic data for quan-titative predictions.
We compared the rates constants of three parallel reactionspredicted using the kinetic constants of Chan et al. [14], DiBlasi and Branca [26], Thurner and Mann [27], and Font et al.[28] as functions of temperature in the range of 400–900 K. Theresults of these observations can be classified in three tempera-ture ranges; 400 < T < 550 K, 550 < T < 700 K, and 700 < T < 900 K, asanalysed below.
400 < T < 550 K: The rate constant of light gases calculated byThurner and Mann’s data is higher than those obtained from otherthree sets. The biomass decomposition rate to produce tar is almostthe same in all cases. For the char yield, the data of Font et al. giveshigher rates compared to the other cases.
550 < T < 700 K: Di Blasi and Branca’s data overestimate the pro-duction rates of light gases compared to the other data, whereas theother three sets of kinetic constants give almost the same results.Again, the rate of tar production computed by Di Blasi and Branca’sdata are higher than those predicted by data of the other threegroups. All data sets are expected to give approximately the sameresults for rate constant of biomass decomposition to char.
700 < T < 900 K: Di Blasi and Branca’s data predicts faster forma-tion of light gases compared to other three data sets. The predictionusing the Chan et al. and Font et al. data are almost in the samerange. Again, rate constants for tar production computed by Di Blasiand Branca’s data are higher than those predicted by data of otherthree groups. Computed reaction rate constants of char formationusing Chan et al. and Di Blasi and Branca’s data are in the samerange and higher than those computed by other two groups whichproduce compatible results.
Given that several factors such as experimental set up,experiment conditions (high heat flux, low heat flux), biomasscomposition may contribute to the reasons of these discrepanciesbetween various kinetic data, the decision on which set of kineticconstants must be used in a pyrolysis model, depends largelyupon how well the thermo-kinetic model will predict experimentalobservations. The accuracy of the pyrolysis model using the kineticparameters suggested by Chan et al., Di Blasi and Branca, Thurnerand Mann, and Font et al. will be examined in Section 4.
2.2. Tar cracking reactions
Vapor phase tar decomposition known as secondary reactions,was investigated by a number of researchers; Liden et al. [30],Boroson et al. [31], Kosstrin [32] and Diebold [33]. Tar crackingwas modeled as a homogenous process to give mainly light gases,
Y. Haseli et al. / Journal of Analytical and A
Table 5Kinetic parameters of tar cracking reported in the literature.
Frequency factor(1/s)
Activation energy(kJ/mol)
Temperature range(C)
Reference
Tar → light gas4.28 × 106 107.5 460–600 [30]
aTc
2
piwpii
f[GrrserfwtHs2tBab−
s8oh
TV
1.00 × 10⁵ 93.3 500–800 [31]3.26 × 10⁴ 72.8 430–900 [32]1.00 × 10⁵ 87.5 >600 [33]
n assumption which is supported by experimental results [30].able 5 summarizes the findings of these researchers on the kineticonstants of tar cracking reaction.
.3. Heat of pyrolysis
In nearly all past modeling studies of single particle biomassyrolysis, decomposition of the virgin biomass to gas, tar and char
s assumed to take place through a series of endothermic reactions,hereas tar cracking through secondary reactions for additionalroduction of gas and char is considered exothermic. Furthermore, it
s commonly assumed that the heat of all three primary reactions isdentical, and so is the one for the secondary tar cracking reactions.
Literature review indicates a large scatter in the reported valuesor the heat of pyrolysis. A survey performed by Milosavljevic et al.34] revealed that it may be in the range of −2100 to 2500 kJ/kg.iven the difficulty of measuring the pyrolysis heat, most of past
esearchers treated it as an adjustable parameter which would giveeasonable agreement between the results of simulation and mea-urements (e.g. a pyrolysis heat of 418 kJ/kg was suggested by Chant al. [14]; Gronli [35] assumed a heat of 150 kJ/kg for primaryeactions; Park [36] estimated an endothermic heat of 64 kJ/kgor three parallel reactions). In contrast, there are limited studieshich have intended to experimentally (with no aid of parame-
er fitting in the simulating model) determine the pyrolysis heat.avens et al. [37] showed that, based on experiments of differential
canning calorimery (DSC), the heat of pyrolysis for pine and oak is00 kJ/kg and 110 kJ/kg, respectively. In another effort to measurehe pyrolysis heat of Pinus Pinaster thermal degradation using DSC,ilbao et al. [38] reported an endothermic heat of 274 kJ/kg up toconversion of 60%, whereas for the remaining conversion of theiomass, the process was observed to be exothermic with a heat of353 kJ/kg.
An extensive investigation to determine the heat of pyroly-is of dried cylindrical maple particles with 2 cm diameter andcm length was conducted by Lee et al. [29] at two heat fluxesf 30 kW/m2 and 84 kW/m2. Their results showed that at a loweat flux the pyrolysis layer could be divided into three zones: an
able 6alues of heat of pyrolysis reported in various studies.
Enthalpy of pyrolysis (kJ/kg) Method
418 Fitting with experiments150 Fitting with experiments64 Fitting with experiments255 Fitting with experiments−20 Fitting with experiments200 Measured110 Measured274 Measured−353 Measured610 Measured−1090 to −1720 (prependicular heating) Measured−105 to −395 (parallel heating) Measured538–2000YC
** Measured
* Converion value** Final char yeild
pplied Pyrolysis 90 (2011) 140–154 143
endothermic primary decomposition zone at temperatures up to250 ◦C, an exothermic partial char zone between 250 ◦C and 340 ◦C,and an endothermic surface char zone at 340 ◦C < T < 520 ◦C. Theoverall mass weighted heat of reaction was endothermic to theextent of 610 kJ/kg. In contrast, the overall heat of reaction at thehigher heat flux was exothermic, being greater for perpendicularheating (in the range of −1090 to −1720 kJ/kg) than for parallelheating (in the range of −105 to −395 kJ/kg). The authors arrived atthe conclusion that the heat of pyrolysis depends upon the exter-nal heating rate, total heating time and anisotropic properties ofbiomass and char relative to the internal flow of heat and gas.
Milosavljevic et al. [34] studied the thermo-chemistry of cel-lulose pyrolysis by a combination of DSC and thermogravimetricanalysis. They found that the main thermal degradation pathwaywas endothermic in the absence of mass transfer limitations thatpromoted char formation. They concluded that the endothermic-ity, which was estimated to be about 538 kJ/kg of volatiles evolved,was mainly due to latent heat requirement for vaporizing the pri-mary tar decomposition products. It was also reported that thepyrolysis could be driven in the exothermic direction by char form-ing processes that would compete with tar forming processes. Theformation of char, which was favored at low heating rates, was esti-mated to be exothermic to the extent of 2000 kJ/kg of char formed.The authors arrived at an interesting conclusion that the heat ofpyrolysis could be correlated with the char yield at the end ofpyrolysis, a result which was somewhat consistent with findingsof Mok and Antal [39], who also observed a linear decrease in theendothermic heat of pyrolysis as the char yield increased. Hence, itwas concluded that the char yield was the main factor determin-ing whether the overall pyroysis process is endo- or exothermic.Table 6 summaries the above discussed values of the pyrolysis heatwhich have been obtained by different researchers either througha fitting procedure or based on measurements.
From these works, it can be now understood why a wide rangeof pyrolysis heat has been reported in the literature. For the pur-pose of simulating thermal degradation of a biomass particle, it isof importance that the pyrolysis heat must be chosen from similarheating and comparable measurement conditions (such as simi-lar char yield) if it is taken from a referred source. Alternatively, itshould be carefully correlated by comparing the simulation resultswith measurements, otherwise the predicted parameters of thepyrolysis model may not be reliable.
3. Pyrolysis model
The pyrolysis of biomass is a complex phenomenon. In orderto accurately describe particle conversion, a deeper understand-ing of the chemistry and physics of the process is necessary.
Remarks Source
Chan et al. [14]Gronli [35]Park [36]
X* < 0.95 Koufopanos et al. [15]X > 0.95Pine wood Havens et al. [37]Oak woodX < 0.60 Bilbao et al. [38]X > 0.60Low heat flux Lee et al. [29]High heat fluxHigh heat fluxCellulose Milosavljevic et al. [34]
1 and A
Tapvp[pbt
ptbt[g
tnpsfafhwtirfooti
e
k
wu
3
c
(
44 Y. Haseli et al. / Journal of Analytical
he one-dimensional (1D) thermo-kinetic biomass particle modelccounting for primary and secondary reactions to describe theyrolysis process that we employed (assuming a constant particleolume throughout the conversion process), has previously beenresented in several past works; e.g. Di Blasi [2], Gronli and Melaaen4], Park et al. [22], and Lu et al. [40]. However, for the sake of com-leteness of our article, the basic equations of the model will beriefly described with a particular focus on accurate formulation ofhe conservation of energy.
The kinetic mechanism employed in our simulation of singlearticle biomass pyrolysis accounts for three parallel primary reac-ions with the possibility of a tar cracking reaction; that is, the virginiomass decomposes to gas, tar and char, and vapor tar decomposeso yield further gas. As concluded in past experimental studies30,31,33], the main product of the tar cracking reaction is lightases, and the amount of char yield is negligible.
Despite these later studies that report possibility of crackingar into lighter gases at elevated temperatures, however, there iso experimental evidence supporting that this reaction also takeslace during thermal conversion of a biomass particle through aeparate path. To our best knowledge, tar cracking reactions in theorm of secondary reactions were first adapted by Di Blasi [2] inbiomass pyrolysis model, who also assumed that char could be
ormed as a consequence of tar cracking. Since then, some authorsave assumed the secondary reactions in their pyrolysis models,hereas some others have argued that the possibility of this reac-
ion directly depends on the residence time of the volatiles, so thatt does not necessarily take place as in the pyrolysis process. In aecent study by Park et al. [22], it has been reported that accountingor the secondary reactions is of minor importance. As a further taskf the present article, it is intended to find out whether predictionsf the pyrolysis model with three parallel reactions are sufficiento observe the experiments, or inclusion of a tar cracking reactionn the model may provide better predictions.
The reaction rates are determined through an Arrhenius typequation.
i = Ai exp
(−Ei
RgT
)i = 1, 2, 3, 4 (1)
here A is the frequency factor, E the activation energy, Rg theniversal gas constant, and T the temperature.
.1. Conservation of species mass
The consumption of biomass (B) and the formation of char (C)an be described by the following equations:
∂�B
∂t= −(k1 + k2 + k3)�B (2)
∂�C
∂t= k3�B (3)
Mass conservation equations of the tar (T) and total gas phaseg) obey
∂ε�T
∂t+ 1
rn
∂
∂r(rn�T u) = k2�B − k4ε�T (4)
∂ε�g
∂t+ 1
rn
∂
∂r(rn�gu) = (k1 + k2)�B (5)
pplied Pyrolysis 90 (2011) 140–154
where n denotes a shape factor (n = 0 for flat, n = 1 for a cylinder,and n = 2 for a sphere) and ε represents the particle porosity. Duringthermal decomposition of biomass, particle porosity increases withtime and it may have different values along the spatial coordinate r.
3.2. Conservation of energy
The main assumptions for the formulation of energy conser-vation related to a solid biomass particle undergoing thermaldegradation are that the volume of the particle remains constantduring the process, and the solid and the gas phase are in ther-mal equilibrium. A proper description of the energy equation isthat it must account for (1) accumulation of energy, (2) conduc-tive heat transfer through the particle, (3) convective heat transferdue to flow of volatiles through pores. As the problem of studyincludes the chemical structural changes through various reactions,the enthalpy of each species must be represented as the summationof sensible and formation enthalpies:
∂
∂t
[∑i
�hi
]+ 1
rn
∂
∂r(rnu�ghg) = 1
rn
∂
∂r
(rnk∗ ∂T
∂r
)i = B, C, g (6)
where h is the total enthalpy, and k* is the effective thermal con-ductivity which accounts for thermal conductivity of the biomass,char, gaseous byproducts as well as radiation heat transfer insidethe pores (using the Rossland diffusion approximation for a thickmedium). Some mathematical manipulations are required in orderto represent the energy equation in terms of temperature asdescribed in Appendix A, so the final form of Eq. (6) reads
(�BcPB + �C cPC + ε�gcPg )∂T
∂t+ u�gcPg
∂T
∂r= 1
rn
∂
∂r
(rnk∗ ∂T
∂r
)+ Q (7)
where
Q = �B(k1 + k2)[�hB−g +∫
(cB − cg )dT] + �Bk3[�hB−C +∫
(cB − cC )dT]+
ε�T k4[�hT−G +∫
(cT − cG)dT]
(8)
where �hB−g, �hB−C, �hT−G are, respectively, enthalpies of B → g,B → C and T → G reactions at a reference temperature. Notice that�hB−g accounts for the enthalpies of both B → G and B → T reactionsaccording to the assumed kinetic scheme. The above formulationsuggests that the heat of reactions involved in the pyrolysis processneed to be calculated as a function of temperature. However, inmany past studies, Q is defined as
Q = �B(k1 + k2 + k3)�hP + ε�T k4�hS (9)
where it is assumed that the heat of all three primary reactions areidentical and constant (�hP), and the heat of secondary reaction isrepresented by �hS.
By comparing Eq. (8) with Eq. (9), we find
�hP = (1 − YC )[�hB−g +∫
(cB − cg )dT] + YC [�hB−C +∫
(cB − cC )dT] (10)
�hS = �hT−G +∫
(cT − cG)dT (11)
In Eq. (10), YC denotes the fraction of char in the pyrolysis prod-ucts. Hence, in these studies the possibility of evaluating the heatof pyrolysis at different temperatures and as a function of productsyields is taken away. The main issue with the inaccurate formula-tion of the source term, Eq. (9), in the energy equation is that an
endothermic heat is usually assumed for all three primary reac-tions as in many past studies, e.g. 150 kJ/kg [4], 418 kJ/kg [14],and 64 kJ/kg [15]. These values have been obtained by fitting thepredictions (usually mass loss or temperature histories) with theexperiments in each individual study through employing Eq. (9)
Y. Haseli et al. / Journal of Analytical and A
Table 7Thermo-physical properties used in biomass pyrolysis simulation.
Property Value/correlation
Specific heat (J/g K) cpB = 1.5 + 1.0 × 10⁻³TcpC = 0.44 + (2 × 10⁻³)T − 6.7 × 10⁻⁷T2
cpT = −0.162 + (4.6 × 10⁻³)T − 2 × 10⁻⁶T2
cpG = 0.761 + (7 × 10⁻⁴)T − (2 × 10⁻⁷)T2
cpg = (�T/�g)cpT + (1 − �T/�g)cpG
Thermalconductivity(W/cm K)
k* = (�B/�B0)kB + (1 − �B/�B0)kC + εkg + 13.5�T3d/ω
kg = 0.00026kc = 0.001 (grain)kc = 0.007 (radial)
Porosity ε = 1 − (1 − ε0)(�B + �C)/�B0
ε0: biomass dependentPore diameter (cm) d = (�B
/�B0)dB + (1 − �B/�B0)dC
dB = 5 × 10⁻³
dC = 10−2
Permeability(cm−2)
K = (�B/�B0)KB + (1 − �B/�B0)KC
−12
aspeMtasteiovv
agictiittahaig(sts
etfi(ftmia
time stepping techniques.
KB = 5 × 10KC = 10−9
Gas phase viscosity(kg/m s)
�g = 3 × 10⁻⁵
nd without accounting for any secondary reactions. In fact, thesetudies suggest that heat input is a requirement for the entirerocess of biomass decomposition, which is not consistent withxperimental observations of Lee et al. [29], Bilbao et al. [37] andilosavljevic et al. [34] as discussed in Section 2.3. The question
hat may be raised is that, would not it be better to employ theccurate version of the source term in the energy equation as repre-ented in Eq. (8), and try to find enthalpy of reactions at a referenceemperature through the same method of fitting of predictions withxperiments? We will further follow this idea in Section 4 to exam-ne whether with this proposed method we may still get a varietyf reactions heats, or it may be possible to end up with a singlealue that can be used in the pyrolysis model to reasonably capturearious experimental observations.
It can be inferred from Eq. (8) that the reaction heats associ-ted with the formation of volatiles, char and possibly secondaryases become more exothermic as the temperature increases. Thiss because the specific heat of biomass is usually greater than that ofhar and that of volatiles, as well as the specific heat of tar is greaterhan that of light gases (see the related correlations that are givenn Table 7). Moreover, Eq. (8) shows that the heat of volatiles releases not necessarily the same as the heat of char formation. The ques-ion that may arise is what would be the physical explanation ofhe terms associated with various specific heats, i.e.
∫(ci − cj)dT, as
ppeared in Eq. (8)? This term represents the amount of sensibleeat released when species i decomposes to species j at a temper-ture different from the reference one. Alike any chemical reactionn which a certain amount of energy is released/consumed at aiven temperature, it is possible to estimate the amount of energyenthalpy of reaction) at another temperature by simply algebraicummation of the enthalpy of reaction at the reference tempera-ure, and the enthalpy that is equivalent to the difference in theensible heats of the products and the reactants.
As a conclusion from this discussion, it is possible that thenthalpy of pyrolysis may become exothermic at some stages ofhe pyrolysis depending on the process conditions, as also con-rmed in some studies. In such cases, a pyrolysis model that uses Eq.9) with constant endothermic heat for the primary reactions willail to accurately predict the temperature; and as a consequence
he chemistry of the process will be influenced. On the contrary, aodel which employs Eq. (8) does not suffer from this issue, sincet has a potential to capture exothermicity of the pyrolysis heat byccounting for the sensible heat released due to the conversion of
pplied Pyrolysis 90 (2011) 140–154 145
the biomass to the volatiles and char. Further demonstration of thisidea will be presented in Section 4.2.
3.3. Conservation of momentum
Darcy law is applied to describe gas phase momentum trans-fer within the porous media. Hence, the superficial gas velocity isobtained from
u = − K
�
∂p
∂r(12)
Furthermore, it is assumed that volatiles behave like a perfectgas, so that internal pressure is determined from
p = �gRgT
MWg(13)
3.4. Initial and boundary conditions
The numerical solution of the transport equations describedabove needs to define five initial and four boundary conditions.
Initial conditions (t = 0)⎧⎪⎪⎨⎪⎪⎩
�B = �B0�C = 0�T = 0�g = �inert
T = T0
(14)
Boundary conditions (t > 0)⎧⎪⎪⎪⎪⎪⎪⎪⎪⎨⎪⎪⎪⎪⎪⎪⎪⎪⎩
r = 0
⎧⎪⎪⎪⎨⎪⎪⎪⎩
∂�T
∂r= 0
∂�g
∂r= 0
∂T
∂r= 0
r = R k∗ ∂T
∂r=
{h(T∞ − T) + �e(T4∞ − T4)orqx − h(T − T∞) − �e(T4 − T4∞)
(15)
Two different types of boundary conditions may be applied todefine the surface temperature. The first one is used for a knownreactor temperature so that heat is transferred to the surface of theparticle through radiation and convection. The second boundarycondition is suitable when the particle is exposed to a known heat-ing flux qx so that some heat is dissipated from the surface to theenvironment via radiation and convection. Moreover, in the simu-lation code the velocity is initially set to zero as well as the initialpressure and pressure at the surface are equal to the surroundingpressure (usually atmospheric).
3.5. Simulation code
The pyrolysis model described above is implemented inCHEM1D to study thermal conversion of a dry biomass particle.CHEM1D [41] is a computer code developed at the CombustionTechnology Group of the Department of Mechanical Engineeringat Eindhoven University of Technology to calculate various flametypes. It is capable of solving a set of general time-dependent 1Ddifferential equations which includes accumulation, convection,diffusion and source terms, on the basis of the control volume dis-cretisation method for specified initial and boundary conditionsand known time and space domains. It uses adaptive gridding and
Simultaneous solution of the transport and kinetic equationsrequires defining the thermo-physical properties and kinetic con-stants discussed previously. Composition-dependence of thermalconductivity, specific heat and solid phase permeability is taken
146 Y. Haseli et al. / Journal of Analytical and Applied Pyrolysis 90 (2011) 140–154
Table 8Comparison of the predicted and measured biomass conversion and char yield, with experimental data taken from Gronli and Melaaen [4] (T&M: Thurnner and Mann; C:Chan et al.; D&B: Di Blasi and Branca; F: Font et al.).
Duration Kinetic data Converted biomass (%wt) Char yield (kg/m3)
Measured Predicted �% Measured Predicted �%
5 min T&M 25.7 ± 1.63 25.1 −2.3 30.4 33.4 9.910 min 45.5 ± 3.61 41.7 −8.4 58.8 56 −4.85 min C 25.7 ± 1.63 24.3 −5.4 30.4 29.5 −3.010 min 45.5 ± 3.61 39.9 −12.3 58.8 50.4 −14.3
iuebvTafd
4
ip[ombrinsooikcib
4
psTvttap
oa8sTiirt
5 min D&B 25.7 ± 1.63 25.610 min 45.5 ± 3.61 41.85 min F 25.7 ± 1.63 2610 min 45.5 ± 3.61 44.7
nto consideration. A survey on thermo-physical properties alloweds to take a fixed value/correlation for most of the parameters,xcept the thermal conductivity, density and initial porosity ofiomass, and the convective heat transfer coefficient h, which mayary depending upon the type of biomass and process conditions.able 7 lists the required data and some auxiliary equations whichre included in the simulation code. The presented relationshipsor the specific heats of char, tar and gas are based on correlatedata of Raznjevic [42].
. Results and discussion
The accuracy of the developed pyrolysis model and the reliabil-ty of the four different kinetic data are examined by comparing theredictions with experimental data taken from Gronli and Melaaen4], Koufopanos et al. [15] and Rath et al. [43]. The idea is to findut which set of kinetic parameters given in Table 1 through Table 4ay provide a better insight into the thermal degradation of a single
iomass particle. Notice that an efficient model must be capable ofeasonably predicting both heat transfer and kinetics of the process;.e. mere validation of heat transfer or mass transport parameters isot sufficient. This has been taken into consideration in only a fewtudies [4,13,15,18,44]. The second idea is to find what value can bebtained for �hB−g and �hB−C (assuming �hB−g = �hB−C) at vari-us experimental conditions when Eq. (8) is used as the source termn the energy equation. Also, we intend to examine whether theinetic scheme with three parallel reactions is sufficient enough toapture the experimental observations, or inclusion of a tar crack-ng reaction to yield further light gases in the model could provideetter predictions of the thermo-kinetics of the pyrolysis process.
.1. Comparison with data of Gronli and Melaaen
In the experimental work of Gronli and Melaaen [4], birch,ine, and spruce particles were one-dimensionally heated in a bell-haped glass reactor using a xenon arc lamp as a radiant heat source.he total times of exposure (heating times) were 5 and 10 min. Foralidation of their pyrolysis model, which did not account for par-icle shrinkage, experimental results of spruce heated parallel withhe grain were chosen which had shown the lowest axial shrink-ge at both low and high heat fluxes compared to pine and bircharticles.
Fig. 1 shows a comparison between the predicted (obtained fromur simulation code) and measured temperature profiles at fivexial positions 0.6, 1.8, 2.2, 2.6 and 3 cm for an external heat flux of0 kW/m2. A good agreement between the predicted and the mea-ured temperatures can be seen using all sets of kinetic parameters.
his agreement was obtained by fitting the predictions with exper-mental data for a weighted endothermic reaction heat of 25 kJ/kg;.e. �hB−g = �hB−C = 25 kJ/kg, without accounting for tar crackingeaction; i.e. k4 = 0. When a possibility of secondary reaction ofar was taken into consideration, no reasonable match between−0.4 30.4 19 −37.5−8.1 58.8 35.3 −40.0
1.2 30.4 62.7 106.3−1.8 58.8 120.5 104.9
the measured and the predicted profiles was observed, given thatvariety of heat of primary reactions was tested.
As mentioned previously, mere validation against heat transferparameters is not sufficient since the process also involves kineticsand mass transport of various species. The biomass conversion frac-tion and char yield were also calculated using different kinetic data.In Table 8, the predicted and measured values of these parametersare compared for 5 min and 10 min as the duration of pyroly-sis. The conversion of biomass is well-predicted using all kineticdata sets at 5 min heating duration. The converted biomass is stillreasonably predicted for the 10 min heating condition with mostunder-prediction attributed to the data of Chan et al. Nevertheless,looking at the predicted char yields, it is seen that the predictionsusing the data of Thurner and Mann and the data of Chan et al. aremuch better than those obtained using the data of Font et al. andthe data of Di Blasi and Branca. Kinetic constants of Font et al. give asignificant over-prediction of the char yields to the extent of 106%.On the other hand, data of Di Blasi and Branca leads to a notableunder-prediction of char yields to the extent of 40%.
Figs. 2 and 3 depict typical simulated time and space evolu-tion of various parameters related to the experimental conditionof Gronli and Melaaen [4]. As the particle with initial temperatureof 300 K is exposed to a high heating flux, the surface tempera-ture begins to rise while some heat is dissipated from the surfaceto the surrounding due to radiation and convection heat transfermechanisms. The heat received by the surface is transfered intothe particle through conduction heat transfer. As the temperatureof the particle increases, the primary reactions are activated so thatthe virgin biomass begins to slightly decompose into three maingroups of byproducts at low temperatures according to the kineticmodel employed. The rates of conversion become higher as thetemperature increases. As the gaseous byproducts are generated bycontinuous decomposition of biomass, internal non-uniform pres-sure slightly greater than atmospheric pressure is built up. Thiscauses a flow of volatiles through the pores of the particle mainlytowards the surface of the particle where they escape; but therealso exists a flow of gaseous species in the opposite direction whichincreases the pressure at the center of the particle. During the ini-tial stages of the process, the pressure peak takes place near thesurface; however, as the process continues the location of the maxi-mum pressure is shifted to the internal positions. This is attributedto the higher rate of volatiles generated compared to their localvelocity. The flux of gaseous flow is dependent on the local perme-ability so that the volatiles mass flux is higher in the charred partof the particle than in the virgin part since the permeability of charis higher than that of biomass.
As long as decomposition of the particle surface has not been
finalized, the particle can be divided into two regions: a partial charregion where still there is some biomass to decompose, and a virginbiomass region. In this stage of the process, maximum formationof volatiles (including tar) and char takes place at the surface. Soonafter all virgin material at the surface has converted to byproducts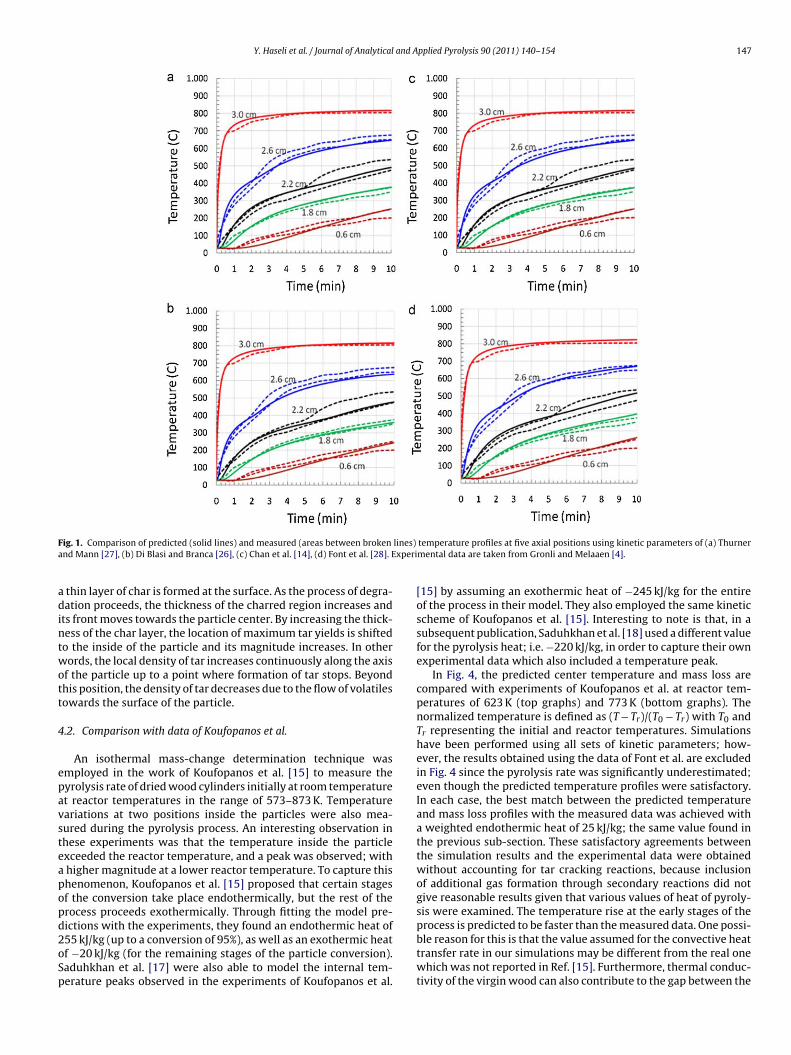
Y. Haseli et al. / Journal of Analytical and Applied Pyrolysis 90 (2011) 140–154 147
F lines)a xperi
adintwott
4
epavsteapopd2oSp
ig. 1. Comparison of predicted (solid lines) and measured (areas between brokennd Mann [27], (b) Di Blasi and Branca [26], (c) Chan et al. [14], (d) Font et al. [28]. E
thin layer of char is formed at the surface. As the process of degra-ation proceeds, the thickness of the charred region increases and
ts front moves towards the particle center. By increasing the thick-ess of the char layer, the location of maximum tar yields is shiftedo the inside of the particle and its magnitude increases. In otherords, the local density of tar increases continuously along the axis
f the particle up to a point where formation of tar stops. Beyondhis position, the density of tar decreases due to the flow of volatilesowards the surface of the particle.
.2. Comparison with data of Koufopanos et al.
An isothermal mass-change determination technique wasmployed in the work of Koufopanos et al. [15] to measure theyrolysis rate of dried wood cylinders initially at room temperaturet reactor temperatures in the range of 573–873 K. Temperatureariations at two positions inside the particles were also mea-ured during the pyrolysis process. An interesting observation inhese experiments was that the temperature inside the particlexceeded the reactor temperature, and a peak was observed; withhigher magnitude at a lower reactor temperature. To capture thishenomenon, Koufopanos et al. [15] proposed that certain stagesf the conversion take place endothermically, but the rest of therocess proceeds exothermically. Through fitting the model pre-
ictions with the experiments, they found an endothermic heat of55 kJ/kg (up to a conversion of 95%), as well as an exothermic heatf −20 kJ/kg (for the remaining stages of the particle conversion).aduhkhan et al. [17] were also able to model the internal tem-erature peaks observed in the experiments of Koufopanos et al.temperature profiles at five axial positions using kinetic parameters of (a) Thurnermental data are taken from Gronli and Melaaen [4].
[15] by assuming an exothermic heat of −245 kJ/kg for the entireof the process in their model. They also employed the same kineticscheme of Koufopanos et al. [15]. Interesting to note is that, in asubsequent publication, Saduhkhan et al. [18] used a different valuefor the pyrolysis heat; i.e. −220 kJ/kg, in order to capture their ownexperimental data which also included a temperature peak.
In Fig. 4, the predicted center temperature and mass loss arecompared with experiments of Koufopanos et al. at reactor tem-peratures of 623 K (top graphs) and 773 K (bottom graphs). Thenormalized temperature is defined as (T − Tr)/(T0 − Tr) with T0 andTr representing the initial and reactor temperatures. Simulationshave been performed using all sets of kinetic parameters; how-ever, the results obtained using the data of Font et al. are excludedin Fig. 4 since the pyrolysis rate was significantly underestimated;even though the predicted temperature profiles were satisfactory.In each case, the best match between the predicted temperatureand mass loss profiles with the measured data was achieved witha weighted endothermic heat of 25 kJ/kg; the same value found inthe previous sub-section. These satisfactory agreements betweenthe simulation results and the experimental data were obtainedwithout accounting for tar cracking reactions, because inclusionof additional gas formation through secondary reactions did notgive reasonable results given that various values of heat of pyroly-sis were examined. The temperature rise at the early stages of the
process is predicted to be faster than the measured data. One possi-ble reason for this is that the value assumed for the convective heattransfer rate in our simulations may be different from the real onewhich was not reported in Ref. [15]. Furthermore, thermal conduc-tivity of the virgin wood can also contribute to the gap between the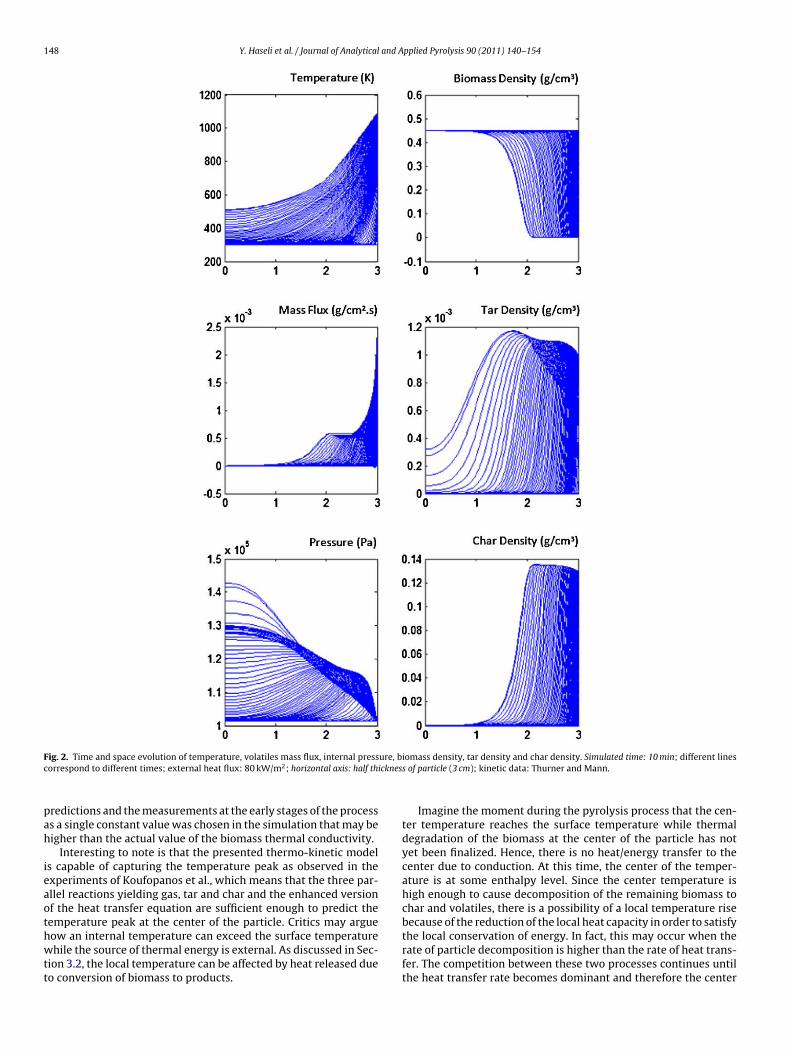
148 Y. Haseli et al. / Journal of Analytical and Applied Pyrolysis 90 (2011) 140–154
F ure, bc icknes
pah
ieaothwtt
ig. 2. Time and space evolution of temperature, volatiles mass flux, internal pressorrespond to different times; external heat flux: 80 kW/m2; horizontal axis: half th
redictions and the measurements at the early stages of the processs a single constant value was chosen in the simulation that may beigher than the actual value of the biomass thermal conductivity.
Interesting to note is that the presented thermo-kinetic models capable of capturing the temperature peak as observed in thexperiments of Koufopanos et al., which means that the three par-llel reactions yielding gas, tar and char and the enhanced versionf the heat transfer equation are sufficient enough to predict the
emperature peak at the center of the particle. Critics may argueow an internal temperature can exceed the surface temperaturehile the source of thermal energy is external. As discussed in Sec-ion 3.2, the local temperature can be affected by heat released dueo conversion of biomass to products.
iomass density, tar density and char density. Simulated time: 10 min; different liness of particle (3 cm); kinetic data: Thurner and Mann.
Imagine the moment during the pyrolysis process that the cen-ter temperature reaches the surface temperature while thermaldegradation of the biomass at the center of the particle has notyet been finalized. Hence, there is no heat/energy transfer to thecenter due to conduction. At this time, the center of the temper-ature is at some enthalpy level. Since the center temperature ishigh enough to cause decomposition of the remaining biomass tochar and volatiles, there is a possibility of a local temperature rise
because of the reduction of the local heat capacity in order to satisfythe local conservation of energy. In fact, this may occur when therate of particle decomposition is higher than the rate of heat trans-fer. The competition between these two processes continues untilthe heat transfer rate becomes dominant and therefore the center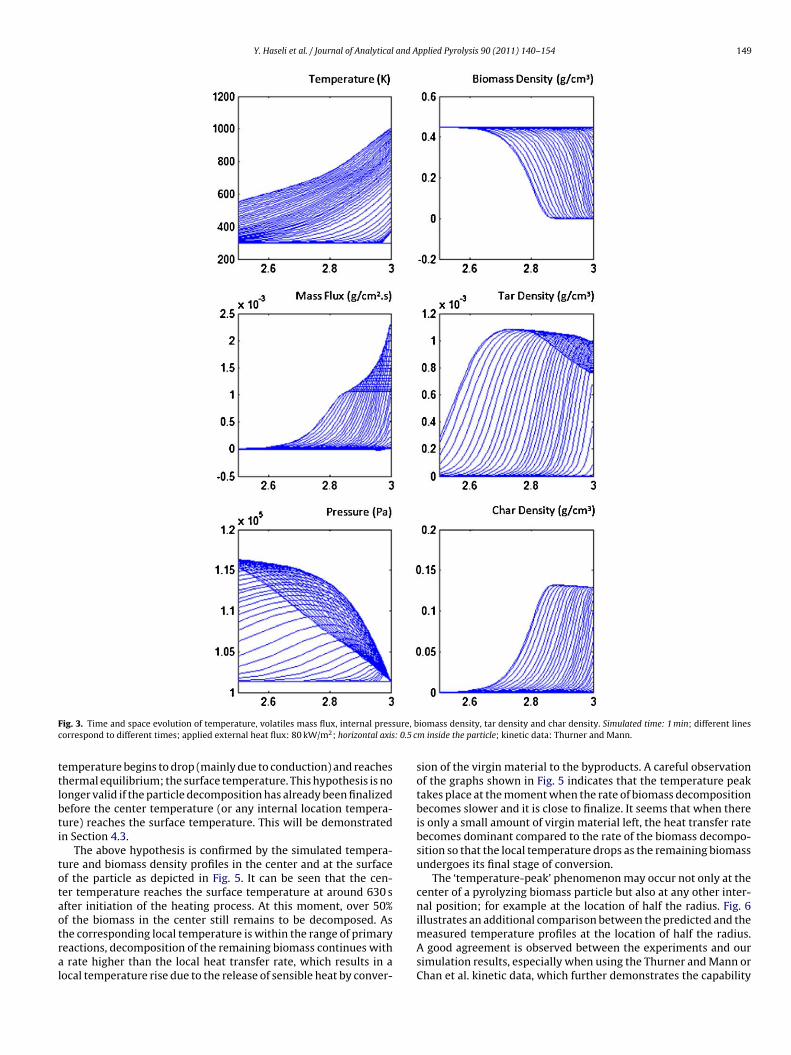
Y. Haseli et al. / Journal of Analytical and Applied Pyrolysis 90 (2011) 140–154 149
F ure, bc : 0.5 c
ttlbti
totaotral
ig. 3. Time and space evolution of temperature, volatiles mass flux, internal pressorrespond to different times; applied external heat flux: 80 kW/m2; horizontal axis
emperature begins to drop (mainly due to conduction) and reacheshermal equilibrium; the surface temperature. This hypothesis is noonger valid if the particle decomposition has already been finalizedefore the center temperature (or any internal location tempera-ure) reaches the surface temperature. This will be demonstratedn Section 4.3.
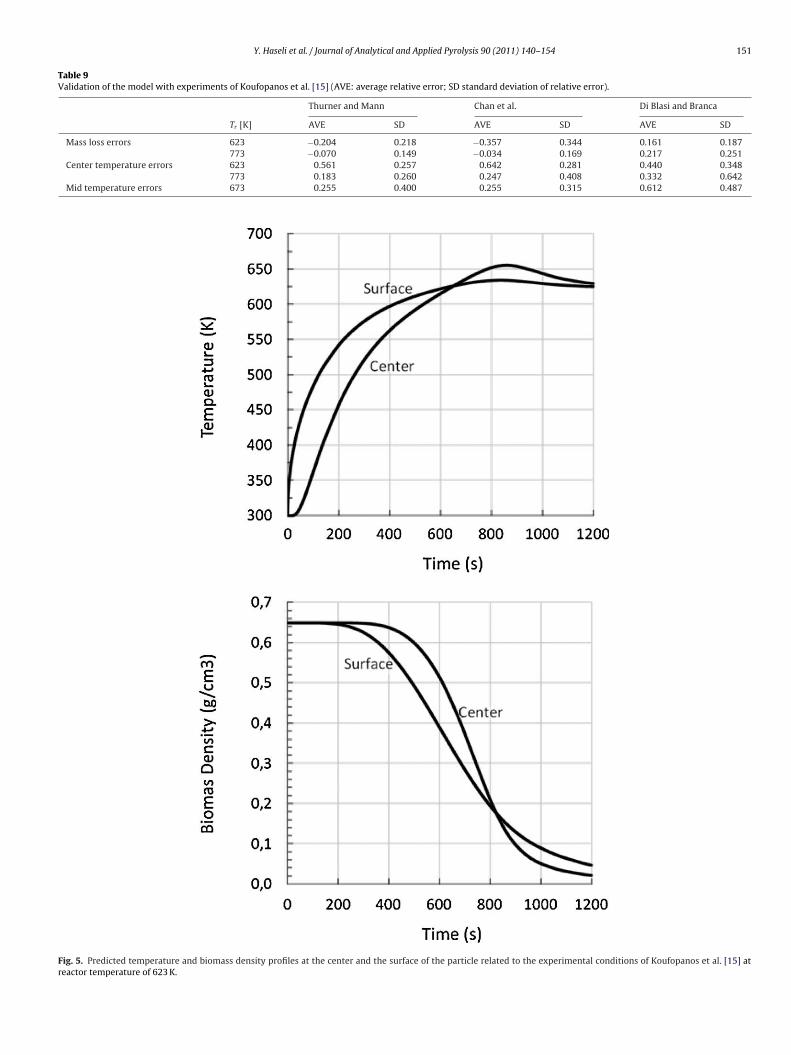
The above hypothesis is confirmed by the simulated tempera-ure and biomass density profiles in the center and at the surfacef the particle as depicted in Fig. 5. It can be seen that the cen-er temperature reaches the surface temperature at around 630 sfter initiation of the heating process. At this moment, over 50%
f the biomass in the center still remains to be decomposed. Ashe corresponding local temperature is within the range of primaryeactions, decomposition of the remaining biomass continues withrate higher than the local heat transfer rate, which results in aocal temperature rise due to the release of sensible heat by conver-
iomass density, tar density and char density. Simulated time: 1 min; different linesm inside the particle; kinetic data: Thurner and Mann.
sion of the virgin material to the byproducts. A careful observationof the graphs shown in Fig. 5 indicates that the temperature peaktakes place at the moment when the rate of biomass decompositionbecomes slower and it is close to finalize. It seems that when thereis only a small amount of virgin material left, the heat transfer ratebecomes dominant compared to the rate of the biomass decompo-sition so that the local temperature drops as the remaining biomassundergoes its final stage of conversion.
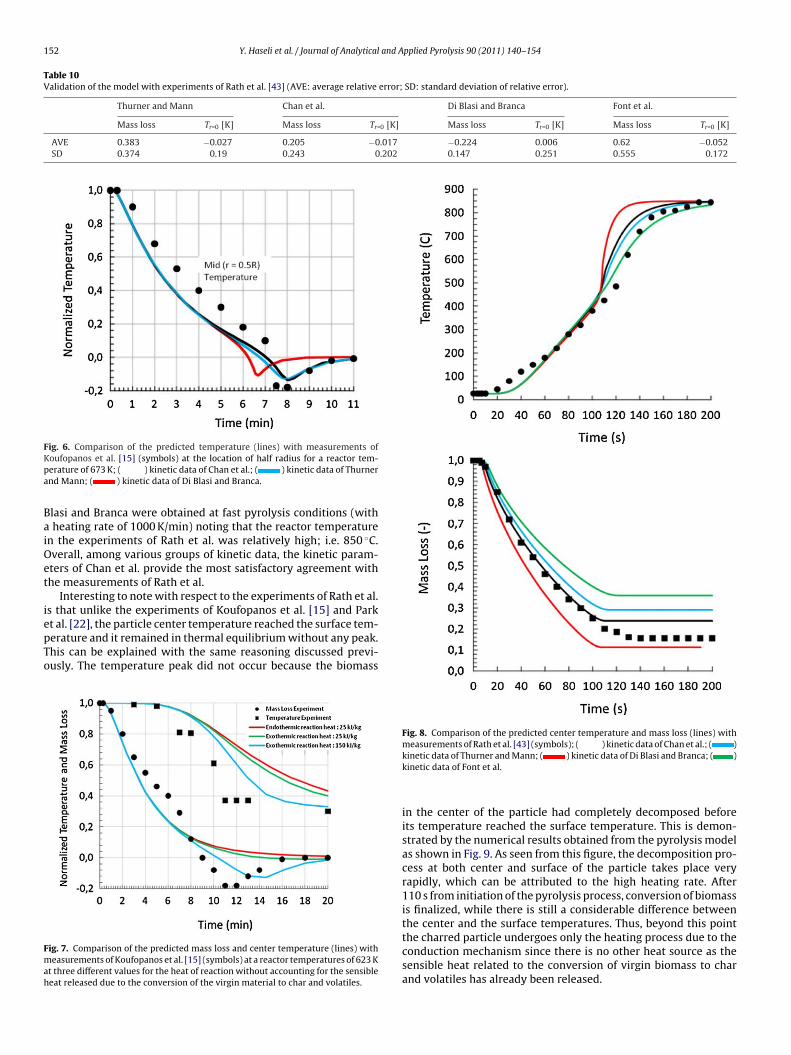
The ‘temperature-peak’ phenomenon may occur not only at thecenter of a pyrolyzing biomass particle but also at any other inter-nal position; for example at the location of half the radius. Fig. 6
illustrates an additional comparison between the predicted and themeasured temperature profiles at the location of half the radius.A good agreement is observed between the experiments and oursimulation results, especially when using the Thurner and Mann orChan et al. kinetic data, which further demonstrates the capability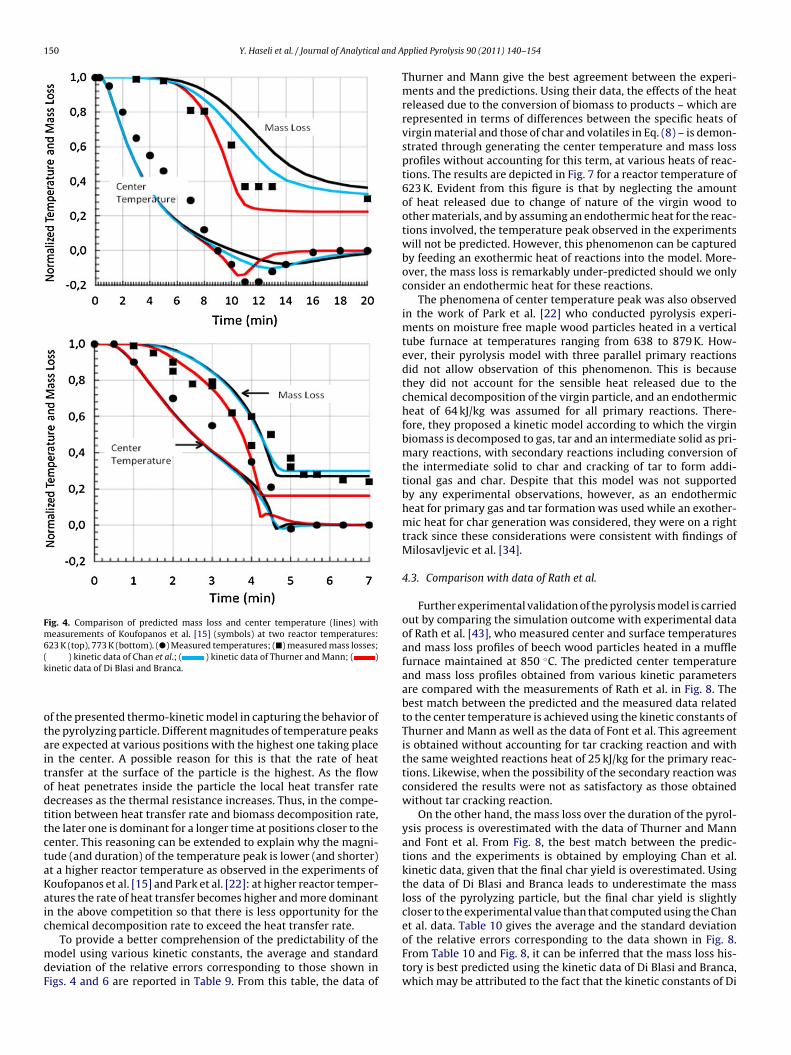
150 Y. Haseli et al. / Journal of Analytical and A
Fig. 4. Comparison of predicted mass loss and center temperature (lines) withmeasurements of Koufopanos et al. [15] (symbols) at two reactor temperatures:623 K (top), 773 K (bottom). (�) Measured temperatures; (�) measured mass losses;(k
otaitodttctaKaic
mdF
et al. data. Table 10 gives the average and the standard deviation
) kinetic data of Chan et al.; ( ) kinetic data of Thurner and Mann; ( )inetic data of Di Blasi and Branca.
f the presented thermo-kinetic model in capturing the behavior ofhe pyrolyzing particle. Different magnitudes of temperature peaksre expected at various positions with the highest one taking placen the center. A possible reason for this is that the rate of heatransfer at the surface of the particle is the highest. As the flowf heat penetrates inside the particle the local heat transfer rateecreases as the thermal resistance increases. Thus, in the compe-ition between heat transfer rate and biomass decomposition rate,he later one is dominant for a longer time at positions closer to theenter. This reasoning can be extended to explain why the magni-ude (and duration) of the temperature peak is lower (and shorter)t a higher reactor temperature as observed in the experiments ofoufopanos et al. [15] and Park et al. [22]: at higher reactor temper-tures the rate of heat transfer becomes higher and more dominantn the above competition so that there is less opportunity for thehemical decomposition rate to exceed the heat transfer rate.
To provide a better comprehension of the predictability of theodel using various kinetic constants, the average and standard
eviation of the relative errors corresponding to those shown inigs. 4 and 6 are reported in Table 9. From this table, the data of
pplied Pyrolysis 90 (2011) 140–154
Thurner and Mann give the best agreement between the experi-ments and the predictions. Using their data, the effects of the heatreleased due to the conversion of biomass to products – which arerepresented in terms of differences between the specific heats ofvirgin material and those of char and volatiles in Eq. (8) – is demon-strated through generating the center temperature and mass lossprofiles without accounting for this term, at various heats of reac-tions. The results are depicted in Fig. 7 for a reactor temperature of623 K. Evident from this figure is that by neglecting the amountof heat released due to change of nature of the virgin wood toother materials, and by assuming an endothermic heat for the reac-tions involved, the temperature peak observed in the experimentswill not be predicted. However, this phenomenon can be capturedby feeding an exothermic heat of reactions into the model. More-over, the mass loss is remarkably under-predicted should we onlyconsider an endothermic heat for these reactions.
The phenomena of center temperature peak was also observedin the work of Park et al. [22] who conducted pyrolysis experi-ments on moisture free maple wood particles heated in a verticaltube furnace at temperatures ranging from 638 to 879 K. How-ever, their pyrolysis model with three parallel primary reactionsdid not allow observation of this phenomenon. This is becausethey did not account for the sensible heat released due to thechemical decomposition of the virgin particle, and an endothermicheat of 64 kJ/kg was assumed for all primary reactions. There-fore, they proposed a kinetic model according to which the virginbiomass is decomposed to gas, tar and an intermediate solid as pri-mary reactions, with secondary reactions including conversion ofthe intermediate solid to char and cracking of tar to form addi-tional gas and char. Despite that this model was not supportedby any experimental observations, however, as an endothermicheat for primary gas and tar formation was used while an exother-mic heat for char generation was considered, they were on a righttrack since these considerations were consistent with findings ofMilosavljevic et al. [34].
4.3. Comparison with data of Rath et al.
Further experimental validation of the pyrolysis model is carriedout by comparing the simulation outcome with experimental dataof Rath et al. [43], who measured center and surface temperaturesand mass loss profiles of beech wood particles heated in a mufflefurnace maintained at 850 ◦C. The predicted center temperatureand mass loss profiles obtained from various kinetic parametersare compared with the measurements of Rath et al. in Fig. 8. Thebest match between the predicted and the measured data relatedto the center temperature is achieved using the kinetic constants ofThurner and Mann as well as the data of Font et al. This agreementis obtained without accounting for tar cracking reaction and withthe same weighted reactions heat of 25 kJ/kg for the primary reac-tions. Likewise, when the possibility of the secondary reaction wasconsidered the results were not as satisfactory as those obtainedwithout tar cracking reaction.
On the other hand, the mass loss over the duration of the pyrol-ysis process is overestimated with the data of Thurner and Mannand Font et al. From Fig. 8, the best match between the predic-tions and the experiments is obtained by employing Chan et al.kinetic data, given that the final char yield is overestimated. Usingthe data of Di Blasi and Branca leads to underestimate the massloss of the pyrolyzing particle, but the final char yield is slightlycloser to the experimental value than that computed using the Chan
of the relative errors corresponding to the data shown in Fig. 8.From Table 10 and Fig. 8, it can be inferred that the mass loss his-tory is best predicted using the kinetic data of Di Blasi and Branca,which may be attributed to the fact that the kinetic constants of Di
Y. Haseli et al. / Journal of Analytical and Applied Pyrolysis 90 (2011) 140–154 151
Table 9Validation of the model with experiments of Koufopanos et al. [15] (AVE: average relative error; SD standard deviation of relative error).
Thurner and Mann Chan et al. Di Blasi and Branca
Tr [K] AVE SD AVE SD AVE SD
Mass loss errors 623 −0.204 0.218 −0.357 0.344 0.161 0.187773 −0.070 0.149 −0.034 0.169 0.217 0.251
Center temperature errors 623 0.561 0.257 0.642 0.281 0.440 0.348773 0.183 0.260 0.247 0.408 0.332 0.642
Mid temperature errors 673 0.255 0.400 0.255 0.315 0.612 0.487
Fig. 5. Predicted temperature and biomass density profiles at the center and the surface of the particle related to the experimental conditions of Koufopanos et al. [15] atreactor temperature of 623 K.
152 Y. Haseli et al. / Journal of Analytical and Applied Pyrolysis 90 (2011) 140–154
Table 10Validation of the model with experiments of Rath et al. [43] (AVE: average relative error; SD: standard deviation of relative error).
Thurner and Mann Chan et al. Di Blasi and Branca Font et al.
Mass loss Tr=0 [K] Mass loss Tr=0 [K] Mass loss Tr=0 [K] Mass loss Tr=0 [K]
AVE 0.383 −0.027 0.205 −0.017 −0.224 0.006 0.62 −0.052SD 0.374 0.19 0.243 0.202 0.147 0.251 0.555 0.172
FKpa
BaiOet
iepTo
Fmah
ig. 6. Comparison of the predicted temperature (lines) with measurements ofoufopanos et al. [15] (symbols) at the location of half radius for a reactor tem-erature of 673 K; ( ) kinetic data of Chan et al.; ( ) kinetic data of Thurnernd Mann; ( ) kinetic data of Di Blasi and Branca.
lasi and Branca were obtained at fast pyrolysis conditions (withheating rate of 1000 K/min) noting that the reactor temperature
n the experiments of Rath et al. was relatively high; i.e. 850 ◦C.verall, among various groups of kinetic data, the kinetic param-ters of Chan et al. provide the most satisfactory agreement withhe measurements of Rath et al.
Interesting to note with respect to the experiments of Rath et al.s that unlike the experiments of Koufopanos et al. [15] and Park
t al. [22], the particle center temperature reached the surface tem-erature and it remained in thermal equilibrium without any peak.his can be explained with the same reasoning discussed previ-usly. The temperature peak did not occur because the biomassig. 7. Comparison of the predicted mass loss and center temperature (lines) witheasurements of Koufopanos et al. [15] (symbols) at a reactor temperatures of 623 K
t three different values for the heat of reaction without accounting for the sensibleeat released due to the conversion of the virgin material to char and volatiles.
Fig. 8. Comparison of the predicted center temperature and mass loss (lines) with
measurements of Rath et al. [43] (symbols); ( ) kinetic data of Chan et al.; ( )kinetic data of Thurner and Mann; ( ) kinetic data of Di Blasi and Branca; ( )kinetic data of Font et al.in the center of the particle had completely decomposed beforeits temperature reached the surface temperature. This is demon-strated by the numerical results obtained from the pyrolysis modelas shown in Fig. 9. As seen from this figure, the decomposition pro-cess at both center and surface of the particle takes place veryrapidly, which can be attributed to the high heating rate. After110 s from initiation of the pyrolysis process, conversion of biomassis finalized, while there is still a considerable difference betweenthe center and the surface temperatures. Thus, beyond this point
the charred particle undergoes only the heating process due to theconduction mechanism since there is no other heat source as thesensible heat related to the conversion of virgin biomass to charand volatiles has already been released.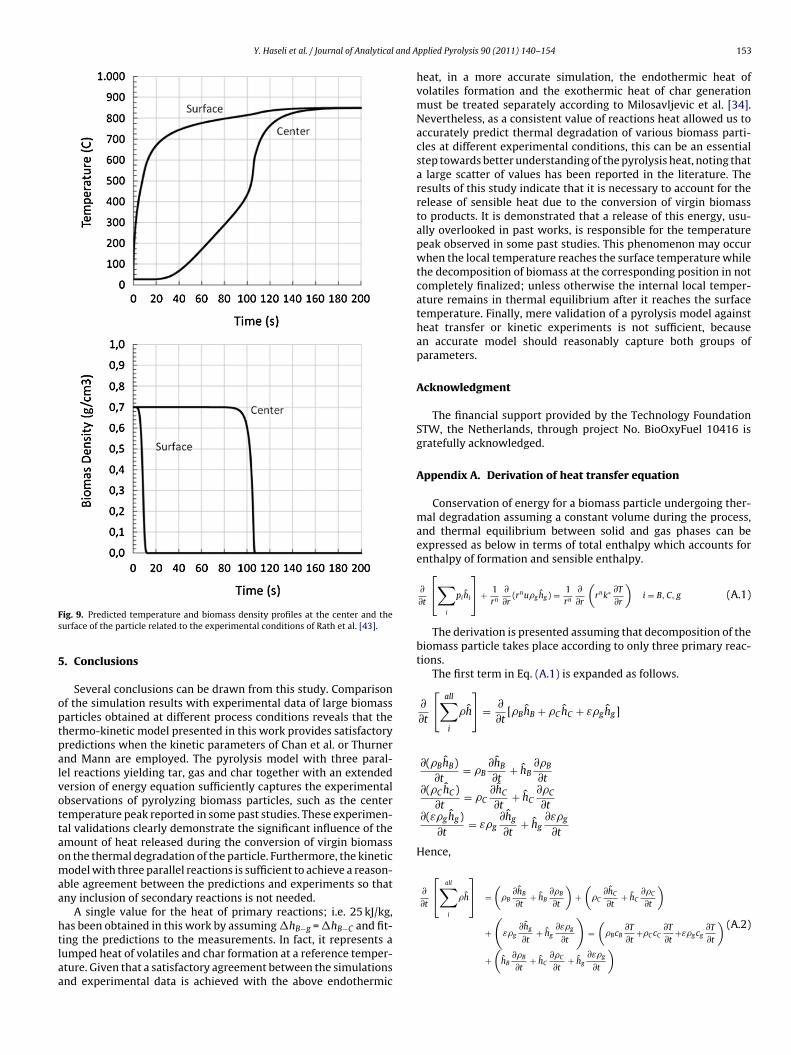
Y. Haseli et al. / Journal of Analytical and A
Fs
5
optpalvottaomaa
htlaa
∂h ∂ε� (A.2)
ig. 9. Predicted temperature and biomass density profiles at the center and theurface of the particle related to the experimental conditions of Rath et al. [43].
. Conclusions
Several conclusions can be drawn from this study. Comparisonf the simulation results with experimental data of large biomassarticles obtained at different process conditions reveals that thehermo-kinetic model presented in this work provides satisfactoryredictions when the kinetic parameters of Chan et al. or Thurnernd Mann are employed. The pyrolysis model with three paral-el reactions yielding tar, gas and char together with an extendedersion of energy equation sufficiently captures the experimentalbservations of pyrolyzing biomass particles, such as the centeremperature peak reported in some past studies. These experimen-al validations clearly demonstrate the significant influence of themount of heat released during the conversion of virgin biomassn the thermal degradation of the particle. Furthermore, the kineticodel with three parallel reactions is sufficient to achieve a reason-
ble agreement between the predictions and experiments so thatny inclusion of secondary reactions is not needed.
A single value for the heat of primary reactions; i.e. 25 kJ/kg,as been obtained in this work by assuming �h = �h and fit-
B−g B−Cing the predictions to the measurements. In fact, it represents aumped heat of volatiles and char formation at a reference temper-ture. Given that a satisfactory agreement between the simulationsnd experimental data is achieved with the above endothermicpplied Pyrolysis 90 (2011) 140–154 153
heat, in a more accurate simulation, the endothermic heat ofvolatiles formation and the exothermic heat of char generationmust be treated separately according to Milosavljevic et al. [34].Nevertheless, as a consistent value of reactions heat allowed us toaccurately predict thermal degradation of various biomass parti-cles at different experimental conditions, this can be an essentialstep towards better understanding of the pyrolysis heat, noting thata large scatter of values has been reported in the literature. Theresults of this study indicate that it is necessary to account for therelease of sensible heat due to the conversion of virgin biomassto products. It is demonstrated that a release of this energy, usu-ally overlooked in past works, is responsible for the temperaturepeak observed in some past studies. This phenomenon may occurwhen the local temperature reaches the surface temperature whilethe decomposition of biomass at the corresponding position in notcompletely finalized; unless otherwise the internal local temper-ature remains in thermal equilibrium after it reaches the surfacetemperature. Finally, mere validation of a pyrolysis model againstheat transfer or kinetic experiments is not sufficient, becausean accurate model should reasonably capture both groups ofparameters.
Acknowledgment
The financial support provided by the Technology FoundationSTW, the Netherlands, through project No. BioOxyFuel 10416 isgratefully acknowledged.
Appendix A. Derivation of heat transfer equation
Conservation of energy for a biomass particle undergoing ther-mal degradation assuming a constant volume during the process,and thermal equilibrium between solid and gas phases can beexpressed as below in terms of total enthalpy which accounts forenthalpy of formation and sensible enthalpy.
∂
∂t
[∑i
pihi
]+ 1
rn
∂
∂r(rnu�g hg ) = 1
rn
∂
∂r
(rnk∗ ∂T
∂r
)i = B, C, g (A.1)
The derivation is presented assuming that decomposition of thebiomass particle takes place according to only three primary reac-tions.
The first term in Eq. (A.1) is expanded as follows.
∂
∂t
[all∑i
�h
]= ∂
∂t[�BhB + �ChC + ε�ghg]
∂(�BhB)∂t
= �B∂hB
∂t+ hB
∂�B
∂t∂(�ChC )
∂t= �C
∂hC
∂t+ hC
∂�C
∂t∂(ε�ghg)
∂t= ε�g
∂hg
∂t+ hg
∂ε�g
∂t
Hence,
∂
∂t
[all∑i
�h
]=(
�B∂hB
∂t+ hB
∂�B
∂t
)+(
�C∂hC
∂t+ hC
∂�C
∂t
)( ) ( )
+ ε�gg
∂t+ hg
g
∂t= �BcB
∂T
∂t+�C cC
∂T
∂t+ε�gcg
∂T
∂t
+(
hB∂�B
∂t+ hC
∂�C
∂t+ hg
∂ε�g
∂t
)
1 and A
W
n
∂
∂r(
C )+
(
g∂T
∂r
Wii
h B + h
(
(
w
E
Q
Ib
Q
R
[
[[[[[
[[[
[
[[[[
[[
[[[
[
[[
[
[
[[
[
[[
[[
54 Y. Haseli et al. / Journal of Analytical
e also expand the second term in Eq. (A.1).
1rn
∂
∂r(rnu�ghg) = 1
rn
[rnu�g
∂hg
∂r+ hg
∂
∂r(rnu�g)
]= u�gcg
∂T
∂r+ hg
1r
ombination of Eqs. (A.2) and (A.3) gives
∂
∂t
[all∑i
�h
]+ 1
rn
∂
∂r(rnu�ghg) =
(�BcB
∂T
∂t+ �CcC
∂T
∂t+ ε�gcg
∂T
∂t
= (�BcB + �CcC + ε�gcg)∂T
∂t+ u�gc
ith the aid of the mass conservation equations of different species,.e. Eqs. (2), (3) and (5) introduced in Section 2, the last three termsn Eq. (A.4) are expressed as
ˆB
∂�B
∂t+ hC
∂�C
∂t+ hg
[∂ε�g
∂t+ 1
rn
∂
∂r(rnu�g)
]= −hB(k1 + k2 + k3)�
Inserting Eq. (A.5) into Eq. (A.4), and then substituting it into Eq.A.1), we get
�BcB + �CcC + ε�gcg)∂T
∂t+ u�gcg
∂T
∂r= 1
rn
∂
∂r
(rnk∗ ∂T
∂r
)+ Q (7)
here
Q = hB)(k1 + k2 + k3)�B − hC (k3�B) − hg(k1 + k2)�B
= hB (k1 + k2) �B + hBk3�B − hCk3�B − hg(k1 + k2)�B
= (hB − hg)(k1 + k2)�B + (hB − hC )k3�B
(A.6)
quation (A.6) can be reshaped using h = hf +∫
cpdT to read
˜ = (k1 + k2)�B[�hB−g +∫
(cB − cg )dT] + k3�B[�hB−C +∫
(cB − cC )dT] (A.7)
f a tar cracking reaction was also taken into account, Eq. (A.7) woulde as follows.
˜ = �B(k1 + k2)[�hB−g +∫
(cB − cg)dT] + �Bk3[�hB−C
+∫
(cB − cC )dT] + ε�T k4[�hT−G
+∫
(cT − cG)dT] (8)
eferences
[1] A. Williams, M. Pourkashanian, J.M. Jones, Prog. Energy Combust. Sci. 27 (2001)587–610.
[2] C. Di Blasi, Combust. Sci. Technol. 90 (1993) 315–340.[3] C. Di Blasi, Ind. Eng. Chem. Res. 35 (1996) 37–46.[4] M.G. Gronli, M.C. Melaaen, Energy Fuels 14 (2000) 791–800.
[5] A. Bharadwaj, L.L. Baxter, A.L. Robinson, Energy Fuels 18 (2004) 1021–1031.[6] J. Larfeldt, B. Leckner, M.C. Melaaen, Fuel 79 (2000) 1637–1643.[7] A. Galgano, C. Di Blasi, Ind. Eng. Chem. Res. 42 (2003) 2101–2111.[8] C.A. Koufopanos, G. Maschio, A. Lucchesi, Can. J. Chem. Eng. 67 (1989) 75–84.[9] F. Shafizadeh, P.S. Chin, Chem. A: ACS Symp. Ser. 43 (1977) 57–81.10] C. Di Blasi, Chem. Eng. Sci. 51 (1996) 1121–1132.[[
[
[
pplied Pyrolysis 90 (2011) 140–154
rnu�g)(A.3)
hB∂�B
∂t+ hC
∂�C
∂t+ hg
∂ε�g
∂t
)+ u�gcg
∂T
∂r+ hg
1rn
∂
∂r(rnu�g)
+ hB∂�B
∂t+ hC
∂�C
∂t+ hg
[∂ε�g
∂t+ 1
rn
∂
∂r(rnu�g)
] (A.4)
C (k3�B) + hg(k1 + k2)�B(A.5)
11] M.J Hagge, K.M. Bryden, Chem. Eng. Sci. 57 (2002) 2811–2823.12] K.M. Bryden, M.J. Hagge, Fuel 82 (2003) 1633–1644.13] K.M. Bryden, K.W. Ragland, C.J. Rutland, Biomass Bioenergy 22 (2002) 41–53.14] W.C. Chan, M. Kelbon, B.B. Krieger, Fuel 64 (1985) 1505–1513.15] C.A. Koufopanos, N. Papayannakos, G. Maschio, A. Lucchesi, Can. J. Chem. Eng.
69 (1991) 907–915.16] B.V. Babu, A.S. Chaurasia, Chem. Eng. Sci. 59 (2004) 1999–2012.17] A.K. Sadhukhan, P. Gupta, R.K. Saha, J. Anal. Appl. Pyrol. 81 (2008) 183–192.18] A.K. Sadhukhan, P. Gupta, R.K. Saha, Bioresour. Technol. 100 (2009) 3134–
3139.19] C. Di Blasi, Kinetics and modeling of biomass pyrolysis, in: A.V. Bridgwater (Ed.),
Fast Pyrolysis of Biomass: A Handbook, vol. 3, CPL Press, 2005, pp. 121–146.20] C. Di Blasi, Prog. Energy Combust. Sci. 34 (2008) 47–90.21] C. Di Blasi, J. Anal. Appl. Pyrol. 47 (1998) 43–64.22] W.C. Park, A. Atreya, H.R. Baum, Combust. Flame 157 (2010) 481–494.23] C. Di Blasi, C. Branca, A. Santoro, E.G. Hernandez, Combust. Flame 124 (2001)
165–177.24] H.C. Tran, R.H. White, Fire Mater. 16 (1992) 197–206.25] H. Lu, Experimental and modeling investigations of biomass particle combus-
tion, Ph.D. Thesis, Brigham Young University, 2006.26] C. Di Blasi, C. Branca, Ind. Eng. Chem. Res. 40 (2001) 5547–5556.27] F. Thurner, U. Mann, Ind. Eng. Chem. Process Des. Dev. 20 (1981) 482–488.28] R. Font, A. Marcilla, E. Verdu, J. Devesa, Ind. Eng. Chem. Res. 29 (1990)
1846–1855.29] C.K. Lee, R.F. Chaiken, J.M. Singer, 16th International Symposium on Combus-
tion, The Combustion Institute, Pittsburgh, 1977, pp. 1459–1470.30] A.G. Liden, F. Berruti, D.S. Scott, Chem. Eng. Commun. 65 (1988) 207–221.31] M.L. Boroson, J.B. Howard, J.P. Longwell, W.A. Peters, AIChE J. 35 (1989)
120–128.32] H. Kossitrin, Proc. Spec. Workshop on Fast Pyrolysis of Biomass, Copper Moun-
tain, Co., 1980, pp. 105–121.33] J.P. Diebold, The cracking of depolymerized biomass vapors in a continuous,
tabular reactor, M.Sc. Thesis, Colorado School of Mines, Golden, Co., 1985.34] I. Milosavljevic, V. Oja, E.M. Suuberg, Ind. Eng. Chem. Res. 35 (1996) 653–662.35] M.G. Gronli, A theoretical and experimental study of the thermal degradation of
biomass, Ph.D. Thesis, Norwegian University of Science and Technology, 1996.36] W.C. Park, A study of pyrolysis of charring materials and its application to fire
safety and biomass utilization, Ph.D. Thesis, The University of Michigan, 2008.37] J.A. Havens, J.R. Welker, C.M. Sliepcevich, J. Fire Flammability 2 (1971) 321–333.38] R. Bilbao, J.F. Mastral, J. Ceamanos, M.E. Aldea, J. Anal. Appl. Pyrol. 36 (1996)
81–97.39] W.S.L. Mok, M.J. Antal Jr., Thermochim. Acta 68 (1983) 165–186.40] H. Lu, E. Ip, J. Scott, P. Foster, M. Vickers, L.L. Baxter, Fuel 89 (2010) 1156–1168.
41] CHEM1D, www.combustion.tue.nl.42] K. Raznjevic, Handbook of Thermodynamic Tables and Charts, HemispherePublishing Corporation, McGraw-Hill, 1976.43] J. Rath, G. Steiner, M.G. Wolfinger, G. Staudinger, J. Anay. Appl. Pyrol. 62 (2002)
83–92.44] E.J. Kansa, H.E. Perlee, R.F. Chaiken, Combust. Flame 29 (1977) 311–324.