Embed Size (px)
Citation preview

Composites: Part A 42 (2011) 658–668
Contents lists available at ScienceDirect
Composites: Part A
journal homepage: www.elsevier .com/locate /composi tesa
Modeling and simulation of voids and saturation in liquid compositemolding processes
Chung Hae Park a,⇑, Aurélie Lebel a, Abdelghani Saouab a, Joël Bréard a, Woo Il Lee b
a Laboratoire d’Ondes et Milieux Complexes, FRE 3102 CNRS, University of Le Havre, 53 rue de Prony, BP 540, 76600 Le Havre, Franceb School of Mechanical and Aerospace Engineering, Seoul National University, Shinlim-dong, Kwanak-gu, 151-742 Seoul, Republic of Korea
a r t i c l e i n f o
Article history:Received 29 March 2010Received in revised form 28 January 2011Accepted 6 February 2011Available online 5 March 2011
Keywords:A. Polymer-matrix composites (PMCs)B. DefectsC. Numerical analysisE. Liquid composite molding (LCM)
1359-835X/$ - see front matter � 2011 Elsevier Ltd.doi:10.1016/j.compositesa.2011.02.005
⇑ Corresponding author.E-mail address: [email protected] (C
a b s t r a c t
We propose modeling and simulation of the void formation and the tow saturation in liquid compositemolding processes. The present model addresses the void formations in the macropore between fibertows as well as in the micropore inside fiber tows. We also consider the bubble compression and tow sat-uration after voids are formed at the flow front. Finally, a void migration model is considered. The presentmodels are validated by a comparison between simulation results and experimental data. The simulationresults successfully represent important features of the void physics: the correlation of void formation atthe flow front with capillary number, the advantage of vacuum application at air vents to reduce the voidcontent inside tows, and the existence of partially saturated zone behind the global flow front. The rep-resentation of mold filling patterns by a degree of saturation shows the presence of a bubbly zone behindthe flow front.
� 2011 Elsevier Ltd. All rights reserved.
1. Introduction
Liquid composite molding (LCM) processes, such as the resintransfer molding (RTM) process and the vacuum assisted resintransfer molding (VARTM) process, are widely employed to fabri-cate large and complex parts in the aeronautic industry. Void typedefects created during the manufacturing, however, have beenimportant issues in this class of processing technologies, since theydegenerate mechanical performances such as interlaminar shearstrength, flexural strength and compressive strength [33–44].According to American aeronautics standard, final products withmore than 2% of void defects should be rejected. Hence, it is ofgreat significance to analyze void generation physics and to opti-mize process conditions in order to improve the product quality.
There are many sources to create void type defects in compositemanufacturing. However, the principal mechanism depends on theprocess type. Whereas the nucleation and the growth of void dur-ing cure are the main sources in the autoclave technique, themechanical air entrapment is the main reason for the void creationin LCM processes [2–5]. It has been known that a non-uniform flowis induced by a heterogeneous micro-structure of fiber preformand air is entrapped at the flow front during the mold filling pro-cess. Nowadays, textile reinforcements with high count fiber towsare frequently adopted as fiber preforms in the RTM process inorder to improve the mechanical properties of composites. In the
All rights reserved.
.H. Park).
micro-structure of these textile fabrics, we can find two kinds ofpores with remarkably different pore sizes: micropore (insidetow) which is a tiny space between individual fiber filaments,and macropore which is an open gap between tows (Fig. 1). In gen-eral, these fiber reinforcements with high count fiber tows are re-garded as double scale porous media with a bi-modal distributionof pore size [6]. In the macropore, viscous flow is dominant whilecapillary wicking is more important in the micropore since capil-lary pressure is inversely proportional to the pore size. Hence, itis assumed that the void formation mechanism in the RTM processis a competition between the viscous flow in the macropore andthe capillary wicking in the micropore. It has been found, fromexperimental investigations, that the void formation at the flowfront can be correlated with a dimensionless number called modi-fied capillary number (Ca�) which is a ratio of viscous force andsurface tension (e.g. Fig. 2a) [6–9].
Ca� ¼ l � �uc � cos h
ð1Þ
where l is the resin viscosity, �u is the global resin velocity, c is thesurface tension of resin and h is the contact angle.
If the resin velocity is great (i.e. high capillary number), the re-sin flow in the macropore leads that in the micropore. As a result,air is entrapped in the micropore (Fig. 2c). On the contrary, air bub-ble is created in the macropore, if the resin velocity is small (i.e.low capillary number) and the capillary wicking inside the towleads the viscous resin flow through the macropore (Fig. 2b).Images of these two different types of voids are shown in

d, small gap within tows,
Micropore D, large gap
between tows, Macropore
Fig. 1. Two different length scales in double scale porosity textile reinforcements.(For interpretation of the references to color in this figure legend, the reader isreferred to the web version of this article.)
Fig. 3. Void physics in the RTM process: formation, compression and transport. (Forinterpretation of the references to color in this figure legend, the reader is referredto the web version of this article.)
C.H. Park et al. / Composites: Part A 42 (2011) 658–668 659
Fig. 2d–e. If the resin is injected under a constant pressure, voidsare formed inside tows at the flow front near the injection portswhere the flow front advancing velocity is great. On the otherhand, voids are created between tows at the flow front far fromthe injection ports where the resin velocity is small.
Once air bubbles are created at the flow front, their size and po-sition change with time. As the resin pressure surrounding an airbubble increases, the air bubble is compressed. If the tow is notcompleted filled, the resin continues to impregnate the tow evenafter the flow front passes by. Furthermore, some bubbles can mi-grate along the resin flow. It should be noted that experimentalinvestigations on the relation between void formation and capil-lary number have been performed by in situ visualization tech-niques [6–9]. Hence, a real distribution of void content in thefinal part may be different from a simple correlation of void con-tent with capillary number. To better predict void content, subse-quently, we should take into account all these physics: voidformation, bubble compression, tow saturation and void transport(Fig. 3).
So far, many studies have been focusing on the modeling of mi-cro-voids inside tows [10–17,45]. Even if voids are formed also in
(a)
(b) (c)Fig. 2. Void formation mechanism and capillary number. (a) Void content vs. capillary(high capillary number). (d) Photo of void between tows in an RTM part. (e) Photo of voidfigure legend, the reader is referred to the web version of this article.)
the macropore between fiber tows in practical processes, however,a very limited number of papers have addressed the modeling ofvoids in the macropore between fiber tows [18–20]. Moreover,few papers have been found in the literature on the modelingand simulation of void transport.
We present an integrated modeling on the formation, the com-pression and the transport of air voids. In particular, the void for-mation is modeled considering different tow orientations indirectional mats. The current models will be validated by a com-parison with the experimental result by a sensor system presentedin Ref. [1]. A finite element method (FEM) code for mold filling sim-ulations was developed based on the current models and we showsome simulation results to investigate the influence of processingconditions. Mold filling patterns will be represented in terms of de-gree of saturation as well as fill factor. By contour plots of degree ofsaturation, we will show the existence of a partially saturated zonebehind the global flow front, considering the voids in the macro-pore as well as in the micropore. As a parametric study, void con-tent will be estimated for different air vent pressures under thesame pressure differential which is a difference between injection
(d) (e)number [8]. (b) Voids between tows (low capillary number). (c) Voids within towss inside the tow in an RTM part. (For interpretation of the references to color in this

660 C.H. Park et al. / Composites: Part A 42 (2011) 658–668
pressure and air vent pressure. We will show that the void contentis affected not only by the resin velocity as expected from the cor-relation with capillary number but also by the vacuum pressure atair vents.
2. Void modeling
2.1. Definition of fabric micro-structure
In the present work, we consider plain weave mats composed ofwarp and weft tows. However, the current configuration can be ap-plied also to unidirectional mats or non-orthogonal fabrics bychanging the properties of warp and weft tows.
Above all, the micro-structure of fabrics is assumed to be com-posed of a same unit cell in a repetitive way. In the unit cell, towlengths are defined as illustrated in Fig. 4. In Fig. 4, the subscripts‘‘wp’’ and ‘‘wt’’ represent warp and weft tows, respectively. Foreach tow (warp and weft), the longitudinal (//) and the transverse(\) lengths are defined in the unit cell of fabrics, assuming that allthe fiber filaments in the tow are aligned in the parallel direction,i.e. the longitudinal direction.
Then, we define volumes of each tow (Fig. 5). vwp and vwt denotewarp volume ratio and weft volume ratio in the unit cell, respec-tively. The tow volume consists of the volume of fiber filamentsand the micropore between individual fibers. The macroporewhich is an open gap between tows is called ‘‘channel’’ as it formsa flow channel during the mold filling process. Then, we obtain theexpressions of volume ratios of tows (warp and weft) and channelin the unit cell.
vwp ¼volume of warp
volume of warpþweftþ channelð2Þ
vwt ¼volume of weft
volume of warpþweftþ channelð3Þ
vC ¼volume of channel
volume of warpþweftþ channel¼ 1� vwp � vwt ð4Þ
Fig. 4. Definition of tow lengths in woven mats.
Fig. 5. Definition of tow volumes in woven mats.
The subscript ‘‘C’’ represents the channel whereas ‘‘wp’’ and ‘‘wt’’denote the warp and weft tows, respectively.
The global fiber volume fraction of fabric (Vf) can be estimatedfrom the fiber volume fractions of warp and weft tows (Vf,wp andVf,wt).
Vf ¼ Vf ;wp � vwp þ Vf ;wt � vwt ð5Þ
The thicknesses of warp and weft tows in a single mat can beobtained from the micro-structure of the fabric in the mold. Ifthe dimensions of warp and weft tows are the same, each towthickness can be obtained as the following relations.
Hwp ¼Hmold
Nf
vwp
vwp þ vwtð6Þ
Hwt ¼Hmold
Nf
vwt
vwp þ vwtð7Þ
where Hwp and Hwt are the warp and weft thicknesses, respectively.Hmold is the mold height or the part thickness, and Nf is the numberof fabric layers in the preform.
It should be noted that all the parameters of fabric micro-structure are defined in the preform contained in the mold.
2.2. Void formation
As stated previously, the main source of void formation at theflow front is a non-uniform flow caused by a competition betweenthe viscous flow in the macropore and the capillary suction in themicropore. Kang et al. proposed a void formation model consider-ing two different flows in the macropore and the micropore [18]. Intheir approach, both the voids in the micropore and in the macro-pore were successfully modeled and the modeling result showed agood agreement in a qualitative way with an experimental correla-tion of void content with capillary number. However, some param-eters should be decided by a curve fit of experimental results andthe tow orientation was not considered. We improve this approachby considering the micro-architecture of fabrics.
Assuming that the global resin pressure gradient is identicalboth in the macropore (inter-bundle gap) and in the micropore(intra-bundle porous zone), time scales for the resin to traverse asingle tow length are computed between tows and through atow at the flow front, respectively (Fig. 6). In the macropore, the re-sin flow is a viscous flow. In this zone, the resin velocity is obtainedusing Darcy’s law with the unsaturated permeability of preformwhich can be obtained by the regression analysis of measurementdata of global flow front position with time (see the blue dashedline in Fig. 6a).
uM ¼dlC
dt¼ �Kunsat
l@P@n
ð8Þ
In the micropore, capillary pressure should be considered tocompute the resin advancing velocity through the tow (see thered solid line in Fig. 6a). Indeed, the resin pressure gradient inthe micropore may be different from that in the macropore, be-cause of the capillary pressure. However, the resin penetration dis-tance inside the tow is so small compared with the global flow pathand the time for the resin to travel by a single tow length is short.Hence, it is assumed that the resin pressure gradient in the micro-pore is identical with that in the macropore and kept unchangedwhile air is entrapped at the flow front.
um ¼dlT
dt¼ � 1
1� Vf ;T
KT
l@P@n� Pcap
lT
� �ð9Þ
where the subscript ‘‘T’’ represents ‘‘wp’’ for the warp tow or ‘‘wt’’for the weft tow. lC(t) and lT(t) are the resin flow front positions with

(a)
(b) (c)Fig. 6. Schematic of resin impregnation in the macropore and the micropore. (a)Two different flows in the macropore and the micropore. (b) Air entrapped insidetow (DtT > DtC: void in the micropore). (c) Air entrapped between tows (DtT < DtC:void in the macropore). (For interpretation of the references to color in this figurelegend, the reader is referred to the web version of this article.)
(a)
(b)Fig. 7. Schematic of resin impregnation when the flow direction and the towdirection are not identical. (a) Angle between global resin flow and tow orientation.(b) Schematic of resin impregnation in tow and in channel. (For interpretation ofthe references to color in this figure legend, the reader is referred to the web versionof this article.)
C.H. Park et al. / Composites: Part A 42 (2011) 658–668 661
time in the channel (macropore) and inside the tow (micropore),respectively. Vf,T is the fiber volume fraction of tow, KT is the perme-ability of tow and Pcap is the capillary pressure. Tow is regarded as aunidirectional composite. The tow permeabilities in the longitudi-nal and the transverse directions are obtained by Gebart’s model[21]. The fiber array in the tow is assumed to be a hexagonal array.
Capillary pressure in the unidirectional composites is obtainedas the following relation [22].
Pcap ¼F
Df
� �Vf ;T
1� Vf ;Tc � cos h ð10Þ
where Df is the fiber diameter and F is the shape factor (two for thetransverse direction and four for the longitudinal direction).
Then, we compute time scales for the resin to travel by a singletow length in these two different zones.
lC ¼Z DtC
0uM dt : in the channel ðmacroporeÞ ð11Þ
lT ¼Z DtT
0um dt : inside the tow ðmicroporeÞ ð12Þ
If the time scale inside tows (DtT) is greater than the time scalein the channel between tows (DtC), an air bubble is created in themicropore (Fig. 6b), and vice versa (Fig. 6c). If voids are formed in-side the tow, the volume of unfilled portion of the tow is supposedto be proportional to the difference of these two time scales [18]. Ifthe global resin flow direction does not coincide with the towdirection, the pressure gradient is decomposed into the longitudi-nal and transverse directions of tow. Then, the unfilled portion isobtained by a product of ratios of time scale differences in thelongitudinal and transverse directions. The schematics of the flowangle and the unfilled portion in warp tows are depicted in Fig. 7.For the convenience, the warp orientation is assumed to be identi-cal with x axis (Fig. 7a). If the time scale inside warp tows is greaterthan in the channel zone (DtT,wp > DtC,wp), for example, the unfilledportion in warp tows is obtained as (Fig. 7b):
DtT;wp ¼min½Dtx;T;wp;Dty;T;wp� ð13Þ
DtC;wp ¼min½Dtx;C;wp;Dty;C;wp� ð14Þ
/T;wp ¼ hv;T;wp � 1� DtC;wp
Dtx;T;wp
� �� 1� DtC;wp
Dty;T;wp
� �ð15Þ
where hv,T,wp is the shape factor of bubble which depends on the mi-cro-architecture of fabric. The bubble shape factor can be deter-mined by a microscopic observation of air voids.
If the time scale inside warp tows is smaller than in the opengap between tows (DtT,wp < DtC,wp), the unfilled portion of thechannel region is obtained as
/C;wp ¼ hv;C;wp � 1� DtT;wp
Dtx;C;wp
� �� 1� DtT;wp
Dty;C;wp
� �ð16Þ
For weft tows, we can apply the same procedure.From the unfilled portions in tows (warp and weft), we can ob-
tain air volume fractions (Fig. 8a and b).
Va;wp ¼ /T;wp � vwp � ð1� Vf ;wpÞ ð17Þ
Va;wt ¼ /T;wt � vwt � ð1� Vf ;wtÞ ð18ÞTo obtain the air volume fraction in the channel zone, we take
the volume average of the unfilled portion between warp towsand the unfilled portion between weft tows (Fig. 8c and d).
Va;C ¼/C;wp � vwp þ /C;wt � vwt
vwp þ vwt� ð1� vwp � vwtÞ ð19Þ
2.3. Void compression and tow saturation
Once air bubbles are formed at the flow front, their sizes canchange as the resin pressure surrounding them vary with time.

(a)
(b)
(c)
(d)Fig. 8. Definition of unfilled portions in tows and channel. (a) Unfilled portioninside warp tow. (b) Unfilled portion inside weft tow. (c) Unfilled portion betweenwarp tows. (d) Unfilled portion between weft tows. (For interpretation of thereferences to color in this figure legend, the reader is referred to the web version ofthis article.)
Fig. 9. Schematic of tow saturation (in weft tow). (For interpretation of thereferences to color in this figure legend, the reader is referred to the web version ofthis article.)
662 C.H. Park et al. / Composites: Part A 42 (2011) 658–668
Applying the ideal gas law assuming the resin temperature is con-stant, the air volume fraction in the channel region at each instantcan be updated as a function of resin pressure.
Va;Cðt þ Dt; x; yÞ ¼ Pðt; x; yÞPðt þ Dt; x; yÞ � Va;Cðt; x; yÞ ð20Þ
The air bubbles inside tows are compressed as the resin is per-meated into the tow. As the pore size is so tiny inside the tow, thecapillary pressure induced by the surface tension effect has a sig-nificant influence on the resin flow at the liquid–air interface. Con-sequently, the resin flow inside the tow is driven by the overalleffect of the resin pressure, the air pressure inside the air bubbleand the capillary pressure at the flow front. As the resin is infil-trated into the tow, the air volume entrapped inside the tow is re-duced and the air pressure is increased if the air mass is conserved.Meanwhile, the increase of air pressure yields a flow resistance tothe tow saturation accordingly.
In fact, numerical simulation of resin flow in the complexshaped tow need heavy computations with a huge number of ele-ments, since the tow size is so small and very tiny elements are re-quired [23]. For example, we need about 106 elements for thesimulation of a unit cell with dimensions of 1 cm � 1 cm � 1 cmif we adopt a mesh size of 100 lm. Instead, the tow geometry issimplified as a rectangular plate or a cylinder where analyticalsolution or fast calculation can be found, in most practical model-ing approaches [10–17,45]. The cross section of an actual fiber towis close to an ellipsoid with large upper and bottom surfaces.Hence, it is assumed that the resin flow into tows in the thickness
direction is more important than in the planar directions, once thetow is surrounded by the resin and the air is entrapped inside thetow [15].
At each instant, transverse flow into the tow is estimated byDarcy’s law using a pressure difference between the resin outsidethe tow and the air inside the tow.
qtr ¼KT
lPresin � Pair þ Pcap
Hi � hairi ¼ wp;wt ð21Þ
where Hwt is the half height of the tow contained in the mold andhair is the average half height of air bubble inside the tow. Capillarypressure at the air–liquid interface is obtained by Eq. (10).
Then, at each instant, the unfilled portion is updated as
/T;iðt þ DtÞ ¼ /T;iðtÞ �2 � qtr � Ae � Dt
ð1� Vf ;iÞ � ðli;== � li;? � HiÞi ¼ wp;wt ð22Þ
where Ae is the effective area of wetting zone inside the tow.This scheme is illustrated in Fig. 9. hair and Ae are approximated
as a function of unfilled portion.
hair ¼ Hi � /T;i i ¼ wp;wt ð23Þ
Ae ¼ li;== � li;? � /T;i i ¼ wp;wt ð24Þ
The change of air pressure at each instant is obtained by theideal gas law.
Pair;iðt þ DtÞ ¼/T;iðtÞ
/T;iðt þ DtÞ � Pair;iðtÞ i ¼ wp;wt ð25Þ
2.4. Void transport
In LCM processes, there are two principal paths for void migra-tion: inside a tow (Fig. 10a) and along a channel which is an opengap between tows (Fig. 10b).

(a) (b)Fig. 10. Illustration of void migration. (a) Void transport inside tow. (b) Voidtransport between tows. (For interpretation of the references to color in this figurelegend, the reader is referred to the web version of this article.)
(a)
(b)Fig. 11. Void migration velocity. (a) Void velocity and resin velocity. (b) Exper-imental data and curve fit of model [24,25]. (For interpretation of the references tocolor in this figure legend, the reader is referred to the web version of this article.)
C.H. Park et al. / Composites: Part A 42 (2011) 658–668 663
Inside the tow, air bubbles are stationary only decreasing theirsizes due to the progressive tow saturation if the air pressure in theair bubbles is smaller than the sum of the resin pressure outsidethe air bubbles and the capillary pressure. Otherwise, the air bub-bles begin to move. It is assumed that the relative velocity of airbubble which is the difference of the bubble velocity and the resinvelocity, is close to zero, as the size of pore inside the tow is sosmall (i.e. the order of micrometer) and the surface tension effectis great. Hence, the air void is supposed to be displaced at the samevelocity of the resin flow in the micropore inside the tow. If thepressure gradient in the micropore is the same as that in the mac-ropore, we can obtain the bubble migration velocity in the micro-pore (ui,air,T) that equals to the resin velocity in the micropore asthe following relation.
ui;air;T ¼Ki;T
Ki;unsatui;resin i ¼ x; y ð26Þ
As air voids continue to be displaced, they will escape, eventu-ally, from the tow and join the air bubbles that already exist in thechannel. We can derive a void convection equation from the con-servation law.
@Va;C
@tþr � ð�uair;C � Va;CÞ ¼ _Sa ð27Þ
where �uair;C is the void migration velocity in the macropore and _Sa isthe source term for air volume in the channel zone such as air vol-ume rate added from the tow to the channel. If a thermoset resin isinjected, the initial air content in the resin coming from the resinpot and the evaporation of chemical volatile gas can be consideredin this source term.
For the migration velocity of air bubbles in the channel zone, weadopt a phenomenological model (Fig. 11) [24,25]. From experi-mental observations, it has been found that there exists a criticalresin velocity. Below this value, voids do not move at all or moveat a very low speed. Above this value, voids move faster than theresin and the slant of the resin velocity and the void velocity ap-proaches an asymptotic value as the resin velocity increasesfurther.
�uair;C ¼ Fu � �uresin ð28Þ
Table 1Resin properties.
Viscosity l 0.15 Pa sSurface tension c 0.0317 N/mContact angle h 30�
Fu ¼A 1� 1
2 ekðucrit�uresinÞ� �
; uresin P ucrit
A2 ekðuresin�ucritÞ; uresin < ucrit
(ð29Þ
where Fu is the void slip factor. A and k are model constants whichcan be obtained by curve fitting of experimental data. Model con-stants are presented in Table 3.
3. Results and discussion
3.1. Rectilinear injection simulation
We integrated the present models into the FEM code for RTMmold filling simulations [26].
Simulations of rectilinear mold filling were performed to obtainair void content. As a preform, a bi-directional woven mat was con-sidered. The material properties and the micro-structure parame-ters are provided in Tables 1 and 2. The injection pressure wasmaintained as a constant value of 2.7 bar and the air vent pressurewas the atmospheric pressure (1 bar). Hence, the pressure differen-tial was 1.7 bar. The air volume fractions inside warp and wefttows and in channel zones between tows were obtained as a func-tion of the distance from the injection gate. Then, the air volumefraction was also plotted against modified capillary number.
Firstly, only the void formation model was considered whereasneither the bubble compression/tow saturation nor the void trans-port was considered. Simulation results are presented in Fig. 12. Atthe vicinity of the injection gate, the velocity of flow front progresswas great. Hence, the viscous flow between tows was more impor-tant than the capillary wicking inside tows. Subsequently, air bub-bles were entrapped inside tows. It is noteworthy that the airbubble content in weft tows are greater than in warp tows(Fig. 12a). In fact, the tow permeabilities and the capillary pres-sures in each tow are different according to the tow orientation.Consequently, this leads to a difference in the resin impregnation

Table 2Fabric micro-structure parameters.
Warp length (longitudinal) lwp,// 5.5 mmWarp length (transverse) lwp,\ 4.5 mmWeft length (longitudinal) lwt,// 5.5 mmWeft length (transverse) lwt,\ 4.5 mmWarp height 2Hwp 1.0 mmWeft height 2Hwt 1.0 mmWarp volume fraction vwp 0.453Weft volume fraction vwt 0.453Fiber volume fraction of warp Vf,wp 0.64Fiber volume fraction of weft Vf,wt 0.64Fiber volume fraction of fabric Vf 0.58Fiber diameter Df 14 lmShape factor of bubble inside warp hV,T,wp 0.53Shape factor of bubble inside weft hV,T,wt 0.53Shape factor of bubble in the channel hV,C,wp = hV,C,wt 0.53
Table 3Void migration model constants (Eq. (29)).
A 12.203k 18,240ucrrit 0.00028 m/s
0 0.2 0.4 0.6 0.8 1
X [m]
Void
con
tent
WarpWeft
Total
(a)
Channel
0
0.05
0.1
0.15
0.2
0.25
0.0001 0.0010 0.0100 0.1000
Ca*
Void
con
tent
(b)
0
0.04
0.08
0.12
0.16
0.2
Fig. 12. Simulation results of void formation (without bubble compression/towsaturation nor void transport). (a) Void content vs. position. (b) Void content vs.modified capillary number. (For interpretation of the references to color in thisfigure legend, the reader is referred to the web version of this article.)
664 C.H. Park et al. / Composites: Part A 42 (2011) 658–668
velocity inside each tow. Far from the injection port, the resinvelocity was small and the capillary suction inside tows was moreimportant than the viscous flow. As a result, air bubbles wereformed in open gaps between tows. Many experimental results ob-tained by in situ monitoring of void formation have shown that thevoid content can be correlated with modified capillary number asshown in Fig. 2a [6–9]. It has been observed that there exists anoptimal capillary number that minimizes the void formation. Thisimplies that the void formation can be suppressed by optimizingthe resin velocity at the flow front. For many fiber reinforcementsused in the RTM process, this optimal capillary number is about ofan order of 10�3 [6]. In Fig. 12b, we can see the presence of optimalcapillary number which is of the same order. It should be notedthat the minimal void content at the optimal capillary numberdoes not drop to zero. In the case of unidirectional mats (Fig. 2a,[8]), the resin flows between tows and inside tow are synchronizedat the optimal capillary number. Eventually, the void formation isvirtually suppressed. If there are multiple tows in different orienta-tions in the same fabric (e.g. bi-directional mats), it is no more pos-sible to match all the resin velocities in channel zones and in eachtow. Hence, the minimal void content is not suppressed to zero(Fig. 12b). This corresponds to the results with woven mats in Refs.[17,27].
X [m]
Void
con
tent
0 0.2 0.4 0.6 0.8 1
WarpWeftChannelTotal
0
0.02
0.04
0.06
0.08
0.1
(a)
(b)Ca*
Void
con
tent
0.0001 0.0010 0.0100 0.10000
0.02
0.04
0.06
0.08
0.1
Fig. 13. Simulation results of void formation and bubble compression/tow satura-tion (without void transport). (a) Void content vs. position. (b) Void content vs.modified capillary number. (For interpretation of the references to color in thisfigure legend, the reader is referred to the web version of this article.)
C.H. Park et al. / Composites: Part A 42 (2011) 658–668 665
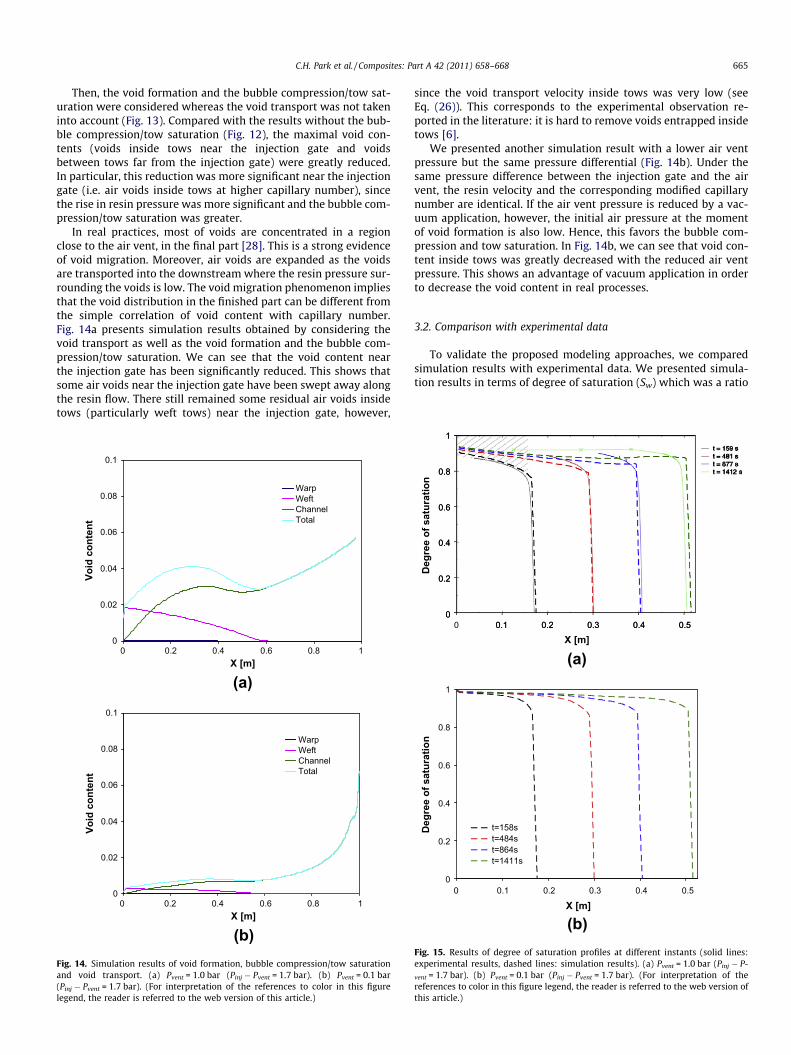
Then, the void formation and the bubble compression/tow sat-uration were considered whereas the void transport was not takeninto account (Fig. 13). Compared with the results without the bub-ble compression/tow saturation (Fig. 12), the maximal void con-tents (voids inside tows near the injection gate and voidsbetween tows far from the injection gate) were greatly reduced.In particular, this reduction was more significant near the injectiongate (i.e. air voids inside tows at higher capillary number), sincethe rise in resin pressure was more significant and the bubble com-pression/tow saturation was greater.
In real practices, most of voids are concentrated in a regionclose to the air vent, in the final part [28]. This is a strong evidenceof void migration. Moreover, air voids are expanded as the voidsare transported into the downstream where the resin pressure sur-rounding the voids is low. The void migration phenomenon impliesthat the void distribution in the finished part can be different fromthe simple correlation of void content with capillary number.Fig. 14a presents simulation results obtained by considering thevoid transport as well as the void formation and the bubble com-pression/tow saturation. We can see that the void content nearthe injection gate has been significantly reduced. This shows thatsome air voids near the injection gate have been swept away alongthe resin flow. There still remained some residual air voids insidetows (particularly weft tows) near the injection gate, however,
WarpWeftChannelTotal
X [m]
Void
con
tent
(a)
0 0.2 0.4 0.6 0.8 10
0.02
0.04
0.06
0.08
0.1
WarpWeftChannelTotal
X [m]
Void
con
tent
(b)
0 0.2 0.4 0.6 0.8 10
0.02
0.04
0.06
0.08
0.1
Fig. 14. Simulation results of void formation, bubble compression/tow saturationand void transport. (a) Pvent = 1.0 bar (Pinj � Pvent = 1.7 bar). (b) Pvent = 0.1 bar(Pinj � Pvent = 1.7 bar). (For interpretation of the references to color in this figurelegend, the reader is referred to the web version of this article.)
since the void transport velocity inside tows was very low (seeEq. (26)). This corresponds to the experimental observation re-ported in the literature: it is hard to remove voids entrapped insidetows [6].
We presented another simulation result with a lower air ventpressure but the same pressure differential (Fig. 14b). Under thesame pressure difference between the injection gate and the airvent, the resin velocity and the corresponding modified capillarynumber are identical. If the air vent pressure is reduced by a vac-uum application, however, the initial air pressure at the momentof void formation is also low. Hence, this favors the bubble com-pression and tow saturation. In Fig. 14b, we can see that void con-tent inside tows was greatly decreased with the reduced air ventpressure. This shows an advantage of vacuum application in orderto decrease the void content in real processes.
3.2. Comparison with experimental data
To validate the proposed modeling approaches, we comparedsimulation results with experimental data. We presented simula-tion results in terms of degree of saturation (Sw) which was a ratio
t=158st=484st=864st=1411s
X [m]
Deg
ree
of s
atur
atio
n
0 0.1 0.2 0.3 0.4 0.50
0.2
0.4
0.6
0.8
1
X [m]
Deg
ree
of s
atur
atio
n
0.1 0.2 0.3 0.4 0.50 0.1 0.2 0.3 0.4 0.50
0.2
0.4
0.6
0.8
1
0
0.2
0.4
0.6
0.8
1
(a)
(b)Fig. 15. Results of degree of saturation profiles at different instants (solid lines:experimental results, dashed lines: simulation results). (a) Pvent = 1.0 bar (Pinj � P-
vent = 1.7 bar). (b) Pvent = 0.1 bar (Pinj � Pvent = 1.7 bar). (For interpretation of thereferences to color in this figure legend, the reader is referred to the web version ofthis article.)

Resin injection
Dry fabric
Air vent(a)
(b)
(c)Fig. 16. Simulation results of mold filling pattern of automotive front panel (left: fill factor, right: degree of saturation). (a) t/tfill = 0.163. (b) t/tfill = 0.476. (c) t/tfill = 0.999. (Forinterpretation of the references to color in this figure legend, the reader is referred to the web version of this article.)
666 C.H. Park et al. / Composites: Part A 42 (2011) 658–668
of liquid volume fraction (Vl) to pore volume fraction in the controlvolume (Fig. 15).
Sw ¼Vl
1� Vf¼ 1� Vf � ðVa;C þ Va;wp þ Va;wtÞ
1� Vfð30Þ
In Fig. 15a, solid lines are the curves of degree of saturation ob-tained by the experimental technique presented in Ref. [1]. Dashedlines represent the simulation results. The experimental resultsshowed that there still remained residual air voids near the injec-tion gate: about 3% of air volume fraction which correspond to 0.92of degree of saturation. We can see that the degree of saturationhas been significantly increased with a reduced air vent pressure,even if the same pressure differential was employed, in Fig. 15b.
3.3. Simulation of complex geometry
In conventional mold filling simulations, the mold filling pat-tern is represented in terms of fill factor as defined in the volumeof fluid (VOF) method [29]. In this method, a sharp flow front di-vides an unfilled zone and a filled zone and the variation of fill fac-tor is confined to only a single mesh (element or control volume)distance. In practical mold filling processes, however, there existsa partially saturated zone covering a significant distance behindthe flow front. Hence, the degree of saturation is a better represen-
tation parameter to interpret mold filling patterns considering voidcontent. We presented mold filling simulation results of a halfbody of automotive front panel in two different ways (Fig. 16). Atsame instants, the mold filling pattern was represented in termsof fill factor (left figures), and in terms of degree of saturation (rightfigures). The mold filling pattern plots represented by degree ofsaturation showed the presence of partially saturated zone behindthe global flow front which could not be shown in the contour plotof fill factor.
Finally, to better show the void convection effect, the total voidcontent which was the sum of air volume fractions inside warp andweft tows and in channel zones, was plotted (Fig. 17). At an earlystage of mold filling process (Fig. 17a), voids were formed nearthe injection port. As the flow front advanced, however, the voidswere migrated along the resin flow and most of air voids were con-centrated in a narrow zone just behind the flow front, as reportedin the literature [28]. It was also observed in the simulation resultthat the length of this bubbly zone remained almost constantthrough the mold filling process.
4. Conclusions
We proposed the models on the formation, the compression andthe transport of voids in LCM processes. The present models were

(a) (b)
(c) (d)
(e) (f)
Dry fabric
Resin injection
Air vent
Fig. 17. Simulation results of total void content during the mold filling of automotive front panel. (a) t/tfill = 0.003. (b) t/tfill = 0.032. (c) t/tfill = 0.163. (d) t/tfill = 0.476. (e) t/tfill = 0.849. (f) t/tfill = 0.999. (For interpretation of the references to color in this figure legend, the reader is referred to the web version of this article.)
C.H. Park et al. / Composites: Part A 42 (2011) 658–668 667
integrated in the computer code for mold filling simulations. One-dimensional mold filling simulations were conducted and simula-tion results successfully represented some important features ofthe void physics: the correlation of void formations inside towsand between tows with modified capillary number, the influenceof vacuum application at the air vent on the tow saturation andbubble compression. The void migration was also modeled to rep-resent a partially saturated zone of high bubble content near theflow front. The simulation result was compared with the experi-mental data in terms of total sum of voids in the channel and inthe tows (warp and weft). The simulation code represents moldfilling patterns in terms of not only fill factor but also degree of sat-uration. The representation of a partially saturated zone suggestsneed for a bleeding process where residual air voids are sweptaway, while maintaining an injection pressure high and air ventsopen, even after the global resin front reaches air vents.
In the current work, we investigated the influence of the globalresin flow upon the void formation. However, it has been reportedthat the existence of voids may alter the global resin flow pattern:injection pressure drooping in the case of constant flow rate injec-tion and non-linear pressure profile in the partially saturated zone[30–32]. In future works, we will address these phenomena bymodeling unsaturated permeability in terms of void content andresin volume change caused by air void volume change.
Acknowledgements
This work has been performed in collaboration with SAFRAN/Aircelle under the research program of ‘‘RTM Structural’’. Theauthors also would like to acknowledge the financial support fromthe French Ministry of Economy, Finance and Industry.

668 C.H. Park et al. / Composites: Part A 42 (2011) 658–668
References
[1] Labat L, Grisel M, Bréard J, Bouquet G. Original use of electrical conductivity forvoid detection due to injection conditions of composite materials. CompRendus l’Acad Sci Sér IIb 2001;329:529–34.
[2] Hayward JS, Harris B. Effect of process variables on the quality of RTMmouldings. SAMPE J 1990;26(3):39–46.
[3] Hayward JS, Harris B. Effect of vacuum assistance in resin transfer moulding.Compos Manuf 1990;1(33):161–6.
[4] Lundstrom TS, Gebart BR, Lundemo CY. Void formation in RTM. In: The 49thannual conference, Composite Institute of the Society of the Plastics Industry;1992. Session 16-F.
[5] Patel N, Lee LJ. Effect of fiber mat architecture on void formation and removalin liquid composite molding. Polym Compos 1995;16(5):386–99.
[6] Patel N, Rohatgi V, Lee LJ. Modeling of void formation and removal in liquidcomposite molding, part II: model development. Polym Compos 1996;17(1):104–14.
[7] Chen YT, Davis HT, Macosko CW. Wetting of fiber mats for compositemanufacturing: I. Visualization experiments. AlChE J 1995;41(10):2261–73.
[8] Rohatgi V, Patel N, Lee LJ. Experimental investigation of flow inducedmicrovoids during impregnation of unidirectional stitched fiberglass mat.Polym Compos 1996;17(2):161–70.
[9] Patel N, Rohatgi V, Lee LJ. Micro scale flow behavior and void formationmechanism during impregnation through a unidirectional stitched fiberglassmat. Polym Eng Sci 1995;35(10):837–51.
[10] Parnas RS, Phelan Jr FR. The effect of heterogeneous porous media on moldfilling in resin transfer molding. SAMPE Quart 1991:53–60.
[11] Parnas RS, Phelan Jr FR. The effects of heterogeneities in resin transfer moldingpreforms on mold filling. In: The 36th international SAMPE symposium; 1991.p. 506–20.
[12] Chan AW, Morgan RJ. Modeling preform impregnation and void formation inresin transfer molding of unidirectional composites. SAMPE Quart 1992(April):48–52.
[13] Chan AW, Morgan RJ. Sequential multiple port injection for resin transfermolding of polymer composites. SAMPE Quart 1992(October):45–9.
[14] Chan AW, Morgan RJ. Tow impregnation during resin transfer molding of bi-directional nonwoven fabrics. Polym Compos 1993;14(4):335–40.
[15] Simacek P, Advani SG. A numerical model to predict fiber tow saturationduring liquid composite molding. Compos Sci Technol 2003;63:1725–36.
[16] Kuentzer N, Simacek P, Advani SG, Walsh S. Correlation of void distribution toVARTM manufacturing techniques. Composites Part A 2007;38:802–13.
[17] Gourichon B, Binetruy C, Krawczak P. Dynamic void content prediction duringradial injection in liquid composite molding. Composites Part A 2006;37:1961–9.
[18] Kang MK, Lee WI, Hahn HT. Formation of microvoids during resin-transfermolding process. Compos Sci Technol 2000;60:2427–734.
[19] Jinlian H, Yi L, Xueming S. Study on void formation in multi-layer wovenfabrics. Composites Part A 2004;35:595–603.
[20] Schell JSU, Delèglise M, Binétruy C, Krawczak P, Ermanni P. Numericalprediction and experimental characterization of meso-scale-voids in liquidcomposite moulding. Composites Part A 2007;38(12):2460–70.
[21] Gebart BR. Permeability of unidirectional reinforcements for RTM. J ComposMater 1992;26(8):1100–31.
[22] Ahn KJ, Seferis JC, Berg JC. Simultaneous measurements of permeability andcapillary pressure of thermosetting matrices in woven fabric reinforcements.Polym Compos 1991;12(3):146–52.
[23] Dimitrovova Z, Advani SG. Mesolevel analysis of the transition regionformation and evolution during the liquid composite molding process.Comput Struct 2004;82:1333–47.
[24] Lee DH, Lee WI, Kang MK. Analysis and minimization of void formation duringresin transfer molding process. Compos Sci Technol 2006;66(16):3281–9.
[25] Eun SW. Experimental study of the microvoids formation and transport in thevacuum assisted resin transfer molding process. Master thesis, Seoul NationalUniversity, Korea; 2002.
[26] Kang MK, Lee WI. A flow-front refinement technique for the numericalsimulation of the resin-transfer molding process. Compos Sci Technol1999;59:1663–74.
[27] Leclerc JS, Ruiz E. Porosity reduction using optimized flow velocity in resintransfer molding. Composites Part A 2008;39:1859–68.
[28] Lundstrom TS, Gebart BR. Influence from process parameters on voidformation in resin transfer molding. Polym Compos 1994;15(1):25–33.
[29] Hirt CW, Nichols BD. Volume of fluid (VOF) method for the dynamics of freeboundaries. J Comput Phys 1981;39:201–25.
[30] Bréard J, Henzel Y, Trochu F, Gauvin R. Analysis of dynamic flows throughporous media. Part I: comparison between saturated and unsaturated flows infibrous reinforcements. Polym Compos 2003;24(3):391–408.
[31] Bréard J, Saouab A, Bouquet G. Numerical simulation of void formation in LCM.Composite Part A 2003;34:517–23.
[32] Pillai KM. Modeling the unsaturated flow in liquid composite moldingprocesses: a review and some thoughts. J Compos Mater 2004;38(23):2097–118.
[33] Greszczuk LB. Effect of voids on strength properties of filamentary composites.In: Proceedings of 22nd annual meeting of the reinforced plastics, Division ofthe Society of the Plastics Industry; 1967. p. 20(A-1)–20(A-10).
[34] Hancox NL. The effects of flaws and voids on the shear properties of CFRP. JMater Sci 1977;12:884–92.
[35] Judd NCW, Wright WWW. Voids and their effects on the mechanicalproperties of composites – an appraisal. SAMPE J 1978;14:10–4.
[36] Yoshida HT, Ogasa T, Hayashi R. Statistical approach to the relationshipbetween ILSS and void content of CFRP. Compos Sci Technol 1986;25:3–18.
[37] Harper BD, Staab GH, Chen RS. A note on the effects of voids upon the hygraland mechanical properties of AS4/3502 graphite/epoxy. J Compos Mater1987;21:281–9.
[38] Tang JM, Lee WI, Springer GS. Effects of cure pressure on resin flow, voids, andmechanical properties. J Compos Mater 1987;21:421–40.
[39] Feldgoise S, Foley MF, Martin D, Bohan J. The effect of microvoid content oncomposite shear strength. In: 23rd international SAMPE technical conference;1991. p. 259–73.
[40] Bowles KJ, Frimpong S. Void effects on the interlaminar shear strength ofunidirectional graphite-fibre-reinforced composites. J Compos Mater1992;26(10):1487–509.
[41] Olivier P, Cottu JP, Ferret B. Effects of cure cycle pressure and voids on somemechanical properties of carbon/epoxy laminates. Composites 1995;26:509–15.
[42] Madsen B, Lilholt H. Physical and mechanical properties of unidirectional plantfibre composites – an evaluation of the influence of porosity. Compos SciTechnol 2003;63:1265–72.
[43] Huang H, Talreja R. Effect of void geometry on elastic properties ofunidirectional fiber reinforced composites. Compos Sci Technol 2005;62:1964–81.
[44] Liu L, Zhang BM, Wang DF, Wu ZJ. Effects of cure cycles on void content andmechanical properties of composite laminates. Compos Struct 2006;73(3):303–9.
[45] Lawrence JM, Neacsu V, Advani SG. Modeling the impact of capillary pressureand air entrapment on fiber tow saturation during resin infusion in LCM.Composites Part A 2009;40(8):1053–64.
![1 Examples 3D Electromagnetic Simulation Magnetic quasi-static simulation [coreless liquid-cooled motor]](https://img.pdfslide.us/doc/110x75/56649ed55503460f94be601c/1-examples-3d-electromagnetic-simulation-magnetic-quasi-static-simulation-coreless.jpg)


![Magnetic quasi-static simulation [coreless liquid-cooled motor]](https://img.pdfslide.us/doc/110x75/56816864550346895ddeb859/magnetic-quasi-static-simulation-coreless-liquid-cooled-motor.jpg)