Embed Size (px)
Citation preview

Lin, TFESC2015, August 2015 1 /18
Modeling and optimization of a multi-tubular solar receiver for solar-driven high
temperature electrolysis
Meng Lin1, Sophia Haussener1
1Laboratory of Renewable Energy Sciences and Engineering, Ecole Polytechnique Fédérale de Lausanne (EPFL),
Lausanne, Switzerland
Lin, TFESC2015, August 2015 2 /18
• Solar driven high-temperature co-/electrolysis
Motivation and Introduction
Receiver
PV
Electricity
Steam/CO2700-1000oC
Electrolyzer
H2/CO
H2O/CO2
Siemens
Eloenerji
~20%
~20%DLR Prototype
Radiative heat transfer
Flow boiling in tubes
Natural convection
Conduction
Solar energy
Concentration

Lin, TFESC2015, August 2015 3 /18
Motivation and IntroductionFlow boiling with complex physics:• Nucleating of bubbles• Bubbles growth and coalescence• Segregation of vapor and liquid phase• Evaporation of liquid in mist flow and
partial films
Heat transfer in receiver cavity:• Non-uniform distribution of
heat flux• Non-uniform temperature
distribution
1D separated model for two
phase flow
3D numerical model for
heat transfer inside the receiver cavity
Convergence(Temperature)
ResultsYes
No
1D
Hea
t flu
x p
rofil
e al
on
g th
e tu
be
Ray tracing
Solar flux at aperture
3D simulation difficult
3D simulation necessary
Thome, J. R. (2004). Engineering data book III. Wolverine Tube Inc.
1D model (single tube): Boiling flow inside tubes
3D model (multi-tube): Heat transfer inside the receiver
Conduction (insulation)
Conduction (tube wall)
Radiation Natural convection

Lin, TFESC2015, August 2015 4 /18
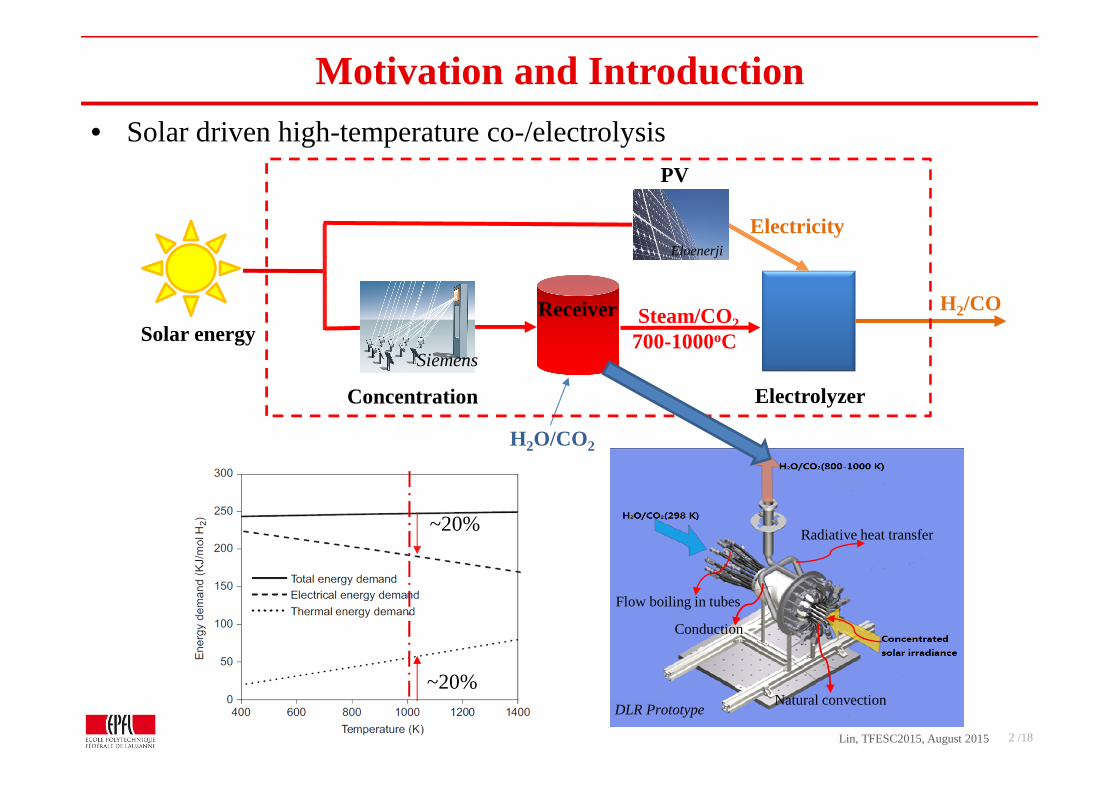
Model development (1D model for single tube)
1D model for two-phase flow in horizontal tube:
Escanes, F., Perez-Segarra, C. D., & Oliva, A. (1995). Numerical simulation of capillary-tube expansion devices. International Journal of Refrigeration, 18(2), 113-122.
Assumptions (in control volume):1. The velocity of liquid and gas are constant but not necessarily equal.2. Thermodynamic equilibrium between phases (temperature and pressure are equal).3. Empirical correlations are used to relate the frictional pressure drop and the void
fraction to the independent variables of the flow. 4. CO2 and H2O are considered well mixed.
Collier, J. G., & Thome, J. R. (1994). Convective boiling and condensation. Oxford university press.
Lin, TFESC2015, August 2015 5 /18
Model development (1D model for single tube)
i om m=ɺ ɺ
i o g,o g,o g,i g,i l,o l,o l,i l,i W( )
sin( )
p p A m v m v m v m v P z
mg
τθ
− = − + − + ∆
+
ɺ ɺ ɺ ɺ ɶ
W l,o l,i g,o g,o l,o ,i g,i l,i( ) ( ) ( )gq P z m e e m e e m e e∆ = − + − + −ɺ ɺ ɺ ɺ
Mass conservation:
Momentum equation :
Energy equation :
Conservation equations
2
W 28
fm
Aτ
ρ=ɺ
W W( )q T Tα= −ɺ
Empirical correlations
Escanes, F., Perez-Segarra, C. D., & Oliva, A. (1995). Numerical simulation of capillary-tube expansion devices. International Journal of Refrigeration, 18(2), 113-122.
l
l g g l(1 ) ( / )
x
x x v v
ρερ ρ
=+ −
10.25l g
0.5g g l l
1.18(1 x)( ( ))1(1 0.2(1 x))( )
gx x x
m
σ ρ ρε
ρ ρ ρ ρ
− − −−= + − + + ɺ
Rouhani et al. (1969)
2l frf f φ=
l 0.25
0.079
Ref =
2fr 0.045 0.0035
h l
3.42FHE
Fr Weφ = +
(Blasius equation )
Lin, TFESC2015, August 2015 6 /18
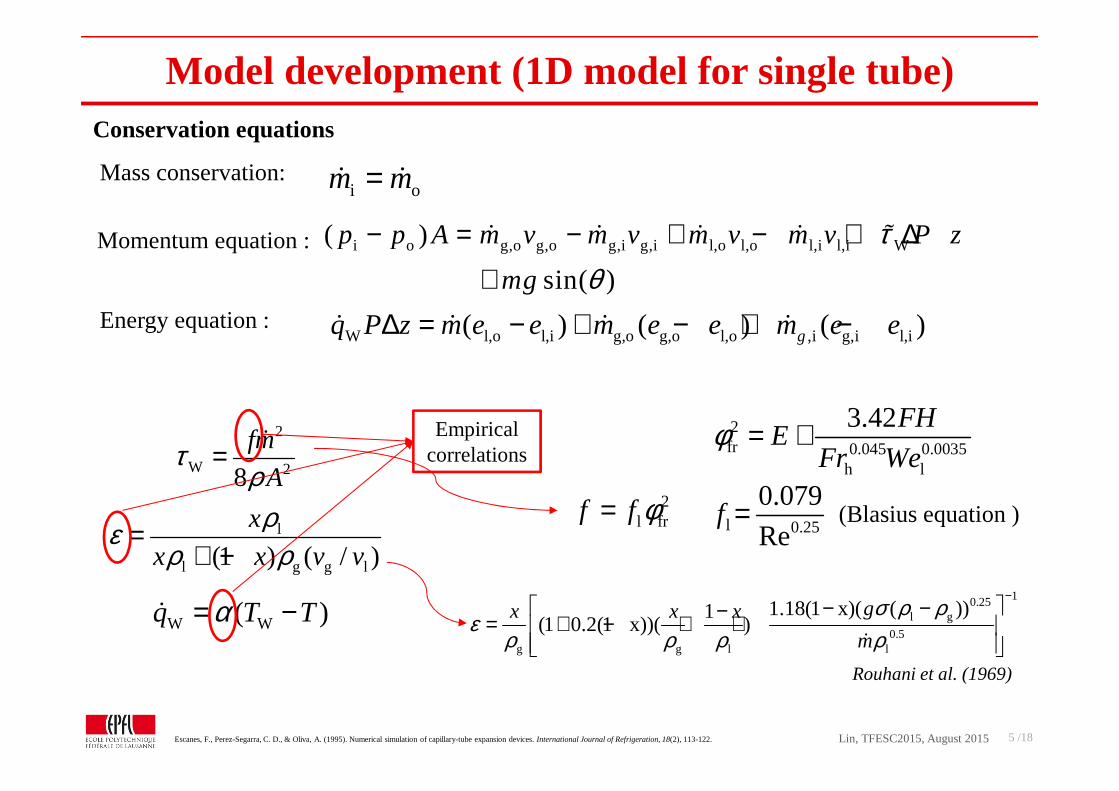
Flow pattern maps
Stratified
Stratified wavy
Intermittent Annular
Mist
Kattan-Thome-Favrat (KTF) flow pattern Map: Dry angles:
highdry strat
high low
m m
m mθ θ
−=
−ɺ ɺ
ɺ ɺ
AnnularIntermittent
Stratified wavy Stratified
xmax
high
low
Stratified flow
dry stratθ θ=
(x<xmax)
maxdry max max
max
(2 )1
x x
xθ π θ θ−= − +
−(x>xmax)
maxθ
Lin, TFESC2015, August 2015 7 /18
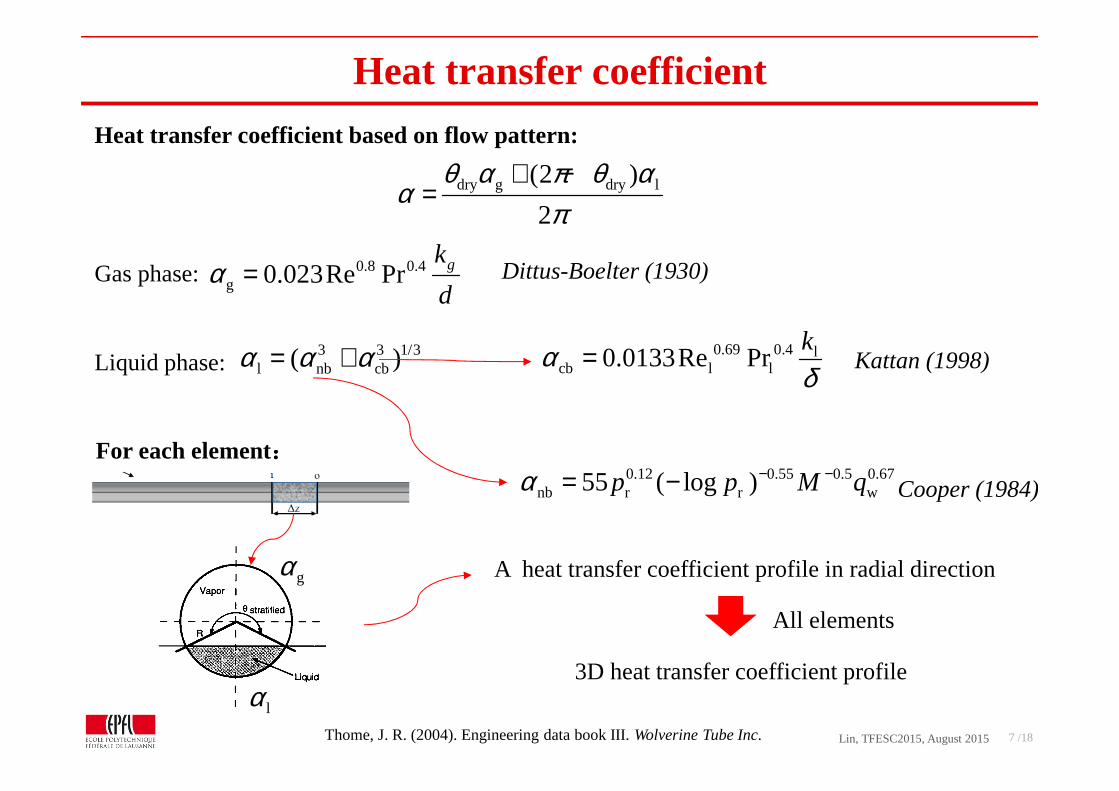
Heat transfer coefficient
0.8 0.4g 0.023Re Pr gk
dα =
dry g dry l(2 )
2
θ α π θ αα
π+ −
=
Dittus-Boelter (1930)
3 3 1/3l nb cb( )α α α= +
Thome, J. R. (2004). Engineering data book III. Wolverine Tube Inc.
Heat transfer coefficient based on flow pattern:
Gas phase:
Liquid phase:
0.12 0.55 0.5 0.67nb r r w55 ( log )p p M qα − −= −
0.69 0.4 lcb l l0.0133Re Pr
kαδ
=
For each element::::
gα
lα
A heat transfer coefficient profile in radial direction
3D heat transfer coefficient profile
All elements
Cooper (1984)
Kattan (1998)

Lin, TFESC2015, August 2015 8 /18
Example: Absorber tubeBoundary conditions:
1D model(Matlab code)
3D model(Fluent)
Outside wall: Concentrated solar power (typical distribution)
Inner wall: heat transfer coefficient and fluid temperature
Wall ends: Non-slip and adiabatic
Inlet condition: Temperature, flow rate, pressure
Tube wall: heat flux
Heat losses
Pressure outlet
4heat losses W nc W o0.8 (T T )q T hσ= + −ɺ
solarq C DNI= ×ɺ
21/6
128/279/16
0.3870.60 , 10
1 (0.559 / Pr)
RaNu Ra
= + ≤
+ Churchill and Chu (1975)Tube
0360
90
180
270
Lobon et al. (2014)

Lin, TFESC2015, August 2015 9 /18
Model validation Parameters ValueTube length 510 mInner radius 0.05 mOuter radius 0.07 m
Inlet temperature 478.15 KMass flow rate 0.47 kg/s
Direct normal isolation 822 W/m2
Optical efficiency 0.632Inlet pressure 3.43 MPa
Heat loss (liquid) 1278 W/m2
Heat loss (two phase) 1828 W/m2
Heat loss (vapor) 2323 W/m2
Lobón, D. H., Baglietto, E., Valenzuela, L., & Zarza, E. (2014). Modeling direct steam generation in solar collectors with multiphase CFD. Applied Energy, 113, 1338-1348.
0 100 200 300 400 500
460
470
480
490
500
510
520
530
540
550
560
570 Predicted data Experimental data
Tem
per
atu
re (
K)
Lenght (m)Length (m)
0 100 200 300 400 500
3.05x10⁶
3.10x10⁶
3.15x10⁶
3.20x10⁶
3.25x10⁶
3.30x10⁶
3.35x10⁶
3.40x10⁶
3.45x10⁶
Pre
ssu
re (
Pa)
Lenght (m)
Predicted data Experimental data
Length (m)

Lin, TFESC2015, August 201510 /18
Performance evaluation
• Solar thermal efficiency: heat losst
solar,receiver
1Q
Qη = −
ɺ
ɺ
• Maximum wall-fluid temperature difference :
• Mean heat transfer coefficient in two-phase flow region:
maxT∆
tph

Lin, TFESC2015, August 201511 /18
Baseline and reference case parameters
Simulation parameter Ref. Unit
Direct normal irradiance, DNI 1 kWm-2
Concentration 1000
Inlet pressure 15 bar
Mass flux 200 kgm-2s-1
Inner tube diameter 10 mm
Wall thickness 1 mm
Ambient temperature, T0 298.15 K
Target temperature 1000 K
PV efficiency, ηpv 15%
Solar field optical efficiency, ηop 50%

Lin, TFESC2015, August 201512 /18
4 6 8 10 12 14 16 18 200
1
2
3
4
5
6
7
8
Tube inner diameter (mm)
6 8 10 12 14 16 18 20
3.30
3.35
3.40
Inlet pressure (bar)
4 6 8 10 12 14 16 18 200.2
0.3
0.4
0.5
0.6
Tube inner diameter (mm)
20000
25000
30000
35000
40000
500
550
600
650
700
KW/m2K
6 8 10 12 14 16 18 200.2
0.3
0.4
0.5
0.6K
Inlet pressure (bar)
W/m2K
20000
25000
30000
35000
40000
550
600
650
700
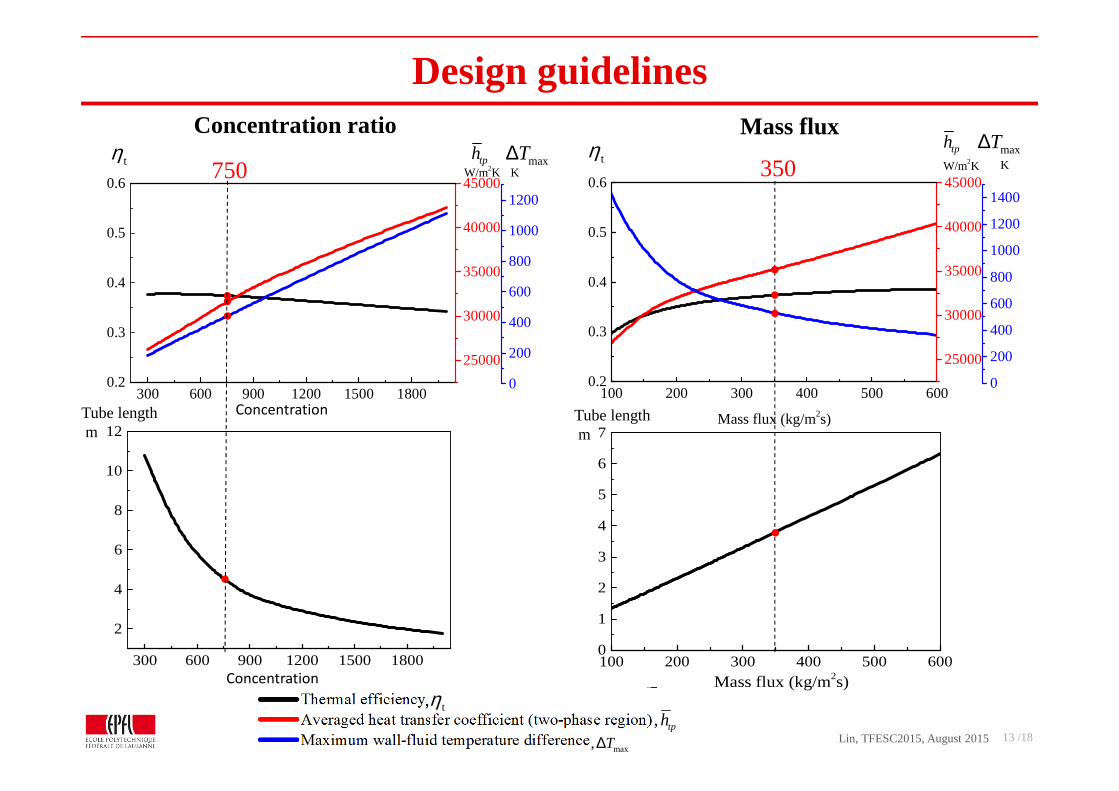
Design guidelinesInlet pressure Tube inner diameter
15bar 12mmtη maxT∆tphtη maxT∆tph
t,η, tph
max, T∆
Tube lengthm
Tube lengthm
Lin, TFESC2015, August 201513 /18
300 600 900 1200 1500 1800
2
4
6
8
10
12
Concentration ratio100 200 300 400 500 6000
1
2
3
4
5
6
7
Mass flux (kg/m2s)
100 200 300 400 500 6000.2
0.3
0.4
0.5
0.6
Mass flux (kg/m2s)
25000
30000
35000
40000
45000
0
200
400
600
800
1000
1200
1400
W/m2K K
300 600 900 1200 1500 18000.2
0.3
0.4
0.5
0.6
Concnetration ratio
25000
30000
35000
40000
45000
0
200
400
600
800
1000
1200
KW/m2K
Design guidelinesMass fluxConcentration ratio
750 350tη maxT∆tph tη maxT∆tph
t,η, tph
max, T∆
Tube lengthm
Tube lengthm
Concentration
Concentration

Lin, TFESC2015, August 201514 /18
0.0 0.2 0.4 0.6 0.8 1.00.2
0.3
0.4
0.5
0.6
Mass fraction of CO2
0
10000
20000
30000
40000
600
800
1000
1200
1400
1600K
W/m2K
tη maxT∆tph
Design guidelinesMass fraction of CO2
t,η, tph
max, T∆
0.0 0.2 0.4 0.6 0.8 1.00.0
0.5
1.0
1.5
2.0
2.5
3.0
3.5
Mass fraction of CO2
0.1
Tube lengthm

Lin, TFESC2015, August 201515 /18
Optimized design
Optimized Parameters Values
Inlet pressure 15bar
Tube inner diameter 12mm
Tube thickness 1mm
Concentration ration 750
Mass flux 350 kgm-2s-1
Target outlet temperature 1000K
Tube length 6.0225m
CO2 mass fraction 0
0 1 2 3 4 5 60
10000
20000
30000
40000
50000
60000 Heat transfer coefficient Pressure
Tube length (m)
He
at tr
ansf
er c
oeffi
cie
nt (
W/m2 K
)
1400000
1435000
1470000
1505000
Pre
ssur
e (P
a)
0 1 2 3 4 5 6
200
400
600
800
1000
1200
1400p=15bar,d=12mm,m=350kg/m2s,CR=750
Flu
id te
mpe
ratu
re (
K)
Tube length (m)
Fluid temperature Wall temperature
0.0 0.1 0.2 0.3 0.4 0.5 0.6 0.7 0.8 0.9 1.00
200
400
600
800
1000
1200
Vapor quality
Mas
s flu
x (k
g/m2 s)
Stratified Wavy
Mist
Intermittent andAnnular
Stratified
0.0 0.1 0.2 0.3 0.4 0.5 0.6 0.7 0.8 0.9 1.00
200
400
600
800
1000
1200
Vapor quality
Ma
ss fl
ux (
kg/m
2 s)
Intermittent andAnnular
Mist
Stratified Wavy
Stratified
t 38.8%η =
max 410.7KT∆ =234102.8W/m Ktph =
0.0 0.1 0.2 0.3 0.4 0.5 0.6 0.7 0.8 0.9 1.00
200
400
600
800
1000
1200
Mas
s flu
x (k
g/m2 s)
Vapor quality
Intermittent andAnnular
Mist
Stratified Wavy
Stratified

Lin, TFESC2015, August 201516 /18
Optimized design?
0 200 400 600 800 1000
0.39
0.40
0.41
0.42
DNI
Sol
ar th
erm
al e
ffic
ienc
y
400
600
800
1000
Out
let f
luid
tem
pera
ture
(K
)
• Efficiency variation with irradiance changes
heat losst
solar,receiver
1Q
Qη = −
ɺ
ɺ

Lin, TFESC2015, August 201517 /18
• Development of a novel general receiver model to predict performance of multi-tube receiver for concurrent steam and CO2 heating
• Model integrates:– 1D multi-phase single-tube model – detailed 3D multi-tube cavity model
• Various geometrical as well as operational conditions were investigated and optimized.
- Inlet pressure has minor effect on the efficiency.- Larger tube diameter leads to higher thermal efficiency but longer tube length and higher .
- Low concentration is preferred.- High mass flux leads to better efficiency.- Mix CO2 and H2O could enhance the thermal efficiency.
• Experiment will be conducted to modified the flow pattern under high flux with non-uniformity.
Summary and conclusion
maxT∆

Lin, TFESC2015, August 201518 /18
Acknowledgements
[email protected]@epfl.chhttp://lrese.epfl.ch
Thank you for your attention!
Questions?
The SOPHIA research project is funded by the Fuel Cell and Hydrogen Joint Under-taking (FCH JU) under the Grant Agreement Number 621173. The information contained in this work reflects the views of the authors only.
Chinese Scholarship Council
Moises Romero, DLRHans-Peter Streber, DLR


![Charge Transport in Two‐Photon Semiconducting …...Charge Transport in Two-Photon Semiconducting Structures for Solar Fuels Guohua Liu,[a, b] Kang Du, [a]Sophia Haussener,[c] and](https://img.pdfslide.us/doc/110x75/5e25a46ea7f05c4e297d332a/charge-transport-in-twoaphoton-semiconducting-charge-transport-in-two-photon.jpg)