Embed Size (px)
Citation preview

Available online at http://www.idealibrary.com ondoi:10.1006/bulm.1999.0166Bulletin of Mathematical Biology(2000)62, 501–525
A Chemotactic Model for the Advance and Retreat of thePrimitive Streak in Avian Development
K. J. PAINTER AND P. K. MAINI†
Centre for Mathematical Biology,Mathematical Institute,24–29 St Giles’,Oxford, OX1 3LB,U.K
H. G. OTHMERDepartment of Mathematics,University of Minnesota,Minneapolis, MN, 55407,U.S.A.
The formation of the primitive streak in early avian development marks the on-set of gastrulation, during which large scale cell movement leads to a trilaminarblastoderm comprising prospective endodermal, mesodermal and ectodermal tis-sue. During streak formation a specialized group of cells first moves anteriorly asa coherent column, beginning from the posterior end of the prospective anterior–posterior axis (a process calledprogression), and then reverses course and returnsto the most posterior point on the axis (a process calledregression). To date lit-tle is known concerning the mechanisms controlling either progression or regres-sion. Here we develop a model in which chemotaxis directs the cell movement andwhich is capable of reproducing the principal features connected with progressionand regression of the primitive streak. We show that this model exhibits a numberof experimentally-observed features of normal and abnormal streak development,and we propose a number of experimental tests which may serve to illuminate themechanisms. This paper represents the first attempt to model the global featuresof primitive streak formation, and provides an initial stage in the development of amore biologically-realistic discrete cell model that will allow for variation of prop-erties between cells and control over movement of individual cells.
c© 2000 Society for Mathematical Biology
1. INTRODUCTION
The chick embryo develops from a small, disk-shaped blastodisc floating ontop of the yolk. After fertilization cells divide repeatedly, forming a multicellu-lar stratified structure called the blastoderm. The period from just prior to laying
†Author to whom correspondence should be addressed. Current address: Department of Mathemat-ics, University of Minnesota, Minneapolis, MN.
0092-8240/00/030501 + 25 $35.00/0 c© 2000 Society for Mathematical Biology

502 K. J. Painteret al.
through several hours afterwards has been subdivided into 14 stages (Eyal-Giladiand Kochav, 1976; Khaner, 1993). Cell division is dominant during stages I–VI,and morphogenetic movements begin during stages VII–X, when cells of the cen-tral blastodisc, called thearea pellucida, separate from the yolk, producing a hol-low region beneath the disc called the subgerminal cavity (Penner and Brick, 1984;Stern, 1990). Subsequently, some cells from the central blastodisc move into thesubgerminal cavity (either actively or passively), and simultaneously the disc ex-pands radially over the yolk. The opaque marginal zone of the blastoderm, knownas thearea opaca, remains in contact with the yolk and may play an active rolein the radial movement. The result is that during stages VII–X the central part ofthe disc changes from a layer 4–6 cells deep to a translucent layer one cell thickcalled the epiblast. The anterior–posterior axis of the embryo is also determinedduring these stages (Khaner, 1993). After stage X some cells within the marginalzone migrate posteriorly, and then leave the marginal zone at the posterior marginalzone (PMZ). They spread across the subgerminal cavity beneath the epiblast as aloosely-connected sheet, incorporating islands of cells shed from the blastodiscearlier. By stage XIV this sheet connects with the anterior margin of the disc andforms the hypoblast, and at this stage the blastoderm is bi-layered with the epiblastand hypoblast separated by the blastocoel cavity. Fate maps for cell movements inthese stages are available (Hatada and Stern, 1994).
During hypoblast formation the embryonic shield or Koller’s sickle develops atthe posterior end of the epiblast. This consists of a thickened epiblast (Spratt,1942) comprising primitive streak precursor cells that have migrated to this areaby a series of ‘polonnaise movements’ (Vakaet, 1984). The first visible sign ofgastrulation is formation of the primitive streak, which arises from Koller’s sickleat the posterior midline of the blastodisc (Khaner, 1998). The sickle narrows andthe primitive streak moves anteriorly between the epiblast and the hypoblast. Thetip of the ingressing streak, called Hensen’s node, moves∼60% of the way acrossthe blastoderm before it stops, and later, regresses. The appearance of the blasto-derm at the maximal forward extension of the streak is shown in Fig.1. Duringadvance of the node epiblast cells move into the streak, and those that migratethrough the node form anterior structures, those that migrate through the lateralparts of the primitive streak become endodermal and mesodermal cells, and theremainder constitute the ectoderm. Simultaneously, thearea pellucidachangesfrom circular to pear shaped, narrowing in the posterior portion. The head struc-ture, notochord and somites are laid down during regression of the node, and whenregression is complete the embryo is a flat trilaminar blastoderm comprising theectodermal, mesodermal and endodermal layers. These will form various organsduring subsequent morphogenesis, in addition to the structures formed during re-gression. The regressing node and anterior portion of the streak eventually formthe tail bud (Spratt, 1947). Regression takes place on a slower time scale thanprogression, taking some 20 hours to regress from its maximum length of 1.9 mm(Spratt, 1947).

Model for Primitive Streak Formation 503
Hensen's nodePrimitive streak
Epiblast
Blastocoel
HypoblastEndoderm
Migrating cells(mesenchyme)
Figure 1. A schematic of the blastoderm at the time of maximal extension of the streak. Asdescribed in the text, epiblast cells move into the blastocoel through the primitive streak.From (Gilbert, 1991), with permission.
Although the sequence of events in early avian development is well documented,less is known about the mechanisms that give rise to primitive streak formation andmovement, and to date there are no models of these processes. We first focus on theformation and ingression of the primitive streak, as these processes are amenableto experimental manipulation. It is known that Koller’s sickle begins to form at theposterior marginal zone at stage X, and if cell movement in this area is blocked, noprimitive streak is formed (Spratt, 1966). The ability to promote primitive streakformation depends on position within the marginal zone and on the stage as follows(Khaner and Eyal-Giladi, 1986).
• At stage X only cells in the posterior marginal zone can form the primitivestreak; at stage XI the inner region in contact with the posterior marginalzone also has the potential to form a primitive streak, and at stage XII theposterior marginal zone has lost the ability to induce a primitive streak.• If a fragment of the posterior marginal zone is removed and replaced by lat-
eral marginal zone tissue at stage X, a single primitive streak always origi-nates in the normal position, but if the fragment of posterior marginal zone isreplaced by beads which prevent healing of the wound, two primitive streaksform (Khaner and Eyal-Giladi, 1989).• If donor posterior marginal zone tissue is inserted at 90◦ to the host posterior
marginal zone at stage X, a single primitive streak develops at the site of thehost posterior marginal zone. However, if the host posterior marginal zoneis removed two small primitive streaks develop, one at the normal site andone at the transplant site.
These experiments suggest that areas of the marginal zone lateral to the primi-tive streak can form a primitive streak if they are exposed to fragments of poste-rior marginal zone, but they are inhibited from doing so by neighboring posterior

504 K. J. Painteret al.
marginal zone. Thus cells in the posterior marginal zone are already differenti-ated from those in the marginal zone and the remainder of the blastoderm wheningression of the primitive streak begins. The experiments also raise the followingquestions.
• What initiates motion and guides the early migration of cells in the marginalzone toward the posterior marginal zone?
• What cues guide elongation and movement of the primitive streak? A sim-ple anterior–posterior gradient of a diffusible morphogen cannot be used forpositional information along that axis (Khaner and Eyal-Giladi, 1986), for ifit were the 90◦ transplants of the primitive streak would ingress toward theanterior pole rather than along a ray through the center of the disk.
• What mechanisms can account for the fact that the primitive streak maintainsits rod-like structure during ingression? Does the primitive streak ingress byconvergent extension (Keller et al., 1991), whereby cells intercalate at theposterior marginal zone and push the primitive streak forward? Are thereadhesive differences between cells in the primitive streak and those in thehypoblast and epiblast, or is the structure maintained by chemotactic attrac-tion between cells in the primitive streak?
Traditionally, the blastoderm has been considered homogeneous prior to streakformation, but recent findings suggests earlier cell diversity and significant cellmovement near the center of the disc (Shahet al., 1997). Canning and Stern (1988)identified a subpopulation of cells testing positive for the epitope HNK-1, whichis first expressed on the surface of cells of the posterior marginal zone and onthose which later form the primary hypoblast. Later it is found in the area of streakformation, distributed with a distinct anterior–posterior gradient. A primitive streakdoes not form when these cells are removed. This has led to the suggestion thatHNK-1 cells are the source of streak-derived tissue (Stern and Canning, 1990). Theprecise role of the epitope itself is not clear, but it may have a role in modulatingadhesion [seeStern (1991) and references therein].
Stimulated in part by the wealth of data unearthed in other model developmen-tal systems, many recent experiments have been directed at discovering the genesregulating development. A number of genes have a potential role in development,including members of the homeobox family (Lemaire and Kessel, 1997), thewntfamily (Hume and Dodd, 1993), and thecaudalgenes (Maromet al., 1997). Forexample, the homeobox genegoosecoidis first found in a small population ofcells corresponding to Koller’s sickle, (Izpisua-Belmonteet al., 1993). Later thisgene characterizes cells of the primitive streak, and expression is highest in cellsof Hensen’s node and the anterior portion of the streak. Labeling cells of Koller’ssickle prior to streak formation reveals that these are the cells subsequently found inanterior portions of the streak, indicating that cells of Koller’s sickle have the abil-ity to initiate a primitive streak. This hypothesis is supported by the development

Model for Primitive Streak Formation 505
of an ectopic primitive streak when grafted to lateral regions of a host blastoderm(Izpisua-Belmonteet al., 1993; Callebaut and Nueten, 1994).
The signals involved in streak formation, particularly the transforming growthfactors, have also been studied recently. Activin has been shown to induce devel-opment of axial structures (Mitrani and Shimoni, 1990; Ziv et al., 1992; Cooke,1998a), but it does not have the spatial and temporal distribution expected of aninducer. Another member of theTGFβ family, cVg1, expressed in the posteriormarginal zone of pre-primitive streak embryos has been shown to induce develop-ment of an ectopic primitive streak (Shahet al., 1997).
In summary, development of the streak involves intriguing spatio-temporal pat-terning properties, and many aspects are as yet poorly understood. Our purposehere is to develop a model for streak movement that can account for some of theprincipal experimental observations, and to suggest several experiments that canbe done to test the model. We do not claim to ‘explain’ streak ingression and re-gression, but rather we suggest possible mechanisms in the hope of stimulatingexperiments aimed at identifying the mechanism actually employed.
2. DEVELOPMENT OF THE M ODEL
Chemotaxis is a widely-used mechanism for directed cell movement and hasbeen extensively studied from both the experimental and theoretical perspectives(Armitage and Lackie, 1990; Alt et al., 1997). In some systems cells merely re-spond to the external signal without altering it, but in others, such asDictyosteliumdiscoideum, cells produce and destroy the signal, thereby altering the extracellularsignal and affecting cell movement either up (chemoattraction) or down (chemore-pulsion) the gradient. While it is not known that chemotaxis is involved in prim-itive streak formation, it provides a plausible mechanism for producing directedcell movement, and we incorporate it into the model developed here as a means ofproducing forward and reverse wave movement.
The model is described by the densityn(x, t) of a subpopulation of cells thatcomprise the primitive streak and which respond to a chemoattractant, whose den-sity is denotedu(x, t). The assumption that such a subpopulation of cells exists isreasonable in light of the evidence described earlier for variations in cell densityand the ability to initiate streak formation ectopically. The identification of cellmarkers, for example the epitope HNK-1, or the spatial distribution of cells ex-pressing specific genes, for examplegsc, also suggests that such a population mayexist.
The model is described by evolution equations for the cell densityn(x, t) andthe density of the attractantu(x, t). We allow for cell growth and division in theequation for the former, and for degradation of the attractant by cells in the equationfor the latter. We denote the underlying domain�, the growth rate of the cells byf1(n,u) and the net production of the attractant byf2(n,u). Later we describe

506 K. J. Painteret al.
how the attractant could be produced by all cells in the epiblast. The equations thatdescribe the model are
∂n
∂t= ∇ · [Dn∇n− nχ(u)∇u] + f1(n,u), (1)
∂u
∂t= Du∇
2u+ f2(n,u), (2)
whereDu andDn are constant diffusion coefficients andχ(u) represents the chemo-tactic sensitivity. A chemotatic response as incorporated in the first equation wasfirst derived byPatlak (1953), by considering a biased random walk model of cellmovement, and since then has been used in a similar form by many others (Kellerand Segel, 1970; Alt, 1980; Othmer and Stevens, 1997). For simplicity we here-after assume that the sensitivityχ0 is constant; more general models are describedin (Othmer and Stevens, 1997).
3. PROGRESSION AND REGRESSION IN ONE SPACE DIMENSION
To develop a qualitative understanding of the model behavior, we first consider aone-dimensional domain[0, L], which represents the posterior–anterior axis of thearea pellucida. We use initial conditions
n(x,0)=
{ni if x < xi
0 if x ≥ xi ,(3)
u(x,0)= ui , (4)
wherexi is a fixed point in(0, L). The first of these represents an initial aggregationof cells at the posterior marginal zone. We assume zero flux boundary conditionson both the cells and the attractant, and therefore
Dn∂n
∂x− nχ0
∂u
∂x=∂u
∂x= 0 on x = 0,1, (5)
which stipulates that cells do not leave thearea pellucidaand enter thearea opaca.This is certainly an oversimplification, since at later stages of regression Hensen’snode becomes intermixed with cells in the developing tail bud, but at present thereis little information on the details of this process.
We first suppose that there is no cell growth, which models a situation in whichcell movement takes place on a faster time scale than cell division. This may bea good approximation during progression, which occurs relatively quickly. Wetherefore takef1(n,u) = 0 and choose chemical kinetics
f2(n,u) = g(n)− βnu− δu (6)
Model for Primitive Streak Formation 507
00
0.5
n de
nsity
2 4
(a)
(c)
(b)
(d)
6 8 10
00
0.5
n de
nsity
2 4 6 8 10
00
0.2
0.1
2 4 6 8 10
00
0.06
0.04
0.02u co
nc.
u co
nc.
2 4 6 8 10
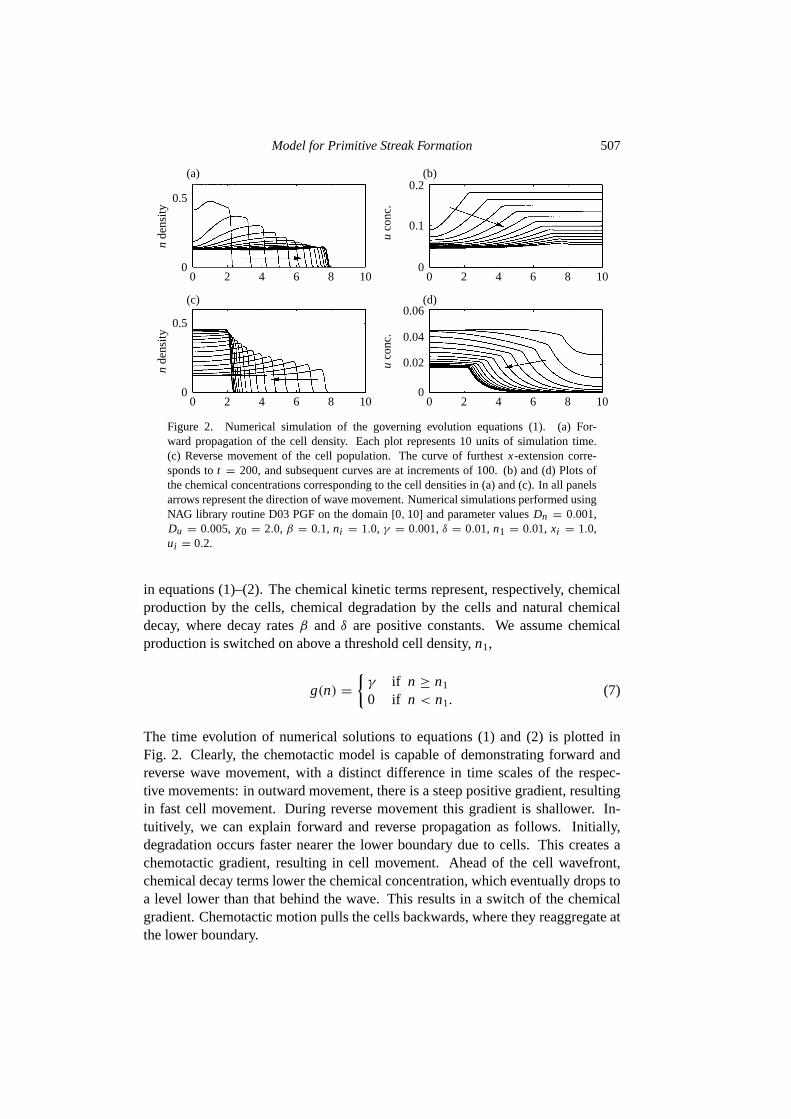
Figure 2. Numerical simulation of the governing evolution equations (1). (a) For-ward propagation of the cell density. Each plot represents 10 units of simulation time.(c) Reverse movement of the cell population. The curve of furthestx-extension corre-sponds tot = 200, and subsequent curves are at increments of 100. (b) and (d) Plots ofthe chemical concentrations corresponding to the cell densities in (a) and (c). In all panelsarrows represent the direction of wave movement. Numerical simulations performed usingNAG library routine D03 PGF on the domain[0,10] and parameter valuesDn = 0.001,Du = 0.005,χ0 = 2.0, β = 0.1, ni = 1.0, γ = 0.001,δ = 0.01, n1 = 0.01, xi = 1.0,ui = 0.2.
in equations (1)–(2). The chemical kinetic terms represent, respectively, chemicalproduction by the cells, chemical degradation by the cells and natural chemicaldecay, where decay ratesβ and δ are positive constants. We assume chemicalproduction is switched on above a threshold cell density,n1,
g(n) =
{γ if n ≥ n1
0 if n < n1.(7)
The time evolution of numerical solutions to equations (1) and (2) is plotted inFig. 2. Clearly, the chemotactic model is capable of demonstrating forward andreverse wave movement, with a distinct difference in time scales of the respec-tive movements: in outward movement, there is a steep positive gradient, resultingin fast cell movement. During reverse movement this gradient is shallower. In-tuitively, we can explain forward and reverse propagation as follows. Initially,degradation occurs faster nearer the lower boundary due to cells. This creates achemotactic gradient, resulting in cell movement. Ahead of the cell wavefront,chemical decay terms lower the chemical concentration, which eventually drops toa level lower than that behind the wave. This results in a switch of the chemicalgradient. Chemotactic motion pulls the cells backwards, where they reaggregate atthe lower boundary.

508 K. J. Painteret al.
The cell density initial conditions have been chosen as an idealization for the ag-gregation of cells occurring at the posterior region of the embryo prior to streak for-mation. From a biological standpoint, it is perhaps important to consider whethersmoother aggregates can give rise to the same generic movements. Numerical sim-ulations suggest that smoother initial conditions sharpen to demonstrate the samegeneric movements as shown in Fig.2. Realistic chemical diffusion coefficientsare much larger than cell diffusion coefficients. Numerical simulations demon-strate the same behavior for chemical diffusion coefficients increased by up to twoorders in magnitude.
3.0.1. Analysis of forward movement.To facilitate analysis of the model, wenon-dimensionalize it by choosing scales such thatξ = x/L , τ = δt, n = n/N0, u= u/u0, and we define
θ1 =Dn
δL2, θ2 =
χ0
δu0L2, θ3 =
Du
δL2.
This gives the following non-dimensional model:
∂n
∂τ= θ1
∂2n
∂ξ2− θ2
∂
∂ξ
(n∂u
∂ξ
), (8)
∂u
∂τ= θ3
∂2u
∂ξ2+ g(n)− βnu− u, (9)
whereβ andg(n) are appropriately scaled according to the non-dimensionalization.For the parameters of Fig.2, θ1 = 10−3, θ2 = 2.0, andθ3 = 5× 10⁻³. We chooseu0 = N0 = 1, and if we assume that∂2n/∂ξ2 is not too large, then the dominantpart of equation (8) is given by
∂n
∂τ∼ −θ2
∂
∂ξ
(n∂u
∂ξ
)= −θ2
[∂n
∂ξ
∂u
∂ξ+ n
∂2u
∂ξ2
]. (10)
Under the further assumption that either∂2u/∂ξ2 or n is small, the above equationis effectively hyperbolic with speed
θ2∂u
∂ξ. (11)
This quantity is not constant in time or space, and it shows that the wave reverseswhenever∂u/∂ξ changes sign. None the less, this wave speed provides a validapproximation during progression, as is shown in Fig.3, where this value is plottedagainst the numerically-determined wave speed.
We can also obtain an approximation for the time of forward propagation asfollows. If we assume that concentration gradients are negligible ahead of the

Model for Primitive Streak Formation 509
00
0.02
0.04
Wav
e sp
eed
0.06
0.08
0.1(a) (b)
50
Time
100 150 00
0.02
0.04
0.06
Wav
e sp
eed 0.08
0.1
0.12
50
Time
100 150
Figure 3. Comparison between the numerically-computed wave speed (cross) and expres-sion (11) (circle). We calculate the wave speed numerically by tracking the point for whichn = 0.05. Since the attractant gradient is a function of time, we use the maximum valueof uξ at each time instant in computing the speed. In panel (a)χ0 = 1.0, and in panel (b)χ0 = 1.5. Other parameters are as in Fig.2.
wavefront (as measured by the threshold densityn1), we find that sinceg(n) = 0ahead of the wave
u+(τ ) = ui exp(−τ), (12)
whereu+ is the attractant concentration ahead of the wave. Sufficiently far be-hind the wavefront we can neglect gradients of the attractant and assume that thereaction terms are in quasi-equilibrium. As a result, behind the wavefront we canwrite
u−(τ ) =γ
βn−(τ )+ 1, (13)
whereu−(τ ) and n−(τ ) are the attractant concentration and cell density, respec-tively, far behind the wave. The chemical gradient at the threshold density switchesat a timeτ ∗ such thatu+(τ ∗) = u−(τ ∗). Reverting to the dimensional scales wefind that the time is given by
T =1
δln
{ui (βn− + δ)
γ
}. (14)
This provides an approximation for the time of forward movement if we know thecell density behind the wave. For the parameters used in Fig.2 and the computedcell density behind the wave, which is 0.166, this estimate for the time of forwardpropagation isT = 167. In light of approximations necessary to obtain this, itcompares very favorably with the time ofT = 155 obtained from the simulation.The analytical expression predicts that increasing the decay rateδ or the productionrateγ of the attractant leads to a decrease in the period of forward propagation,whereas an increase in the density-dependent decay rateβ of the attractant or ofthe initial densityui leads to an increase in the period of forward propagation. We

510 K. J. Painteret al.
20 0 0
100
200
300
400
200
400
600
100200
300
Tim
e400500
(a) (b) (c)
1
log10 β log10 δ log10 γ
0 3 2 1 4 3 2
Figure 4. A comparison of the estimated reversal times (circles) and the numerically-computed times (crosses) for variations of the parametersβ, (a),δ, (b), andγ (c).
Table 1. Analytical upper and lower bounds and numerical determination of the time offorward propagation in the model, equations (1)–(2). ‘Normal’ refers to parameters usedin Fig. 1. Subsequent predictions made for the change of parameter indicated.
Parameter change Lower bound Upper bound Numerical
Normal 69 309 155β → β/2 69 248 95γ → γ /2 139 378 200ui → ui /2 0 240 96
have calculated this estimate for variations of these parameters and compared thepredicted time of reversal with that obtained from a solution of the full equations.The estimate is remarkably accurate for variations over orders of magnitude inδ
andγ , but only accurate for smallβ, as is shown in Fig.4. At largerβ, decayof the chemical in the presence of cells is fast, resulting in a sharp concentrationgradient. The result is a residue of cells trapped at the boundary which are unableto detect the gradient ahead of them. Thus, profiles do not satisfy the assumptionsmade in deriving the approximation. Furthermore, sinceni > n− > 0, we areable to obtain upper and lower bounds for this time. In Table1 we compare theseanalytical bounds with the numerically evaluated times for a variety of parameterchanges.
Forward movement takes place only when a positive chemical gradient developsinitially. This is interpreted by requiring the initial rate of chemical decay ahead ofthe wave to be lower than that behind the wave. Since ahead and behind the wavewe have, respectively,
∂u+
∂t= −δu and
∂u−
∂t= γ − βnu− δu, (15)
substitution of the initial conditions gives the following condition for forward prop-agation:
γ < βni ui . (16)

Model for Primitive Streak Formation 511
This condition shows that an initial attractant concentration greater than the valueat the homogeneous steady state is required for forward movement of the cells.
The non-dimensionalization further indicates the respective speeds of forwardand reverse propagation. The time taken for forward propagation isO(1) on thenon-dimensional scale. Similarly, as indicated by the speed of reverse movement,equation (11), the time taken for reverse propagation is alsoO(1). Conversion tothe dimensional scales yields, respectively,O(100) andO(1000). Both these timesare consistent with the numerics.
3.1. Inclusion of growth and division. We now consider whether similar move-ments can occur when cell growth and division are taken into account. A model ofthis type is more likely to be relevant for the modeling of developmental processes,where there is often considerable cell division. For example, prior to streak forma-tion, a high area of mitosis exists at the posterior marginal zone (Spratt, 1966). Wechoose cell kinetics of the form,
f1(n, c) = rh(u)n(1− n/n0)− δnn, (17)
wherein the first term represents cell mitosis and the second represent cell loss. Itis assumed that chemical regulation of cell mitosis takes the step function form†:
h(u) =
{1 if u ≥ u1
0 if u < u1.(18)
We take the same chemical kinetics as for the zero cell growth model, equation (6),but under the further simplificationβ = 0 (qualitatively, the same behavior isobserved withβ 6= 0). We can also setδn = 0 and in this case, a large ag-gregation of cells builds up at the wave front during reversal. We again assumezero flux boundary conditions and initial conditions as given by equations (3)–(4). The steady states for the above system are given by(0,0) and (n∗,u∗) =(n0 (1− δn/r ) , γ /δu), the latter provided thatγ /δu > u1 andn0 (1− δn/r ) > n1.For the remainder of this section we suppose both the steady states exist and setn0 = 1.0.
The solutions obtained by numerical solution of the equations are shown inFig. 5, where one sees that inclusion of cell growth and division still leads toprogression and regression. However, now forward propagation occursagainstthe chemotactic gradient, i.e., the mechanism that drives forward propagation has
†In the context of the present model it is necessary to postulate that cell division depends on the con-centration of the chemotactic substance, for without this the resulting equation is simply a Fisher-typeequation and this allows only uni-directional propagation. Certainly the reality is more complicatedthan this, but a similar conclusion could be reached from a model that involves more species and thatmore naturally entails bi-directional propagation, but our purpose here is simply to demonstrate thepersistence of bi-directional propagation in the presence of mitosis

512 K. J. Painteret al.
00
0.5
n de
nsity
1(c)
2 4 6 8 10
00
0.5n
dens
ity
1(a)
2 4 6 8 10
00
0.01
u co
nc. 0.02
(d)
2 4 6 8 10
00
0.1
u co
nc.
0.2(b)
2 4 6 8 10
Figure 5. (a) Forward propagation of cells, at time intervals of 5. (b) Correspondingplot for chemical concentrations. (c) Reverse propagation of cells, first plott = 50, andsubsequent plots at intervals of 50. (d) Corresponding chemical concentrations. Wavedirection is indicated by the arrows.Dn = 0.001, Du = 0.005, χ0 = 2.0, r = 4.0,n0 = 1.0, δn = 0.05, u1 = 0.0195,δu = 0.05,γ = 0.001,β = 0, n1 = 0.01, ni = 1.0,xi = 1.0, ui = 0.2.
changed, the attractant concentrations are everywhere above the thresholdu1 dur-ing forward propagation. In later stages, cell division is switched off and cells aredragged back along the domain.
The reaction–diffusion equation that describes the evolution of the cell density isa variant on the Fisher equation (Fisher, 1937), with the additional incorporation ofchemotactic motion. Subsequently, wave propagation occurs and cells spread out-wards across the domain. Due to the changing chemoattractant gradient, however,the wave speed changes during the forward movement. During reverse movement,however, evolution to a traveling-wave-type motion occurs.
3.1.1. Analysis of propagation in the presence of growth.We consider wavemotion in a reaction–diffusion model of the form,
∂w
∂t= Dw
∂2w
∂x2+ f (w), (19)
where f (w) is a ‘cubic type’ function with two stable steady-state solutions,w1
andw3. Conversion to the coordinatesz = x − ct and assuming traveling wavesolutions exist such thatw(x, t) = W(z), gives the ODE,
0= DwWzz+ cWz+ f (W). (20)
We set boundary conditions,W(∞) = w1, W(−∞) = w3 andWz(∞) = Wz(−∞)
= 0. Multiplication byWz and integrating with respect toz gives,
0=Dw
2[Wz]
∞
−∞+ c
∫∞
−∞
W2z dz+
∫ 0
1f (W)dW = 0. (21)

Model for Primitive Streak Formation 513
Under application of the boundary conditions, rearrangement yields
c =
∫ 10 f (W)dW∫∞
−∞W2
z dz. (22)
The denominator is always positive, and so the sign of the wave speed is determinedby the sign of the integral. More explicitly,
c > 0 if∫ 1
0f (W)dW > 0 and c < 0 if
∫ 1
0f (W)dW < 0.
In our model, both fixed points determined through a traveling wave analysis ofthe system can be shown to be hyperbolic. Consequently, we are unable to applytraditional techniques (Fisher, 1937) to determine a prediction for the minimumwave speed. However, by adopting an analysis similar to the simple system above,we demonstrate how an intuitive understanding for when reverse propagation oc-curs can be derived. We consider equation (2) describing chemical evolution withkinetics as in equation (6) andβ set to zero. Transforming to the traveling wave co-ordinates,y = x−at, and assuming solutionsu(x, t) = U (y) andn(x, t) = N(y)gives the ODE,
Dud2U
dy2+ a
dU
dy+ g(N)− δuU = 0. (23)
We multiply equation (23) by dUdy and integrate with respect toy between−∞ and
∞. Under the limits,dUdy (−∞) =
dUdy (∞) = 0, this gives:
a∫∞
−∞
(dU
dy
)2
dy+∫∞
−∞
(g(N)− δuU )dU
dydy= 0. (24)
Since∫∞
−∞
(dUdy
)2dy > 0 andU (−∞) = u∗, U (∞) = 0, we havea < 0 (reverse
moving waves) whenever∫ u∗
0(g(N)− δuU ) dU < 0. (25)
g(n) is defined by a simple step function. We defineUcrit to be the value ofU atthe pointy1 of the traveling wave coordinate system such thatN(y1) = n1. Thefunction g(N) − δuU is displayed graphically in the left of Fig.6. This demon-strates that forUcrit > u∗/2, the integral, (25), is negative and hence the wavespeed is negative. This represents reverse propagation. We plot cell and chemicalwave profiles for a specific point in time from the simulations of Fig.5 in the rightof Fig. 6. Validity of the above approach is demonstrated by variation of a modelparameter (we choosec1). As we decrease the value of this parameter the reversepropagating waves switch to forward propagating waves. Calculation ofUcrit indi-cates that the change of wave direction occurs as this value decreases belowu∗/2,see Table2.

514 K. J. Painteret al.
(a) (b)
20
0.2
0.4
0.6
0.8
1
3 4 5 6
Ucrit Ucrit
U*
2
Figure 6. (a) Graphical representation of the function determining sign of the wave speed.The direction of the wave is determined by the size of the shaded area. (b) Traveling waveprofiles for cell and chemical profiles. Chemical concentrations have been scaled by 25 forconvenience of representation. Profiles taken att = 250. Upper dashed line, line shownfor concentration ofUcrit, shown in comparison toU∗/2.
Table 2. Table demonstrating the bifurcation from reverse propagating to forward propa-gating waves during the secondary phase of model evolution asucrit passes belowu∗/2.
c1 ucrit Wave speed Wave direction
0.0125 0.0107 −0.0021 Negative0.012 0.0103 −0.0008 Negative0.01175 0.0100 0.0 Zero0.0115 0.0098 0.0006 Positive0.011 0.0094 0.0019 Positive
4. MOVEMENT OF THE STREAK IN A TWO-DIMENSIONAL DOMAIN
The results in one dimension suggest the chemotactic-cell model can replicatemovement patterns similar to those shown during progression and regression of thestreak. However, if we use the same initial conditions in two dimensions as in onedimension, the desired pattern of cell movement is not obtained. Simulations showthat for a uniform initial concentration and an initial cell density representing anaggregation of cells at the posterior marginal zone, cells spread out from the initialmass in a circular manner. Thus some modifications of the model are required toproduce movement of the cells towards the center of the domain while maintaininga rod structure.
However there is a simple modification of the initial attractant distribution thatproduces the desired motion. In the simulation results shown in Fig.7, the initialconditions are such that the chemoattractant has its highest concentration at thecenter of the domain (corresponding to the center of thearea pellucida) and de-creases to zero at the marginal zone. The simulations demonstrate that cells moveaway from their initial positions towards the center of the domain, forming a rod-like structure during this ‘progression’. As cells reach the center of the domain,a bulbous region of highest cell density develops at the most spatially (or ante-

Model for Primitive Streak Formation 515
(c) (f) (i)
(b) (e) (h)
(a)
t=0
t=30
t=60
t=10
0t=
200
t=40
0
t=70
0t=
1000
t=15
00
(d) (g)
Figure 7. Time sequence showing cell density for the model on a two-dimensional rect-angular domain. White represents high cell density, black represents a zero cell density.Simulations demonstrate cell movement across the domain to form a rod which extendsapproximately half the way across the domain (e). Subsequent development shows a pe-riod of reverse movement, which occurs on a slower time scale. Simulations performedwith an adapted ADI method with 101 by 101 mesh points. Parameters areDn = 0.001,Du = 0.01,χ0 = 1.0, β = 0.1, ni = 1.0, γ = 0.001,δ = 0.005,n1 = 0.01, xi = 1.0,ui = 0.2, and initial conditions as described in text (maximum initial chemical concentra-tion of 0.2).
riorly) extended part of the ‘streak’. At this time, progression has ceased, and aperiod of regression begins with cells moving in a posterior direction, where theyreaggregate at the domain boundary. A plausible mechanism for establishing thechemotactic gradient necessary for ingression is as follows. Suppose that all cellsin the blastoderm produce the attractant at a constant rate, and that the attractantis degraded by cells in the marginal zone: then the concentration of this specieswill be highest at the center of the disc, and primitive streak cells can follow thegradient toward the center.
4.1. Comparison with experimental data and model predictions.We have dem-onstrated above how a simple chemotactic-cell model can accurately convey theprinciple movements associated with progression and regression of the primitivestreak. More specifically, the cells move out to the center of the domain, result-ing in a long, thin, rod-like structure reminiscent of the primitive streak. The ac-

516 K. J. Painteret al.
0
0.1
0.2
0
0.1
0.2
0
0.1
0.2
0
0.1
0.2
P P
P P
A A
A A
(a) (b)
(c) (d)
Figure 8. Development of a nodal-like structure at the anterior portion of the developing‘streak’. The highest point of cell density moves from posterior to anterior, creating abulbous-type structure reminiscent of Hensen’s node. This structure is subsequently re-tained during regression.
tion of chemotaxis results in the majority of cells aggregating at the most anteriorpart of the ‘streak’ (see Fig.8), creating a bulbous-type structure reminiscent ofHensen’s node. The cell density patterns during this forward movement have astrong similarity with the results ofin situ hybridization experiments showing thespatio-temporal patterning sequence of cells expressinggscduring formation ofthe primitive streak (Izpisua-Belmonteet al., 1993). The time of progression inour ‘streak’ is fast with respect to the subsequent movements; cells shoot acrossthe domain as they climb the attractant gradient. This fast movement concurs withobservations on progression of the primitive streak on time lapse videos (Vakaet,1984; Stern, 1990).
During the second stage, cells return to the initial site, reminiscent of the move-ments during regression of the streak. Labeling of the cells of Hensen’s node itselfduring regression demonstrates that some cells leave the node to form notochord,whereas others remain a part of Hensen’s node. We compare the time course ofregression charted bySpratt (1947) with the time course in our model in Fig.6.Clearly, the slopes of the graph show close agreement, with the speed of regressionslowing as they approach the boundary.
4.1.1. Ectopic streak development.The ability of specific parts of the embryoto induce an ectopic primitive streak has been identified by a number of experi-

Model for Primitive Streak Formation 517
0 20 40 60 80 100 12010
20
30
40
50
Time
Forw
ard
exte
nt
Initi
al s
trea
k le
ngth
Not
ocho
rd le
ngth
Reg
ress
ion
of s
trea
k
Posterior border of area pellucida0.0 10.5 20.5hours
0.0
1.88
mm
Figure 9. Comparison of experimental data with model data showing spatial extent ofprimitive streak during regression. Numerical data demonstrate the same slowing in therate of regression as the streak shortens.
ments.Khaner and Eyal-Giladi (1989) have demonstrated that transplantation of aportion of the posterior marginal zone into the lateral marginal zone of a host em-bryo induces a second primitive streak to grow at 90 degrees to the host primitivestreak (growing from the posterior marginal zone). Similarly, this capability hasbeen demonstrated in grafts of cells of Koller’s sickle to lateral portions of a hostembryo (Izpisua-Belmonteet al., 1993; Callebaut and Nueten, 1994).
These results are replicated in the model simply by considering initial conditionsconsisting of two separate cell populations placed at angles representing the pos-terior marginal zone and lateral marginal zone. The presence of a chemoattractantwith maximum concentration at the center of the domain dictates that both pop-ulations move across the domain to the center of thearea pellucidaresulting inectopic axial structures, see Fig.10, top. In fact, we predict that progression of asecond streak should always take place towards the center of thearea pellucida,regardless of the initial position of the transplanted piece, Fig.10, middle.
The extent of progression is dependent on a variety of factors, for example theinitial conditions and model parameters. With respect to development of two ec-topic streaks, relatively small variation in factors can result in fusion at the mostspatially extended ends, Fig.10, bottom. Embryos show considerable variation infactors such as size and shape during early development, and we could thereforeexpect from the model that fusions would occur with a relatively high probabilityin experiments of the type described above. Indeed, when the region of the poste-rior marginal zone containing Koller’s sickle was grafted to an ectopic site, suchfusions were reported in 10 of 37 embryos where a secondary axis was found todevelop (Izpisua-Belmonteet al., 1993).
4.1.2. Transplants to central regions and removal of primitive streak cells.Wepredict that a transplantation to central regions of thearea pellucidawill not resultin the development of a recognizable ‘streak’, Fig.11, top. Instead, these cellssimply round up to form an aggregation that may itself migrate a little towards the

518 K. J. Painteret al.
Simulation initial conditions
Simulation initial conditions
Simulation initial conditions
Prediction
Prediction
Prediction
0.16 10.18
0.16
0.14
0.12
0.1
0.08
0.06
0.04
0.02
0
0.181
0.9
0.8
0.7
0.6
0.5
0.4
0.3
0.2
0.1
0
0.16
0.14
0.12
0.1
0.08
0.06
0.04
0.02
0
0.9
0.8
0.7
0.6
0.5
0.4
0.3
0.2
0.1
0
0.14
0.12
0.1
0.08
0.06
0.04
0.02
0
0.16
0.14
0.12
0.1
0.08
0.06
0.04
0.02
0
0.25 10.16
0.1
0.05
0
0.9
0.8
0.7
0.6
0.5
0.4
0.3
0.2
0.1
0
0.2
0.15
0.1
0.05
0
Figure 10. Demonstration of development of ectopic streaks in the two-dimensional model.When a second population of ‘able’ cells is placed at another point along the marginal zone(top, lateral; middle, anterior), an ectopic streak develops which moves towards the centerof the domain. Fairly small changes in model parameters can result in the fusing of thesestreaks at the anterior ends. In the bottom figures, this has been effected by increasing theconcentration gradient of the chemoattractant.

Model for Primitive Streak Formation 519
Simulation initial conditions Prediction
Simulation initial conditions Prediction
0.2
0.18
0.16
0.14
0.12
0.1
0.08
0.06
0.04
0.02
0
1
0.9
0.8
0.7
0.6
0.5
0.4
0.3
0.2
0.1
0 0
0.09
0.08
0.07
0.06
0.05
0.04
0.03
0.02
0.01
000
0.02
0.04
0.06
0.08
0.1
0.12
0.14
0.16
0.18
0.2
0.05
0.1
0.15
0.2
0.25
0.02
0.04
0.06
0.08
0.1
0.12
0.14
0.16
0.18
Figure 11. Model predictions of possible experiments. Top, transplantation of the ‘able’cells to central portions of thearea pelucidadoes not result in development of a streakof normal morphology. Bottom, removal of a large proportion of able cells still results indevelopment of a streak, albeit of a ‘sickly’ morphology.
center of the domain.We can also investigate the effect of the initial cell population on the morphology
of the streak that develops. Model simulations suggest that removal of a highproportion of streak marking cells (for example, a reduction of 75%) does notsignificantly effect the extent of streak progression, yet results in a ‘sickly’ streak,Fig. 11, bottom. These results suggest near normal axial structures can developdespite such severe disturbances.
4.1.3. Blockage of cell movement/attractant gradient experiments.The hy-pothesis of the center of the domain carrying the information required for correctprogression of the streak hints to experimental predictions. For example, a signifi-cant portion of the centralarea pellucidacan be removed, and the extent of streakdevelopment studied. This experiment is not unrealistic, (Schoenwolf, personalcommunication)—portions up to one-fifth of thearea pellucidacan be removedwithout excessive damage to the embryo. To avoid healing, the space can be filledwith beads. These experiments can easily be performed in the model, and wepresent the results below.
Figure12(a) demonstrates the result of removing a portion laterally to the centralpoint along the anterior–posterior axis. Subsequent development shows a prim-itive streak which moves towards the center of the posterior before undergoingslight deviation. When the portion removed is in the anterior half of thearea
520 K. J. Painteret al.
(a) (b) (c) (d)
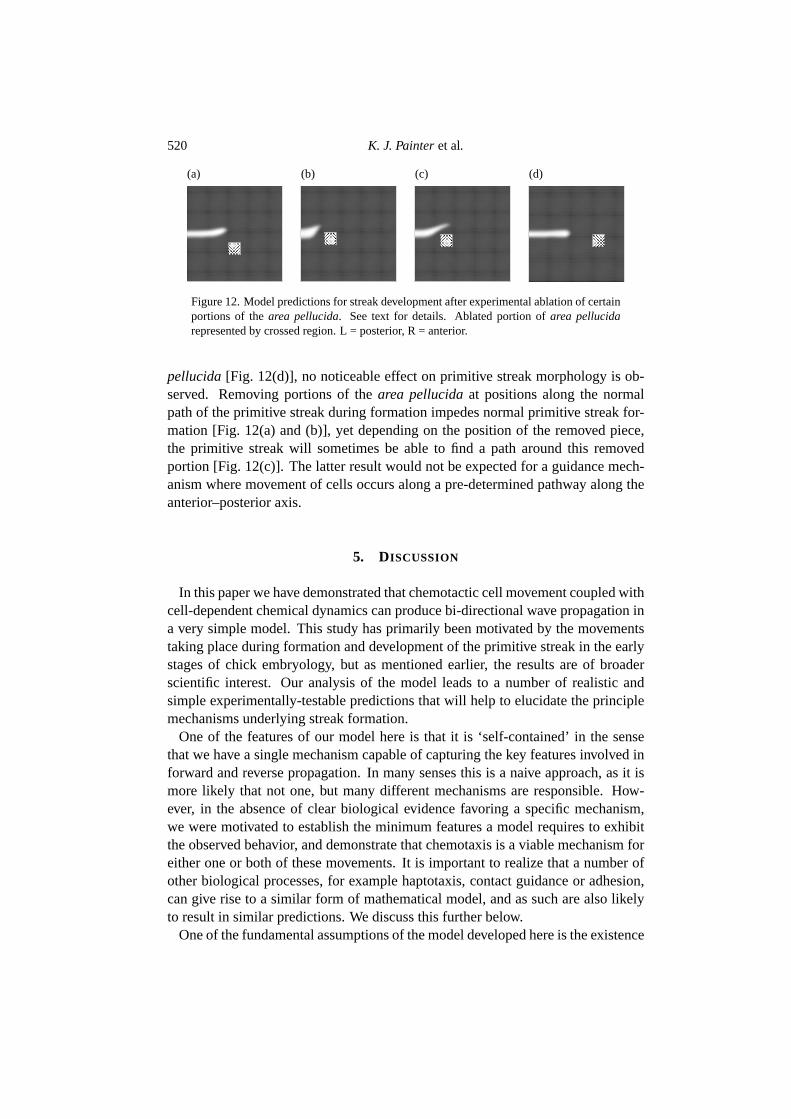
Figure 12. Model predictions for streak development after experimental ablation of certainportions of thearea pellucida. See text for details. Ablated portion ofarea pellucidarepresented by crossed region. L = posterior, R = anterior.
pellucida[Fig. 12(d)], no noticeable effect on primitive streak morphology is ob-served. Removing portions of thearea pellucidaat positions along the normalpath of the primitive streak during formation impedes normal primitive streak for-mation [Fig.12(a) and (b)], yet depending on the position of the removed piece,the primitive streak will sometimes be able to find a path around this removedportion [Fig.12(c)]. The latter result would not be expected for a guidance mech-anism where movement of cells occurs along a pre-determined pathway along theanterior–posterior axis.
5. DISCUSSION
In this paper we have demonstrated that chemotactic cell movement coupled withcell-dependent chemical dynamics can produce bi-directional wave propagation ina very simple model. This study has primarily been motivated by the movementstaking place during formation and development of the primitive streak in the earlystages of chick embryology, but as mentioned earlier, the results are of broaderscientific interest. Our analysis of the model leads to a number of realistic andsimple experimentally-testable predictions that will help to elucidate the principlemechanisms underlying streak formation.
One of the features of our model here is that it is ‘self-contained’ in the sensethat we have a single mechanism capable of capturing the key features involved inforward and reverse propagation. In many senses this is a naive approach, as it ismore likely that not one, but many different mechanisms are responsible. How-ever, in the absence of clear biological evidence favoring a specific mechanism,we were motivated to establish the minimum features a model requires to exhibitthe observed behavior, and demonstrate that chemotaxis is a viable mechanism foreither one or both of these movements. It is important to realize that a number ofother biological processes, for example haptotaxis, contact guidance or adhesion,can give rise to a similar form of mathematical model, and as such are also likelyto result in similar predictions. We discuss this further below.
One of the fundamental assumptions of the model developed here is the existence

Model for Primitive Streak Formation 521
of a chemoattractant, with high concentration at the center of the domain, resultingin the outward propagation of the streak. Initial conditions of this form can easilybe generated within a biological framework. Two such mechanisms are as follows:firstly, we could consider degradation of the chemical by cells of thearea opacatobe stronger, such that the attractant concentration is effectively held at zero withinthis region. Secondly, we may hypothesis a subpopulation of cells in the centerof the domain which produce the attractant prior to streak formation. The formerpossibility is particularly attractive when one considers the many differences in cellmorphology between the two regions. The latter is also not improbable when oneconsiders that it is the cells of the centralarea pellucidawhich form the primaryhypoblast (Canning and Stern, 1988).
An obvious criticism concerning the two-dimensional results earlier with respectto the cell movements during formation of the streak concerns the extent of forwardprogression. The model here predicts the development of a primitive streak whichextends to approximately the center of the domain, yet common textbook knowl-edge states that at definitive primitive streak, (stage 4, Hamburger and Hamilton)the streak has extended over approximately two-thirds of the blastoderm. A simpleexplanation for this anomaly can be provided by considering the blastoderm shapeand size changes which occur during progression of the streak. Prior to streak for-mation, thearea pellucidais circular in outline, yet as the streak progresses acrossthe blastoderm, this changes to a pear-like shape, with the narrowing in the pos-terior half. It is therefore not unreasonable to suppose that the primitive streakextends to a point on the domain which was the approximate center of the blasto-derm prior to the shape changes, and that the two-thirds extension is the result ofsubsequent blastoderm shape changes. Examination of the various stages of primi-tive streak development provides support for this hypothesis. For example, at stage3+, the primitive streak has extended to approximately the center of the still circu-lar AP. Subsequent stages, however, involve transformation to a pear-shapedareapellucida. Early carbon marking experiments performed bySpratt (1946) inves-tigated the movement of cells involved in primitive streak formation. His resultsindicate that the majority of elongation of the streak at the equivalent of a stage3+ blastoderm occurs at the posterior end, and that this growth correlates with therate ofarea pellucidaextension. Furthermore, cells marked at the anterior end ofthe streak at this stage (which is at approximately the center of the blastoderm)undergo little forward movement during the latter stages of streak progression: themajority of streak extension occurs in the lengthening posterior portion of the blas-toderm. A further test for this hypothesis would be to mark cells across the midlinebetween anterior and posterior sections of the blastoderm prior to streak formationand examine subsequent cell movements.
Early development of the embryo is a very complicated procedure and as yet lit-tle is understood of the mechanisms regulating development. Clearly many mech-anisms are involved, and as yet we are a long way from a complete model of earlydevelopment. The model presented here has, for example, ignored questions with

522 K. J. Painteret al.
respect to earlier cell diversity, development of the hypoblast, the potential of theposterior marginal zone to induce axial structures and its inhibition of other re-gions, the migration of cells to the streak during induction and subsequent devel-opment of structures such as the notochord, head process and paraxial mesoderm.It is likely that these processes require many processes which may be highly in-terconnected. Thus, while demonstrating some generic patterns with respect toprimitive streak formation and providing a number of experimental predictions,this model is clearly an over simplification of these stages.
Future improvements could include the extension to a more realistic domain, andthe examination of the extent to which cell movements occurring during primitivestreak formation account for the general shape changes associated with gastrula-tion. At the point of egg laying, it is estimated that the blastoderm is composedof approximately 50 000–60 000 cells (Spratt, 1966). From these numbers, we canestimate thearea pellucidais itself composed of approximately 10 000 cells. Ourcurrent work involves the development of a discrete cell model in which cell move-ment and other mechanical factors such as cell adhesion are taken into account. Inaddition to providing a more realistic model of the early embryo where the ex-tensive cell movements are taken into account, this model will allow us to test anumber of different mechanisms that have been proposed to account for primitivestreak formation such as the convergent-extension idea proposed bySchoenwolf(1991), or whether regression of the primitive streak can be achieved simply by a‘pushing’ resulting from cells migrating through Hensen’s node to form notochordand other axial structures.
In recent years, investigation of the mechanisms controlling global pattern forma-tion has been replaced with the search of explanations for local development, withthe hope that the global aspects will accordingly be revealed (Cooke, 1998b). Theexpression ofc-hairy1, the avian homolog of theDrosophilasegmentation genehairy, however, now forces a new search for the mechanism controlling global pat-tern formation. The expression indicates a remarkable spatio-temporal sequenceand implicates a clear connection with marking the sites of prospective somites.Briefly, as the primitive streak regresses, cells migrate through it to lay down thepresomitic mesoderm (PSM), composed of two strips of tissue lying either sideof the notochord. Somite pairs form from the PSM, subsequent pairs forming atregular intervals of approximately 90 minutes in an anterior–posterior direction.Expression ofc-hairy1in cells of the PSM occurs in a cyclic fashion, with a periodof 90 minutes. The resultant global behavior shows an initially broad wave of geneexpression at the posterior end of the PSM, which narrows as it moves anteriorlyto the thickness of a half somite at the anterior end of the PSM. This band of ex-pression remains, and marks the posterior boundary of the presumptive somite. Aparticularly significant aspect concerning this expression is the widespread, globalcell signaling that it indicates and raises the question of how these features are ini-tiated (Cooke, 1998b). The wave of expression initiates from a posterior direction,and thus indicates that the primitive streak may not only have a role in gastrulation

Model for Primitive Streak Formation 523
and the setting of the embryonic axis, but also a role in organizing subsequent de-velopment. For example, the act of migration through the primitive streak may actin a manner to reset the internal cellular clock driving the oscillations.
ACKNOWLEDGEMENTS
K. J. Painter was supported by an EPSRC earmarked studentship in MathematicalBiology and by grant GM29123 from the National Institute of Health. G. Othmerwas supported in part by grant GM29123 from the National Institute of Health.
REFERENCES
Alt, W. (1980). Biased random walk models for chemotaxis and related diffusion approxi-mations.J. Math. Biol.9, 147–177.
Alt, W., A. Deutsch and G. Dunn (1997). inDynamics of Cell and Tissue Motion,Birkhauser.
Armitage, J. P. and J. M. Lackie (1990). inBiology of the Chemotactic Response, Cam-bridge: Cambridge University Press.
Callebaut, M. and E. V. Nueten (1994). Rauber’s (Koller’s) sickle: the early gastrulationorganizer of the avian blastoderm.Eur. J. Morph.32, 35–48.
Canning, D. R. and C. D. Stern (1988). Changes in the expression of the carbohydrateepitope HNK-1 associated with mesoderm induction in the chick embryo.Development104, 643–655.
Cooke, J. (1998a). A gene that resuscitates a theory—somitogenesis and a molecularoscillator.Trends Gen. (Personal edition)14, 85–88.
Cooke, J. (1998b). A gene that resuscitates a theory—somitogenesis and a molecular os-cillator. Trends. Gen.14, 85–88.
Eyal-Giladi, H. and S. Kochav (1976). From cleavage to primitive streak formation: acomplementary normal table and a new look at the first stages of the development of thechick. I General morphology.Dev. Biol.49, 321–337.
Fisher, R. A. (1937). The wave of advance of advantageous genes.Ann. Eugenics7, 353–369.
Gilbert, S. (1991).Developmental Biology, 3rd edn, Sunderland, MA: Sinauer Assoc., Inc.Hatada, Y. and C. D. Stern (1994). A fate map of the epiblast of the early chick embryo.
Development120, 2879–2889.Hume, C. R. and J. Dodd (1993).Cwnt-8C: a novel Wnt gene with a potential role in prim-
itive streak formation and hindbrain organization.Development119, 1147–1160.Izpisua-Belmonte, J. E., E. D. Robertis, K. Storey and C. D. Stern (1993). The homeobox
gene goosecoid and the origin of organizer cells in the early chick blastoderm.Cell 74,645–659.
Keller, E. F. and L. A. Segel (1970). Initiation of slime mold aggregation viewed as aninstability.J. Theor. Biol.26, 399–415.

524 K. J. Painteret al.
Keller, R., J. Shih and P. Wilson (1991). Cell motility, control, and function of convergenceand extension during gastrulation inXenopus, in Gastrulation: Movements, Patterns,and Molecules, W. Keller, R. Clark and F. Griffen (Eds), New York, USA; London, UK:Plenum Press.
Khaner, O. (1993). Axis determination in the avian embryo.Curr. Topics Dev. Biol.28,155–180.
Khaner, O. (1998). The ability to initiate an axis in the avian blastula is concentrated mainlyat a posterior site.Dev. Biol.194, 257–266.
Khaner, O. and H. Eyal-Giladi (1986). The embryo-forming potency of the posteriormarginal zone in stage X through XII of the chick.Dev. Biol.115, 275–281.
Khaner, O. and H. Eyal-Giladi (1989). The chick’s marginal zone and primitive streakformation. I. Coordinative effect of induction and inhibition.Dev. Biol.134, 206–214.
Lemaire, L. and M. Kessel (1997). Gastrulation and homeobox genes in chick embryos.Mech. Dev.67, 3–16.
Marom, K., E. Shapira and A. Fainsod (1997). The chickencaudal genes establishan anterior–posterior gradient by partially overlapping temporal and spatial patterns ofexpression.Mech. Dev.64, 41–52.
Mitrani, E. and Y. Shimoni (1990). Induction by soluble factors of organized axial struc-tures in chick epiblasts.Science247, 1092–1094.
Othmer, H. G. and A. Stevens (1997). Aggregation, blowup and collapse: the ABC’s ofgeneralized taxis in reinforced random walks.SIAM J. Appl. Math.57, 1044–1081.
Patlak, C. S. (1953). Random walk with persistence and external bias.Bull. Math. Biophys.15, 311–338.
Penner, P. I. and I. Brick (1984). Acetylcholinesterase and polyingression in the epiblastof the primitive streak chick embryo.Roux’s Arch. Dev. Biol.193, 234–241.
Schoenwolf, G. C. (1991).Gastrulation, Chap. Cell movements in the epiblast during gas-trulation and neurulation in avian embryos, New York: Plenum Press, pp. 1–27.
Shah, S. B., I. Skromme, C. R. Hume, D. S. Kessler, K. J. Lee, C. D. Stern and J. Dodd(1997). Misexpression of chick Vg1 in the marginal zone induces primitive streak for-mation.Development124, 5127–5138.
Spratt, N. T. (1942). Location of organ-specific regions and their relationship to the devel-opment of the primitive streak in the early chick blastoderm.J. Exp. Zool.89, 69–101.
Spratt, N. T. (1946). Formation of the primitive streak in the explanted chick blastodermmarked with carbon particles.J. Exp. Zool.103, 259–304.
Spratt, N. T. (1947). Regression and shortening of the primitive streak in the explantedchick blastoderm.J. Exp. Zool.104, 69–100.
Spratt, N. T. (1966). Some problems and principles of development.Am. Zool.6, 215–254.Stern, C. D. (1990). The marginal zone and its contribution to the hypoblast and primitive
streak of the chick embryo.Development109, 667–682.Stern, C. D. (1991).Gastrulation: Movements, Patterns, and Molecules, Chap. Mesodorm
formation in the chick embryo revisited, New York: Plenum, pp. 29–41.Stern, C. D. and D. R. Canning (1990). Origin of cells giving rise to mesoderm and endo-
derm in the chick embryo.Nature343, 273–275.

Model for Primitive Streak Formation 525
Vakaet, L. (1984). Early development of birds, inChimeras in Developmental Biology, N.Le Douarin and A. Mclaren (Eds), London: Academic Press.
Ziv, T., Y. Shimoni and E. Mitrani (1992). Activin can generate ectopic axial structures inchick blastoderm explants.Development115, 689–694.
Received 5 July 1999 and accepted 29 November 1999