Embed Size (px)
DESCRIPTION
PLAN. DO. ACT. STUDY. Model for Improvement. What are we trying to accomplish?. AIM. What can we change that will result in an improvement?. How will we know that a change is an improvement ?. CHANGE. MEASUREMENT. PDSA –testing a change. MARU. From YouTube. - PowerPoint PPT Presentation
Citation preview

Model for Improvement
What can we change that will
result in an improvement?
PLAN
DO
STUDY
ACT
How will we know that a
change is an improvement?
What are we trying to accomplish? AIM
MEASUREMENTCHANGE

PDSA –testing a change
MARUWhat is Maru trying to achieve?How many ideas does he try?Is he successful?What was the possible negative outcome?
From YouTube
Rapid Cycle Change
What can we change that will result in an improvement?
PLAN
DO
STUDY
ACT
How will we know that a change is an improvement?
What are we trying to accomplish?
PLAN
DO
STUDY
ACT
PLAN
DO
STUDY
ACT
PLAN
DO
STUDY
ACT

AIM of this change: PROBLEM :
AIM of this change:
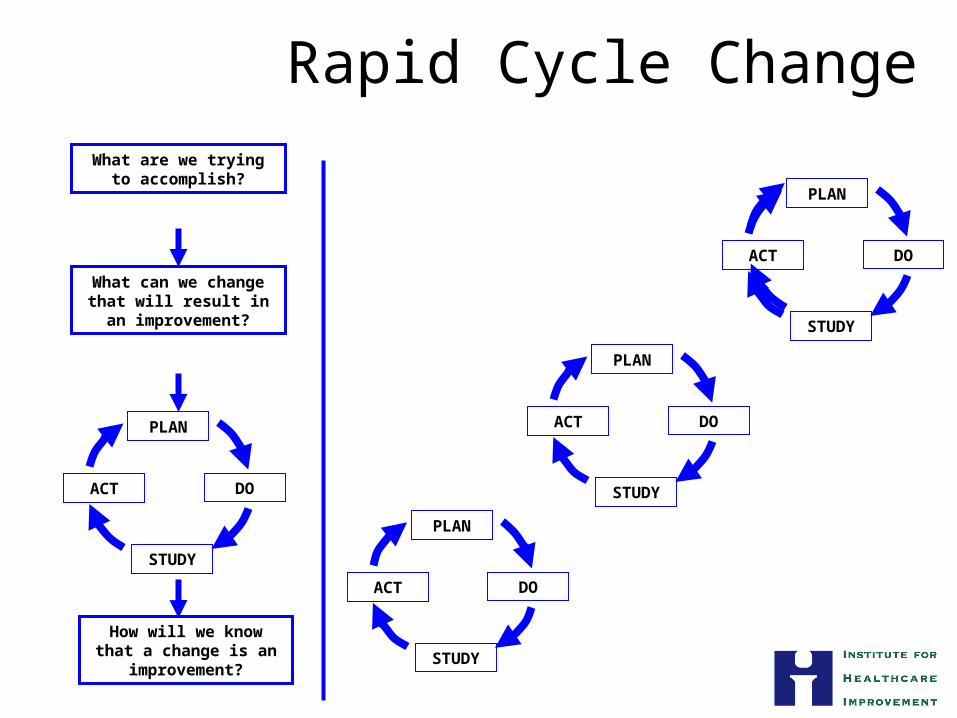
Do a PDSA to solve a problem at home

AIM: unpack the dishwasher in a more efficient way
PROBLEM : unpacking the dishwasher is inefficient
Put half the cups and half the glasses in the cupboard just above the dishwasher
How easy it is to unpack the dishwasher
- Tom to rearrange cupboard today
- -Mary and Tom to unpack into one cupboard for 4 days
Mary – it will look horrible and I will hate itTom – it will be easy and Mary will like it


Model for Improvement
What can we change that will
result in an improvement?
PLAN
DO
STUDY
ACT
How will we know that a
change is an improvement?
What are we trying to accomplish? AIM
MEASUREMENTCHANGE

Measurement
Are we getting closer to our target?
Outcome measure

Measurement
Did we use the whole bundlein every patient every time?
Process measure (Bundle compliance)
Measurement
Was the change an improvement?
Measuring the impact of a change

Measuring over time
• a volunteer to write
• a volunteer to measure
• graph paper

Annotated Run Chart
Community Need
I
Jan Feb Mar Apr May Jun Jul Aug Sep Oct Nov Dec0
20
40
60
80
100
120
# pregnant women HIV tested at 1st ANC Visit
Change Made in June

Interpreting Data: what is the story?
Mar Sep0
20
40
60
80
100
120
# pregnant women HIV tested at 1st ANC Visit
IBefore (Feb) After (Aug)

What is the real story?
Mar Sep0
25
50
75
100
125
# pregnant women HIV tested at 1st ANC Visit
Jan Feb Mar AprMayJun Jul AugSep Oct NovDec0
25
50
75
100
125
# pregnant women HIV tested at 1st ANC Visit
Jan
Feb Mar Apr
May Ju
n Jul
Aug Sep OctNov Dec
0255075
100125
# pregnant women HIV tested at 1st ANC Visit
JanFebMar AprMayJun Jul AugSepOct NovDec0
25
50
75
100
125
# pregnant women HIV tested at 1st ANC Visit
Jan FebMar AprMayJun Jul AugSepOct NovDec0
25
50
75
100
125
# pregnant women HIV tested at 1st ANC Visit
Change Made
Change Made
Change Made
Change Made in June
Feb Aug
Feb AugFeb Aug
Feb Aug Feb Aug
I
Change Made

Prevention of Mother to Child Transmission.
A sub-district in a province in SA
Positive PCRs at 6 weeks (target <5%) Feb 2010 8.2%Feb 2011 3.2%
Improvement?

JUN 2009 FEB 2010 JUN 2010 FEB 20110
1
2
3
4
5
6
7
8
9
PCR positive rates
Positive PCRs at 6 weeks (target <5%) Feb 2010 8.2%Feb 2011 3.2%
Improvement?

Median
Shift: 6 points in row on same side of the median Note: A point exactly on the centerline does not cancel or count towards a shift
Median
Median
Trend: 5 points in row headed in same directionNote: Ties between two consecutive points
don’t cancel or add to a trend
Rule 3
0
5
10
15
20
25
1 2 3 4 5 6 7 8 9 10
Mea
sure
or C
hara
cerist
ic
Median 11.4
Data line crosses onceToo few runs: total 2 runs
Run Chart: Rules for Identifying Statistically Significant Change
Rule 1 Rule 2
Rule 4Rule 3
I
Astronomical Point: a obviously, even blatantly different valueNote: Every set of data will have a highest and lowest data point. This does not mean the high or low are astronomical
Runs: too few or too many runs
Provost and Murray

Run Charts• One of the most powerful tools for improvement
• Describe a process over time
• Shows trends the process is experiencing
• Can be used to analyse whether the change was an improvement
• Data can be used to drive change

Outcome measurement
Are we getting to our target?
Was the change an improvement?
How do we measure HAIs?
Measuring infection rates
Lessons from an ICU

Quality Improvement 101
Problem?

Measuring Infection Rates
• Total number of infective cases per 1,000 device days:
Total No. of VAP cases
Ventilator daysX 1,000
Numerator
Denominator

Definition of VAP
“VAP is suspected when a patient on mechanical ventilation develops: a new or progressive pulmonary infiltrate with fever / leucocytosis and purulent tracheobronchial secretions”
“VAP is suspected when a patient on mechanical ventilation develops: a new or progressive pulmonary infiltrate with fever / leucocytosis and purulent tracheobronchial secretions”
“Pneumonia is considered as ventilator associated if the patient was intubated and ventilated at the time or within 48hrs before the onset of the infection”
“Pneumonia is considered as ventilator associated if the patient was intubated and ventilated at the time or within 48hrs before the onset of the infection”
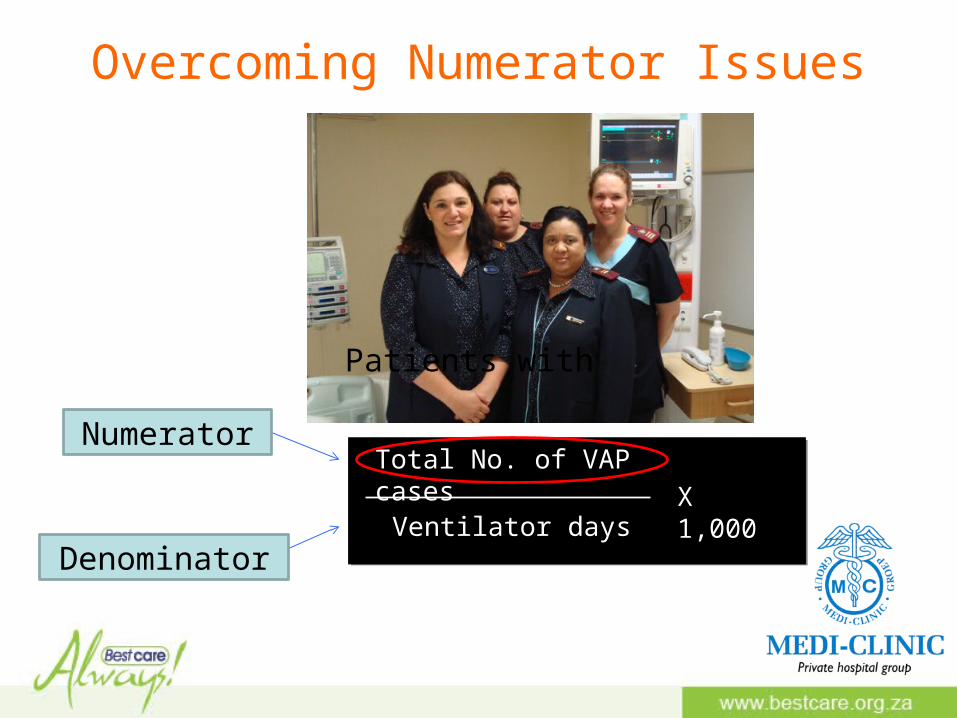
Overcoming Numerator Issues
Total No. of VAP cases
Ventilator daysX 1,000
Numerator
Denominator
Patients with

Overcoming Numerator Issues – diagnosing the HAI (workbook)
Checklists forDiagnosing the HA Infectionused by theteam

Overcoming Denominator Issues
At the same time every day theUnit managercounts devicesin use in the ward

Measuring HAI
Percentages and rates
% (or rate) = Numerator/ denominator
eg
Rate of infection = readmissions for septic caesarian section wounds per week / number of Caesarian Sections performed per week
Rate of infection = Number of VAP / 1000 device days

Safety CalendarWelsh 1000 lives campaign
IDeveloped by Annette Bartley

Welsh Patient Safety Project

Measuring HAI
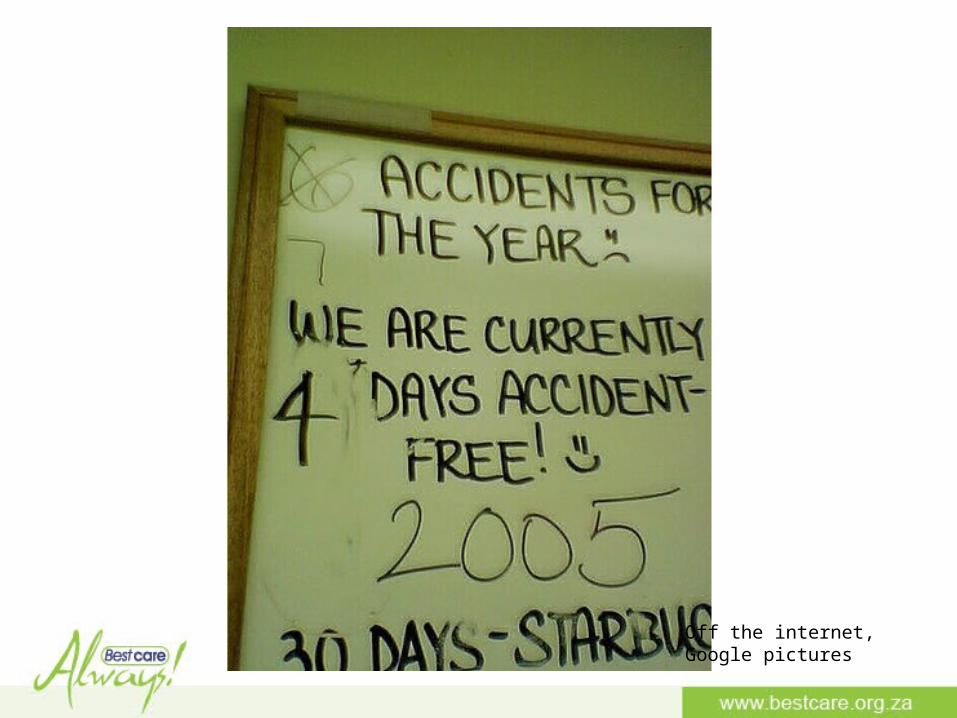
The concept of ‘days between’ infections
For measure ‘rare’ events (occur < 10%)

Off the internet, Google pictures

Off the internet, Google pictures
Off the internet, Google pictures

Off the internet, Google pictures

Maternal deaths – Malawi
For the “NO Maternal Death” Campaign a colorful, laminated A4 paper that said “Days without a Maternal Death: ______”. were hung in every Labour Ward for all (providers, patients and guardians) to see and the number was filled in daily with a dry erase marker

Days between icecreams
Days betweenicecream
Icecream
1st 2nd3rd 4th 5th
510
15
20
25

Days between events (infection)
Days Betweenevents(egInfection)
Sequence of events (eg Infection)
1st 2nd3rd 4th 5th
510
15
20
25

Neonatal deaths – Malare Health Centre, 5’s Alive! Project, Ghana
I

IMeasuring rare events and time-between measures. James Benneyan IHI

July Aug Sep Oct
5/7 13/8 7/9 5/10
5/7 9/9 8/10
6/7 12/9 15/10
11/7 15/9 19/10
25/7 20/10
27/7 21/10
25/10
ICU: Sequence of VAP infections by date 2010

Use the tools to Display the data
July Aug Sep Oct
5/7 13/8 7/9 5/10
5/7 9/9 8/10
6/7 12/9 15/10
11/7 15/9 9/10
25/7 20/10
27/7 21/10
25/10

Date of infection
# Days since last infection
Days Be-tweenInfection
Sequence of Infections

So far we have:
1.Mapped the size of the project in your facility2.Prioritise a unit and bundle to start with3.Written an aim
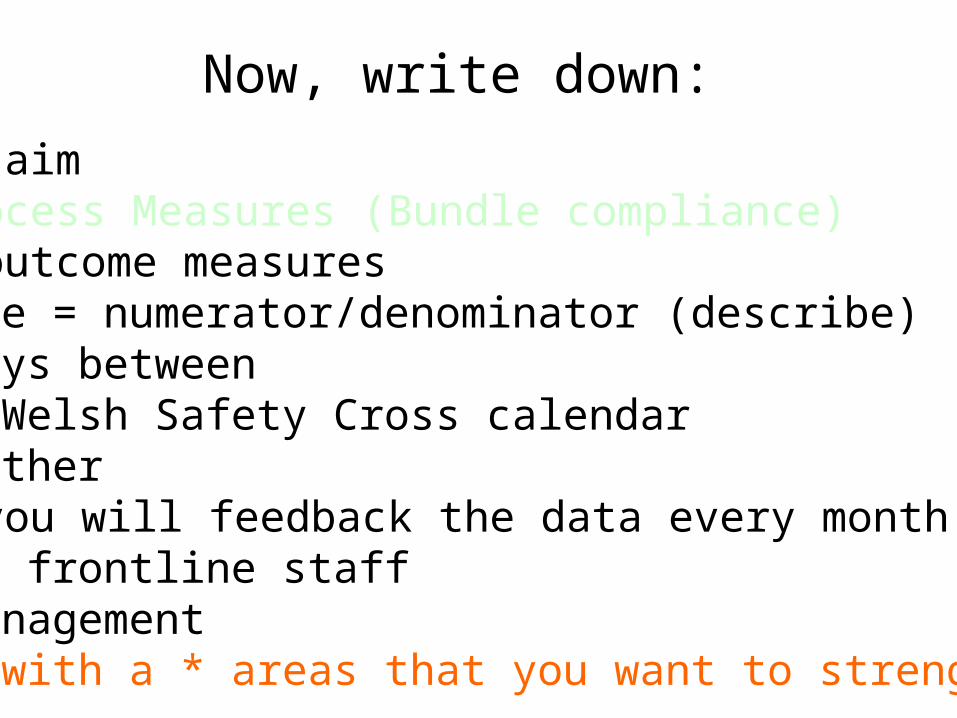
Now, write down:
1.Your aim2. Process Measures (Bundle compliance)3.The outcome measures
i) Rate = numerator/denominator (describe)ii) Days betweeniii) Welsh Safety Cross calendariv) Other
4.How you will feedback the data every month toi) The frontline staffii) ManagementMark with a * areas that you want to strengthen

Improving your Outcome Measure
1) NumeratorStandardised diagnosis of infection
2) What is the measure for HAI?Rate = Infection/device dayDays between (CLABSI, VAP, UTI)Days or cases between SSI
3) Collecting and collating data: What (definition)/ Where/ How (tools)/ Who/ When
4) Presenting the data:Format - Safety Cross, GraphsFeedback/presentation - Management platform

Note the areas that need strengthening1.Your aim2. Process Measures (Bundle compliance)3.The outcome measures
i) Rate = numerator/denominator (describe) *ii) Days between
iii) Welsh Safety calendar *iv) Other
4.How you will feedback the data every month to
i) The frontline staff *ii) Management ** Areas that need strengthening

Select a priority area for improvement
• resolving it will have a big impact• it is under your control to test a change• you can start on Monday
Establishing or Improving your outcome measure/s

Plan a PDSA using the Model for Improvement
What can we change that will
result in an improvement?
PLAN
DO
STUDY
ACT
How will we know that a
change is an improvement?
What are we trying to accomplish? aim
measurementchange

AIM of this change: PROBLEM :
Design a PDSA to improve one of the areas with a *
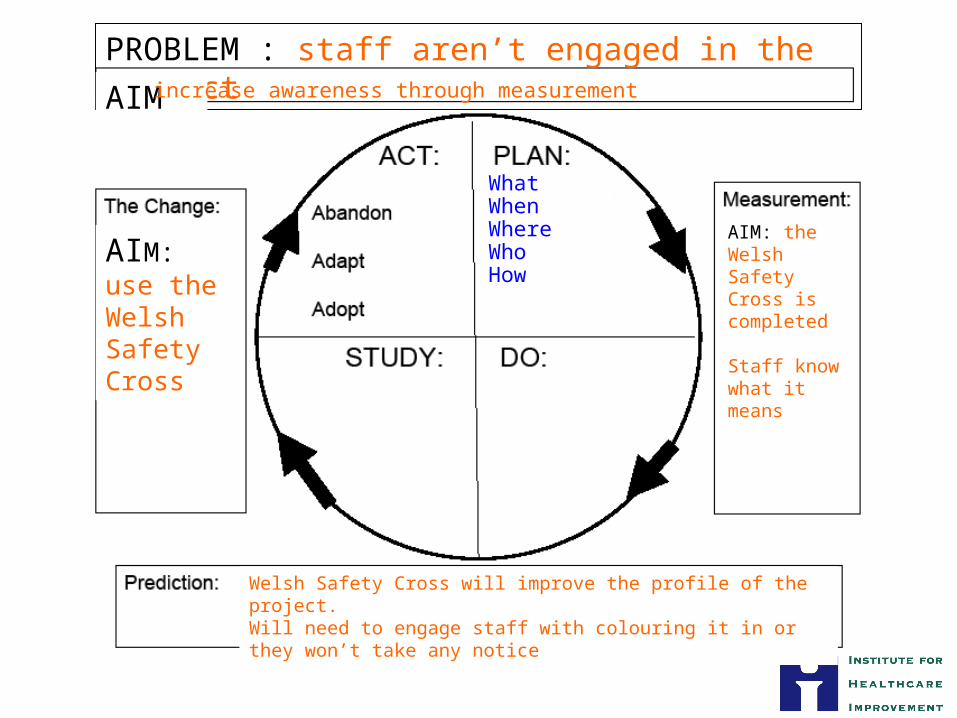
AIM: use the Welsh Safety Cross
PROBLEM : staff aren’t engaged in the project
What WhenWhereWhoHow
AIM increase awareness through measurement
AIM: the Welsh Safety Cross is completed
Staff know what it means
Welsh Safety Cross will improve the profile of the project. Will need to engage staff with colouring it in or they won’t take any notice