Embed Size (px)
Citation preview
1
Model for calculating cost of poor quality
Model for calculating cost of poor quality
R Jagadeesh
Dean – Academics
Professor
Operations Management and
Quantitative Techniques
SDMIMD, Mysuru
Project Team
Karthik Sunil Nair - 15028
Pooja Hegde - 15040
Namitha T R - 15099
Naveen Pashikanti - 15100
2
Applied Research Series, 2017
(C) Applied Research Series 2017, SDM RCMS, SDMIMD, Mysuru
ISBN : 978-93-83302-21-5
Note :
All views expressed in this work are that of the author(s). SDM RCMS does not take any responsibility for the
views expressed herein by the author(s).
No part of this publication can be reproduced or transmitted in any form or by any means, without prior
permission of the publisher.
3
Model for calculating cost of poor quality
This project deals with creation of a Cost of Poor
Quality (COPQ) model for Triton Valves Ltd., an auto
component manufacturer in Mysore and supplies to
many national and international auto makers. The
literature pertaining to Quality, Cost of Quality and
Cost of Poor Quality is initially discussed. The need
for the project as discussed with the management
team of the firm is stated and the objective of
the project is laid down. The report continues by
identifying the key processes in manufacturing the tyre
valves, based upon which the Model for COPQ is built.
The various sub-modules in the model - input,
calculation and output is explained with relevant
figures and calculation examples. The salient features
of the model, which prove to be good advantage to
the firm is explained. The report concludes by stating
several limitations of the project which pave way for
the future scope of study.
Abstract

4
Applied Research Series, 2017
5
Model for calculating cost of poor quality
Firstly, the project team would like to thank
Shri Dharmasthala Manjunatheshwara Institute for
Management Development (SDMIMD), Mysore and
the client organization Triton Valves Ltd., Mysore for
giving the opportunity to take up a real time project
pertaining to an important topic in Quality.
The project team would like to thank the faculty
guide - Dr R Jagadeesh, Dean-Academics & Professor
- Operations Management and Quantitative
Techniques, SDMIMD, for the relentless support and
Acknowledgement
guidance offered during the course of the project and
the bounty of knowledge and priceless experiences
shared during the PGDM course.
The project team would also like to extend a sincere
gratitude to the support received by corporate guides
Mr.Valleesha B S, Mr.Samarth Raj, and Mr.Ashok Rao
for their constant support and guidance during the
course of the project. The project team thanks them
immensely for providing an open and supportive
learning atmosphere.

6
Applied Research Series, 2017
7
Model for calculating cost of poor quality
Table of Contents
Company Introduction ................................................................................................................................ 1
Literature Study ........................................................................................................................................... 3
Need for the project .................................................................................................................................... 3
Project Scope .............................................................................................................................................. 4
Cost of Poor Quality (COPQ) Model ............................................................................................................ 6
Salient features of the proposed COPQ model .......................................................................................... 13
Limitations and future scope..................................................................................................................... 13
Conclusion ................................................................................................................................................. 14
1
Model for calculating cost of poor quality
Company Introduction
Triton Valves Ltd. is India’s largest manufacturer
of automotive tyre tube valves, valve cores and
accessories. They have been developing high
precision products to cater to the needs of diverse
clientele across the world. Triton was established by
entering into a technical collaboration with Pingeot
Bardin SA, a renowned manufacturer of automotive
tyre valves based in France. Pingeot Bardin transferred
critical manufacturing technology to Triton during the
five year collaboration period.
The company has its manufacturing facility located
in a 14 acre plot, in Mysore, India. The facility boasts
of its state of the art machinery and has a team of
dedicated and talented engineers and workforce.
Triton Valves Ltd was incorporated by Mr. M.V.Gokarn,
in 1976. Mr. Gokarn was a technocrat entrepreneur
with a vision to establish a world–class
manufacturing facility in India, pertaining to a
wide range of industrial and automotive products.
Commercial production of the company commenced
in 1978 with an annual capacity of 3 million valves
and 4 million valve cores. Triton quickly established a
reputation for its quality and customer service and
emerged as a strong player in the tyre valve market in
India.
Today, Triton has many notable achievements to its
credit. It is the market leader in India with over 60%
market share, the first in the industry to acquire the
QS 9000 and the ISO/TS 16949 certifications. It has
the most modern manufacturing facility in India and
is also the fastest growing company in the industry.
Triton Valves has invested heavily in building a quality
culture in their company. They look to maximise their
customer satisfaction by imbuing highest level of
quality in all their products and processes. With
various Quality certifications and awards to their
name, they have also looked to incorporate Six Sigma
into their manufacturing process and have a dedicated
team for six sigma implementation.
Being the market leader for tyre valves in India, they
have a strong client base among the top automobile
and tyre manufacturing companies operating in the
country. Their reputation of quality and reliability and
superior customer service has attracted top firms like
Apollo Tyres, Bridgestone India, Ceat Tyres, JK tyres,
MRF Tyres, Mahindra & Mahindra, Tata Motors,
TVS–Srichakra Tyres and Wheels India as their OEM
customers. (tritonvalves.com/about_us)
Product Profile
The main categories of products that are sold by
Triton are –
Valves
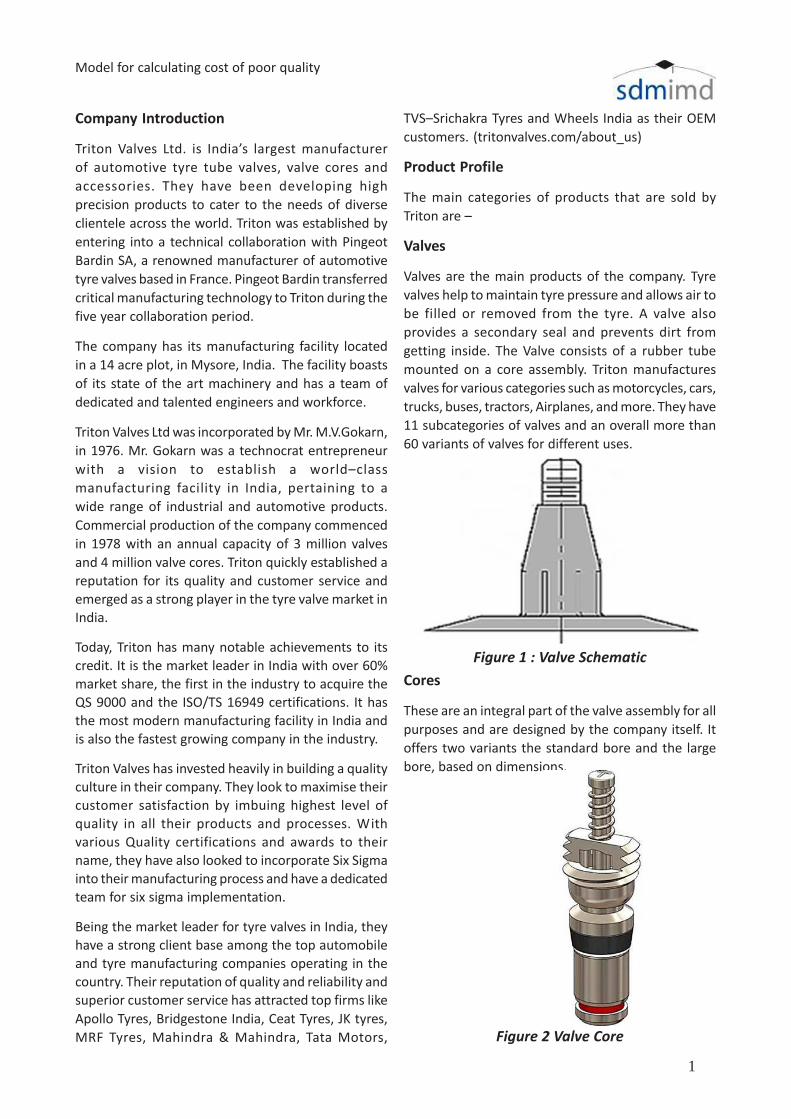
Valves are the main products of the company. Tyre
valves help to maintain tyre pressure and allows air to
be filled or removed from the tyre. A valve also
provides a secondary seal and prevents dirt from
getting inside. The Valve consists of a rubber tube
mounted on a core assembly. Triton manufactures
valves for various categories such as motorcycles, cars,
trucks, buses, tractors, Airplanes, and more. They have
11 subcategories of valves and an overall more than
60 variants of valves for different uses.
Figure 1 : Valve Schematic
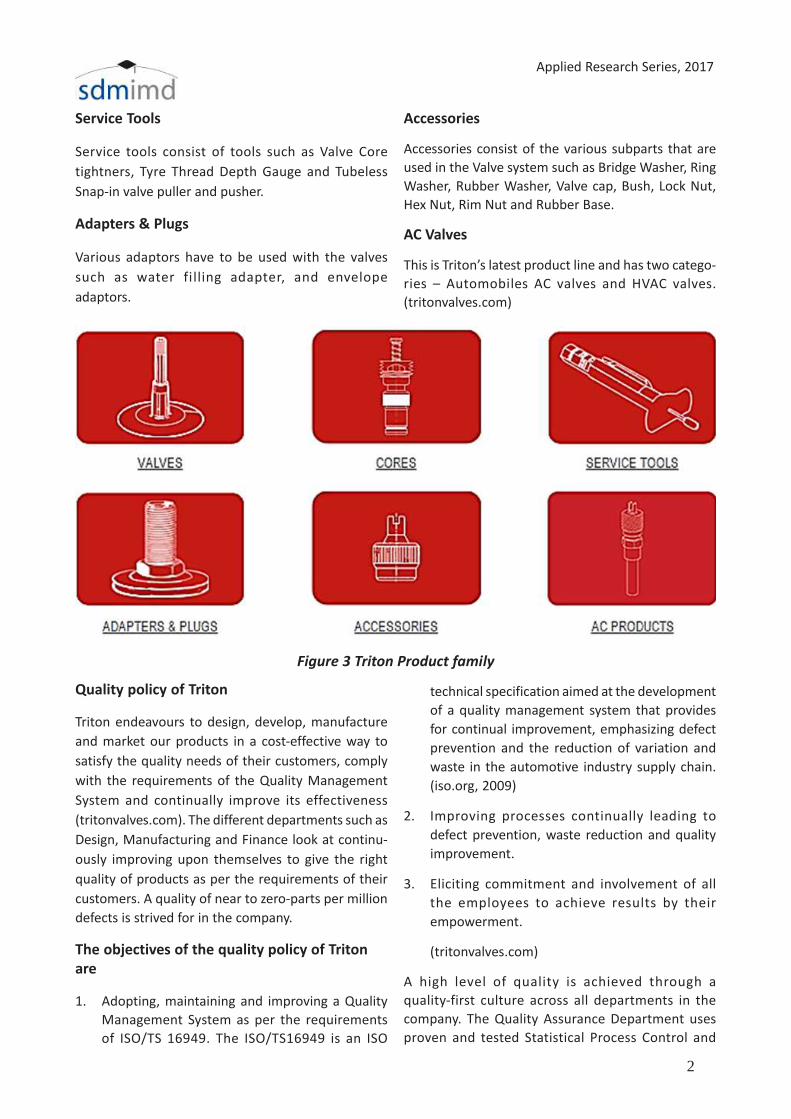
Cores
These are an integral part of the valve assembly for all
purposes and are designed by the company itself. It
offers two variants the standard bore and the large
bore, based on dimensions.
Figure 2 Valve Core
2
Applied Research Series, 2017
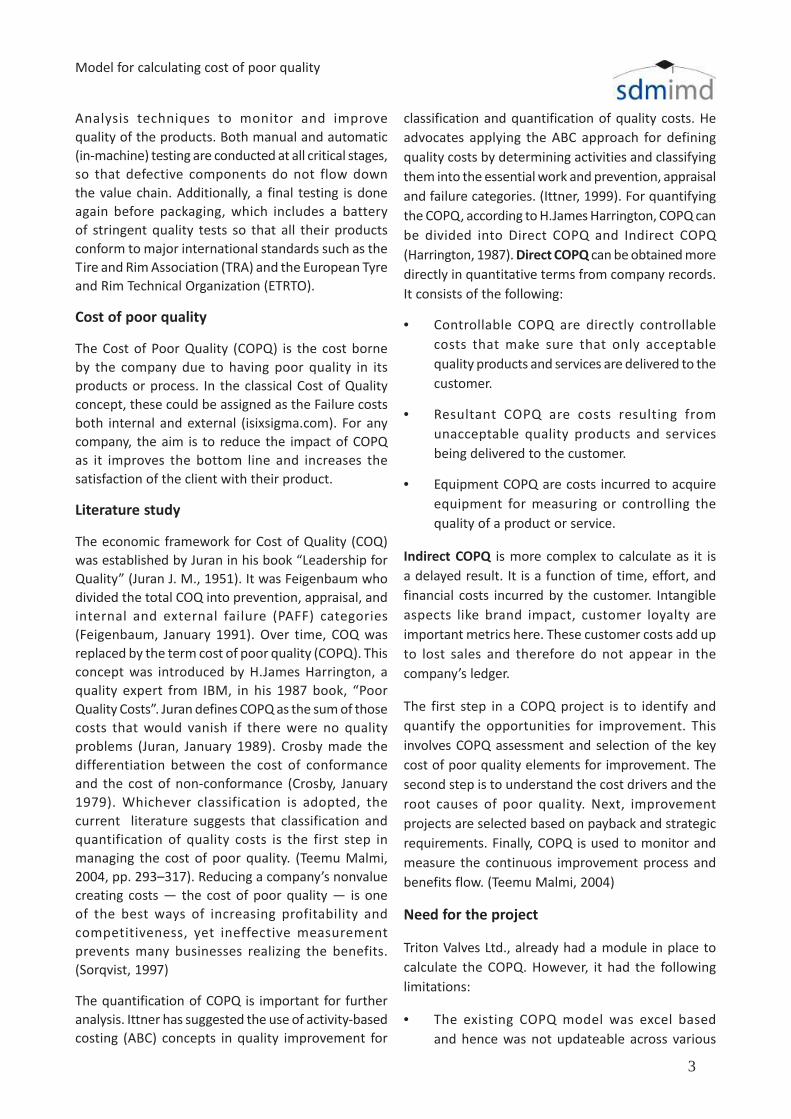
Service Tools
Service tools consist of tools such as Valve Core
tightners, Tyre Thread Depth Gauge and Tubeless
Snap-in valve puller and pusher.
Adapters & Plugs
Various adaptors have to be used with the valves
such as water fi lling adapter, and envelope
adaptors.
Accessories
Accessories consist of the various subparts that are
used in the Valve system such as Bridge Washer, Ring
Washer, Rubber Washer, Valve cap, Bush, Lock Nut,
Hex Nut, Rim Nut and Rubber Base.
AC Valves
This is Triton’s latest product line and has two catego-
ries – Automobiles AC valves and HVAC valves.
(tritonvalves.com)
Figure 3 Triton Product family
Quality policy of Triton
Triton endeavours to design, develop, manufacture
and market our products in a cost-effective way to
satisfy the quality needs of their customers, comply
with the requirements of the Quality Management
System and continually improve its effectiveness
(tritonvalves.com). The different departments such as
Design, Manufacturing and Finance look at continu-
ously improving upon themselves to give the right
quality of products as per the requirements of their
customers. A quality of near to zero-parts per million
defects is strived for in the company.
The objectives of the quality policy of Triton
are
1. Adopting, maintaining and improving a Quality
Management System as per the requirements
of ISO/TS 16949. The ISO/TS16949 is an ISO
technical specification aimed at the development
of a quality management system that provides
for continual improvement, emphasizing defect
prevention and the reduction of variation and
waste in the automotive industry supply chain.
(iso.org, 2009)
2. Improving processes continually leading to
defect prevention, waste reduction and quality
improvement.
3. Eliciting commitment and involvement of all
the employees to achieve results by their
empowerment.
(tritonvalves.com)
A high level of quality is achieved through a
quality-first culture across all departments in the
company. The Quality Assurance Department uses
proven and tested Statistical Process Control and
3
Model for calculating cost of poor quality
Analysis techniques to monitor and improve
quality of the products. Both manual and automatic
(in-machine) testing are conducted at all critical stages,
so that defective components do not flow down
the value chain. Additionally, a final testing is done
again before packaging, which includes a battery
of stringent quality tests so that all their products
conform to major international standards such as the
Tire and Rim Association (TRA) and the European Tyre
and Rim Technical Organization (ETRTO).
Cost of poor quality
The Cost of Poor Quality (COPQ) is the cost borne
by the company due to having poor quality in its
products or process. In the classical Cost of Quality
concept, these could be assigned as the Failure costs
both internal and external (isixsigma.com). For any
company, the aim is to reduce the impact of COPQ
as it improves the bottom line and increases the
satisfaction of the client with their product.
Literature study
The economic framework for Cost of Quality (COQ)
was established by Juran in his book “Leadership for
Quality” (Juran J. M., 1951). It was Feigenbaum who
divided the total COQ into prevention, appraisal, and
internal and external failure (PAFF) categories
(Feigenbaum, January 1991). Over time, COQ was
replaced by the term cost of poor quality (COPQ). This
concept was introduced by H.James Harrington, a
quality expert from IBM, in his 1987 book, “Poor
Quality Costs”. Juran defines COPQ as the sum of those
costs that would vanish if there were no quality
problems (Juran, January 1989). Crosby made the
differentiation between the cost of conformance
and the cost of non-conformance (Crosby, January
1979). Whichever classification is adopted, the
current literature suggests that classification and
quantification of quality costs is the first step in
managing the cost of poor quality. (Teemu Malmi,
2004, pp. 293–317). Reducing a company’s nonvalue
creating costs — the cost of poor quality — is one
of the best ways of increasing profitability and
competitiveness, yet ineffective measurement
prevents many businesses realizing the benefits.
(Sorqvist, 1997)
The quantification of COPQ is important for further
analysis. Ittner has suggested the use of activity-based
costing (ABC) concepts in quality improvement for
classification and quantification of quality costs. He
advocates applying the ABC approach for defining
quality costs by determining activities and classifying
them into the essential work and prevention, appraisal
and failure categories. (Ittner, 1999). For quantifying
the COPQ, according to H.James Harrington, COPQ can
be divided into Direct COPQ and Indirect COPQ
(Harrington, 1987). Direct COPQ can be obtained more
directly in quantitative terms from company records.
It consists of the following:
• Controllable COPQ are directly controllable
costs that make sure that only acceptable
quality products and services are delivered to the
customer.
• Resultant COPQ are costs resulting from
unacceptable quality products and services
being delivered to the customer.
• Equipment COPQ are costs incurred to acquire
equipment for measuring or controlling the
quality of a product or service.
Indirect COPQ is more complex to calculate as it is
a delayed result. It is a function of time, effort, and
financial costs incurred by the customer. Intangible
aspects like brand impact, customer loyalty are
important metrics here. These customer costs add up
to lost sales and therefore do not appear in the
company’s ledger.
The first step in a COPQ project is to identify and
quantify the opportunities for improvement. This
involves COPQ assessment and selection of the key
cost of poor quality elements for improvement. The
second step is to understand the cost drivers and the
root causes of poor quality. Next, improvement
projects are selected based on payback and strategic
requirements. Finally, COPQ is used to monitor and
measure the continuous improvement process and
benefits flow. (Teemu Malmi, 2004)
Need for the project
Triton Valves Ltd., already had a module in place to
calculate the COPQ. However, it had the following
limitations:
• The existing COPQ model was excel based
and hence was not updateable across various
4
Applied Research Series, 2017
devices, limited collaboration amongst
chief managers-in-charge and required the
finance manager–in-charge to enter the data
offline.
• The existing COPQ model used one month as the
period for data collection, calculation and results
discussion. This latency pushed the critical
decisions to be taken in the month-end and failed
to give a break-up of the behaviour of the COPQ
value across smaller periods of time. It even
did not have the flexibility to change the period
to smaller values.
• The existing COPQ model did not cater to all the
costs involved.
Hence, the management wanted the project team to
study the manufacturing process in depth and develop
a refined model that can be applied on a more
dynamic and real time basis which would provide a
real tie snapshot of Cost of Poor quality.
Project scope
The objective of the project is:
“ To develop a more efficient and real time model
for calculating the cost of poor quality pertaining to
all products manufactured at the company that
considers all tangible and intangible factors the value
chain”
For the purpose of the project, the project team was
assigned three models of Valves, whose complete
manufacturing process was to be observed and the
new COPQ model was to be developed for the three
valve models. The models were selected to ensure
that the project team could study all the main
process that are involved in the manufacturing
process for the entire product families.
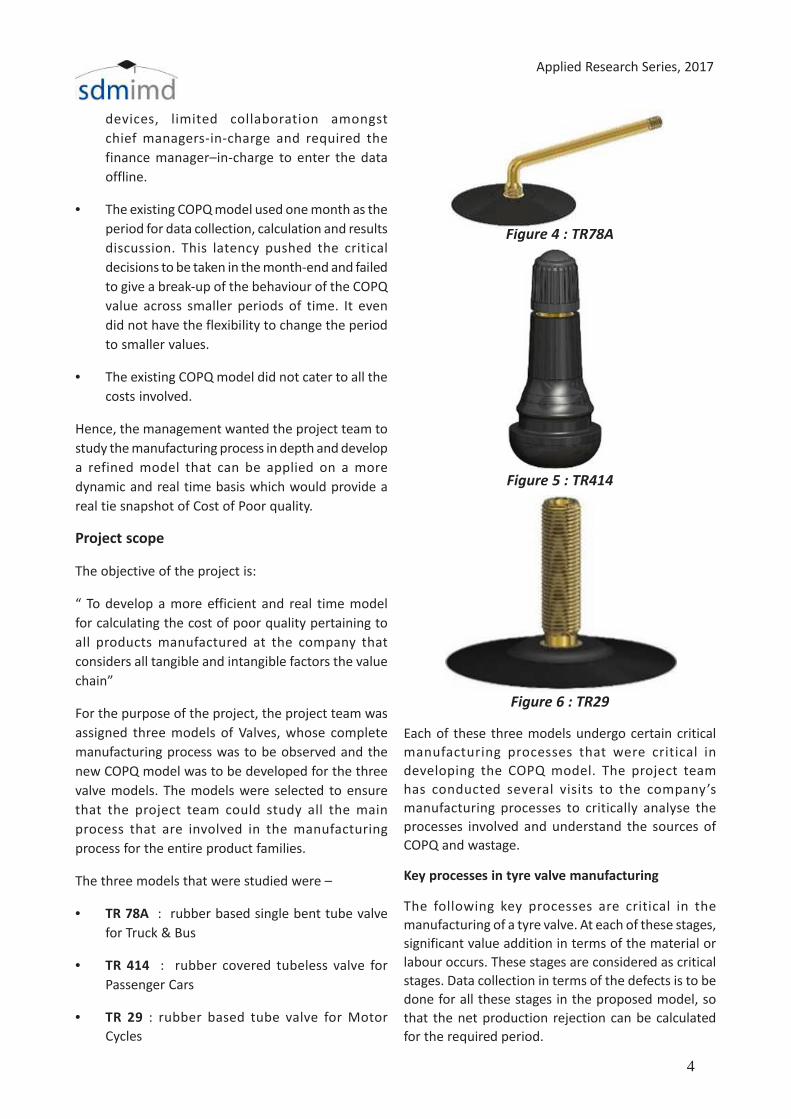
The three models that were studied were –
• TR 78A : rubber based single bent tube valve
for Truck & Bus
• TR 414 : rubber covered tubeless valve for
Passenger Cars
• TR 29 : rubber based tube valve for Motor
Cycles
Figure 4 : TR78A
Figure 5 : TR414
Figure 6 : TR29
Each of these three models undergo certain critical
manufacturing processes that were critical in
developing the COPQ model. The project team
has conducted several visits to the company’s
manufacturing processes to critically analyse the
processes involved and understand the sources of
COPQ and wastage.
Key processes in tyre valve manufacturing
The following key processes are critical in the
manufacturing of a tyre valve. At each of these stages,
significant value addition in terms of the material or
labour occurs. These stages are considered as critical
stages. Data collection in terms of the defects is to be
done for all these stages in the proposed model, so
that the net production rejection can be calculated
for the required period.
5
Model for calculating cost of poor quality
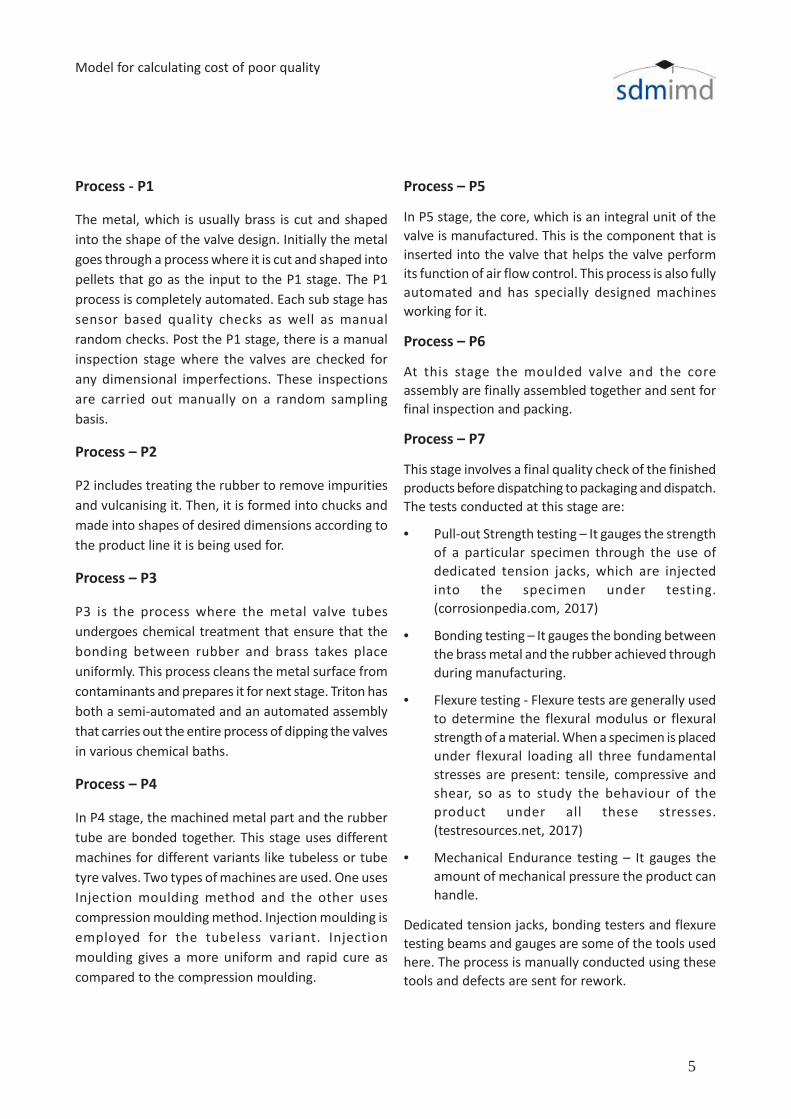
Process - P1
The metal, which is usually brass is cut and shaped
into the shape of the valve design. Initially the metal
goes through a process where it is cut and shaped into
pellets that go as the input to the P1 stage. The P1
process is completely automated. Each sub stage has
sensor based quality checks as well as manual
random checks. Post the P1 stage, there is a manual
inspection stage where the valves are checked for
any dimensional imperfections. These inspections
are carried out manually on a random sampling
basis.
Process – P2
P2 includes treating the rubber to remove impurities
and vulcanising it. Then, it is formed into chucks and
made into shapes of desired dimensions according to
the product line it is being used for.
Process – P3
P3 is the process where the metal valve tubes
undergoes chemical treatment that ensure that the
bonding between rubber and brass takes place
uniformly. This process cleans the metal surface from
contaminants and prepares it for next stage. Triton has
both a semi-automated and an automated assembly
that carries out the entire process of dipping the valves
in various chemical baths.
Process – P4
In P4 stage, the machined metal part and the rubber
tube are bonded together. This stage uses different
machines for different variants like tubeless or tube
tyre valves. Two types of machines are used. One uses
Injection moulding method and the other uses
compression moulding method. Injection moulding is
employed for the tubeless variant. Injection
moulding gives a more uniform and rapid cure as
compared to the compression moulding.
Process – P5
In P5 stage, the core, which is an integral unit of the
valve is manufactured. This is the component that is
inserted into the valve that helps the valve perform
its function of air flow control. This process is also fully
automated and has specially designed machines
working for it.
Process – P6
At this stage the moulded valve and the core
assembly are finally assembled together and sent for
final inspection and packing.
Process – P7
This stage involves a final quality check of the finished
products before dispatching to packaging and dispatch.
The tests conducted at this stage are:
• Pull-out Strength testing – It gauges the strength
of a particular specimen through the use of
dedicated tension jacks, which are injected
into the specimen under testing.
(corrosionpedia.com, 2017)
• Bonding testing – It gauges the bonding between
the brass metal and the rubber achieved through
during manufacturing.
• Flexure testing - Flexure tests are generally used
to determine the flexural modulus or flexural
strength of a material. When a specimen is placed
under flexural loading all three fundamental
stresses are present: tensile, compressive and
shear, so as to study the behaviour of the
product under all these stresses.
(testresources.net, 2017)
• Mechanical Endurance testing – It gauges the
amount of mechanical pressure the product can
handle.
Dedicated tension jacks, bonding testers and flexure
testing beams and gauges are some of the tools used
here. The process is manually conducted using these
tools and defects are sent for rework.
6
Applied Research Series, 2017
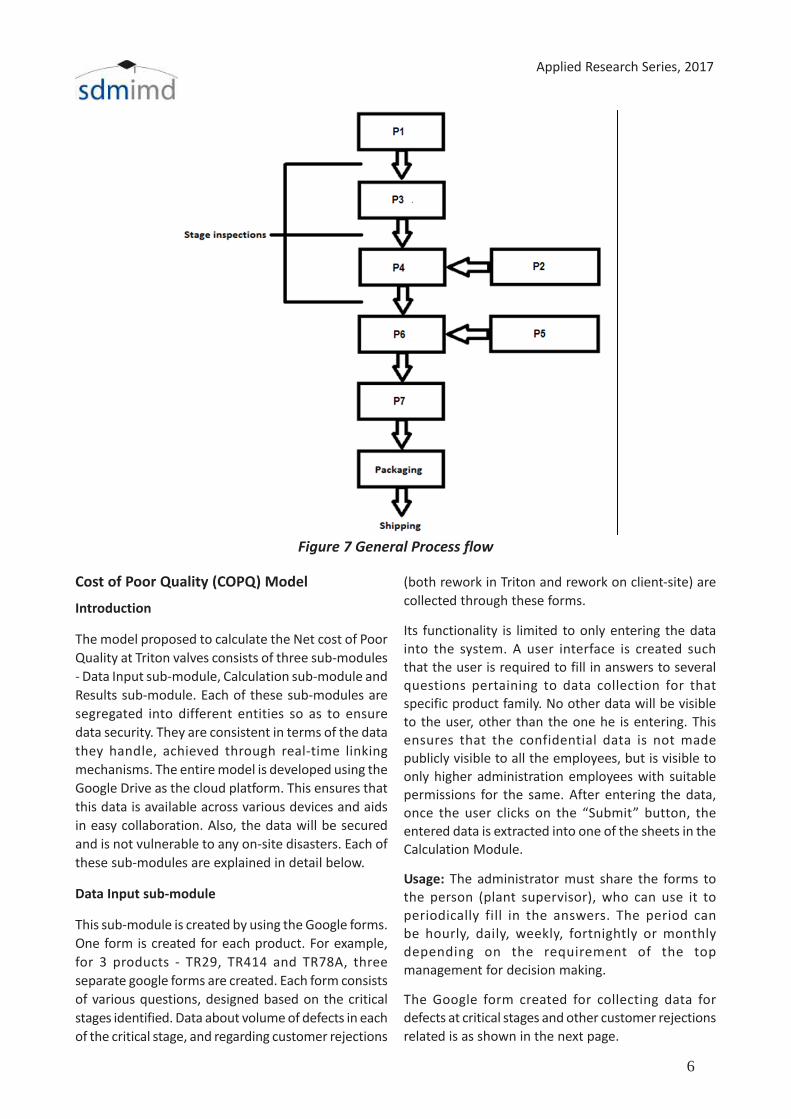
Figure 7 General Process flow
Cost of Poor Quality (COPQ) Model
Introduction
The model proposed to calculate the Net cost of Poor
Quality at Triton valves consists of three sub-modules
- Data Input sub-module, Calculation sub-module and
Results sub-module. Each of these sub-modules are
segregated into different entities so as to ensure
data security. They are consistent in terms of the data
they handle, achieved through real-time linking
mechanisms. The entire model is developed using the
Google Drive as the cloud platform. This ensures that
this data is available across various devices and aids
in easy collaboration. Also, the data will be secured
and is not vulnerable to any on-site disasters. Each of
these sub-modules are explained in detail below.
Data Input sub-module
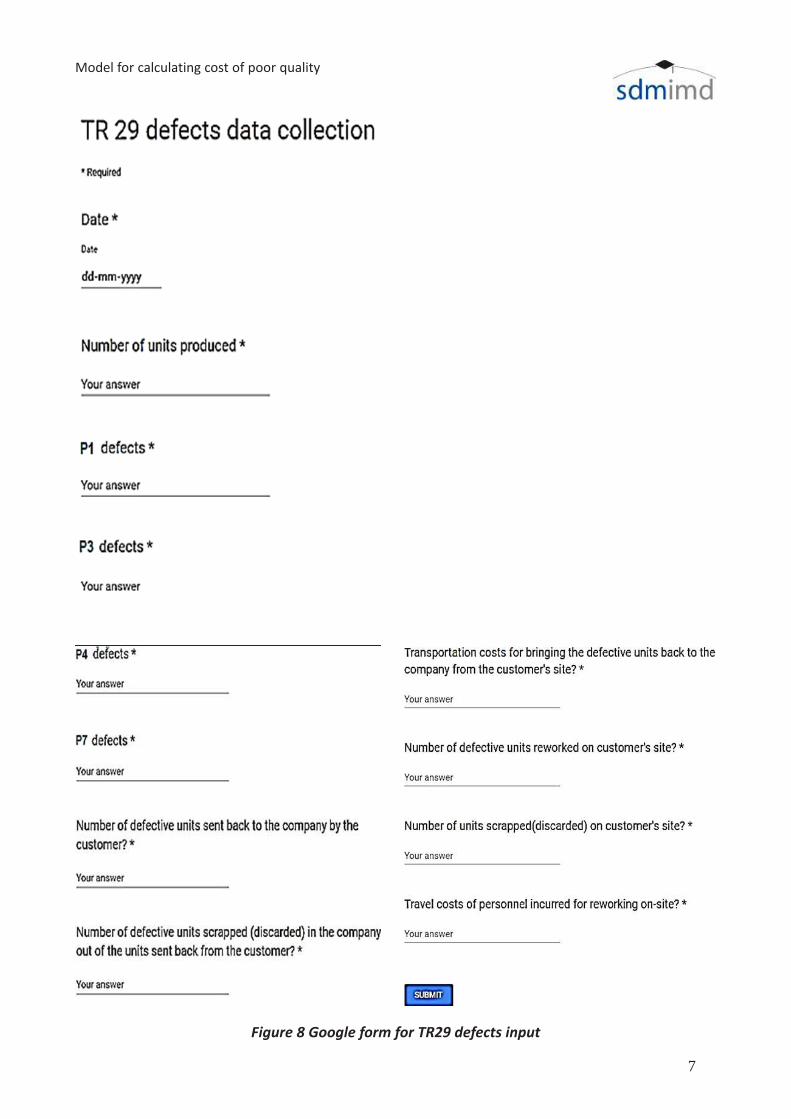
This sub-module is created by using the Google forms.
One form is created for each product. For example,
for 3 products - TR29, TR414 and TR78A, three
separate google forms are created. Each form consists
of various questions, designed based on the critical
stages identified. Data about volume of defects in each
of the critical stage, and regarding customer rejections
(both rework in Triton and rework on client-site) are
collected through these forms.
Its functionality is limited to only entering the data
into the system. A user interface is created such
that the user is required to fill in answers to several
questions pertaining to data collection for that
specific product family. No other data will be visible
to the user, other than the one he is entering. This
ensures that the confidential data is not made
publicly visible to all the employees, but is visible to
only higher administration employees with suitable
permissions for the same. After entering the data,
once the user clicks on the “Submit” button, the
entered data is extracted into one of the sheets in the
Calculation Module.
Usage: The administrator must share the forms to
the person (plant supervisor), who can use it to
periodically fill in the answers. The period can
be hourly, daily, weekly, fortnightly or monthly
depending on the requirement of the top
management for decision making.
The Google form created for collecting data for
defects at critical stages and other customer rejections
related is as shown in the next page.
7
Model for calculating cost of poor quality
Figure 8 Google form for TR29 defects input
8
Applied Research Series, 2017
Calculations sub-module
The data collected through the input sub-module is
linked to this sub-module. This data is used for the
calculation of COPQ. This sub-module is created
using Google sheets. One sheet is created for each
product. For example, for 3 products - TR29, TR414
and TR78A, three separate google sheets are created.
In each sheet, the COPQ for that product is calculated
finally. Each sheet consists of various sub-sheets:
Introduction to the product
Here the information regarding the critical stages of
that product is written down. Also, the percentage of
recovery of brass from the discarded valve is written,
and taken as constant for all calculations for that
particular product.
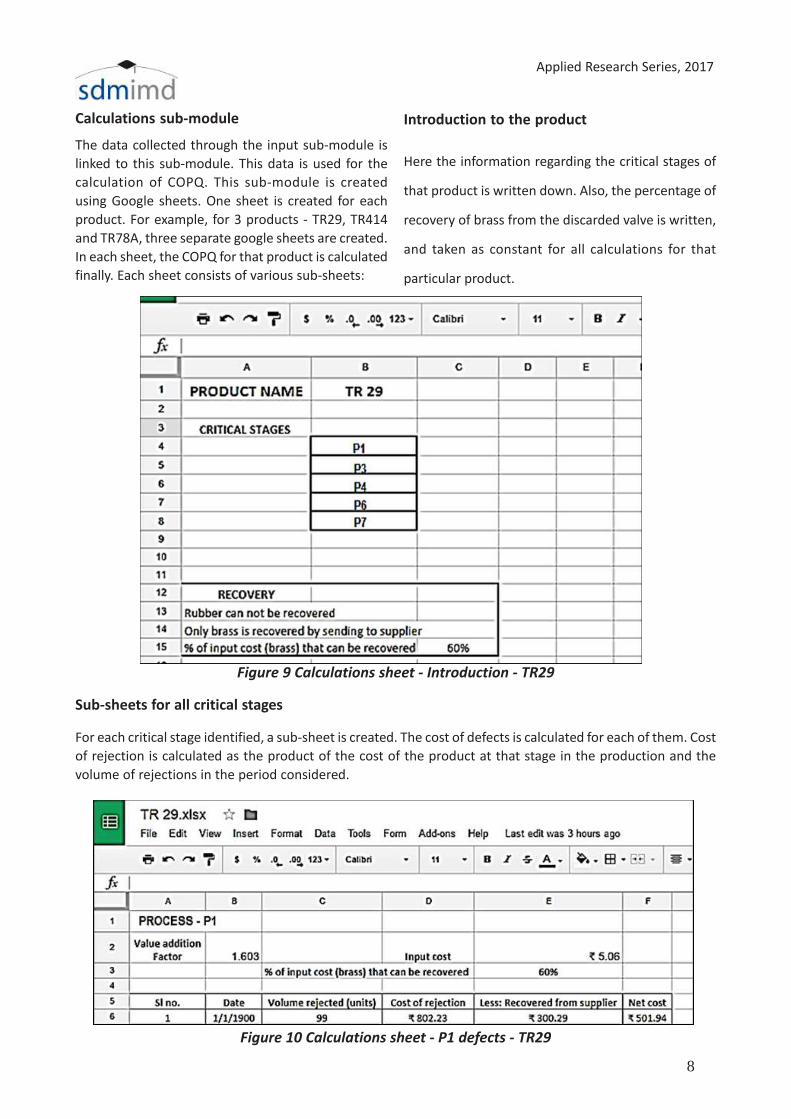
Figure 9 Calculations sheet - Introduction - TR29
Sub-sheets for all critical stages
For each critical stage identified, a sub-sheet is created. The cost of defects is calculated for each of them. Cost
of rejection is calculated as the product of the cost of the product at that stage in the production and the
volume of rejections in the period considered.
Figure 10 Calculations sheet - P1 defects - TR29
9
Model for calculating cost of poor quality
• Cost of rejection = Input Raw material cost *
Value addition till that stage * Volume of
rejections
Out of these rejections, brass cost can be
recovered by sending it back to the supplier.
• Hence, the net cost = Cost of rejection –
(% of brass recovered * Input cost )
For example, in the above figure, P1 stage is
considered. Here,
• Cost of rejection on 1/1/1990 = 5.06 * 1.603 *
99 = 802.23
• Net cost = 802.23 – (60% * 5.06) = 501.94
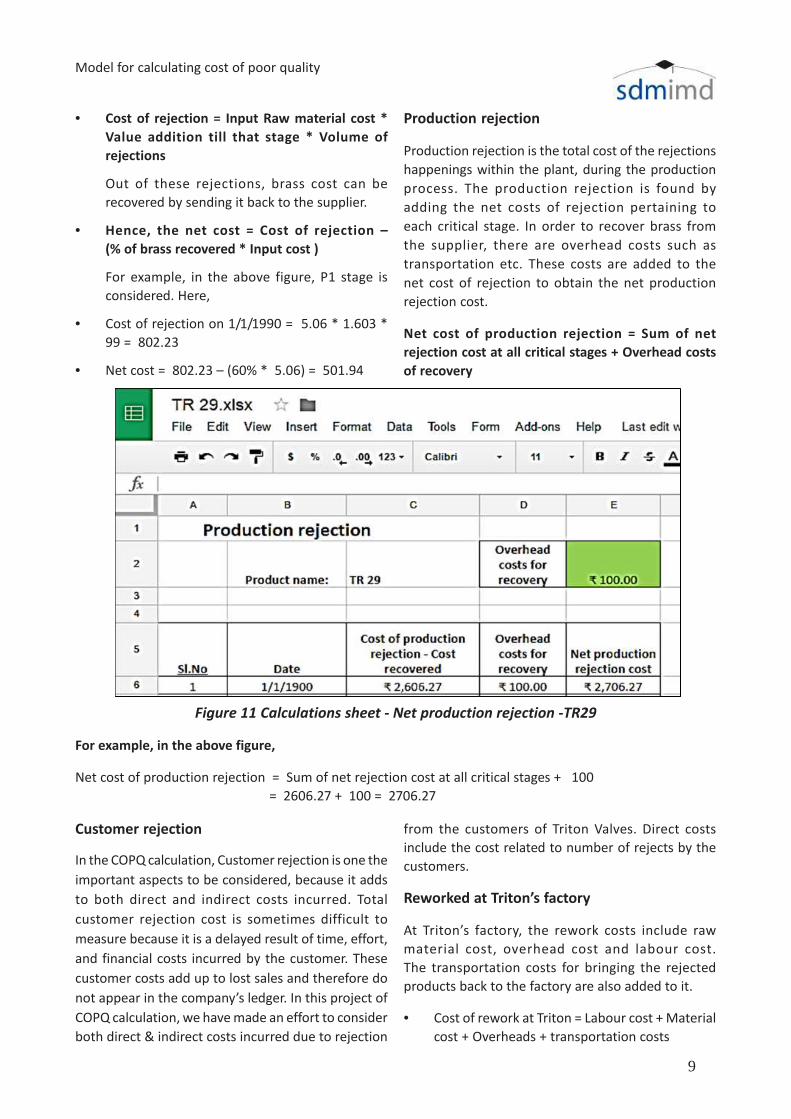
Production rejection
Production rejection is the total cost of the rejections
happenings within the plant, during the production
process. The production rejection is found by
adding the net costs of rejection pertaining to
each critical stage. In order to recover brass from
the supplier, there are overhead costs such as
transportation etc. These costs are added to the
net cost of rejection to obtain the net production
rejection cost.
Net cost of production rejection = Sum of net
rejection cost at all critical stages + Overhead costs
of recovery
Figure 11 Calculations sheet - Net production rejection -TR29
For example, in the above figure,
Net cost of production rejection = Sum of net rejection cost at all critical stages + 100
= 2606.27 + 100 = 2706.27
Customer rejection
In the COPQ calculation, Customer rejection is one the
important aspects to be considered, because it adds
to both direct and indirect costs incurred. Total
customer rejection cost is sometimes difficult to
measure because it is a delayed result of time, effort,
and financial costs incurred by the customer. These
customer costs add up to lost sales and therefore do
not appear in the company’s ledger. In this project of
COPQ calculation, we have made an effort to consider
both direct & indirect costs incurred due to rejection
from the customers of Triton Valves. Direct costs
include the cost related to number of rejects by the
customers.
Reworked at Triton’s factory
At Triton’s factory, the rework costs include raw
material cost, overhead cost and labour cost.
The transportation costs for bringing the rejected
products back to the factory are also added to it.
• Cost of rework at Triton = Labour cost + Material
cost + Overheads + transportation costs
10
Applied Research Series, 2017
Reworked at customer’s site
Sometimes the rework on the rejected units are done
at customer’s location itself and hence the rework cost
not only includes the raw material and labour costs,
but also includes travel and accommodation costs of
the service personnel.
• Cost of rework at customer’s site = Labour cost +
Material cost + Overheads + travel costs
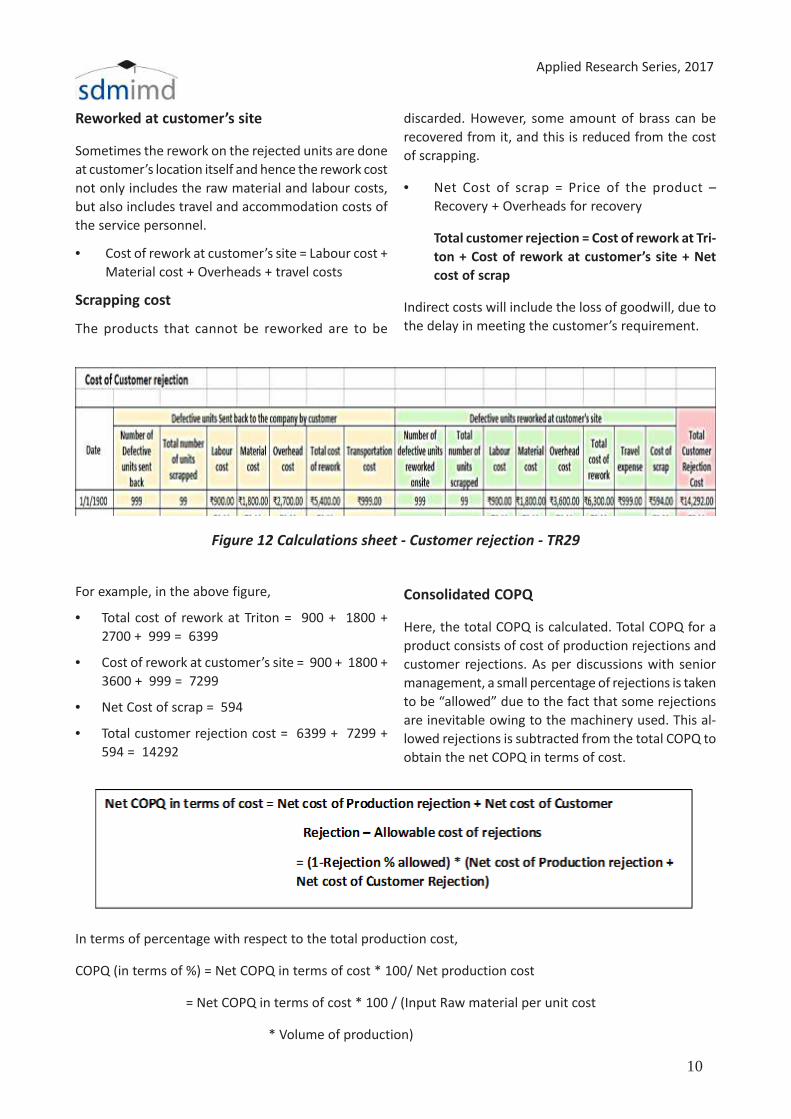
Scrapping cost
The products that cannot be reworked are to be
discarded. However, some amount of brass can be
recovered from it, and this is reduced from the cost
of scrapping.
• Net Cost of scrap = Price of the product –
Recovery + Overheads for recovery
Total customer rejection = Cost of rework at Tri-
ton + Cost of rework at customer’s site + Net
cost of scrap
Indirect costs will include the loss of goodwill, due to
the delay in meeting the customer’s requirement.
Figure 12 Calculations sheet - Customer rejection - TR29
For example, in the above figure,
• Total cost of rework at Triton = 900 + 1800 +
2700 + 999 = 6399
• Cost of rework at customer’s site = 900 + 1800 +
3600 + 999 = 7299
• Net Cost of scrap = 594
• Total customer rejection cost = 6399 + 7299 +
594 = 14292
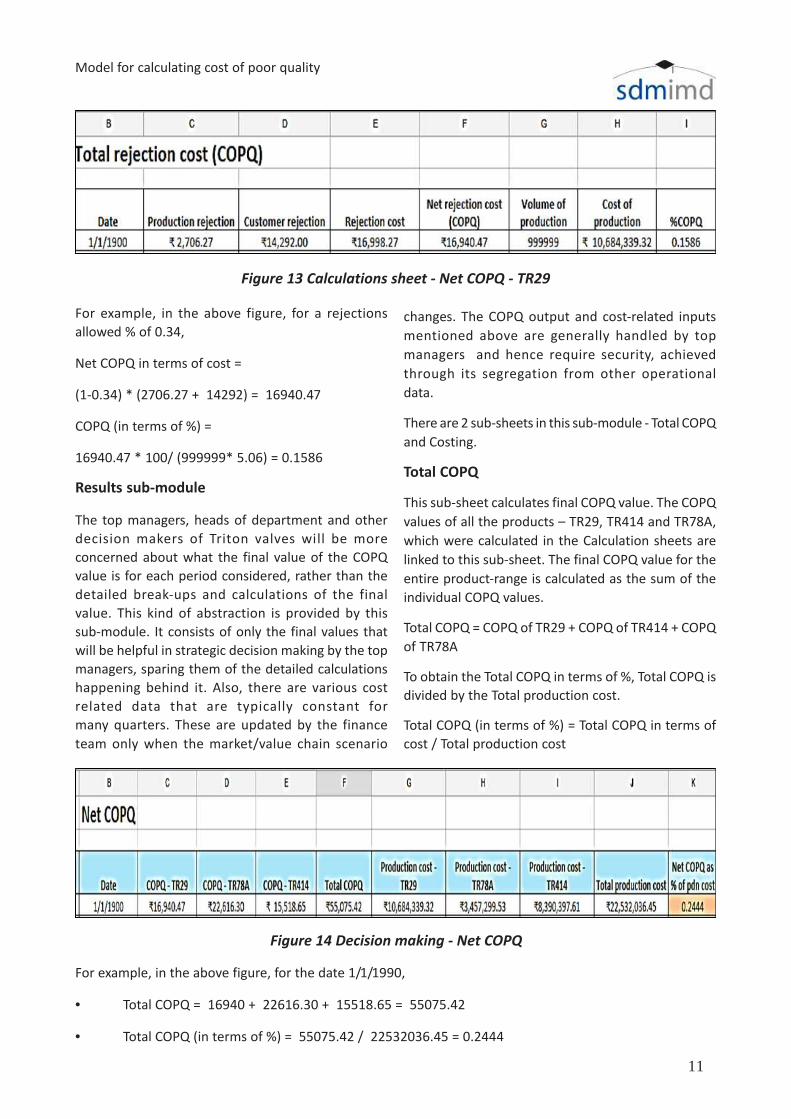
Consolidated COPQ
Here, the total COPQ is calculated. Total COPQ for a
product consists of cost of production rejections and
customer rejections. As per discussions with senior
management, a small percentage of rejections is taken
to be “allowed” due to the fact that some rejections
are inevitable owing to the machinery used. This al-
lowed rejections is subtracted from the total COPQ to
obtain the net COPQ in terms of cost.
In terms of percentage with respect to the total production cost,
COPQ (in terms of %) = Net COPQ in terms of cost * 100/ Net production cost
= Net COPQ in terms of cost * 100 / (Input Raw material per unit cost
* Volume of production)
11
Model for calculating cost of poor quality
Figure 13 Calculations sheet - Net COPQ - TR29
For example, in the above figure, for a rejections
allowed % of 0.34,
Net COPQ in terms of cost =
(1-0.34) * (2706.27 + 14292) = 16940.47
COPQ (in terms of %) =
16940.47 * 100/ (999999* 5.06) = 0.1586
Results sub-module
The top managers, heads of department and other
decision makers of Triton valves will be more
concerned about what the final value of the COPQ
value is for each period considered, rather than the
detailed break-ups and calculations of the final
value. This kind of abstraction is provided by this
sub-module. It consists of only the final values that
will be helpful in strategic decision making by the top
managers, sparing them of the detailed calculations
happening behind it. Also, there are various cost
related data that are typically constant for
many quarters. These are updated by the finance
team only when the market/value chain scenario
changes. The COPQ output and cost-related inputs
mentioned above are generally handled by top
managers and hence require security, achieved
through its segregation from other operational
data.
There are 2 sub-sheets in this sub-module - Total COPQ
and Costing.
Total COPQ
This sub-sheet calculates final COPQ value. The COPQ
values of all the products – TR29, TR414 and TR78A,
which were calculated in the Calculation sheets are
linked to this sub-sheet. The final COPQ value for the
entire product-range is calculated as the sum of the
individual COPQ values.
Total COPQ = COPQ of TR29 + COPQ of TR414 + COPQ
of TR78A
To obtain the Total COPQ in terms of %, Total COPQ is
divided by the Total production cost.
Total COPQ (in terms of %) = Total COPQ in terms of
cost / Total production cost
Figure 14 Decision making - Net COPQ
For example, in the above figure, for the date 1/1/1990,
• Total COPQ = 16940 + 22616.30 + 15518.65 = 55075.42
• Total COPQ (in terms of %) = 55075.42 / 22532036.45 = 0.2444
12
Applied Research Series, 2017
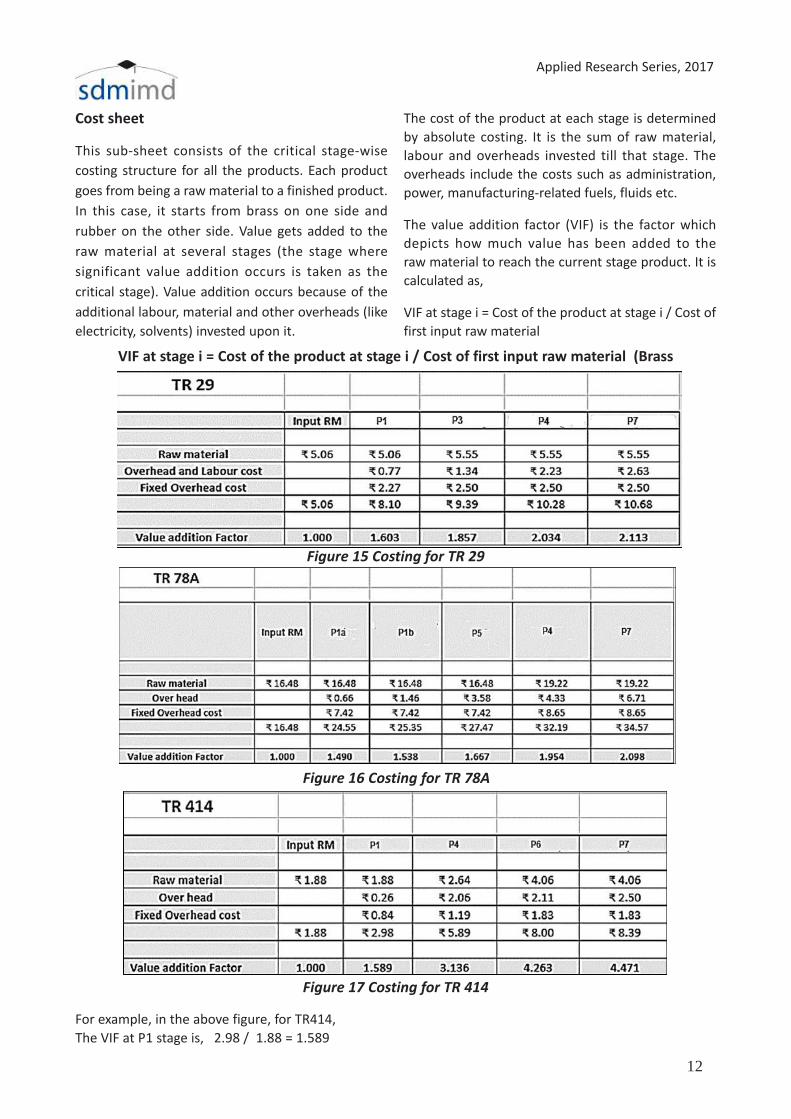
Cost sheet
This sub-sheet consists of the critical stage-wise
costing structure for all the products. Each product
goes from being a raw material to a finished product.
In this case, it starts from brass on one side and
rubber on the other side. Value gets added to the
raw material at several stages (the stage where
significant value addition occurs is taken as the
critical stage). Value addition occurs because of the
additional labour, material and other overheads (like
electricity, solvents) invested upon it.
The cost of the product at each stage is determined
by absolute costing. It is the sum of raw material,
labour and overheads invested till that stage. The
overheads include the costs such as administration,
power, manufacturing-related fuels, fluids etc.
The value addition factor (VIF) is the factor which
depicts how much value has been added to the
raw material to reach the current stage product. It is
calculated as,
VIF at stage i = Cost of the product at stage i / Cost of
first input raw material
Figure 15 Costing for TR 29
Figure 16 Costing for TR 78A
Figure 17 Costing for TR 414
VIF at stage i = Cost of the product at stage i / Cost of first input raw material (Brass
For example, in the above figure, for TR414,
The VIF at P1 stage is, 2.98 / 1.88 = 1.589
13
Model for calculating cost of poor quality
Salient features of the proposed COPQ Model
The current model developed by the project team
to calculate the COPQ has the following salient
features:
Google Drive – Cloud based platform
Google Drive, a cloud based platform for
collaboration provided by Google Inc., is used
extensively in this model. The cloud based nature of
the model enhances it through the following features:
• Location-free – Google drive allows users to work
from anywhere. As long as the user has an
Internet connection, he can access the cloud.
Many providers often have apps available to
multiple devices, so the user is free to use it on
his smartphone or tablet or his desktop
computer. This feature allows a work-life balance
and maintains productivity rates.
• Backup - Cloud-based backup saves time, avoids
larger investments and the need to recruit
third-party experts. Choosing cloud backups
decrease the size of the firms’ data centres. The
lowering of the numbers of servers, the software
expense, and the staff personnel can significantly
reduce IT costs without negatively affecting an
organization’s IT capabilities.
• Cloud-based workload and file sharing
streamline teamwork collaboration, which allows
data to be shared, accessed and edited from
anywhere. Updates are visible in real-time and
are seen by all teammates.
• Maintenance of the servers is easy. Servers are
off site, and the providers take care of software
updates. There is no need for users to install
software on to individual systems and keep up
to date with the software as it develops.
(Rajurkar, 2016)
Identification of Critical stages
By carefully studying the various stages of the
complete manufacturing process and all the different
sub processes, the project team was able to isolate
the critical to quality stages that had the most
significant impact on the COPQ. These stages are
considered for inputting the data and for calculations.
Data security
By making use of a 3 sub-module approach, we were
able to enhance the data security aspect of the data
inputted into the model. The 3 sub-modules of the
model are:
• Input sub-module – Created using Google forms
• Calculation sub-module - Created using Google
sheets
• Results sub-module - Created using Google sheets
This 3 sub-module approach allows the administrator
to give restricted access to the individual
sub-module. Hence, he can effectively bifurcate who
can view/change which sub-module. This improves the
security of the model, so that only the right person
accesses the sub-modules.
Covered all costs across the value chain
All factors that affect the COPQ including Supplier-
related, Production-related & Customer-related costs
have been incorporated into this model.
COPQ can be obtained for any period of time
(hourly/daily/weekly etc)
The model is very flexible and can be used to
calculate COPQ for even small (like hourly also)
periods of time. As and when the data is inputted,
the values are calculated. It can also be used to work
in a near-real time basis, by entering the data in that
manner.
Easy usage and reproduction
The fundamental benefit of the model is the ease of
use and its power of scalability. The model can also
be replicated easily for other product lines.
Limitations and Future scope
Even though the proposed COPQ model has several
advantages through the salient features mentioned
above, it has some limitations, which can be
considered for the future scope. They are as below:
• The COPQ model proposed considers the
costing for the products based on the Absolute
costing method across several activities (process
stages). It does not consider all the intangible
14
Applied Research Series, 2017
costs involved and the opportunity costs involved
in poor quality. Hence, these additional costs,
which might be dynamic in nature must be
captured to make the model optimal.
• Also, the project scope defined had limited the
model to only three products – TR29, TR414 and
TR78A. Although the major processes involved
in manufacturing the valves were considered
here, a model consisting of all the valve
products, cores and accessories manufactured at
Triton Valves Ltd., must be considered so as to
obtain an overall picture of the entire COPQ
of the facility. In such a scenario, various
dependencies between the product categories
must be considered to make the model
optimal.
• The proposed COPQ model can be extended to
form a COQ model which takes into consideration
the prevention and appraisal costs in detail other
than the internal and external failure costs
considered in this model.
• The model uses Google Drive as the cloud-based
collaborative platform for capturing data,
calculating the COPQ and providing the results.
Better storage mechanisms can be achieved
through databases like MySQL, which provide
more secure querying and processing
capabilities. Data visualisation and processing
tools like Orange Canvas and Tableau can be
used for easier and more effective results
interpretation. They also support data mining to
uncover underlying patterns in the data captured.
Deeper analytics can be performed using them,
so that better decisions can be made.
Overall learnings from the project
This project exposed the team to various practical
aspects of COQ and COPQ. With respect to tyre valve
manufacturing, the team understood the various
processes involved in processing across the supply
chain. Also, the various critical stages and their
importance for calculating the overall COPQ was
understood. Various nuances in terms of the costing
structure for the various products were understood
and integrated to develop the overall model. The team
also got an opportunity to utilise their learnings
in other management subjects (such as cloud for
cross-platform collaboration) into this project.
Conclusions
This project has focussed on creating an efficient,
dynamic, secure and user-friendly model to calculate
the COPQ pertaining to 3 products - TR29, TR414 and
TR78A. The model has been well appreciated by the
client – Triton valves Ltd., for its flexibility, thought
process involved and satisfying the objectives laid
down initially. This model can be made operational in
reality by expanding it to include all the products
manufactured at Triton, so that the company can
get an overall picture of its COPQ. Continuous
monitoring of the results obtained through accurate
data input across the time period required aids in
effective and near real-time decision making.
References
(n.d.). Retrieved from tritonvalves.com: http://
www.tritonvalves.com/products.html
(n.d.). Retrieved from isixsigma.com: https://
www.isixsigma.com/dictionary/cost-of-poor-
quality-copq/
(2017). Retrieved from corrosionpedia.com: https://
www.corrosionpedia.com/definition/948/pull-
out-test
Carl Zeiss Industrial Metrology. (n.d.). Retrieved from
htt p s : / / w w w. ze i s s . co m /co ntent / d a m /
Industrial%20Metrology/us/img /Stages/
9 8 0 x 3 0 8/a u tomot ive_copq-a-work ing-
model.pdf
Crosby, P. B. (January 1979). Quality is Free: The Art of
Making Quality Certain.
Feigenbaum, A. V. (January 1991). Total Quality Con-
trol. Harvard business review.
Harrington, H. J. (1987). Poor Quality Costs. New York:
ASQC Quality Press.
Injection moulding. (n.d.). Retrieved from Wikipedia:
h t t p s : / / e n . w i k i p e d i a . o r g / w i k i /
Injection_moulding
iso.org. (2009). Retrieved from https://www.iso.org/
standard/52844.html
Ittner, C. D. (1999). Activity-based Costing Concepts
for Quality Improvement. European Manage-
ment Journal, 492-500.
15
Model for calculating cost of poor quality
Juran, J. A. (January 1989). Leadership for Quality.
Juran, J. M. (1951). “Quality Control Handbook”.
Rajurkar, A. (2016 , September 12). bodhost.com. Re-
trieved from https://www.bodhost.com/blog/
features-of-cloud-computing/
Sorqvist, L. (1997). EFFECTIVE METHODS for measur-
ing the cost of poor quality. Measuring Business
Excellence, Vol. 1 Iss: 2, 50 - 53.
Teemu Malmi, P. J. (2004). A Collaborative Approach
for Managing Project Cost of Poor Quality. Euro-
pean Accounting Review, Vol. 13(No. 2), 293–317.
testresources.net. (2017). Retrieved from http://
www.testresources.net/applications/test-types/
flexural-test/
tritonvalves.com/about_us. (n.d.). Retrieved from
tritonvalves.com: http://www.tritonvalves.com/
about_us.html