Embed Size (px)
DESCRIPTION
this is final year project on model based power system using smart grid
Citation preview
MODEL BASED POWER SYSTEM USING
SMART GRID
by
Muhammad Huzaifa Butt 1JV220BU11VZ
Bilal Shabbir 1JV220C211W7
Syed Ijlal Haider 1JV220BW11W1
A thesis submitted to the
Electrical Department
In partial fulfilment of the requirements for the degree of
BACHELOR OF SCIENCE IN ELECTRICAL ENGINEERING
Faculty of Engineering
MIRPUR UNIVERSITY OF SCIENCE AND TECHNOGY
Mirpur Azad Jammu & Kashmir
August, 2015

ii
Copyright © 2010 by MUST Student
All rights reserved. Reproduction in whole or in part in any form requires the prior
Written permission of Project Holders or designated representative.

iii
CERTIFICATE OF APPROVAL
It is certified that the research work titled “MODEL BASED POWER SYSTEM
USING SMART GRID” carried out by “Muhammad Huzaifa Butt, Bilal Shabbir,
and Syed Ijlal Haider”, Registration No “1JAV220BU11VZ” “1JV220C211W7”
“1JV220BW11W1” under the supervision of Engr. Shahbaz Baig at Mirpur University
of Science and Technology, Mirpur is fully adequate, in scope and in quality, as a thesis
for the degree of B.Sc. in Electrical Engineering.
Supervisor: ------------------------------
External Examiner: ------------------------------
Project Coordinator: ------------------------------
Chairman: ------------------------------
Dean: ------------------------------

iv
ACKNOWLEDGMENT
On the submission of our project, we would like to extend our appreciation and heartfelt
thanks to our supervisor Mr. Shahbaz Baig, Lecturer Faculty of Engineering, for
constant motivation and support during the course of our work. We truly appreciate and
value his esteemed guidance and encouragement from the beginning to the end of this
project. We also thank Engr. Shabbir Mirza, Chairman Electrical Engineering
Department, for giving us the opportunity to carry out a project of our own choice. The
faculty members of Mirpur University of Science and Technology has provided us with
the knowledge and assistance that constructed the foundation required in us to initiate
and follow through a project such as this, and for that we are grateful to all the teachers,
officers, and staff of the Electrical Engineering Department. Finally we would like to
express our gratefulness towards our parents and Almighty Allah for being there with
us thick and thin.

v
DECLARATION
It is declared that this is an original piece of our own work, except where otherwise
acknowledged in text and references. This work has not been submitted in any form for
another degree or diploma at any university or other institution for tertiary education
and shall not be submitted by me in future for obtaining any degree from this or any
other University or Institution.
Muhammad Huzaifa Butt
1JAV220BU11VZ
Bilal Shabbir
1JV220C211W7
Syed Ijlal Haider
1JV220BW11W1
August, 2015

vi
ABSTRACT
Electricity is distributed through existing electro-mechanical grid which has been
serving since nineteenth century. In our project titled ''Model Based Power System
Using Smart Grid'' we implemented bidirectional technique featuring peak load shifting
to valley and consumer’s energy cost minimization at residential level. Two major
categories of Load Management techniques, incentive based and dynamic pricing based
schemes have been discussed and compared.
Dynamic Pricing Base technique in our project is implemented by using 3-Light
Indicator System. In this technique the user would have three light indicators fitted
inside their house i-e (Green, Red, and Yellow). The tariff of usage during peak hours,
base load hours and valley hours would be predefined by the utility. During peak load
hours the red light indicator would automatically turn on which would tell the user that
high tariff would be charged during this time of the day so that they won't use the
equipment like iron, electric heaters, washing machines, air conditioners etc. During
base load hours the green light indicator would turn on and the user would know that
normal tariff would be charged if they'd use electricity. During valley hours the yellow
light indicator would turn on and the user would know that they'd be charged with very
low tariff by the utility. In this way the user would use less electricity during peak hours
and more during valley and they would be free from load shedding as load shedding
would shift into load shifting.

vii
Table of Contents
Acknowledgment…………………………………...……………………iv
Declaration……………………………………...……………………......v
Abstract ......................................... ………………………………………vi
Table of Contents ...................................................................................... vii
List of Figures………………………………………...............................xi
List of Tables ...........................................................................................xii
List of Acronyms.............................................................................. ...... xiii
Chapter 1
Introduction .............................................................................................................14
1.1 Overview ........................................................................................................14
1.1.1 Features of smart power grid...............................................................14
1.2 Statement of Problem......................................................................................15
1.2.1 Inefficiency at managing peak load.....................................................15
1.3 Purpose of Project...........................................................................................17
1.3.1 Dynamic Pricing Based.......................................................................18
1.3.2 Incentive based ...................................................................................19
1.4 Applications of the Project..............................................................................22
1.5 Summary.........................................................................................................23
Chapter 2
Literature review.........................................................................................................24
2.1 Related Techniques.........................................................................................24
2.1.1 Wireless Communication....................................................................24
2.1.2 Fibre Optics.........................................................................................25
viii
2.2 Related Projects...............................................................................................26
2.2.1 Automatic Meter Reading...................................................................26
2.2.2 Power Distribution Management……………………………….....…27
2.2.3 Status Monitoring and Control............................................................26
2.3 Related Studies................................................................................................26
2.3.1 Smart customers and smart home ......................................................26
2.3.2 Electric vehicles and Vehicle to Grid applications .............................26
2.3.3 Their limitations and bottlenecks.........................................................27
2.4 Summary..........................................................................................................29
Chapter 3
TOOLS AND TECHNIQUES..................................................................30
3.1 Hardware used with complete technical specifications....................................30
3.1.1 Supply Side Components................ ....................................................30
3.1.2 PC side components.............................................................................30
3.1.3 Relay Circuit........................................................................................31
3.1.4 Description of components .................................................................31
3.1.5 PC Circuit............................................................................................35
3.1.6 Loads side circuitry explanation..........................................................36
3.1.7 Supply side Circuitry and explanation ................................................36
3.1.8 Relays Circuit and explanation............................................................37
3.1.9 Transformers Circuit............................................................................37
3.2 Software, Simulation tools used.......................................................................38
3.2.1 Virtual Studio communicates with smart grid......................................38
3.2.2 C Sharp (C#) ........................................................................................38
3.2.3 Processing.............................................................................................38

ix
3.2.4 The programming used in Visual Basic ................................................38
3.2.5 Microcontroller Programming…………………………………….…..41
3.3 Summary..........................................................................................................46
Chapter 4
Methodologies and Implementation.........................................................47
4.1 Design of the investigation.............................................................................47
4.1.1 Objectives............................................................................................47
4.1.2 Background.........................................................................................47
4.1.3 Procedure.............................................................................................48
4.1.3 (a) Dynamic pricing based............................................................48
4.1.3 (b) Incentive based........................................................................48
4.2 Analysis procedures.........................................................................................49
4.3 Implementation procedure...............................................................................49
4.3.1 Details about hardware........................................................................49
4.3.1 (a) DC Supply Side Components...................................................49
4.3.1 (b) Controller section board...........................................................51
4.3.1 (c) Relay section board..................................................................52
4.3.1 (d) Pc Section Board......................................................................56
4.3.2 Details about software/ algorithms......................................................57
4.3.2 (a) visual studio..............................................................................57
4.3.2 (b) C sharp......................................................................................57
4.3.2 (c) Processing.................................................................................57
4.4 Verification of functionalities ........................................................................57
4.5 Summary..........................................................................................................58
x
Chapter 5
Results and Analysis.................................................................................59
5.1 Presentation of the findings..............................................................................59
5.1.1 Hardware results...................................................................................60
5.1.2 Software results....................................................................................61
5.2 Discussion of the findings ...............................................................................61
5.2.1 Comparison with initial Goal...............................................................64
5.2.2 Reasoning for short comings................................................................64
5.3 Limitations.......................................................................................................66
5.4 Recommendations............................................................................................66
5.5 Summary..........................................................................................................67
Chapter 6
Conclusion................................................................................................68
References ................................................................................................69

xi
LIST OF FIGURES
FIG-1.1 Major concern of electric utilities...............................................................16
FIG-1.2 Major concern of electricity consumers......................................................17
FIG-1.3 Peak Shifting...............................................................................................18
FIG-1.4 Power system model: Interaction b/w the supply & user............................19
FIG-2.1 Electrical Vehicle System...........................................................................27
FIG-3.1 Step down Transformer...............................................................................31
FIG-3.2 PIC 16F877A .........................................................,....................................32
FIG-3.3 Crystal Oscillator ...................................................,....................................32
FIG-3.4 Current Transformer....................................................................................33
FIG-3.5 Relay............................................................................................................33
FIG- 3.6 Bridge Rectifier...........................................................................................34
FIG-3.7 Voltage Regulator........................................................................................34
FIG-3.8 Optocoupler.................................................................................................35
FIG-3.9 PC Circuit....................................................................................................35
FIG-3.10 Load Side Circuitry.....................................................................................36
FIG-3.11 Supply Side Circuitry..................................................................................36
FIG-3.12 Relay Side Circuitry....................................................................................37
FIG-3.13 Transformer Circuit.....................................................................................37
FIG-4.1 Bridge Rectifier...........................................................................................50
FIG-4.2 Crystal Oscillator........................................................................................52
FIG-4.4 PNP Transistor............................................................................................54
FIG-4.7 MAX Module..............................................................................................56

xii
LIST OF TABLES
TABLE-1.1 Assessment of Incentive-based DLC & Dynamic Pricing based.............21
TABLE-5.1 Possible classification of utility-load management techniques................62
xiii
LIST OF ACRONYMS
DSM DEMAND SIDE MANAGEMENT
LM LOAD MANAGEMENT
DLC DIRECT LOAD CONTROL
HEMS HOME ENERGY MANAGEMENT SYSTEM
PL PEAK LOAD
LF LOAD FLOW
DSM DEMAND SIDE MANAGEMENT
14
Chapter 1
INTRODUCTION
1.1 Overview
The smart grid is a combination of the innovative data and communication technologies
to existing electro-mechanical power grid. Two way flow of data information and
power between supplier and end users is one of the major features of smart power grid.
It gives us the information data about the behaviour of supplier companies and end user
in an automated fashion so that to improve the effectiveness, reliability, economics, and
sustainability of the generation & distribution of electric power.
1.1.1 Features of smart power grid
Reliability (power availability at any cost )
Flexibility in network topology
Efficiency (capable of meeting increased consumer demand without adding
infrastructure )
Load adjustment
Peak levelling and time of use pricing
Demand Response
In ordinary Electromechanical Grid there is a one way communication of information
data between end users and supply companies. Most of these methods are widely
executed by the supply companies and the role of end users is insignificant. However,
integration of advanced communication-infrastructure allow two way flow of
information data hence provide more effectiveness in Load Management involving
both supply companies & end user.
Desire of managing the demand requirement in a way to shape properly the load profile
of power system was realize earlier. Presently it has developed the idea of demand side
operation management and is categorized by supply company procedure and it is
incentives for the end user in turn to take electricity use on ideal level all the time. Main
15
purposes of DSM are clipping of the peak, filling of the valley, shifting of the peak.
DSM can help the end user to minimize their utility costs & usage to reduce the use of
peak load generators or plants. It is obvious that the supply companies wants to shape
the load curve to be balanced with a minimize (PAR) peak to average ratio for all the
time while end user wants the availability of power supplies all the time at least amount
of cost.
Our project uses two types of Load Management schemes:
Dynamic-Pricing- Based
Incentive-Based
Dynamic pricing programs contain real-time costs, moment of usage costs, vital peak
cost etc. Motivation based (Incentive) programs comprise direct-load-control. Direct-
Load-Control takes action only in the event when peak demand passes through the
certain limit while dynamic-pricing is an on-going phenomenon. As it is very difficult
to respond dynamic pricing base technique by hand, the users require smart home
technology by automatically responding to the changes in cost by proper arrangement
of their home electronic equipment for most favourable cost. In smart grid demand
energy management can be implemented better.
1.2 Statement of Problem
Main problem utility companies are facing is the problem of shifting the peak load to
valley and the solution of that problem is our main objective in this project. Because
during peak loads that occur only for 2-3 hours during the whole day, demand rises
and supply is not enough. For that purpose the utility companies have to install new
generators or new plants which are to be used as peak load plants to supply the excess
demand during peak load. Installation of new generators or plants is hectic as well as
uneconomical. If they won't install new generators or plants it would result in load
shedding of the existing system which affects the reliability of power. Load shedding
is a major concern in developed countries. As the load increases it may harm the
equipment which would lead to blackout and equipment failure if load shedding is not
done and the equipment may get dysfunctional. Replacement of equipment is such a
costly task. For that purpose we've introduced two techniques in our project which we'd
16
discuss in the later part and for the same purpose smart grid is preferred over ordinary
grid.
1.2.1 Inefficiency at managing peak load
Demand of user changes all the time, so that the cost to meet user demands also changes
with time. For the existing power grid, power supply has to manage according to the
user demands continuously & the power grid also need to sustain a buffer of excess
electric supply, that results in reduction of efficiency, high emissions, and high costs.
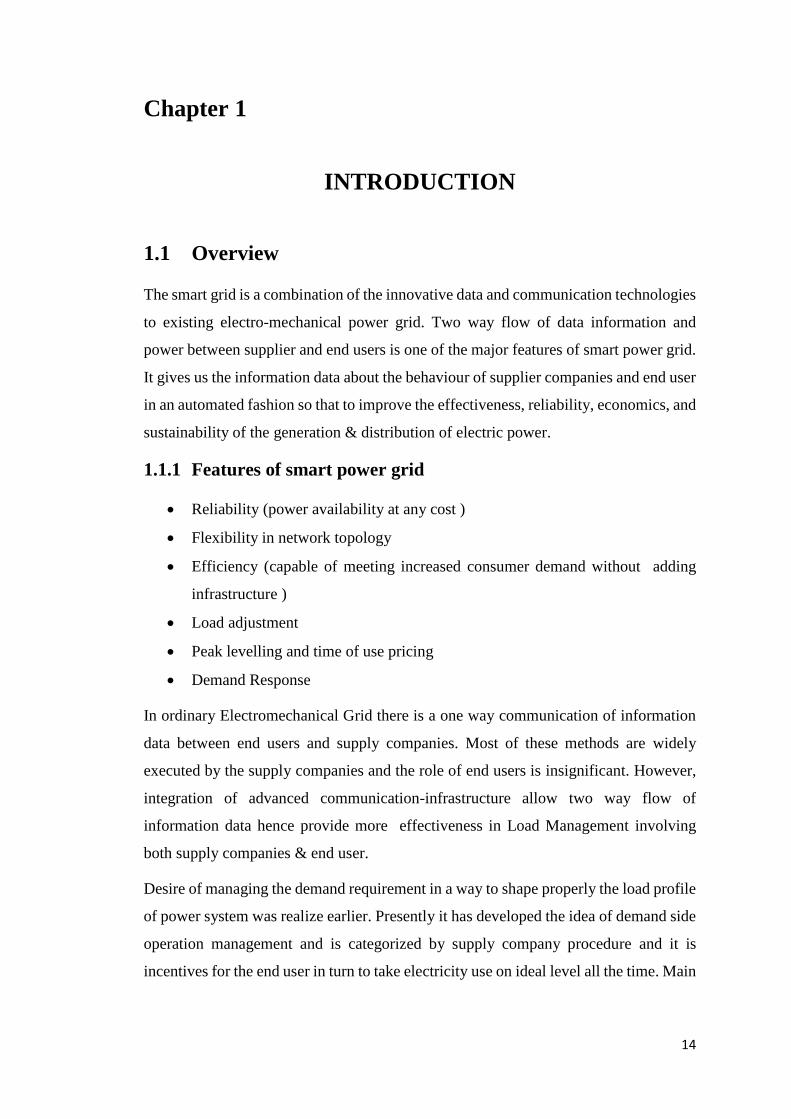
Management of peak load is a major unease of the utility companies as demand during
peak load puts pressure on steadiness of their system and the mismatch in
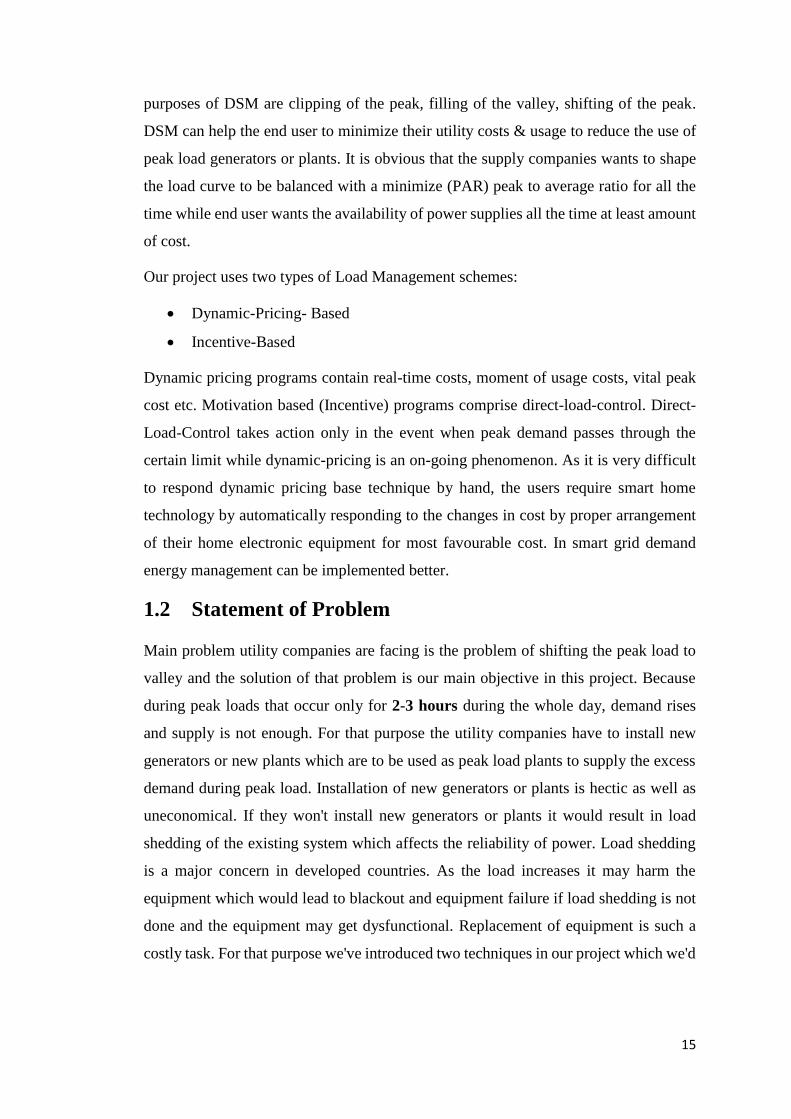
supply/demand and also becomes a cause of unfavourable financial effects. Major
concern of electrical utilities and consumer are shown in figure ( 1.1 and 1.2 )
Fig 1.1 Major concerns of electric utilities
17
Fig 1.2 Major concerns of electricity consumers
1.3 Purpose of Project
Main purpose of our project is to provide a solution to the problem that utility
companies face during peak loads in an efficient way which is suitable for both, utility
and the consumer as peak demand is of major concern for the utility companies.
In most utility companies flat cost schemes with constant price rates are being widely
used. Users face retail utility costs that are flat during the period of months or even
years.
Problem faced with flat cost schemes is the disconnection between short-term
marginal-electricity manufacturing costs and retail cost paid by user, which leads
towards ineffective overall source usage. Due to insufficient information on generating
price, utility usage behaviour of end-user may not regulate to supply side conditions.
Thus flats pricing results in suboptimal user behaviour as well as high electricity costs
than they would otherwise be in an optimally efficient system.
18
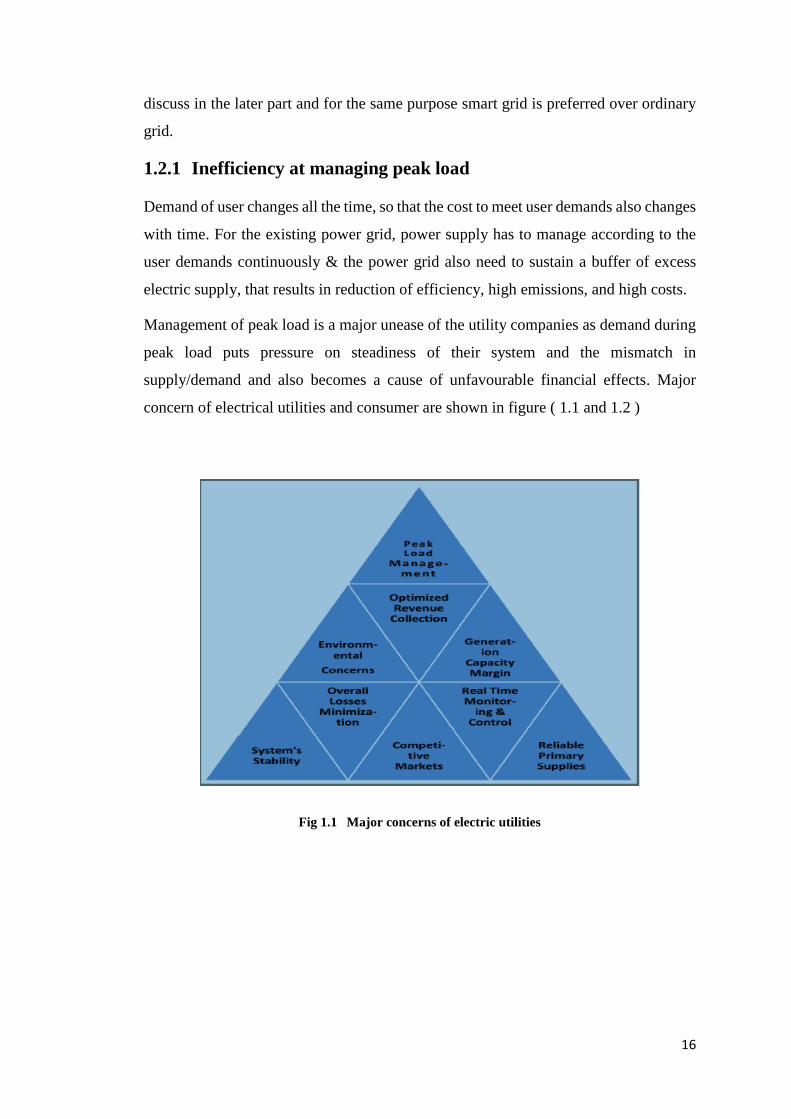
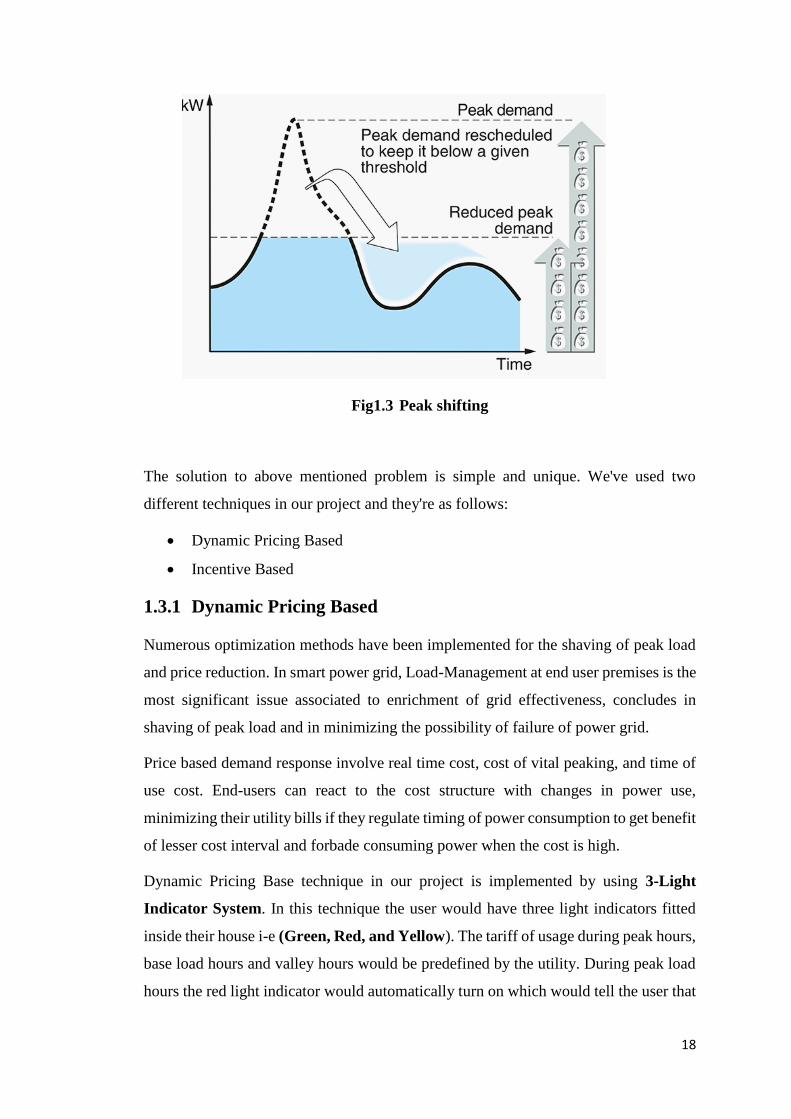
Fig1.3 Peak shifting
The solution to above mentioned problem is simple and unique. We've used two
different techniques in our project and they're as follows:
Dynamic Pricing Based
Incentive Based
1.3.1 Dynamic Pricing Based
Numerous optimization methods have been implemented for the shaving of peak load
and price reduction. In smart power grid, Load-Management at end user premises is the
most significant issue associated to enrichment of grid effectiveness, concludes in
shaving of peak load and in minimizing the possibility of failure of power grid.
Price based demand response involve real time cost, cost of vital peaking, and time of
use cost. End-users can react to the cost structure with changes in power use,
minimizing their utility bills if they regulate timing of power consumption to get benefit
of lesser cost interval and forbade consuming power when the cost is high.
Dynamic Pricing Base technique in our project is implemented by using 3-Light
Indicator System. In this technique the user would have three light indicators fitted
inside their house i-e (Green, Red, and Yellow). The tariff of usage during peak hours,
base load hours and valley hours would be predefined by the utility. During peak load
hours the red light indicator would automatically turn on which would tell the user that
19
high tariff would be charged during this time of the day so that they won't use the
equipment like iron, electric heaters, washing machines, air conditioners etc. During
base load hours the green light indicator would turn on and the user would know that
normal tariff would be charged if they'd use electricity. During valley hours the yellow
light indicator would turn on and the user would know that they'd be charged with very
low tariff by the utility. In this way the user would use less electricity during peak hours
and more during valley and they would be free from load shedding as load shedding
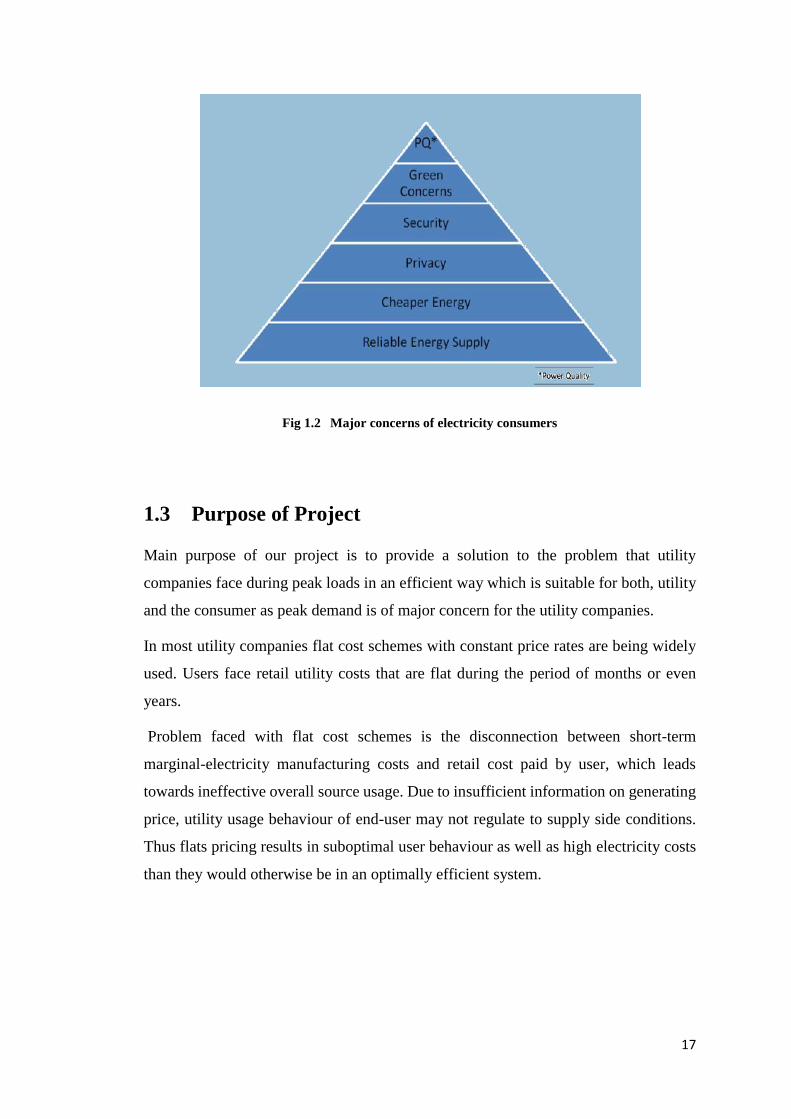
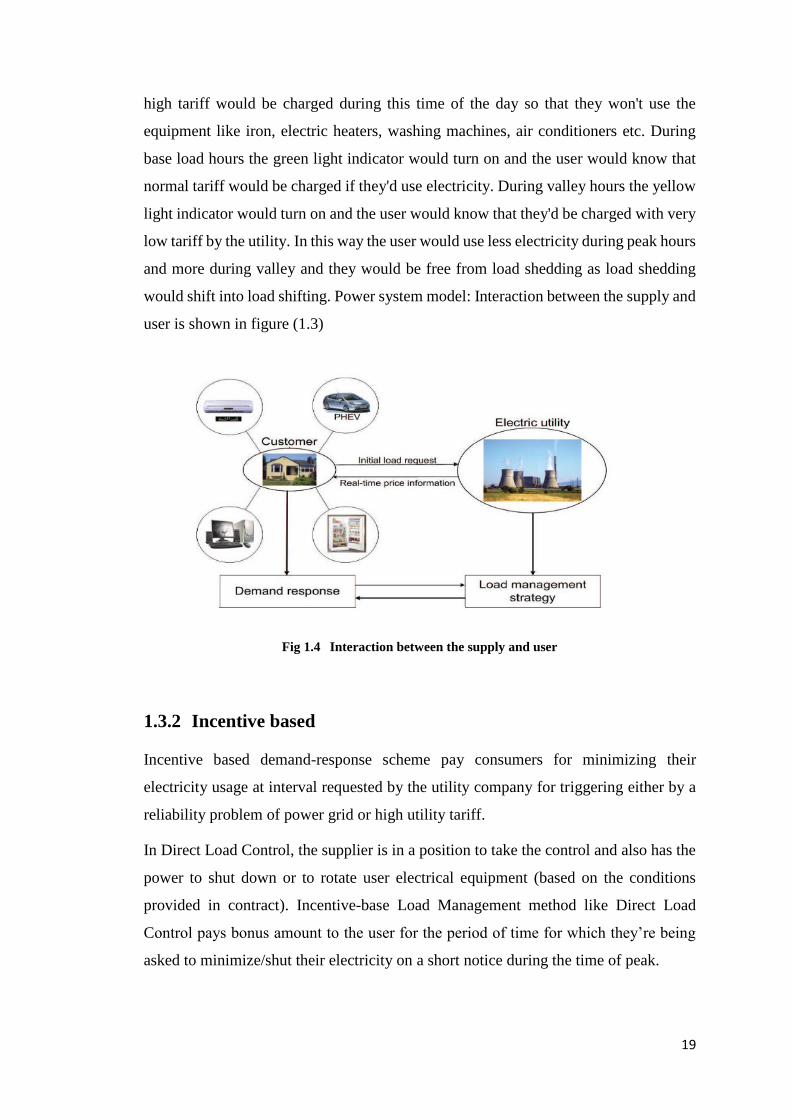
would shift into load shifting. Power system model: Interaction between the supply and
user is shown in figure (1.3)
Fig 1.4 Interaction between the supply and user
1.3.2 Incentive based
Incentive based demand-response scheme pay consumers for minimizing their
electricity usage at interval requested by the utility company for triggering either by a
reliability problem of power grid or high utility tariff.
In Direct Load Control, the supplier is in a position to take the control and also has the
power to shut down or to rotate user electrical equipment (based on the conditions
provided in contract). Incentive-base Load Management method like Direct Load
Control pays bonus amount to the user for the period of time for which they’re being
asked to minimize/shut their electricity on a short notice during the time of peak.

20
Incentive-based Direct Load Control methods perk up Load Management and enhance
the reliability of the power grid. Few disadvantages of these methods are confidentiality
and safety measures of the consumer. Importance of Direct Load Control is less about
small various domestic loads as numerous no. of devices are being controlled & little
monetary advantage is achieved through intense investment on the mechanism to be
controlled. Yet, this practice might be comparatively more effectual for intense
industrialized loads.
We've used this technique in our project too as the user has allowed the utility to control
to the control their load by using smart grid. It means that the utility company has the
control to turn off the appliances that use more electricity during peak load hours and
in return they would get incentive by the utility company in their monthly bill as main
concern of the user economic benefit.

21
Assessment of Incentive-based Direct Load Control and Dynamic Pricing based
l
Table 1.1

22
1.4 Applications of the Project
Monitoring of system (Real time supply structure checking may bring
numerous benefits to system function. By way of example, the idea can lead to
greater data involving nodal voltages as well as circuit loading circumstances
and that sends alarms to the operators of the system before any serious problems
occur.
Network Configuration (Network configuration may be assorted by means of
varying the particular opening/closing position of switchgear, physically or
even robotically)
Relay safety recordination ( This specific software tunes relay safety
adjustments instantly determined by established guidelines )
Outage management system ( The OMS is a system which is a combination
of demand management system tools and call centre trouble in identifying,
diagnosing and locating errors and then isolating these errors and for restoring
supply. It gives response to the clients that are affected by it )
Outage operations method ( This Outage Management System is a method
that mixes the problem call centre as well as DMS methods to distinguish,
analyse as well as track down defects, next isolate the defects as well as re-
establish supply.
Restoration Of Supply (Remedial activity is dependent upon your seriousness
with the problem. In the event the wrong doing can be a straightforward
problem, your field team may make your mend and also recover materials
eventually. In the event the wrong doing leads to an essential outage, following
the remote location with the faulted place, the portions without any fault will be
reconditioned applying normal open points)
Analysis and Recording of Event (Any event of outage is going to be analysed
along with the facts stored as being a traditional report to be able to report the
main cause, quantity of consumers damaged and also timeframe. These kinds
of facts can be used regarding figuring out overall performance data)
In Home Enabling Technology (Customer aggregation and Disaggregation
required for peak shift )

23
1.5 Summary
Smart power grid is a combination of innovative communication and data technologies
that are being used in our existing power grid. Two way communications of data, power
and information b/w supplier and consumer is a major feature of smart power grid
station. Management of demand side is one of the important features of smart grid.
Main purpose of our project is to provide a solution to the problem that utility
companies face during peak loads in an efficient way which is suitable for both, utility
and the consumer as peak demand is of major concern for the utility companies. In
smart grid Load-Management at end user premises is the most significant issue
associated to improvement of effectiveness of power grid, as it results into the shaving
of peak load and compact possibility of failures of power grid. This could be done by
using dynamic pricing scheme and incentive base direct load control scheme. Price
based demand response involve real time cost, cost of vital peaking, and time of use
cost. In Direct Load Control, the supplier gets the control & has power of shutting down
or cycling user equipment (based on conditions provided in contract). Incentive-base
Load Management method like Direct Load Control pays bonus amount to the user for
the period of time for which they’re being asked to minimize/shut their electricity on a
short notice during the time of peak.
24
Chapter 2
LITERATURE REVIEW
2.1 Related Techniques
Techniques related to smart grid for data communication are as follows:
Wireless Communication
Fibre Optics
2.1.1 Wireless Communication
Wireless communication is a technique use to send and receive data between two
points. Techniques used in wireless communication are as follow
GSM
Radio
Radio
Radio is a wireless transmission of Electromagnetic energy via space. Radio waves are
used to carry data i.e. sound and other signals by modulating their frequency, amplitude,
phase and pulse width. As radio waves collides with antenna field oscillation produce
current in the antenna coil which is alternating in nature. Then the radio wave is
demodulated to extract information and convert it into original signal. As such radio
communication is inexpensive way of communication but the major drawback is
“Accuracy” because this communication is weather dependent and abnormal weather
can disturb signal waves which result in information loss. It cannot be transmitted over
long distance because of limited range of radio signal.
GSM
Global System for mobile communication is a technology of digital mobile phones and
used all over the world .GSM converts data in digital form and packs it and after that
25
transmits it on a channel with two different surges of data consumer, in its own
particular time slot. It works at either the 900 MHz or 1800 MHz band.
As GSM is inexpensive way of communication but the major drawback is “Accuracy”
because in GSM that different users have the same data transfer bandwidth. With
enough users, the transmission can experience interference. Another drawback of GSM
is that it can interfere with different electrical devices.
2.1.2 Fibre Optics
Fibre-optic communication is a method for data transmission of starting with one spot
to the next by sending beats of photons by an optical fibre. The photons form an
electromagnetic wave that is modulated to convey information.
The procedure of communication using optics fibre includes steps as follows:
Formation of the optical signal and transferring the light (signal) with the help of fibre,
guaranteeing that the light(signal) does not turn out to be excessively twisted or feeble,
receiving the particular indication, in addition to modifying in excess of it in a power
indication.
Fibre optics technique used for communication is an expensive communication
technique because of high initial cost of optical fibre, transmitter & receiver. It cannot
convey electrical energy for terminal electrical equipment.
26
2.2 Related Projects
2.2.1 Automatic Meter Reading
By using smart meter technology we can transmit meter data (consumed units) to its
host for billing purposes. By using it time and cost can be saved. Also theft is being
stopped.
2.2.2 Power Distribution Management
Companies like NTDC (National transmission and distribution companies) in Pakistan
use this technique for protection of relays and for communication purposes.
2.2.3 Status Monitoring and Control
By using smart grid communication system we can display the status information such
as voltage levels, consumption of units, tariff rates to the users and the user can manage
its own load and tariff efficiently.
2.3 Related Studies
2.3.1 Smart customers and smart home
In these type of projects/studies we require customers to participate actively. Without
their participation these studies/projects are of no use. Analysing the behaviour and
involvement of consumers is the main objective.
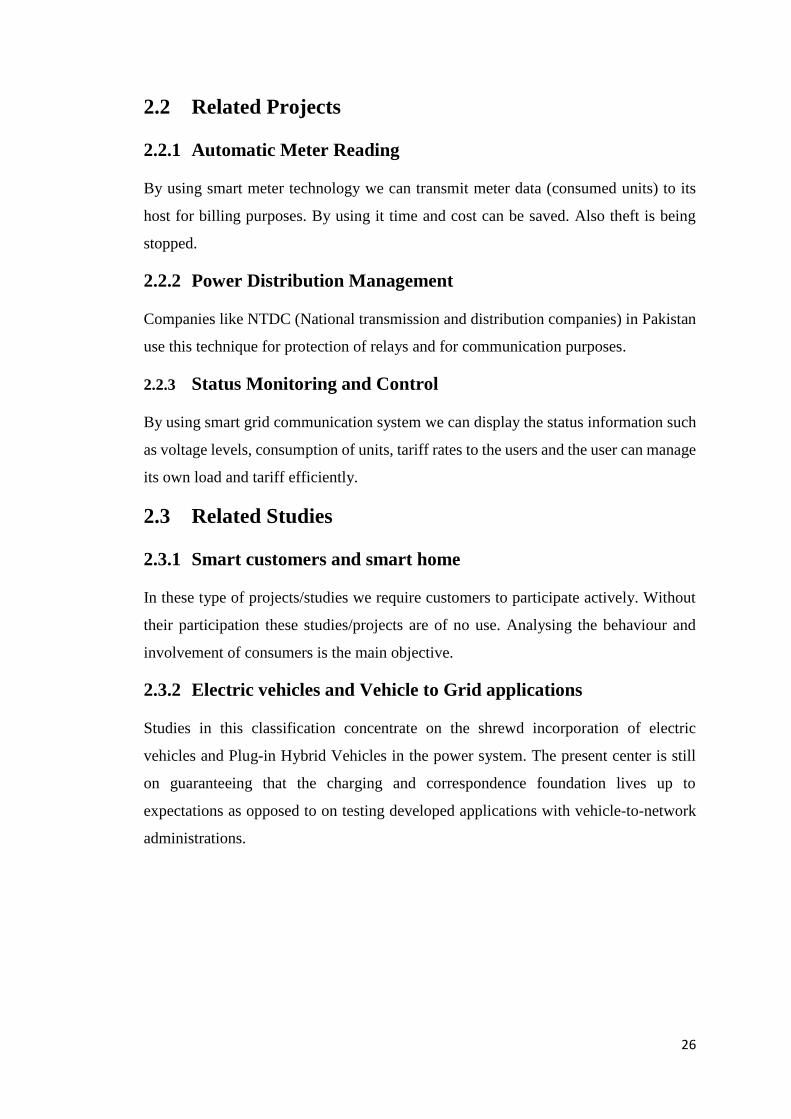
2.3.2 Electric vehicles and Vehicle to Grid applications
Studies in this classification concentrate on the shrewd incorporation of electric
vehicles and Plug-in Hybrid Vehicles in the power system. The present center is still
on guaranteeing that the charging and correspondence foundation lives up to
expectations as opposed to on testing developed applications with vehicle-to-network
administrations.
27
Fig 2.1 Electrical vehicles to smart grid
2.3.3 Their limitations and bottlenecks
Wireless systems are liable to any interference that occurs from electromagnetic
sources, and the signal quality is extraordinarily diminished by numerous water
containing items or building materials.
The vicinity in the region of things, for example, microwave broilers, D-E-C-T
telephones, wire-confined entryway glass, individuals, apparatus, and numerous
different stuff in the vicinity will drastically lessen the throughput and unwavering
quality of the establishment; such impedance may go back and forth relying upon the
operation and development of articles, and an estimation of obstruction once would say
nothing in regards to the extent of impedance at some other occasion.
Radio communication is inexpensive way of communication but the major drawback is
“Accuracy” because this communication is weather dependent and abnormal weather
can disturb signal waves which result in information loss. It cannot be transmitted over
long distance because of limited range of radio signal.
GSM is inexpensive way of communication but the major drawback is “Accuracy”
because in GSM that different user has the same data transfer bandwidth. With enough

28
users, the transmission can experience interference. Another drawback of GSM is that
it can interfere with different electrical devices.
Fibre optics is an expensive communication technique because of high initial cost of
optical fibre, transmitter & receiver. It cannot convey electrical energy for terminal
electrical equipment.
29
2.4 Summary
The related techniques to Smart Grid are Wireless (Radio Communication, GSM) and
Fibre optics communication. Wireless communication is a technique use to send and
receive data between two points; Radio is a wireless transmission of Electromagnetic
energy via space. (GSM) is a digital mobile phones technology and used all over the
world. Fibre-optic communication is a method for data transmission of starting with
one spot to the next by sending beats of photons by an optical fibre. Related projects
are automatic meter reading, status monitoring and control and power distribution
management. Related researches in two way communication using smart grid are smart
customers & smart home and electric vehicles and vehicles to grid applications.
Wireless communication such as radio communication and GSM has low accuracy
level due to interference of electronic equipment. Radio communication and GSM are
inexpensive ways but low accurate as compare to fibre optics which has high accuracy
level but expensive in cost.

30
Chapter 3
TOOLS AND TECHNIQUES
3.1 Hardware used with complete technical specifications
We divided our complete project into two main sections. Section one is circuit board of
supply side and the other section is further separated into pc side circuit, relay circuitry,
transformer circuit and load side circuit. Components and their description is discussed
below.
3.1.1 Supply Side Components
Step-down transformer (12V & 8amp)
Bridge Rectifier
Diodes (1K)
Capacitor (1000uf)
3.1.2 PC side components
PIC Micro controller 16F877A
LCD (16*4)
Convertor
Voltage Regulator (LM 7805)
Capacitor (10uf)
Temperature sensor and Current Transformer
PC connector
Diodes (220 ohm)
Transistors (A1015)
Crystal Oscillator (5MHz)
Analogue to Digital Convertor
31
3.1.3 Relay Circuit
4 relay switches (12V)
Optocoupler (EL817 C218)
Bridge Rectifier
LED's Blue (5mm)
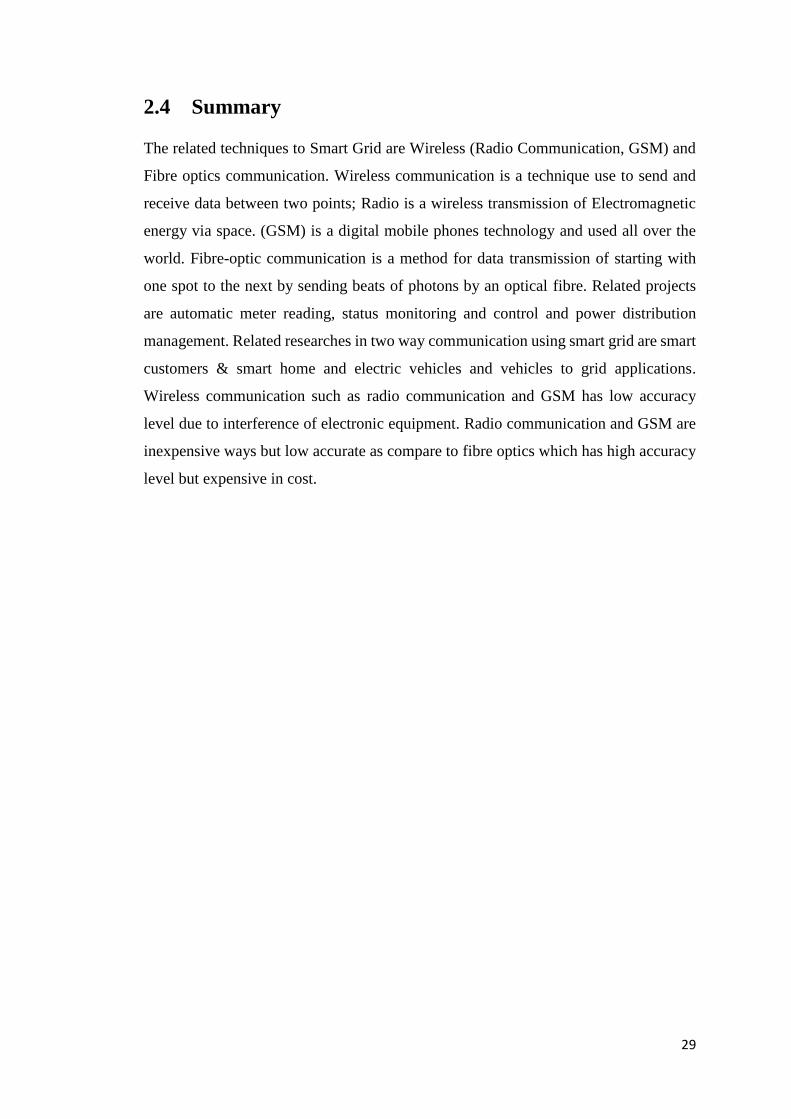
3.1.4 Description of components
Transformer at supply side
It converts 220V to 12V and 50 mA
Fig 3.1 step-down transformer
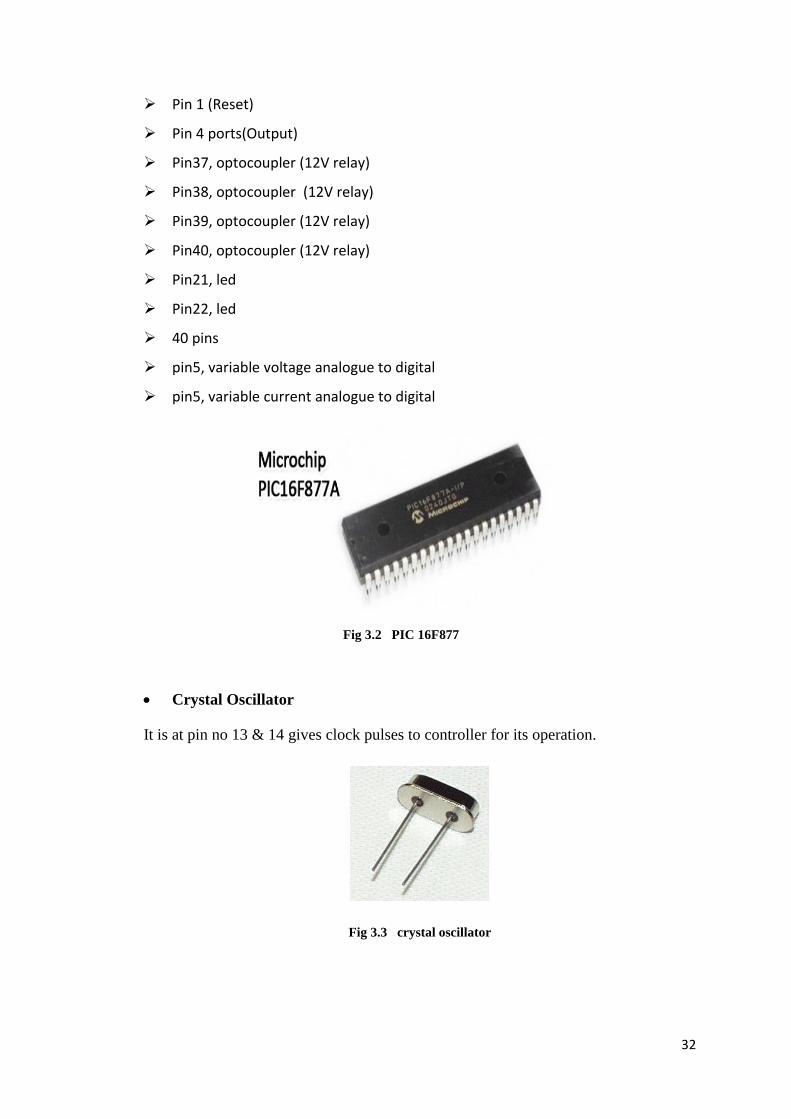
Microcontroller ( 16F877A )
It is used in project for data communication between the grid, loads connected and the
PC monitoring and for the proper functioning of the system to make it reliable.
Pin Configuration
pin5, variable temperature analogue to digital
Pin5, constant oil analogue to digital
Pin 11, (+5v)
Pin 12, 31 (Ground)
Pin 13, 14 (crystal oscillator)
32
Pin 1 (Reset)
Pin 4 ports(Output)
Pin37, optocoupler (12V relay)
Pin38, optocoupler (12V relay)
Pin39, optocoupler (12V relay)
Pin40, optocoupler (12V relay)
Pin21, led
Pin22, led
40 pins
pin5, variable voltage analogue to digital
pin5, variable current analogue to digital
Fig 3.2 PIC 16F877
Crystal Oscillator
It is at pin no 13 & 14 gives clock pulses to controller for its operation.
Fig 3.3 crystal oscillator

33
Variables Analogue to Digital Convertor
It is at pin no 2, 3, 4 & 5 to which 4 analogue inputs voltage, current, temperature and
oil level are given. Voltage, Current, Temperature levels of loads are shown on PC
screen. If they increase their operation levels red indication on screen will indicate us.
Current Transformer
It will operate relays and then load. CT will examine the current to loads. CT will accept
AC from transformer and is converted to DC by the four diodes and the load resistors
maintain voltage up to 5V
Fig 3.4 Current Transformer
Relays JQC-37F( T73 ) DC12V
They are connected at pin no 37, 38, 39, 40. They are given 12V from transformer first
Optocoupler have LED's at one side and photo diodes at other. Photo diodes will give
power to transistor and then transistor operates relays. Relays transfers power to loads
Fig 3.5 Relay
34
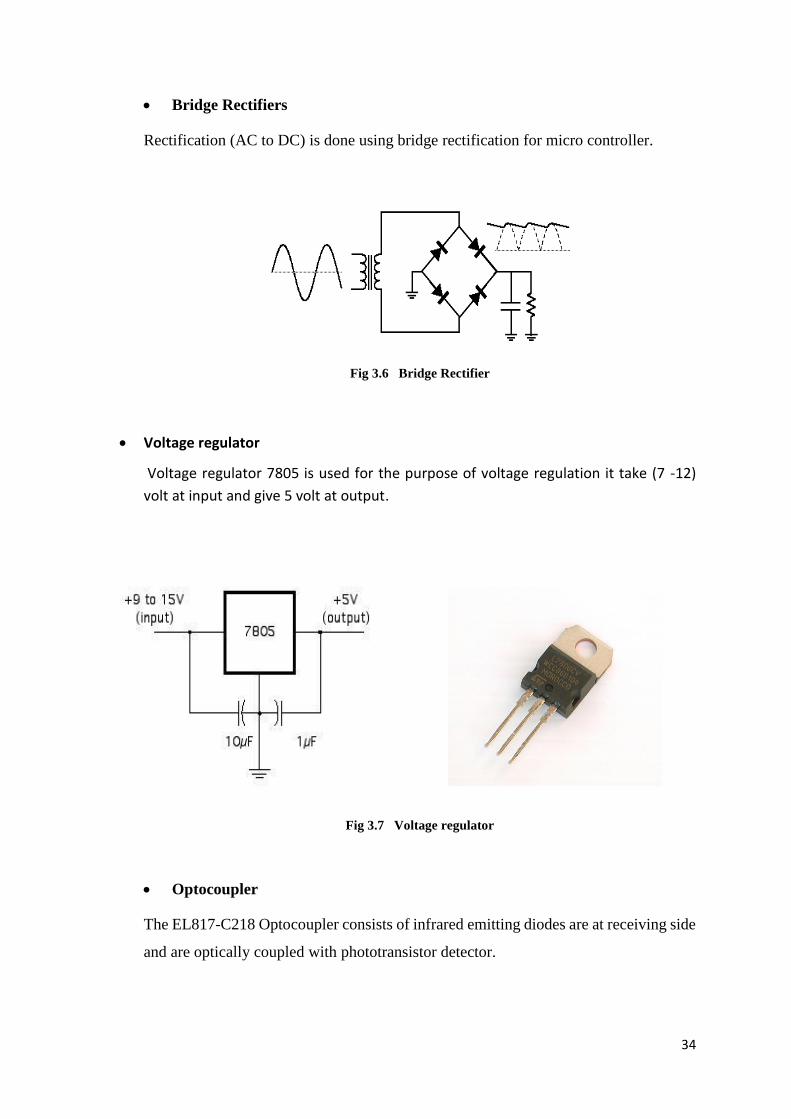
Bridge Rectifiers
Rectification (AC to DC) is done using bridge rectification for micro controller.
Fig 3.6 Bridge Rectifier
Voltage regulator
Voltage regulator 7805 is used for the purpose of voltage regulation it take (7 -12)
volt at input and give 5 volt at output.
Fig 3.7 Voltage regulator
Optocoupler
The EL817-C218 Optocoupler consists of infrared emitting diodes are at receiving side
and are optically coupled with phototransistor detector.
35
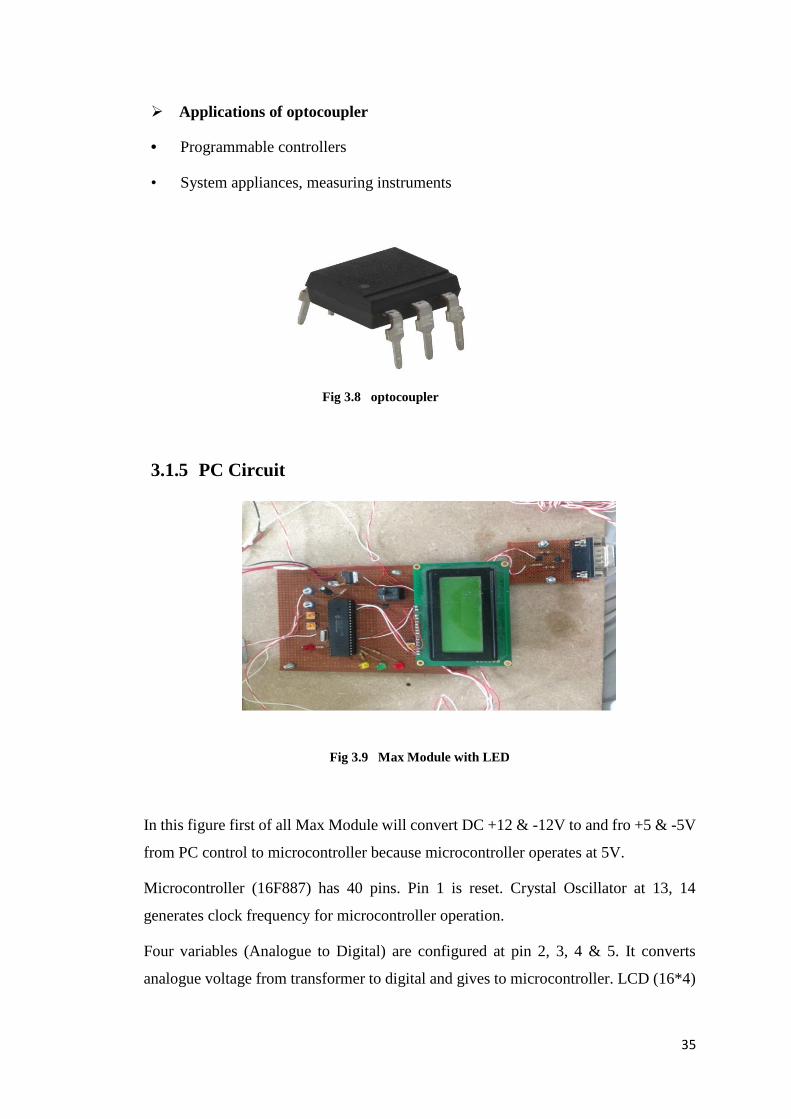
Applications of optocoupler
• Programmable controllers
• System appliances, measuring instruments
Fig 3.8 optocoupler
3.1.5 PC Circuit
Fig 3.9 Max Module with LED
In this figure first of all Max Module will convert DC +12 & -12V to and fro +5 & -5V
from PC control to microcontroller because microcontroller operates at 5V.
Microcontroller (16F887) has 40 pins. Pin 1 is reset. Crystal Oscillator at 13, 14
generates clock frequency for microcontroller operation.
Four variables (Analogue to Digital) are configured at pin 2, 3, 4 & 5. It converts
analogue voltage from transformer to digital and gives to microcontroller. LCD (16*4)

36
will display the ongoing voltages, currents, temperature and fixed oil level as well as is
also displayed on PC screen.
3.1.6 Loads side circuitry explanation
Fig 3.10 Bulb shown as load
The Bulbs shown are our load which will be turned on one by one through control keys
on computer and their respective values are monitored. Extra load than rated value will
be indicated by red indicator on the screen as is continually being monitored.
3.1.7 Supply side Circuitry and explanation
Fig 3.11 DC supply
Supply side is shown in above figure. It has a step-down transformer that steps down
nominal 220V to 12V. Rectifier circuit will change AC to DC and is filtered by
capacitor for the operation of circuit ahead.
37
3.1.8 Relays Circuit and explanation
Fig 3.12 Relay Section
In the above figure 4 relays configured at pin 37, 38, 39 & 40 with transistors and
optocoupler are used.
Relays are given 12V from the main DC. Optocoupler operates from microcontroller.
Optocoupler have LEDS's at one end that uses 5V of microcontroller and photo diodes
at other end uses 12V of main supply. LED light will short circuit the photo diodes and
gives power to transistors and then relay gets turned on. Relay will transfer 12V to
bulbs. Negative of all bulbs is common
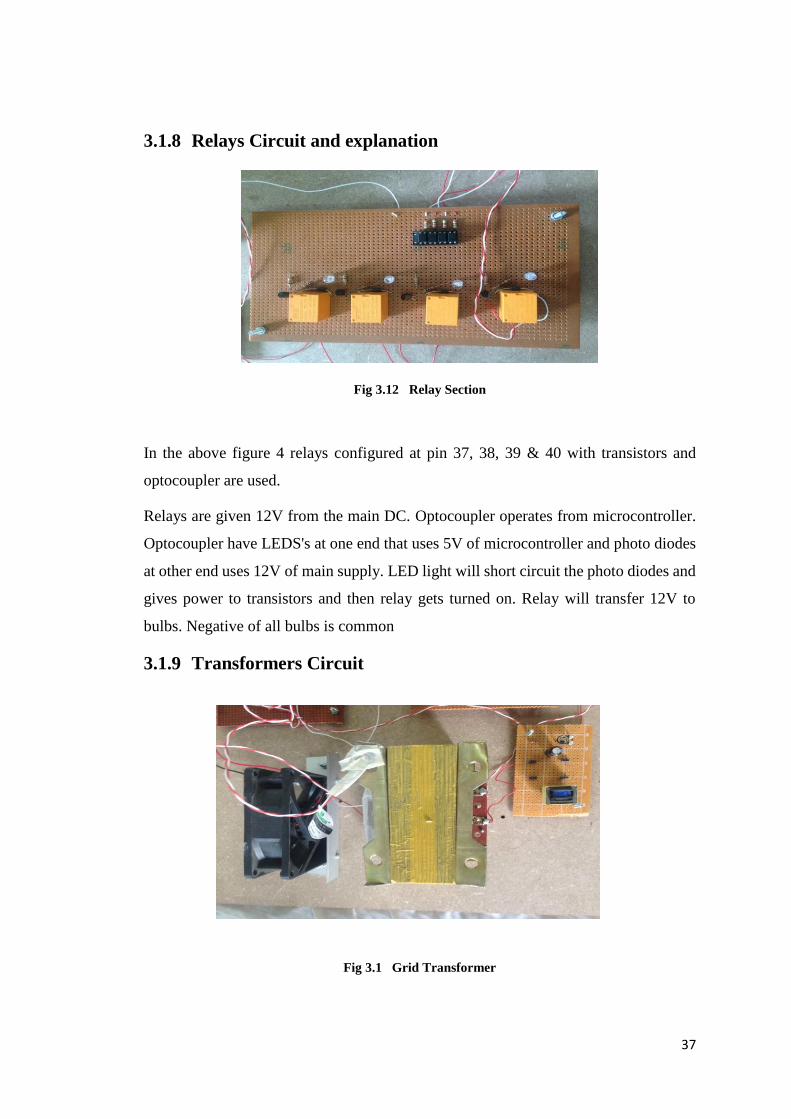
3.1.9 Transformers Circuit
Fig 3.1 Grid Transformer

38
In this figure a step-down transformer, current transformer and a fan is used. Step-down
transformer has a temperature sensor on its top end connected that senses its
temperature during operation. Temperature above than rated is limited by turning fan
on. 12V output from transformer is converted to 12V DC by the bridge rectifier.
Temperature sensor on step down transformer used has thrush hold limit 60 degrees.
3.2 Software, Simulation tools used
3.2.1 Virtual Studio communicates with smart grid
As mention before Microsoft virtual basic is compatible of every programming
language for e.g. C++, JAVA, Virtual Basic and many other introduced earlier in our
project of smart grid we have used C sharp language for the communication of GUI
with Smart Grid.
3.2.2 C Sharp (C#)
It is denoted as C#. This language is general purpose language, OOP language, modern
and simple.
It is suitable for applications written or both embedded system and hosted system. The
application written is C# language or economical in requirement of memory and
processing power.
3.2.3 Processing
Basically Microsoft Visual studio uses serial port of computer for communication. In
this we have one transfer pin and one receiving pin. There are interrupts use for deciding
whether to transmit or receive data for processor. If a device requires data from
transmitter and then it send an interrupting signal to microcontroller that stops its
processing and transmit data to that particular device at remote end.
3.2.4 The programming used in Visual Basic software is as follows
Private Sub Device1_Click ()
On Error Resume Next
If device1.Caption = "Load1 ON" Then
MSComm1.Output = "1"
device1.Caption = "Load1 OFF"
speedup.Enabled = True
ElseIf device1.Caption = "Load1 OFF" Then
MSComm1.Output = "2"
39
device1.Caption = "Load1 ON"
speedup.Enabled = False
speeddown.Enabled = False
End If
End Sub
Private Sub Device2_Click()
On Error Resume Next
If device2.Caption = "Load2 ON" Then
litoffpic.Visible = False
litonpic.Visible = True
MSComm1.Output = "3"
device2.Caption = "Load2 OFF"
ElseIf device2.Caption = "Load2 OFF" Then
litoffpic.Visible = True
litonpic.Visible = False
MSComm1.Output = "4"
device2.Caption = "Load2 ON"
End If
End Sub
Private Sub Device4_Click()
On Error Resume Next
If device4.Caption = "Load4 ON" Then
MSComm1.Output = "7"
device4.Caption = "Load4 OFF"
ElseIf device4.Caption = "Load4 OFF" Then
MSComm1.Output = "8"
device4.Caption = "Load4 ON"
End If
End Sub
Private Sub Device5_Click()
On Error Resume Next
If device5.Caption = "All Loads OFF" Then
MSComm1.Output = "9"
device5.Caption = "All Load5 ON"
ElseIf device5.Caption = "All Load5 ON" Then
MSComm1.Output = "0"
device5.Caption = "All Loads OFF"
End If
End Sub
Public Sub startbtn_Click()
On Error Resume Next
If startbtn.Caption = "Start" Then
MSComm1.CommPort = comtxt.Text
If MSComm1.PortOpen = False Then
MSComm1.PortOpen = True
End If
startbtn.Caption = "Stop"
Timer1.Enabled = True
Timer2.Enabled = True
Timer3.Enabled = True
comtxt.Enabled = False
h1temp.Text = ""
40
h2temp.Text = ""
h1hum.Text = ""
h2hum.Text = ""
h1gas.Text = ""
h2gas.Text = ""
txtxt.Text = ""
Else
If startbtn.Caption = "Stop" Then
Text1.Text = " "
comtxt.Enabled = True
MSComm1.PortOpen = False
startbtn.Caption = "Start"
Timer1.Enabled = False
Timer2.Enabled = False
txtxt.Enabled = False
End If
End If
End Sub
Private Sub Timer1_Timer()
timelbl.Caption = Time
datelbl.Caption = Date
End Sub
Private Sub Timer2_Timer()
On Error Resume Next
MSComm1.InputLen = 4
rxtxt.Text = MSComm1.Input
id.Text = Mid(rxtxt.Text, 4, 1)
If id.Text = "$" Then
h2temp.Text = Mid(rxtxt.Text, 1, 3)
If h2temp.Text < 10 Then
h2tempalarm.Visible = True
Else
h2tempalarm.Visible = False
End If
End If
If id.Text = "%" Then
h2hum.Text = Mid(rxtxt.Text, 1, 3)
If h2hum.Text > 50 Then
h2humalarm.Visible = True
Else
h2humalarm.Visible = False
End If
End If
If id.Text = "^" Then
h2gas.Text = Mid(rxtxt.Text, 1, 3)
If h2gas.Text > 45 Then
h2gasalarm.Visible = True
Else
h2gasalarm.Visible = False
End If
End If

41
If id.Text = "!" Then
h1temp.Text = Mid(rxtxt.Text, 1, 3)
If h1temp.Text < 50 Then
h1tempalarm.Visible = True
Else
h1tempalarm.Visible = False
End If
End If
End Sub
Private Sub Timer3_Timer()
On Error Resume Next
MSComm1.Output = "x"
End Sub
3.2.5 The programming used in Microcontroller is
Device 16F877A
XTAL 4
ALL_DIGITAL = True
''''''''''''''''''''''''''''''''''''
Declare LCD_TYPE 0 'in case we use alphanumeric then type 0 if
graphical then 1
Declare LCD_DTPIN PORTD.4 'this show that 4 pin interface with lcd
and 4 data pins will start from b4....b7
Declare LCD_RSPIN PORTD.2 'declaring lcd reset pin
Declare LCD_ENPIN PORTD.1 'declaring enable pin
Declare LCD_RWPIN PORTD.0 'declaring read write pin
Declare LCD_LINES 2 'telling how much rows lcd has
Declare LCD_INTERFACE 4 '
''''''''''''''''''''''''''''''''''''''''
''''''''''''SERIAL SETTINGS'''''''''''''
''''''''''''''''''''''''''''''''''''''''
HSERIAL_BAUD = 9600 ' Set baud rate to 9600
HSERIAL_RCSTA = %10010000 ' Enable serial port and continuous
receive
HSERIAL_TXSTA = %00100100 ' Enable transmit and asynchronous mode
HSERIAL_CLEAR = On ' Enable Error clearing on received
character
Symbol relay1=PORTB.7
Symbol relay2=PORTB.6
Symbol relay3=PORTB.5
Symbol relay4=PORTB.4
Symbol relay5=PORTB.3
Symbol fan=PORTB.1
Symbol alarm=PORTB.0
Dim AD_RESULT As Word
Dim sum As DWord
Dim ad0average As DWord
Dim ad1average As DWord
Dim ad2average As DWord

42
Dim ad3average As DWord
Dim i As Word
Dim receive As Byte
Low PORTB
'MAIN PROGRAM STARTS HERE
main:
Print At; 1, 1, " Welcome to FYP"
Print At; 2, 1, " Project"
DelayMS 3000
Cls
While 1 = 1
HRSin {2000,AA},receive
'HRSOut receive
If receive = "1" Then
High relay1
End If
If receive = "2" Then
Low relay1
End If
If receive = "3" Then
High relay2
End If
If receive = "4" Then
Low relay2
End If
If receive = "5" Then
High relay3
End If
If receive = "6" Then
Low relay3
End If
If receive = "7" Then
High relay4
End If
If receive = "8" Then
Low relay4
End If
If receive = "9" Then
High relay5
43
End If
If receive = "0" Then
Low relay5
End If
If receive = "x" Then
ad0average = 0
ad1average = 0
ad2average = 0
ad3average = 0
For i = 1 To 100 Step 1
AD_RESULT = ADIn 0
ad0average = ad0average + AD_RESULT
Next
ad0average = ad0average / 900
For i = 1 To 100 Step 1
AD_RESULT = ADIn 1
ad1average = ad1average + AD_RESULT
Next
ad1average = ad1average / 900
For i = 1 To 100 Step 1
AD_RESULT = ADIn 4
ad2average = ad2average + AD_RESULT
Next
ad2average = ad2average / 1000
For i = 1 To 100 Step 1
AD_RESULT = ADIn 5
ad3average = ad3average + AD_RESULT
Next
ad3average = ad3average / 1000
HRSOut DEC3 ad0average, "$"
DelayMS 200
HRSOut DEC3 ad1average ,"%"
DelayMS 200
HRSOut DEC3 ad2average ,"^"
DelayMS 200
HRSOut DEC3 ad3average ,"!"
DelayMS 200
End If
AA:
ad0average = 0
ad1average = 0
ad2average = 0
ad3average = 0
For i = 1 To 100 Step 1
44
AD_RESULT = ADIn 0
ad0average = ad0average + AD_RESULT
Next
ad0average = ad0average / 900
For i = 1 To 100 Step 1
AD_RESULT = ADIn 1
ad1average = ad1average + AD_RESULT
Next
ad1average = ad1average / 900
For i = 1 To 100 Step 1
AD_RESULT = ADIn 4
ad2average = ad2average + AD_RESULT
Next
ad2average = ad2average / 1000
For i = 1 To 100 Step 1
AD_RESULT = ADIn 5
ad3average = ad3average + AD_RESULT
Next
ad3average = ad3average / 1000
Print At; 1, 1, "V:", DEC3; ad0average
Print At; 1, 9, "I:", DEC5; ad1average
Print At; 2, 1, "Temp:", DEC3; ad2average
Print At; 2, 9, " Oil:", DEC3; ad3average
Print At; 3, -3, "Load:", DEC5; ad0average * ad1average
If ad0average < 10 Then
Print At; 4, -3, "LV"
High alarm
Else
Low alarm
Print At; 4, -3, " "
End If
If ad1average > 50 Then
Print At; 4, 1, "HC"
High alarm
Else
Low alarm
Print At; 4, 1, " "
End If
If ad2average > 60 Then
Print At; 4, 5, "HT"
High alarm
High fan
Else
Low alarm
Low fan
Print At; 4, 5, " "
End If
If ad3average < 50 Then
Print At; 4, 9, "LO"

45
High alarm
Else
Low alarm
Print At; 4, 9, " "
End If
' DelayMS 5000
Wend

46
3.3 Summary
In this chapter we have enlisted all the components used in our project and their brief
description. Coding is done using Microsoft Visual studio that uses serial port of
computer for communication and also C sharp language for the communication of GUI
with Smart Grid.
We have one transfer pin and one receiving pin. There are interrupts engaged for
deciding whether to transmit or receive data for processor. If a device requires data
from transmitter and then it send an interrupting signal to microcontroller that stops its
processing and transmit data to that particular device at remote end. We uses original
images of our project by section wise and the function of each one is discussed briefly.
47
Chapter 4
Methodologies and Implementation
4.1 Design of the investigation
4.1.1 Objectives
Smart grid allows two way communication of information b/w the supplier and the user
by implementation of the innovative data and communication technologies to existing
electro-mechanical power grid. One of the most important feature of smart grid is the
demand side management of the system. The major concerns of utilities is that how to
deal with peaks that makes the system unstable or require the use of peek generators
and plants. Main purposes of DSM are clipping of the peak, filling of the valley, shifting
of the peak. DSM can help the end user to minimize their utility costs & usage to reduce
the use of peak load generators or plants.
Our objective of demand side management is achieved by the implementation of the
following methods.
Dynamic pricing based
Incentive based
The method of implementation of these two is presented later in the article.
4.1.2 Background
The smart grid technology is implemented to existing grid to overcome flaws occurred
in the old or existing electric grid .The old grid or existing grid is unidirectional because
of this there is lack of communication b/w the loads connected and the electric grid.
As the grid is unaware of the increasing demand because grid cannot receives real time
response of demand side and results in to the stress on electric grid due to peak demand,

48
this finely results into the grid failure. Similarly there are many other flaws like unable
to manage the demand supply/demand response, poor power quality, fault clearance
time fault detection etc.
4.1.3 Procedure
Smart grid techniques used for controlling and managing the demand response methods
as follow.
4.13 (a) Dynamic Pricing Based
Dynamic Pricing Base technique in our project is implemented by using 3-Light
Indicator System. In this technique the user would have three light indicators fitted
inside their house i-e (Green, Red, and Yellow). The tariff of usage during peak hours,
base load hours and valley hours would be predefined by the utility. During peak load
hours the red light indicator would automatically turn on which would tell the user that
high tariff would be charged during this time of the day so that they won't use the
equipment like iron, electric heaters, washing machines, air conditioners etc. During
base load hours the green light indicator would turn on and the user would know that
normal tariff would be charged if they'd use electricity. During valley hours the yellow
light indicator would turn on and the user would know that they'd be charged with very
low tariff by the utility. In this way the user would use less electricity during peak hours
and more during valley and they would be free from load shedding as load shedding
would shift into load shifting.
4.1.3 (b) Incentive Based
Incentive-based Direct Load Control methods perk up Load Management and enhance
the reliability of the power grid. Few disadvantages of these methods are confidentiality
and safety measures of the consumer. Importance of Direct Load Control is less about
small various domestic loads as numerous no. of devices are being controlled & little
monetary advantage is achieved through intense investment on the mechanism to be
controlled. Yet, this practice might be comparatively more effectual for intense
industrialized loads.
We've used this technique in our project too as the user has allowed the utility to control
their load by using smart grid monitoring through PC. It means that the utility company
has the control to turn off the appliances that use more electricity during peak load hours

49
and in return they would get incentive by the utility company in their monthly bill as
main concern of the user economic benefit.
4.2 Analysis procedures
In smart power grid, Load Management with user property is just about the most crucial
issues related to development of grid efficiency, since it outcomes in shaving the peak
along with lessened chances of grid malfunction.
Different optimization strategies are already being used for shaving peak load along
with minimization of cost in line with the essential objective perform provided by
equation (a). Major difficulties to this particular objective function are classified as the
readily available capacity along with completion of full demand because outlined in the
equation.
Major constraints to this objective function are the available capacity and fulfilment of
total demand as defined in equation
𝑚𝑖𝑛𝑖𝑚𝑢𝑚 𝑇𝐸𝐶 ∑ (𝑇𝑜𝑈_𝑃𝑡 ∗ 𝑃𝑔𝑟𝑖𝑑, 𝑡 )𝑇𝑡=1 ......... eq 4.1
∑ 𝑃𝑖, 𝑡 = (𝑃𝑡𝐷)𝑇𝑡=1 .............................................. eq 4.2
Researchers have addressed this issue by means of which includes different parameters
for example minimization connected with PAR, equipment hanging around occasion
and so forth.
Where, TEC is total energy cost; ToU_Pt is time of use price and Pgrid,t is the power
supply from grid at time t. Pi,t is power demand at time t and PtD is total power demand.
4.3 Implementation procedure
4.3.1 Details about hardware
In this topic we are briefly explain the all hardware components which are use in our
project. There are total 4 circuit boards in this project.
DC Supply section board
Controller section board

50
Relay section board
PC connection board
There are different components used in these circuit boards which are as follows:
4.3.1 (a) DC Supply Side Components
Step down transformer
Bridge Rectifier
diodes ( 1K )
capacitor (1000uf)
Description
Step down transformer (220V to 12V and 50 mA)
We are using step down transformer of rating 220V/12V. It consists of primary 220
high voltage side and secondary 12V low voltage side, and current is 50mA, it converts
220V ac in to 12V ac. Which is then passed to the rectifier bridge cct.
Bridge Rectifier
Rectification (AC to DC ) is done using bridge rectification. The input of bridge rectifier
is ac and output of rectifier is pulsating dc .the process of rectification is done by using
a combination of diodes known as bridge. during positive cycle of the input two diodes
become forward biased and two becomes reverse biased in this way half cycle is
obtained at the output, during negative cycle the reverse biased becomes conducting
and other two becomes reverse biased in this way the other cycle is used and output is
pulsating dc.
Fig 4.1 Bridge Rectifier Circuit

51
Capacitor (1000uf)
The pulsating dc is not good for the system so it passes through the capacitor filter
which makes it ripple free and output is constant dc supply. In this way our constant dc
supply is made this supply power to the controller as controller input is dc and also
supply dc to the relays.
4.3.1 (b) Controller section board
PIC-Microcontroller (16F887A)
It is used in project for data communication between the grid, loads connected and the
PC monitoring and for the proper functioning of the system to make it reliable.
Pin Configuration
40 pins
1 pin, reset
pin5, variable voltage analogue to digital
pin5, variable current analogue to digital
pin5, variable temperature analogue to digital
Pin5, constant oil analogue to digital
Pin 11, (+5v)
Pin 12, 31 (Ground)
Pin 13, 14 (crystal oscillator)
Pin 1 (Reset)
4 ports(Output)
Pin37, optocoupler(12V relay)
Pin38, optocoupler (12V relay)
Pin39, optocoupler (12V relay)
Pin40, optocoupler (12V relay)
Pin21, led

52
Pin22, led
Pin23 ,led
Microcontroller trainer
It consists of oscillator, capacitors and a resistor for its basic operation.
Crystal Oscillator
It is at pin no 13 & 14 gives clock pulses to controller for its operation.
Fig 4.2 crystal oscillator
4.3.1 (c) Relay section board
Relay 12V
Optocoupler
Transistor PNP
current transformer
Relaying section
There are total 4 relays used in this circuit board for the purpose of controlling four
devices. Although we control three devices namely Fan, LED light and motor. We
apply 5V signal at LED through R=330, ohm then LED glow and light act at
phototransistor (base), then phototransistor conduct and 12V comes at point A
(shown in figure).
53
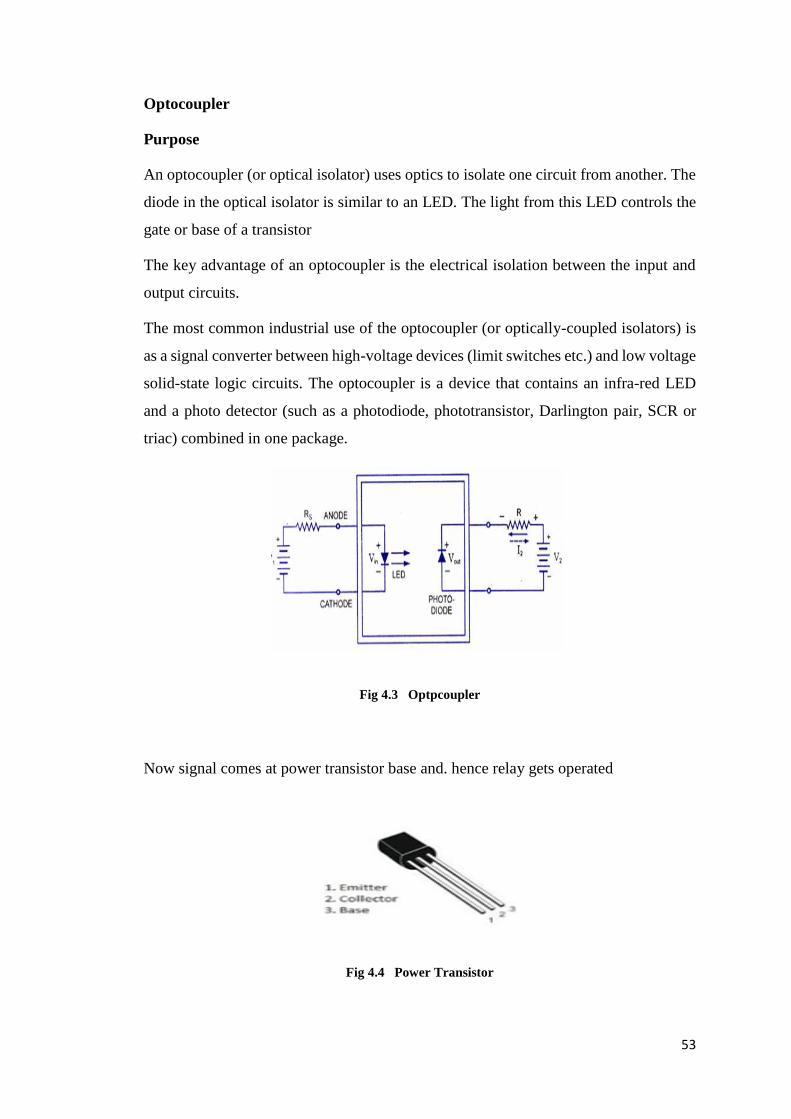
Optocoupler
Purpose
An optocoupler (or optical isolator) uses optics to isolate one circuit from another. The
diode in the optical isolator is similar to an LED. The light from this LED controls the
gate or base of a transistor
The key advantage of an optocoupler is the electrical isolation between the input and
output circuits.
The most common industrial use of the optocoupler (or optically-coupled isolators) is
as a signal converter between high-voltage devices (limit switches etc.) and low voltage
solid-state logic circuits. The optocoupler is a device that contains an infra-red LED
and a photo detector (such as a photodiode, phototransistor, Darlington pair, SCR or
triac) combined in one package.
Fig 4.3 Optpcoupler
Now signal comes at power transistor base and. hence relay gets operated
Fig 4.4 Power Transistor
54
Types of Optocoupler
Slotted Optocoupler
A slotted optocoupler has a slot modelled into the package between the LED light
source and the phototransistor light sensor; the slot houses transparent windows, so that
the LED light can normally freely reach the face of transistor, but can be interrupted or
blocked via opaque object placed within the slot. The slotted optocoupler can thus be
employed in a variety of presence detecting applications, including end-of-tape
detection, limit switching, and liquid level detection.
Reflective Optocoupler
Here the LED and phototransistor are optically screened from each other within the
package, and both face outwards (in same direction) from the package. The construction
is such that an optocoupler link can be set up by a reflective object (such as metallic
paint or tape, or even smoke particles) placed a short distance outside the package, in
line with both the LED. The reflective coupler can thus be employed in applications
such as tape-position detection, engine-shaft revolution counting or speed
measurement, or smoke or fog detection etc.
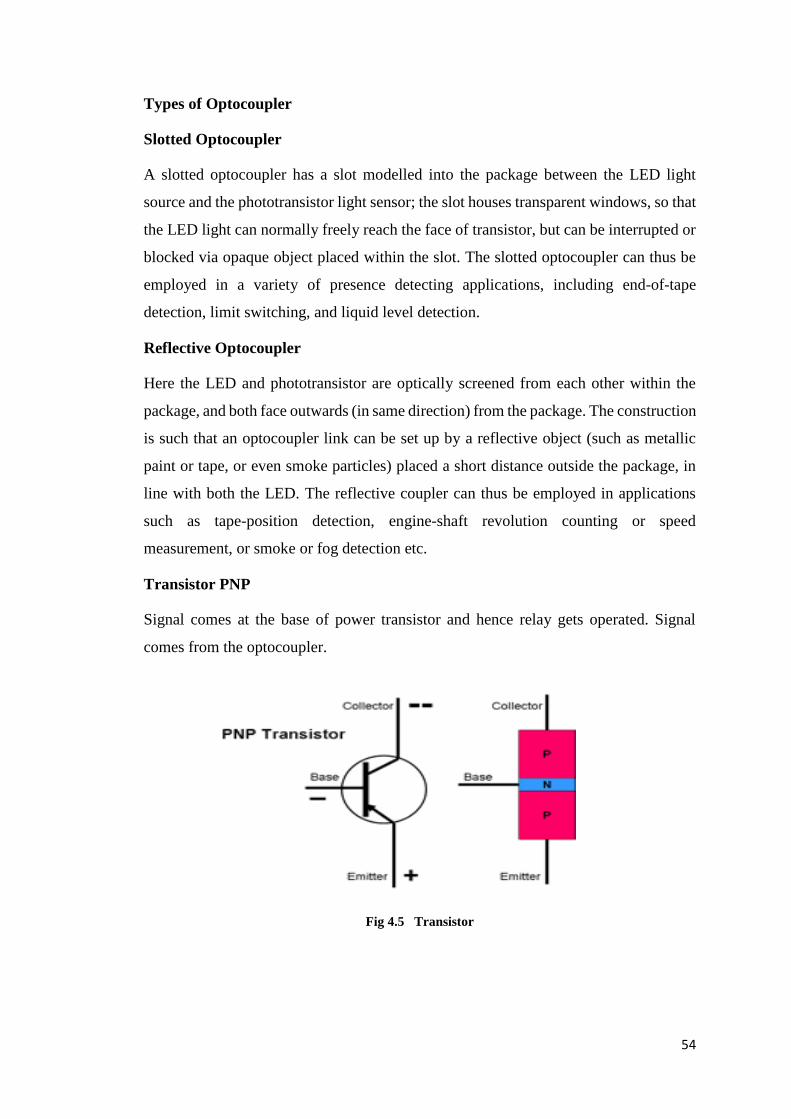
Transistor PNP
Signal comes at the base of power transistor and hence relay gets operated. Signal
comes from the optocoupler.
Fig 4.5 Transistor

55
Current Transformer (CT)
Purpose
CT is used for the measuring of the AC current in system. When current in the system
is very high so it can’t be measure by measuring instrument this difficulty is removed
by using CT it reduces the current of the system which can be easily measured by the
measuring instrument. Reduced current is produced by the CT is accurately
proportional to the current in the system cct .The current from CT is used for the
operation of relays
Design
Like ordinary T/F, CT also consist of primary winding, secondary winding, magnetic
core, the primary winding AC current produces the alternating magnetic field in the
core, this produces the alternating current in the secondary winding .the input of the CT
is AC and output is also AC. This AC is then passed to the bridge rectifier cct for DC
output.
Bridge rectifier
Rectification (AC to DC) is done using bridge rectification. The input of bridge rectifier
is ac and output of rectifier is pulsating dc .the process of rectification is done by using
a combination of diodes known as bridge. during positive cycle of the input two diodes
become forward biased and two becomes reverse biased in this way half cycle is
obtained at the output, during negative cycle the reverse biased becomes conducting
and other two becomes reverse biased in this way the other cycle is used and output is
pulsating dc.
Fig 4.6 Bridge Rectifier

56
Capacitor (1000uf)
The pulsating dc is not good for the system so it passes through the capacitor filter
which makes it ripple free and output is constant dc supply. In this way our constant dc
supply is made.
Load resistor
Load resistor limits the output between 0V to 5V. Because the current more than 5V
can damage the controller. If the output is 8V or 10V it will burn the controller because
the analogue to DC of the controller operates b/w 0V-5V. If load resistor is not present
then the capacitor charged to the more than 10V and burns the controller.
4.3.1 (d) PC Section Board
MAX-MODULE (MAX232 CPE)
It is used on pc board for the communication of data from PC to the controller board
cct. Data sending to PC by the controller is in form of (+-5V) max-module converts it
in (+-12V).As PC receives information in the form of (+-12V).while information
coming from PC to the controller is in (+-12V) max-module converts it in (+-5V) which
is then convert in to dc by the diode and transfer to the controller.
Fig 4.7 Max Module

57
USB Connector
A universal serial bus (USB) connector connects our module with computer. It makes
up complete functionality of our project possible.
4.3.2 Details about software/ algorithms
4.3.2 (a) visual studio
As mentioned before HyperTerminal is compatible of every programming language e.g.
visual C, C++, java, Visual Basic and many other introduced earlier. In our project of
model base power system using smart grid we have used c sharp language for the
communication of GUI with (Smart Grid) module.
4.3.2 (b) C sharp
It is denoted as C#. This language is general purpose language, OOP language, modern
and simple. It is suitable for applications written or both embedded system and hosted
system. The application written is C# language or economical in requirement of
memory and processing power.
4.3.2 (c) Processing
Basically Microsoft Visual studio uses serial port of computer for communication. In
this we have one transfer pin and one receiving pin. There are interrupts use for deciding
whether to transmit or receive data for processor. If a device requires data from
transmitter and then it send an interrupting signal to microcontroller that stops its
processing and transmit data to that particular device at remote end.
4.4 Verification of functionalities
All the components of our different section boards function properly. Their
functionality is in accordance with our desired output. Each section has desired input
of its own and output due to which our project works properly.

58
4.5 Summary
This chapter includes design investigation of the project and its methods of
implementation and working of hardware components as well as working of software.
Analysis of the techniques used for demand side management. We verify our system
functionality by checking the output of our different section.

59
Chapter 5
RESULTS AND ANALYSIS
5.1 Presentation of the findings
Result procured in chapter one
In chapter one we defined our project, merits and why we are choosing this project.
Two way communication between utility and consumer lead to reliable, sustainable,
and efficient and load adjusted supply. We are managing load in our Smart Grid by the
implementation of Dynamic-Pricing- Base and Incentive-Base scheme.
The main concern was to shift the peak load to valley because during peak loads that
occur only for 2-3 hours during the whole day, demand rises and supply is not enough.
Dynamic Pricing involves a three light indication system. So the user can manage its
electricity usage during peak and valley hours
Incentive base demand-response schemes pay consumers for minimizing their
electricity usage at interval requested by the utility company for triggering either by a
reliability problem of power grid or high utility tariff.
Result procured in chapter two
In this episode we enlisted related techniques to our project including Wireless
Communication and Fibre optics which are further sub divided.
Radio waves
Radio waves are used by modulating their frequency, amplitude, phase and pulse width
in Wireless Communication.
GSM
It converts data in digital form and packs it and after that transmits it on a channel with
two different surges of data consumer. Then brief sketch on related projects and studies
are given.

60
Result procured in chapter three
This stage consists of tools and techniques involved in our project with hardware and
software techniques used and their complete technical specifications.
Project components enlisted with their complete portrayal. Division based methodology
to explain the techniques step by step and at the end software that we have used which
is Visual Basic, C++, C#, C programming is written.
5.1.1 Hardware results
We divided hardware section of our project into different stages. They are Supply side,
PC side, Transformer side and load side.
In Supply side a step down transformer, bridge rectifier and a capacitor is used
that steps down and converts 220V AC to filtered 12V DC.
This section is the power supply of the complete Smart Grid Model.
In PC side Max Module converts to and fro 12V DC to 5V DV from PC to
microcontroller (16F877A) to which four variable are connected that converts
analogue to digital and a crystal oscillator a pin 13, 14 that gives clock
frequency for the operation of microcontroller.
LCD (16*4) displays voltage, current, temperature and fixed oil level as well
as is displayed on PC screen. In short this section provides visual monitoring
and controlling.
Transformers circuit side include a step-down and a current transformer with a
bridge rectification and voltage controller is used. 220V are stepped down to
12V AC which is converted to DC by bridge rectification Current transformer
read current value from step down transformer and gives it to relay circuit for
its operation. In short this side gives DC current for the operation of relays.
This is relay section which has relays to which are given 12V from the main
DC supply. Optocoupler operates from microcontroller. Optocoupler have
LEDS's at one end that uses 5V of microcontroller and photo diodes at other
end uses 12V of main supply. LED light will short circuit the photo diodes and
61
gives power to transistors and then relay gets turned on. Relay will transfer 12V
to bulbs. Negative of all bulbs is common.
This is load side of our project which are operated by relays.
5.1.2 Software results
The software we implemented in our project to achieve our task is Visual Basic, C# and
JAVA AND C, C++ language. This enables us to visually display and control voltage,
current and temperature level at transmission and at distribution level. The
programming take in the Dynamic-Pricing- Base and Incentive-Base scheme in
coding which helps better load management favouring consumer and utility.
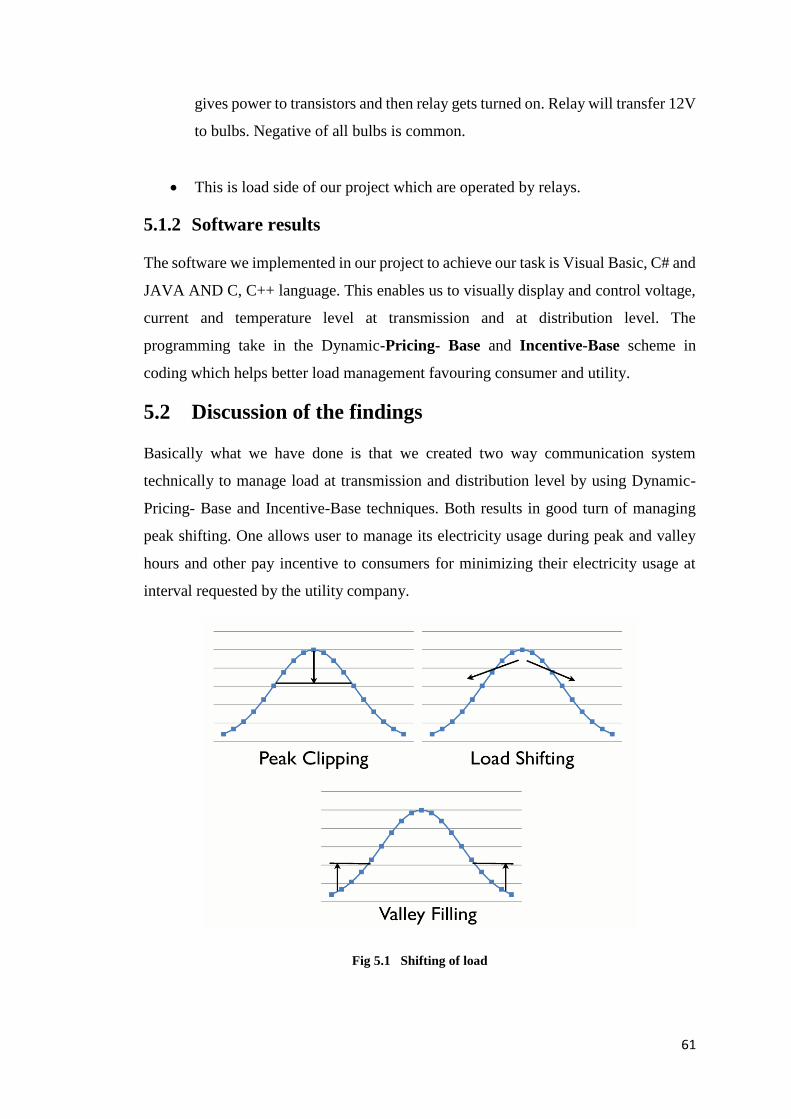
5.2 Discussion of the findings
Basically what we have done is that we created two way communication system
technically to manage load at transmission and distribution level by using Dynamic-
Pricing- Base and Incentive-Base techniques. Both results in good turn of managing
peak shifting. One allows user to manage its electricity usage during peak and valley
hours and other pay incentive to consumers for minimizing their electricity usage at
interval requested by the utility company.
Fig 5.1 Shifting of load
62
The innovative idea in our project is the better regulation of load management using
three light indication system which has already been discussed in this thesis. To
enhance the socio-economic advancement and meet the energy demand, large power
plants were being installed and are being transmitted over HV transmission lines across
different power destitute regions. But, such engrossment not only surges huge
investment, but also invites numerous non-technical issues based on environment and
judiciary matters.
In order to regulate the world-wide power market and bringing down the ambiguous
events in power system, power sectors are flourishing with new advancement in
technology, by initiation of non-technical principles such as Energy Management
System (EMS), Demand Side Management (DSM), optimized Assets Management etc.
In addition to this, the new emerging technologies like Wide Area Monitoring System
(WAMS), Phase Measurement Units (PMUs), Distributed Energy Resources (DER),
Flexible AC Transmission System (FACTS) etc. enriches the modern power system
and buzzes to new opportunities. Different development environment and drive force,
different countries’ power grid enterprise and organizations comprehend the smart grid
concept in their own way. In fact, the smart grid concept itself is being developed,
enriched and cleared every day. As a result of which, the research and practical
approaches, methodologies and key points are quite different, depending upon the
factors like geographical locations as well as their advancement in sciences and
technology.
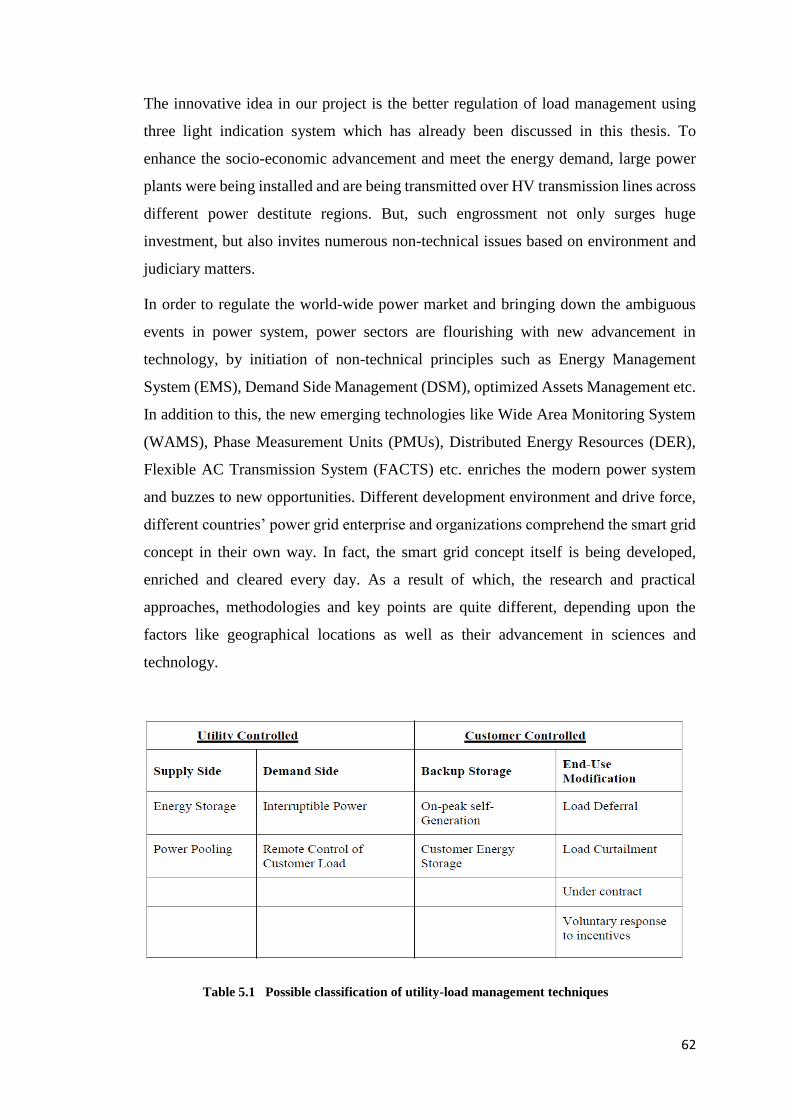
Table 5.1 Possible classification of utility-load management techniques

63
Smart Grid Technologies (SGT)
The following five fundamental technologies that derive the Smart Grid systems
Integrated communications – connecting components to open architecture for
real-time information and control, allowing every part of the grid to both ‗talk‘
and ‗listen‘
Sensing and measurement technologies – to support faster and more accurate
response such as remote monitoring, time-of-use pricing and demand-side
management
Advanced components – to apply the latest research in superconductivity,
storage, power electronics and diagnostics
Advanced control methods – to monitor essential components, enabling rapid
diagnosis and precise solutions appropriate to any event
Improved interfaces and decision support – to amplify human decision-
making, transforming grid operators and managers quite literally into
visionaries when it comes to seeing into their systems.
Future Work
A typical Industrial plant shall be modelled by considering different activities and their
percentage of energy consumption from the total available generation. While we only
considered one bus as the load bus (one industrial plant) in the study, many load buses
with varying profiles may be considered in future studies. Likewise, while we only
considered one utility in the study, utilization of smart grid technologies may be
implemented between utilities for further development of the work. The results
obtained can be compared with different optimization techniques and/or an
optimization technique can be developed to improve the accuracy.
A Smart Grid Transaction Display need to be developed and installed at Utility and the
Plant so that the hourly information is available at both ends and they can adopt the
profitable scheme for exchanging the electricity.
As a first step for the proposed methodology, the approximate load profile of the plant
is considered based on the mean and variance of the low voltage industrial activities.
Instead, creation of actual load profile of the typical industrial plants – one profile for

64
each type of industry, should be modelled by looking at the previous records of the of
the utility and plant.
5.2.1 Comparison with initial Goal
Primarily the focal point of our project is load management by using the two enlisted
techniques previous have been described in order to make the current electro
mechanical grid safe and sound means sustainable reliable efficient energy
management between utility and the consumer.
For the reliability of the system it should be self‐ healing and resistant to attacks. It
would be wiser to design Smart Grid so when it is attacked, the Smart Grid reverts to a
Dumb (but working) Grid. In spite years of research and development by myriad
programmers, researchers, and designers, attack‐ proof networks have never to be
achieved. Unfortunately risk can be quantified, but never eliminated in our project.
An ideal is “one which continuously monitors all the traffic within the system (every
packet entering the system is validated before it can proceed) with a view to detect and
disable abnormal traffic patterns. The goal of a self-healing network is to provide a
mechanism for detecting unauthorized use of networking equipment and provide a
mechanism for tracking inappropriate uses and identifying the individuals using
networks for malicious intent, without compromising individual rights to privacy and
security on the network.”
What we achieved?
But what matters here for us we successfully achieved to manage load by our smart grid
by using two special techniques that favours both consumer and utility for the best
operation.
5.2.2 Reasoning for short comings
A self-healing grid uses digital components and real-time secure communications
technologies installed throughout to monitor its electrical characteristics at all times and
constantly tune itself so it operators at an optimum state. It has the intelligence to
constantly look for potential problems caused by storms, catastrophe, human error or
even sabotage. It will react to real or potential abnormalities within a fraction of a
second, just as a military fighter jet reconfigures itself to stay aloft after it is damaged

65
The self-healing grid isolates problems immediately as they occur, before they cascade
into major blackouts and recognizes the grid and reroute energy transmissions so
service continue for all customers while the problem is physically repaired by lie crews.
A self-healing smarter grid can provide a number of benefits that lead to a more stable
and efficient system. Three of its primary functions include real-time monitoring and
reaction, which allows the system to constantly tune itself to an optimal state;
anticipation, while enables the system to automatically look for problems that could
trigger larger disturbances; and rapid isolation, which allows the system to isolate parts
of the network that experience failure from the rest of the system, to avoid the spread
of disruption and enable a more rapid restoration.
How can we set about building a self-healing grid?
To transform our current infrastructure into a self-healing smart grid, several
technologies must be deployed and integrate.
The first step is to build a processor into each switch, circuit breaker, transformer and
bus bar, which are the huge conductors that transport electricity from generators. The
processors will allow transmission lines to securely communicate with each other and
monitor their individual pieces of the grid.
Upgrading the grid infrastructure for self-healing capabilities requires replacing
traditional analogue technologies with digital components, software processors and
power electronics technologies. These must be installed throughout a system so it can
be digitally controlled, which is the key ingredient to a self-monitoring and self-healing
grid
But unfortunately economic conditions of our country, lack of quality man power
results long hours power cuts in form of load shedding in our country due to which it’s
impossible to make the current running few smart grids self-healing and resistant to
cyber-attacks.

66
5.3 Limitations
We wanted to install Automatic Metering System ( AMI ) at the user end so the user
would be aware of the units consumed but it was as such uneconomical that consumer
could not afford this.
Secondly consumer awareness is very important thing to be aware of the techniques we
used i.e. Dynamic Pricing and Incentive-Base on huge level.
Home Energy Management System (HEMS) is another way to make electrical
electronic devices smart so that they may sense temperature and get on off
automatically. But it is also uneconomical and is unaffordable.
5.4 Recommendations
Improved methods for gauging risks and the security posture of real‐time distributed
control systems and SCADA systems will be required in order to provide a basis for
the implementation of the Smart Grid. SCADA systems manage the ongoing operations
of transmission and sub transmission lines and equipment between the generator and
substation.
The Smart Grid development life cycle should assume successful penetrations and
attacks from external sources as well as disgruntled insiders. The Smart Grid should
have the ability to isolate large grid segments from compromised segments in near real
time to prevent a contaminated section from infecting other large areas of the grid
Mechanisms have to be explored to reduce false positives to a minimum level along
with algorithms to validate positive intrusion indications and minimize responses that
can initiate damages to the grid from reacting to false positives.

67
5.5 Summary
In this chapter we discussed results we achieved its comparison with other similar
projects and discussion of the findings.
We talked about what we claimed initially and what we can't accomplish. Our
limitations and recommendations. To make system more reliable it must resist attacks
may be cyber and is self-healing which in case of our country is quite uneconomical.
Instalment of (HEMS) at consumer side but is unluckily is unaffordable.

68
Chapter 6
Conclusion
Conclusion
We are providing solution to the problem that utility companies face during peak loads
in an efficient way which is suitable for both utility and the consumer as peak demand
is of major concern for the utility companies. Two way communication system using
Dynamic base and Incentive Base scheme and implementing 3-Light Indication system
constructs our Model Base Power System using Smart Grid project possible. Smart grid
with Load Management can make our electricity supply more efficient, flexible with
fewer and shorter outages. We need to start planning for the future today, by building
smarter grid and giving people smarter ways to control their energy consumption.

69
References
Mahmood, Anzar, Nadeem Javaid, Muhammad Asghar Khan, and Sohail Razzaq.
"An overview of load management techniques in smart grid: Load management
techniques in smart grid", International Journal of Energy Research, 2015.
http://sctevtodisha.nic.in/docs/website/pdf/140306.pdf
http://greeneconomypost.com/department-of-energy-smart-grid-report-2040.htm
http://smartgrid.ieee.org/march-2013/813-the-self-healing-grid-a-concept-two-
decades-in-the-making
http://www.smartgridsmartcity.com.au/Smart-Grid-Smart-City-
Centre/~/media/Microsites/SGSC/Files/PDFs/Seminar%20Invites/Sustainable%2
0House%20Day%20at%20the%20Smart%20Home%20invitation.pdf
http://www.visual-basic5.de/vbclassic/dezem03/eztwmodi.htm