Embed Size (px)
Citation preview
Industry Data Model Solution for
Smart Grid Data Management
Challenges
Presented by:
M. Joe Zhou & Tom Eyford
UCAiug Summit 2012, New Orleans, LA
October 23, 2012 UCAiug Summit 2012, New Orleans, LA 1
Presenters
M. Joe Zhou
VP of Strategy and Marketing
Xtensible Solutions
6312 S. Fiddler's Green Circle,
Suite 210E
Greenwood Village, CO 80111
Email:
Tom Eyford
Principal Business Strategy Consultant
Oracle Utilities
1220 S 7th Circle
Ridgefield, WA 98642
Email:
October 23, 2012 UCAiug Summit 2012, New Orleans, LA 2
• Utility Data Management Challenges
• Data Management Best Practices
• Utility Data Model Solution
• Open Discussions
October 23, 2012 UCAiug Summit 2012, New Orleans, LA 3
Topics
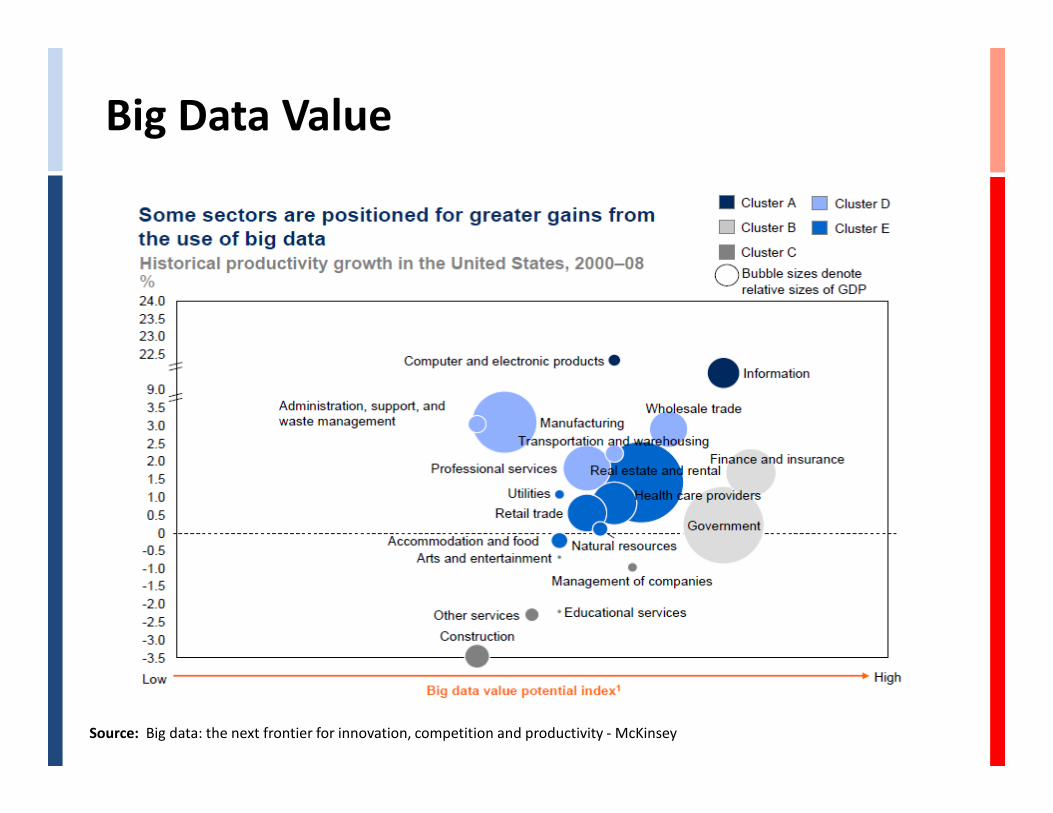
Big Data Value
Source: Big data: the next frontier for innovation, competition and productivity - McKinsey
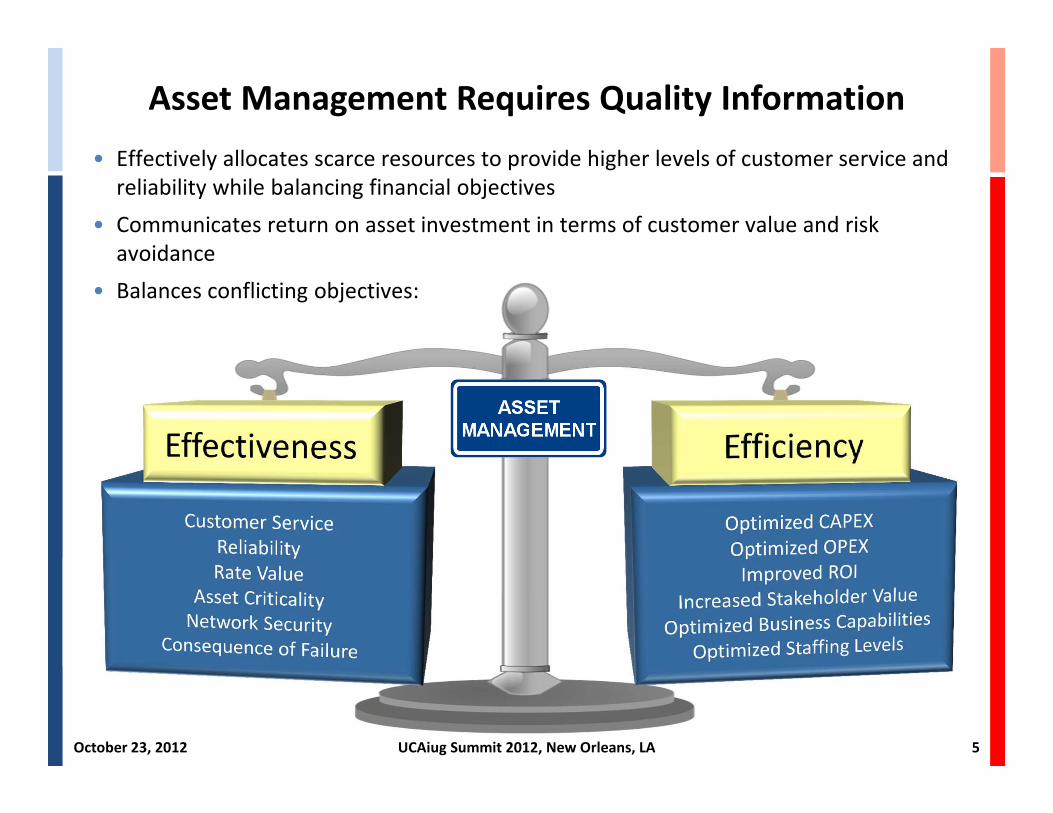
Asset Management Requires Quality Information
• Effectively allocates scarce resources to provide higher levels of customer service and
reliability while balancing financial objectives
• Communicates return on asset investment in terms of customer value and risk
avoidance
• Balances conflicting objectives:
October 23, 2012 UCAiug Summit 2012, New Orleans, LA 5
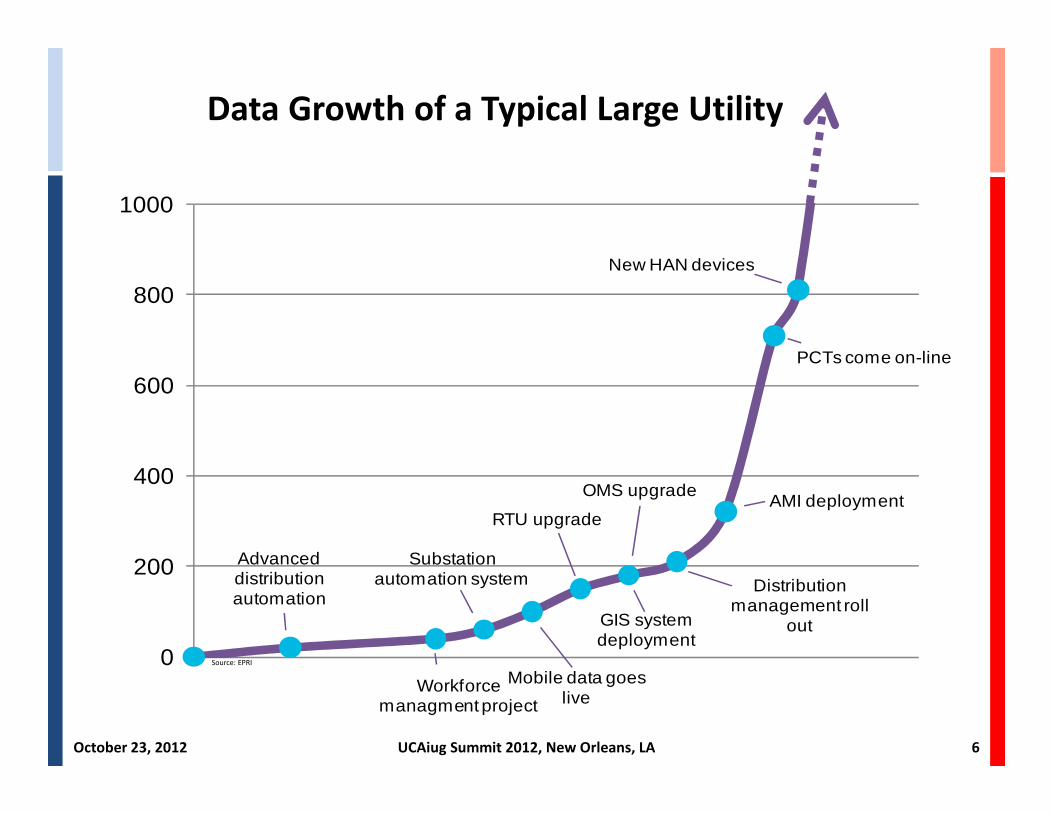
Mobile data goes live
RTU upgrade
Substation automation system
Workforce managment project
GIS system deployment
Advanced distribution automation
OMS upgrade
Distribution management roll
out
AMI deployment
PCTs come on-line
New HAN devices
0
200
400
600
800
1000
Source: EPRI
Data Growth of a Typical Large Utility
October 23, 2012 UCAiug Summit 2012, New Orleans, LA 6
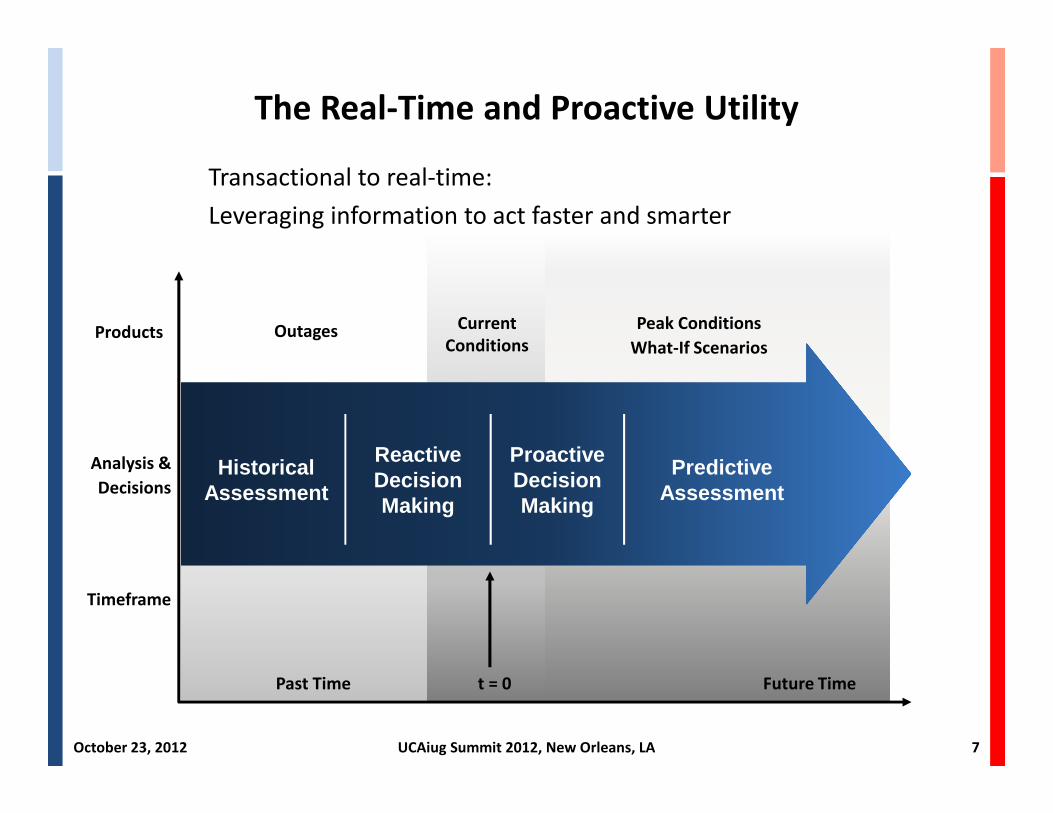
The Real-Time and Proactive Utility
t = 0 Future TimePast Time
Analysis &
Decisions
Products
Timeframe
Outages Current
Conditions
Peak Conditions
What-If Scenarios
Historical Assessment
Reactive DecisionMaking
ProactiveDecision Making
Predictive Assessment
Transactional to real-time:
Leveraging information to act faster and smarter
October 23, 2012 UCAiug Summit 2012, New Orleans, LA 7
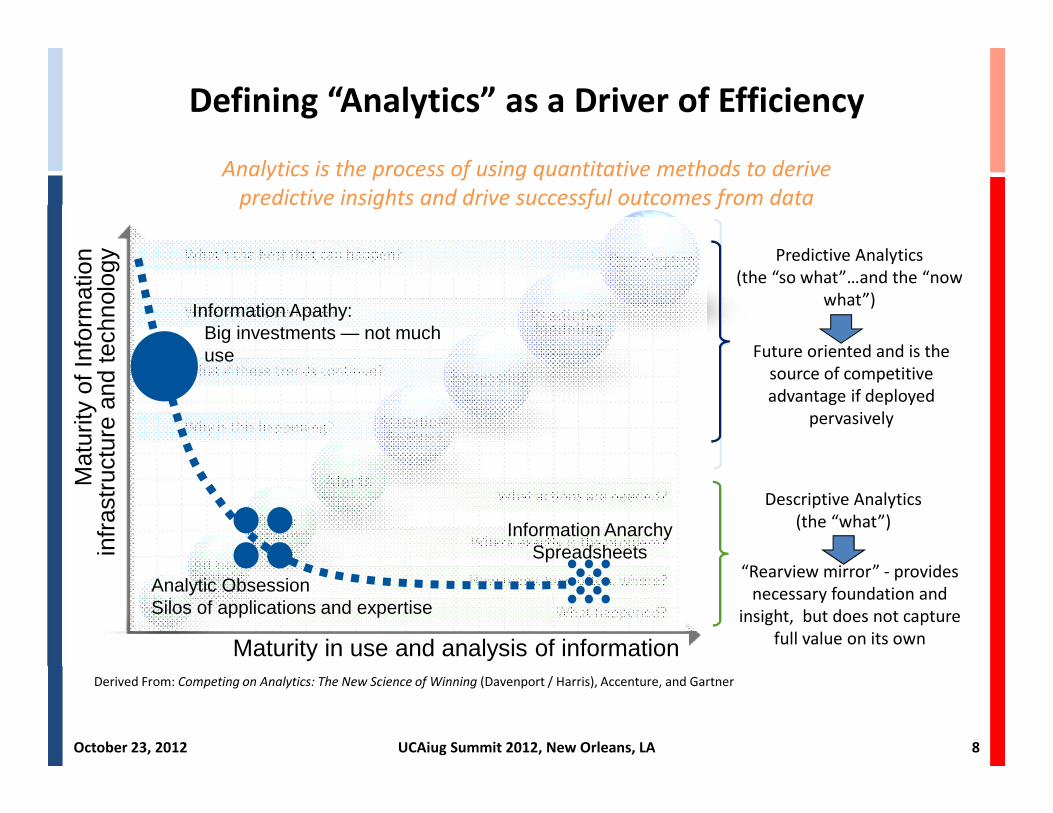
Defining “Analytics” as a Driver of Efficiency
Derived From: Competing on Analytics: The New Science of Winning (Davenport / Harris), Accenture, and Gartner
What will happen next?
What if these trends continue?
Why is this happening?
What actions are needed?
Where exactly is the problem?
How many, how often, where?
What happened?
What’s the best that can happen?
Descriptive Analytics
(the “what”)
“Rearview mirror” - provides
necessary foundation and
insight, but does not capture
full value on its own
Predictive Analytics
(the “so what”…and the “now
what”)
Future oriented and is the
source of competitive
advantage if deployed
pervasively
Analytics is the process of using quantitative methods to derive
predictive insights and drive successful outcomes from data
Information Apathy:Big investments — not much use
Analytic ObsessionSilos of applications and expertise
Information AnarchySpreadsheets
Mat
urity
of I
nfor
mat
ion
infr
astr
uctu
re a
nd te
chno
logy
Maturity in use and analysis of information
October 23, 2012 UCAiug Summit 2012, New Orleans, LA 8
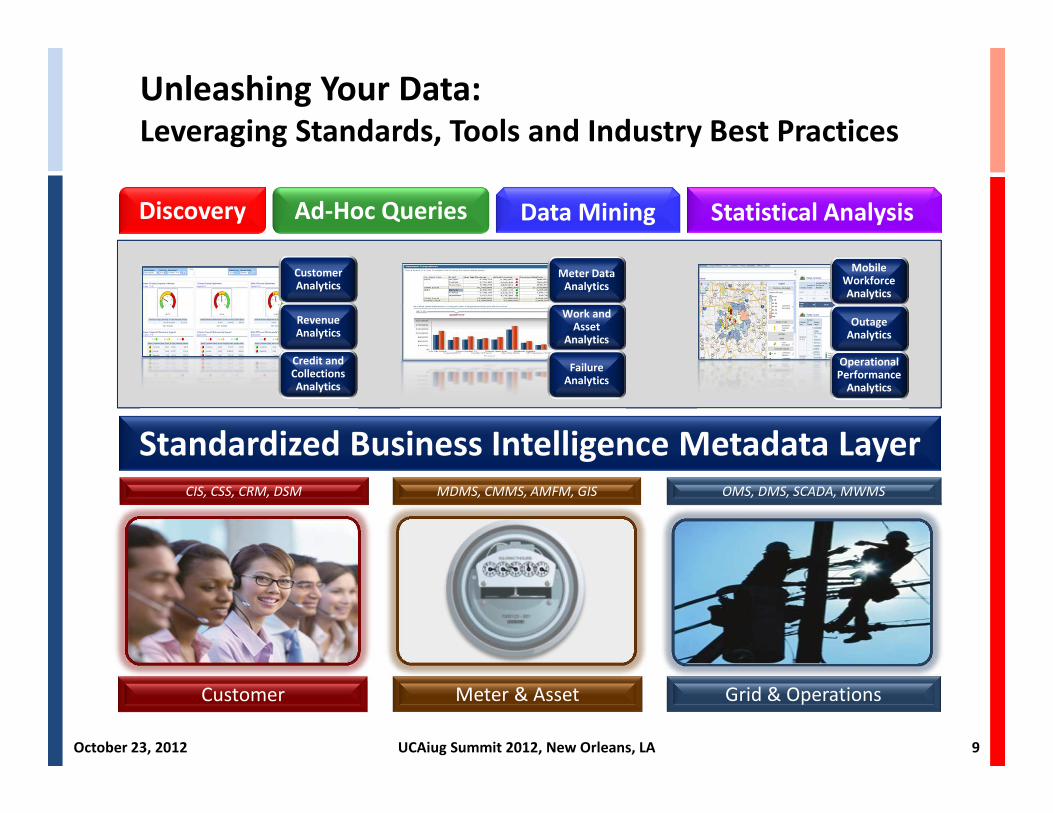
Customer Meter & Asset Grid & Operations
Customer Analytics
Revenue Analytics
Credit and Collections Analytics
Mobile Workforce Analytics
Outage Analytics
Meter Data Analytics
CIS, CSS, CRM, DSM MDMS, CMMS, AMFM, GIS OMS, DMS, SCADA, MWMS
Standardized Business Intelligence Metadata Layer
Work and Asset
Analytics
Unleashing Your Data:Leveraging Standards, Tools and Industry Best Practices
FailureAnalytics
Operational Performance
Analytics
October 23, 2012 UCAiug Summit 2012, New Orleans, LA 9
Discovery Statistical AnalysisData MiningAd-Hoc Queries
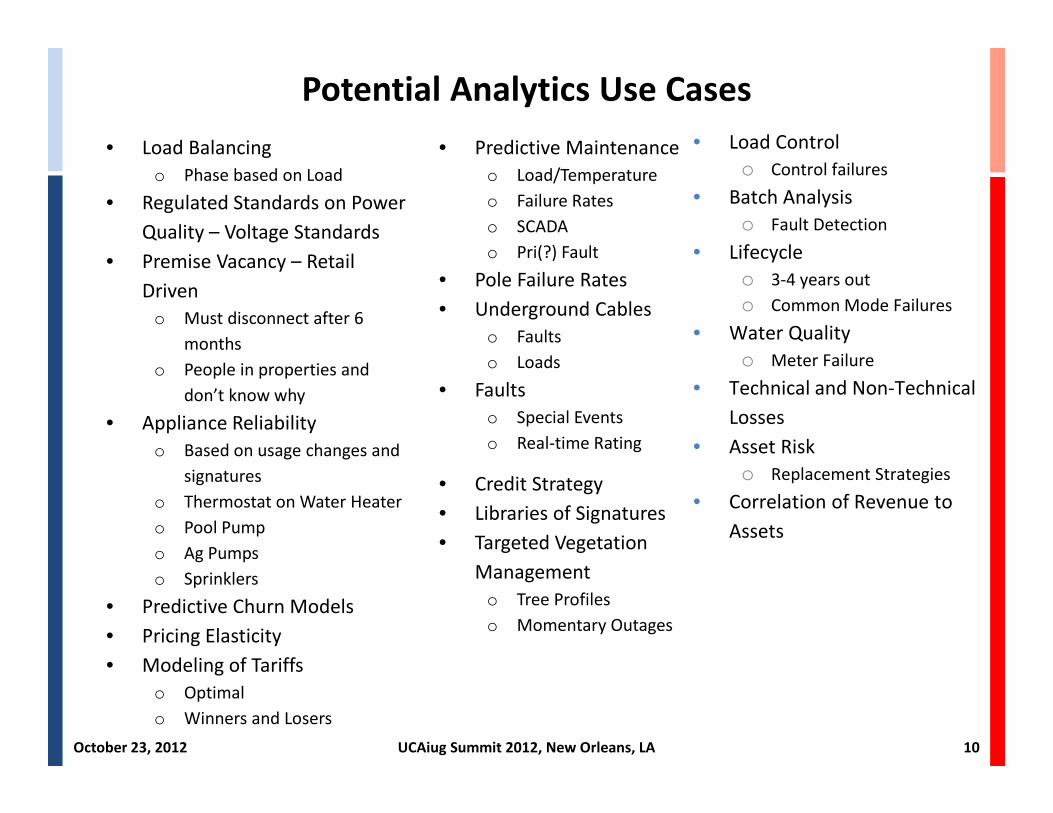
Potential Analytics Use Cases
• Load Balancing
o Phase based on Load
• Regulated Standards on Power
Quality – Voltage Standards
• Premise Vacancy – Retail
Driven
o Must disconnect after 6
months
o People in properties and
don’t know why
• Appliance Reliability
o Based on usage changes and
signatures
o Thermostat on Water Heater
o Pool Pump
o Ag Pumps
o Sprinklers
• Predictive Churn Models
• Pricing Elasticity
• Modeling of Tariffs
o Optimal
o Winners and Losers
• Predictive Maintenance
o Load/Temperature
o Failure Rates
o SCADA
o Pri(?) Fault
• Pole Failure Rates
• Underground Cables
o Faults
o Loads
• Faults
o Special Events
o Real-time Rating
• Credit Strategy
• Libraries of Signatures
• Targeted Vegetation
Management
o Tree Profiles
o Momentary Outages
• Load Control
o Control failures
• Batch Analysis
o Fault Detection
• Lifecycle
o 3-4 years out
o Common Mode Failures
• Water Quality
o Meter Failure
• Technical and Non-Technical
Losses
• Asset Risk
o Replacement Strategies
• Correlation of Revenue to
Assets
October 23, 2012 UCAiug Summit 2012, New Orleans, LA 10
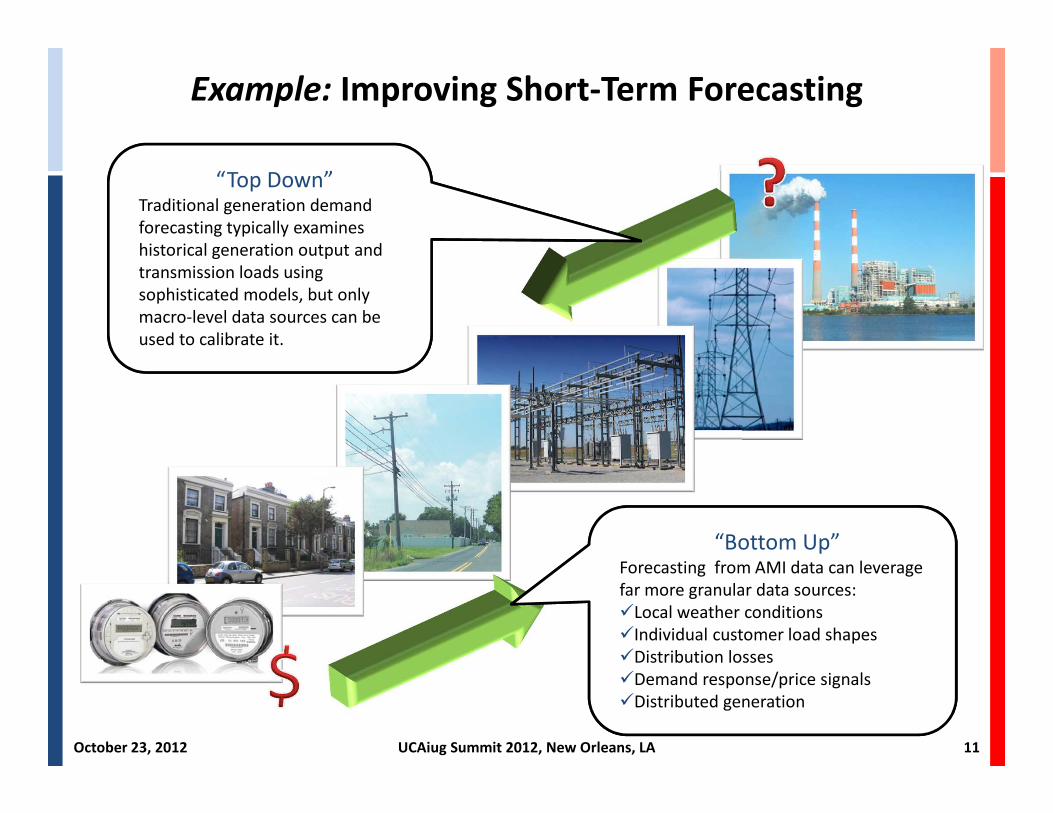
Example: Improving Short-Term Forecasting
“Top Down”Traditional generation demand
forecasting typically examines
historical generation output and
transmission loads using
sophisticated models, but only
macro-level data sources can be
used to calibrate it.
“Bottom Up”Forecasting from AMI data can leverage
far more granular data sources:
�Local weather conditions
�Individual customer load shapes
�Distribution losses
�Demand response/price signals
�Distributed generation
October 23, 2012 UCAiug Summit 2012, New Orleans, LA 11
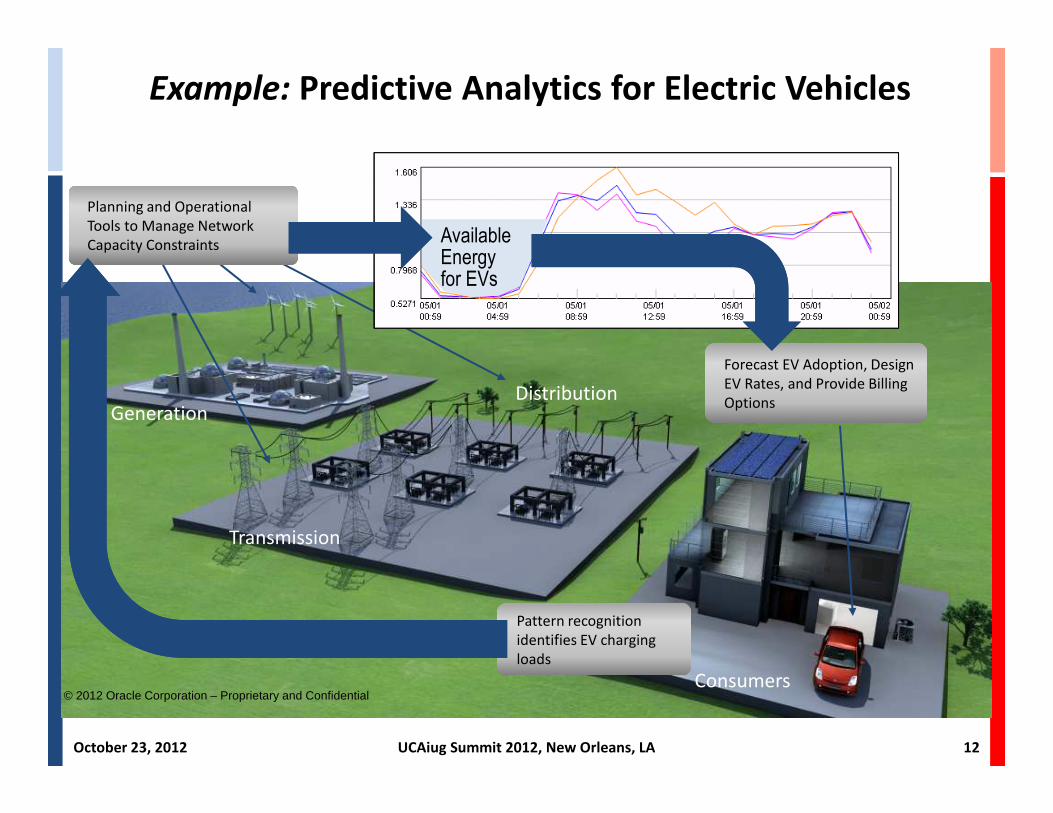
Example: Predictive Analytics for Electric Vehicles
Generation
Transmission
Distribution
Consumers
Forecast EV Adoption, Design
EV Rates, and Provide Billing
Options
Forecast EV Adoption, Design
EV Rates, and Provide Billing
Options
Planning and Operational
Tools to Manage Network
Capacity Constraints
Planning and Operational
Tools to Manage Network
Capacity ConstraintsAvailable Energy for EVs
Pattern recognition
identifies EV charging
loads
Pattern recognition
identifies EV charging
loads
© 2012 Oracle Corporation – Proprietary and Confidential
October 23, 2012 UCAiug Summit 2012, New Orleans, LA 12
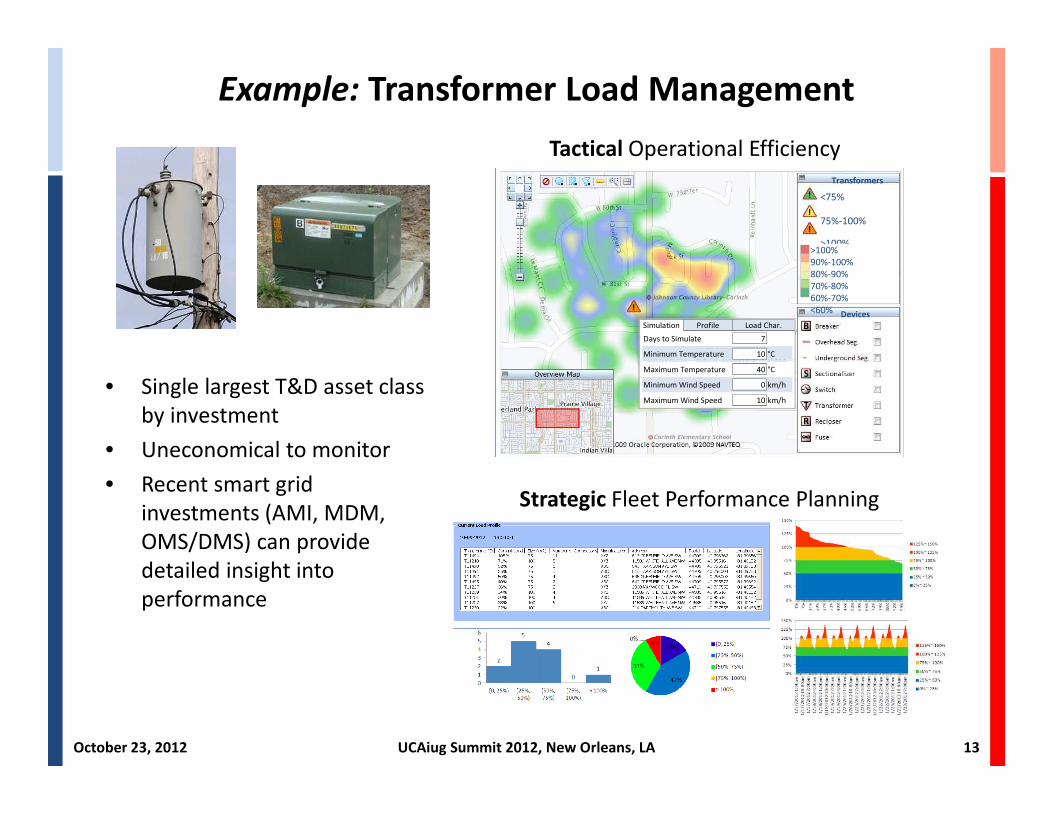
Example: Transformer Load Management
• Single largest T&D asset class
by investment
• Uneconomical to monitor
• Recent smart grid
investments (AMI, MDM,
OMS/DMS) can provide
detailed insight into
performance
Devices
Transformers
<75%
75%-100%
>100%>100%
90%-100%
80%-90%
70%-80%
60%-70%
<60%
Profile
Days to Simulate 7
Minimum Temperature 10 °C
Maximum Temperature 40 °C
Minimum Wind Speed 0 km/h
Maximum Wind Speed 10 km/h
Simulation Load Char.
Tactical Operational Efficiency
Strategic Fleet Performance Planning
October 23, 2012 UCAiug Summit 2012, New Orleans, LA 13
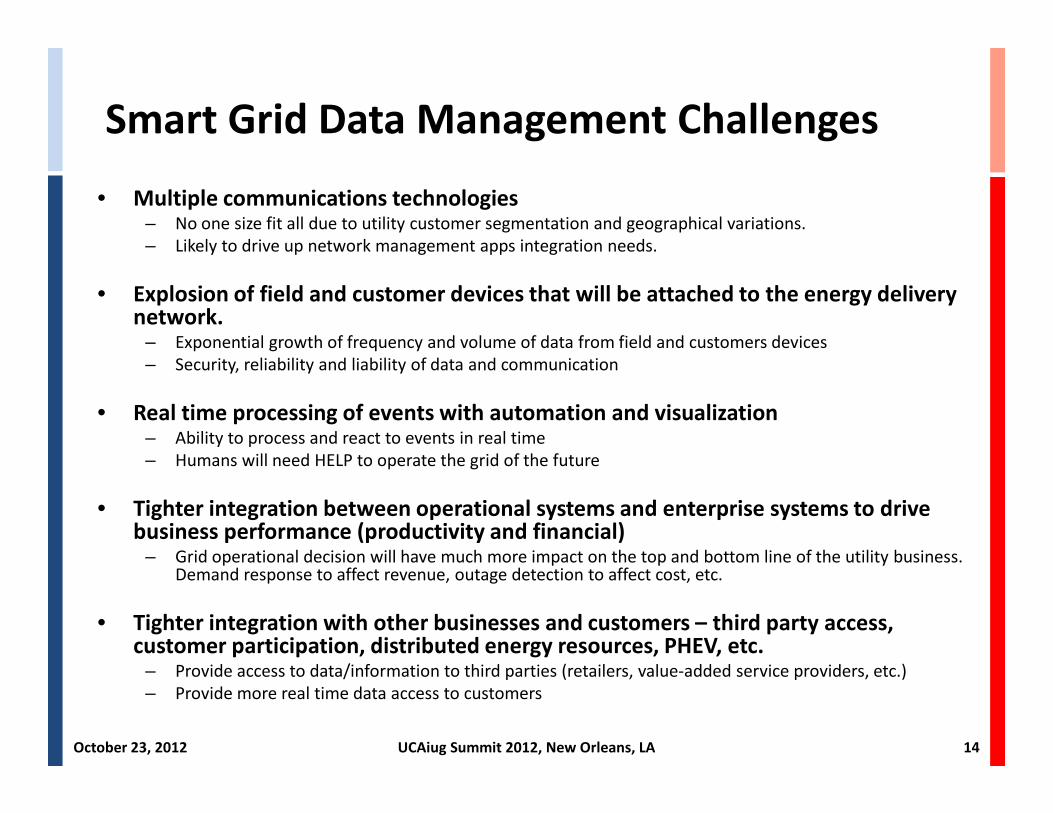
Smart Grid Data Management Challenges
• Multiple communications technologies– No one size fit all due to utility customer segmentation and geographical variations.
– Likely to drive up network management apps integration needs.
• Explosion of field and customer devices that will be attached to the energy delivery network.
– Exponential growth of frequency and volume of data from field and customers devices
– Security, reliability and liability of data and communication
• Real time processing of events with automation and visualization– Ability to process and react to events in real time
– Humans will need HELP to operate the grid of the future
• Tighter integration between operational systems and enterprise systems to drive business performance (productivity and financial)
– Grid operational decision will have much more impact on the top and bottom line of the utility business. Demand response to affect revenue, outage detection to affect cost, etc.
• Tighter integration with other businesses and customers – third party access, customer participation, distributed energy resources, PHEV, etc.
– Provide access to data/information to third parties (retailers, value-added service providers, etc.)
– Provide more real time data access to customers
October 23, 2012 UCAiug Summit 2012, New Orleans, LA 14
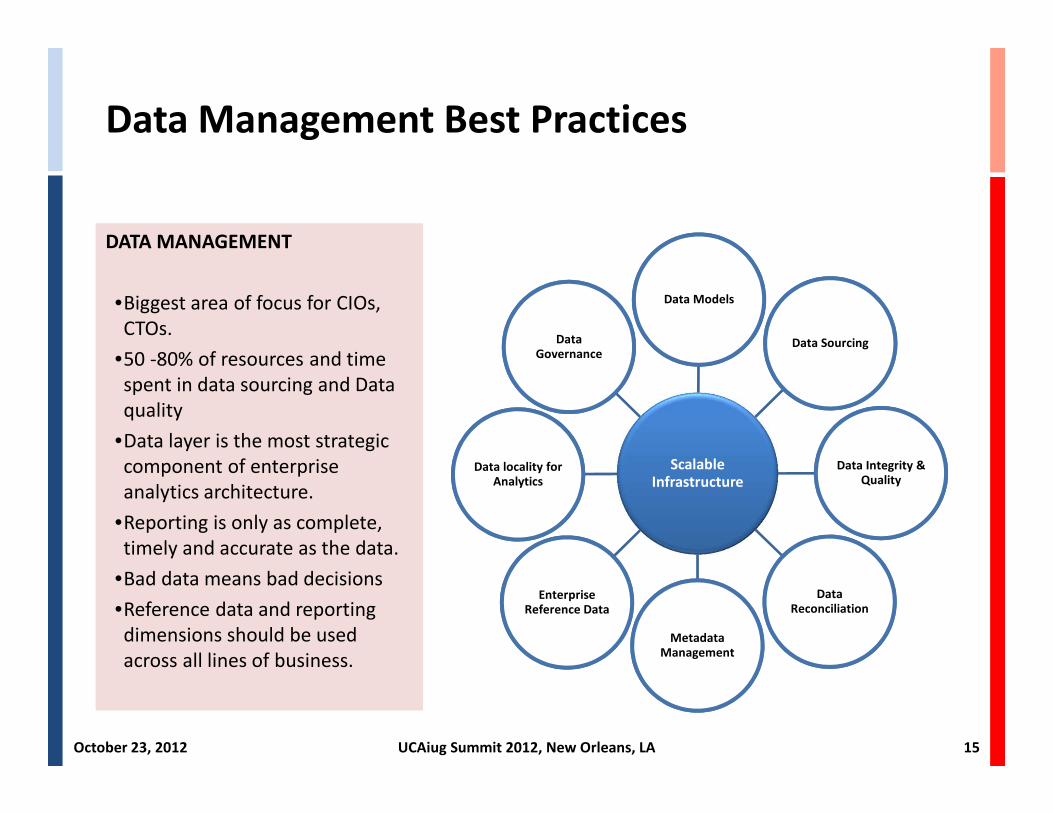
Data Management Best Practices
Scalable Infrastructure
Data Models
Data Sourcing
Data Integrity & Quality
Data Reconciliation
Metadata Management
Enterprise Reference Data
Data locality for Analytics
Data Governance
DATA MANAGEMENT
•Biggest area of focus for CIOs,
CTOs.
•50 -80% of resources and time
spent in data sourcing and Data
quality
•Data layer is the most strategic
component of enterprise
analytics architecture.
•Reporting is only as complete,
timely and accurate as the data.
•Bad data means bad decisions
•Reference data and reporting
dimensions should be used
across all lines of business.
October 23, 2012 UCAiug Summit 2012, New Orleans, LA 15
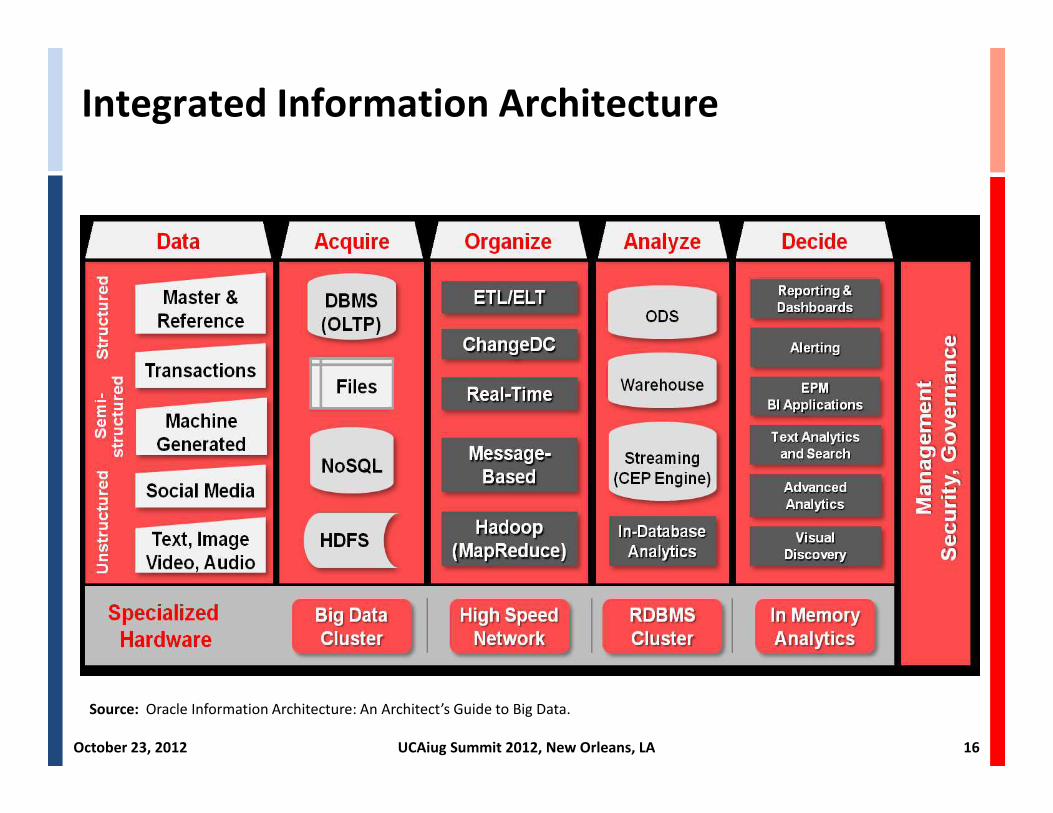
Integrated Information Architecture
Source: Oracle Information Architecture: An Architect’s Guide to Big Data.
October 23, 2012 UCAiug Summit 2012, New Orleans, LA 16
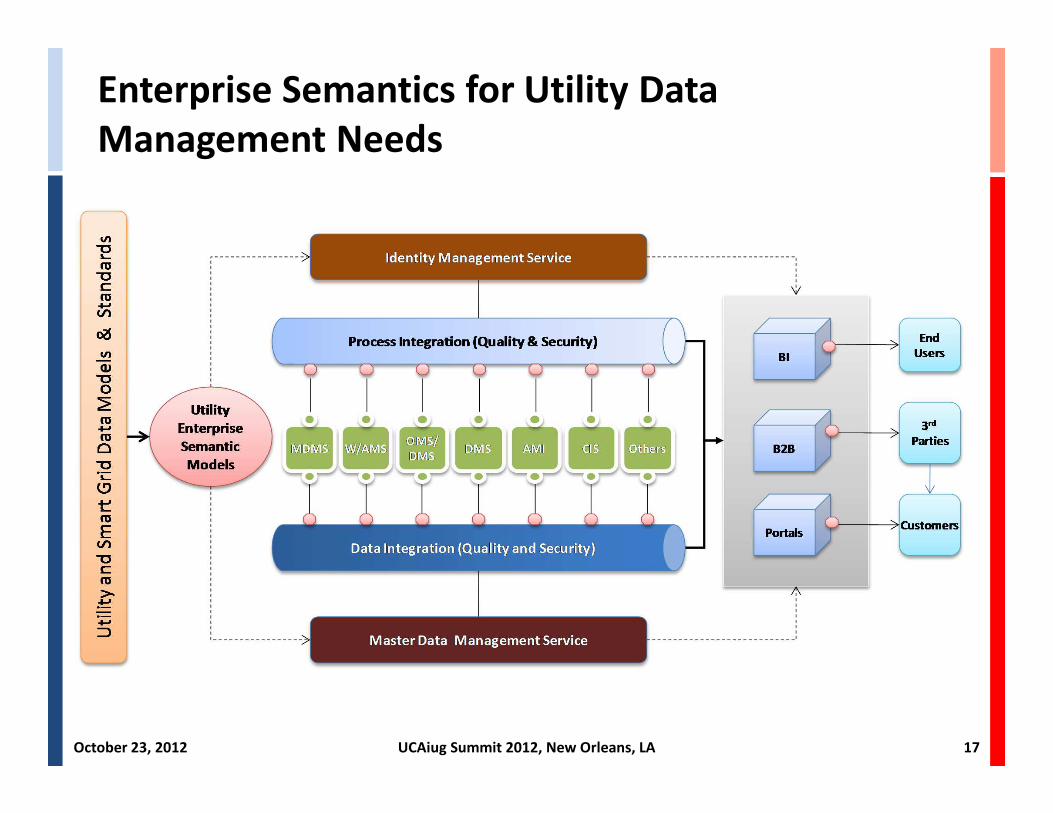
Enterprise Semantics for Utility Data
Management Needs
October 23, 2012 UCAiug Summit 2012, New Orleans, LA 17
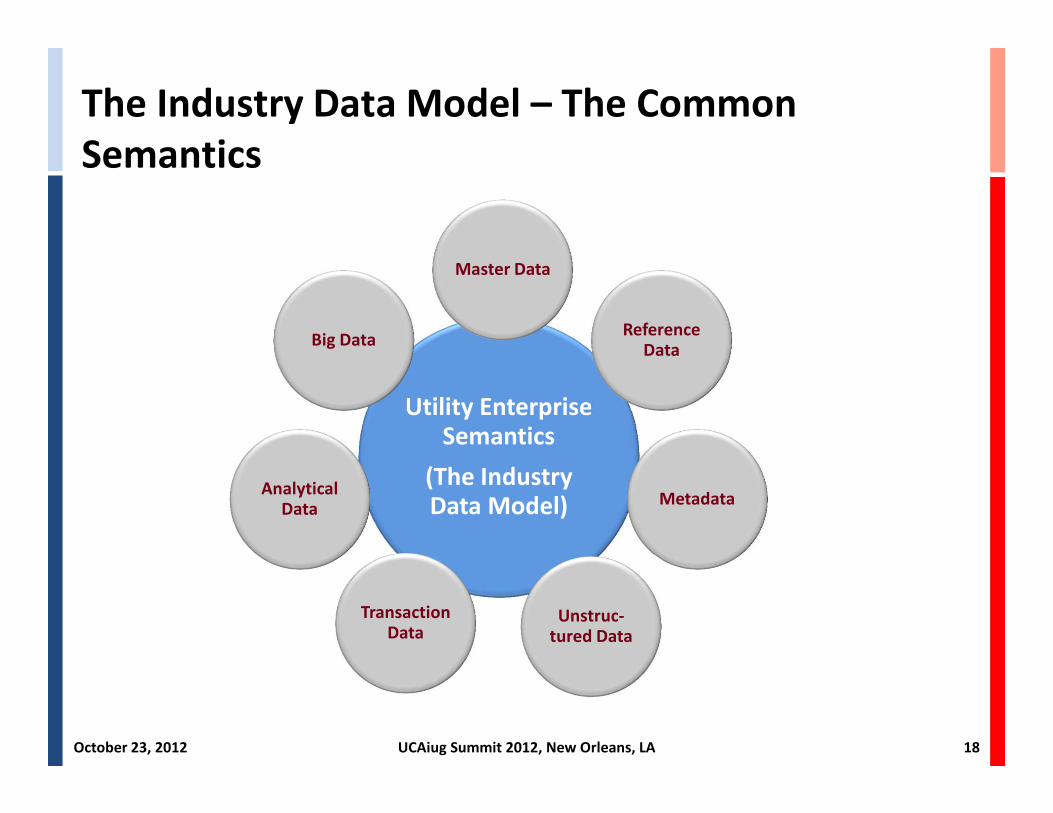
The Industry Data Model – The Common
Semantics
October 23, 2012 UCAiug Summit 2012, New Orleans, LA 18
Utility Enterprise Semantics
(The Industry Data Model)
Master Data
Reference Data
Metadata
Unstruc-tured Data
Transaction Data
Analytical Data
Big Data
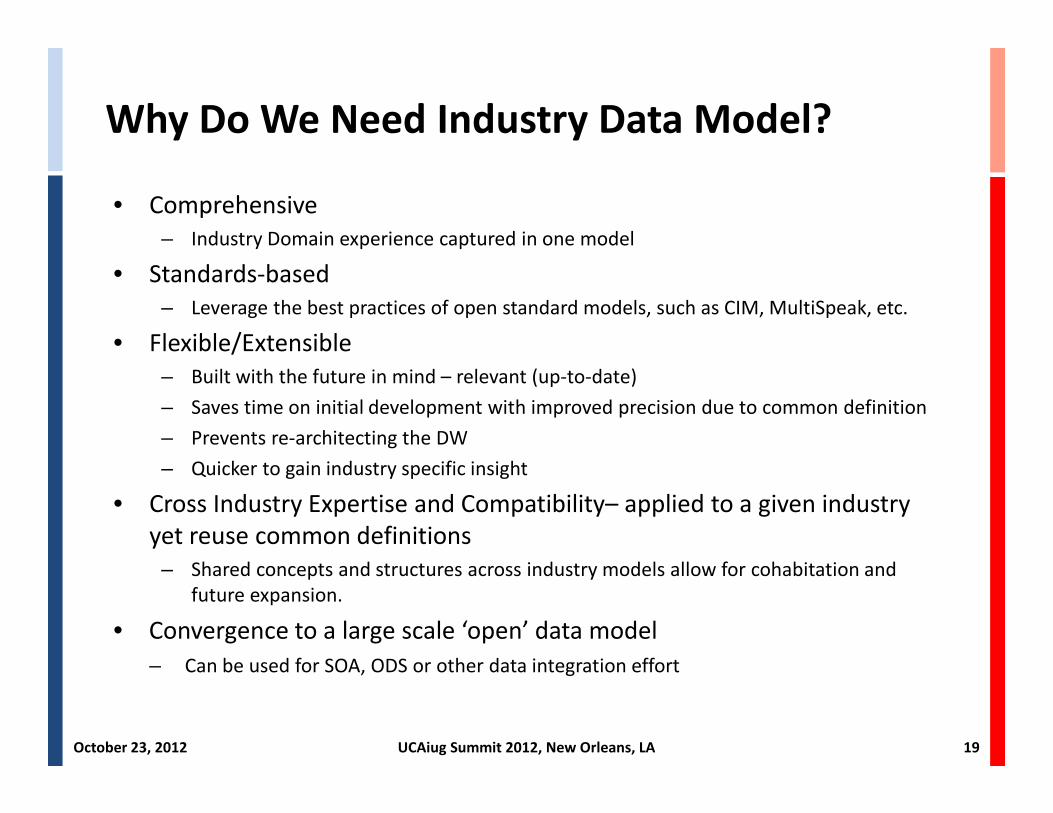
• Comprehensive
– Industry Domain experience captured in one model
• Standards-based
– Leverage the best practices of open standard models, such as CIM, MultiSpeak, etc.
• Flexible/Extensible
– Built with the future in mind – relevant (up-to-date)
– Saves time on initial development with improved precision due to common definition
– Prevents re-architecting the DW
– Quicker to gain industry specific insight
• Cross Industry Expertise and Compatibility– applied to a given industry
yet reuse common definitions
– Shared concepts and structures across industry models allow for cohabitation and
future expansion.
• Convergence to a large scale ‘open’ data model
– Can be used for SOA, ODS or other data integration effort
Why Do We Need Industry Data Model?
October 23, 2012 UCAiug Summit 2012, New Orleans, LA 19
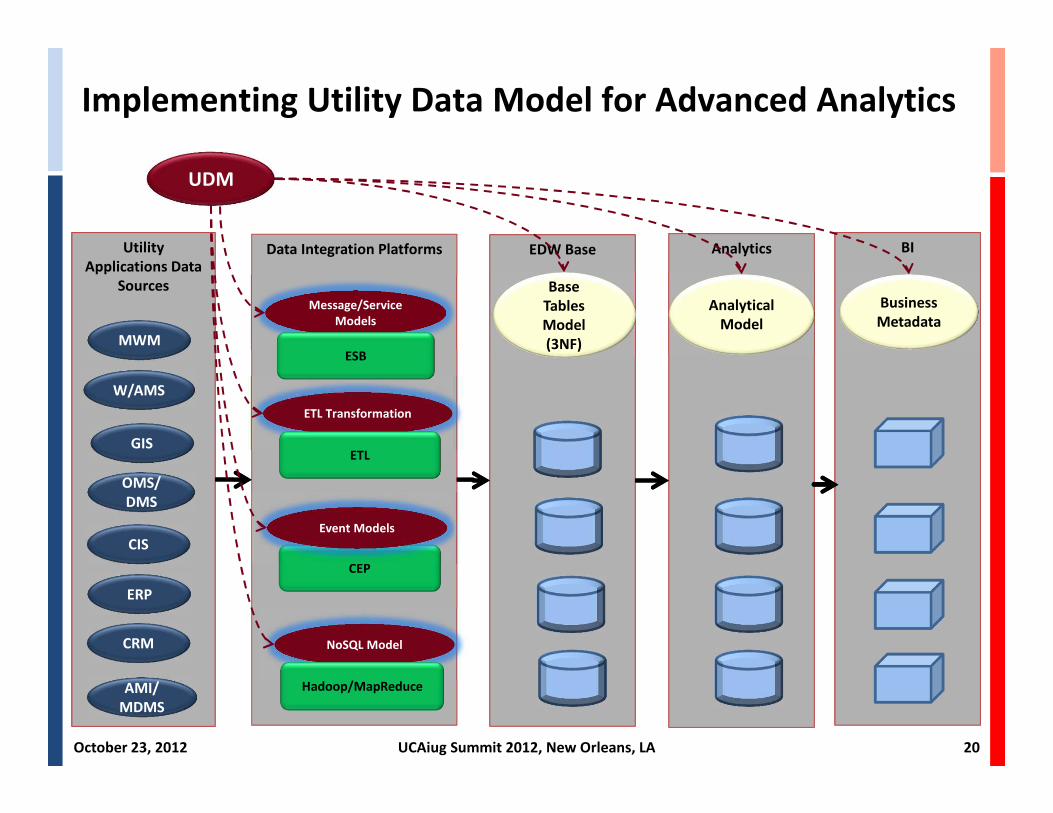
Implementing Utility Data Model for Advanced Analytics
Data Integration PlatformsUtility
Applications Data
Sources
CIS
ERP
CRM
EDW Base
Base
Tables
Model
(3NF)
Message/Service
Models
Message/Service
Models
ETL Transformation ETL Transformation
NoSQL ModelNoSQL Model
Analytics
Analytical
Model
BI
Business
Metadata
ESB
ETL
CEP
Hadoop/MapReduce
OMS/
DMS
GIS
W/AMS
MWM
AMI/
MDMS
Event ModelsEvent Models
UDM
October 23, 2012 UCAiug Summit 2012, New Orleans, LA 20
• Data is Not Just Data – Data about data is key to manage data.
• Think Enterprise – Act Domain Specific– Infrastructure, Models, Tools, Standards, Competency Centers
– Focus on specific business and domain requirements, solve real
world problems
• Advanced Analytics is not just IT. – Business, IT and Statisticians must come together.
– It is about the solution, not just tools for analysis and dashboards.
– It is about building long lasting competencies.
Key Takeaways
October 23, 2012 UCAiug Summit 2012, New Orleans, LA 21
Thank You
• For further information and/or collaboration,
please contact:
�Joe Zhou – [email protected]
�Tom Eyford – [email protected]
October 23, 2012 UCAiug Summit 2012, New Orleans, LA 22