Embed Size (px)
Citation preview
MODEC, Inc.2010 Financial ResultsAnalysts Presentation
February 25, 2011

Market Overview & Operations ReviewFinancial Results & Outlook
2
Market Overview
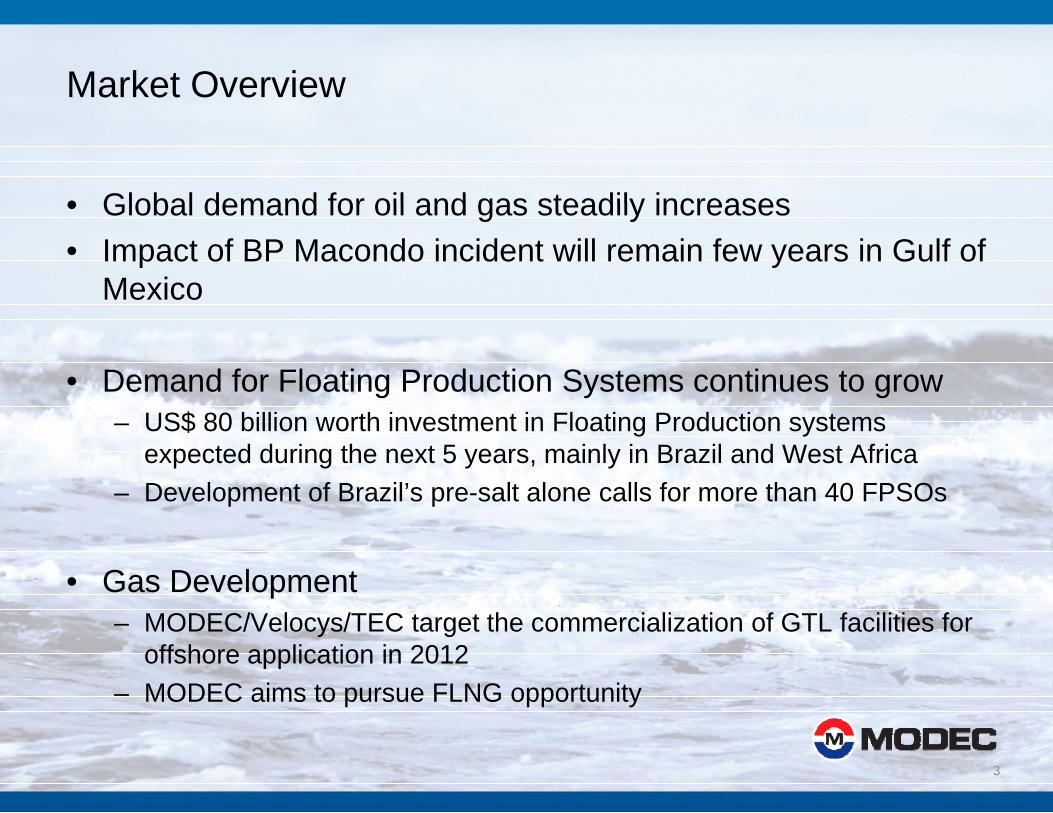
• Global demand for oil and gas steadily increases• Global demand for oil and gas steadily increases• Impact of BP Macondo incident will remain few years in Gulf of
Mexico
• Demand for Floating Production Systems continues to grow– US$ 80 billion worth investment in Floating Production systems
expected during the next 5 years, mainly in Brazil and West Africa– Development of Brazil’s pre-salt alone calls for more than 40 FPSOs
• Gas Development– MODEC/Velocys/TEC target the commercialization of GTL facilities for
offshore application in 2012– MODEC aims to pursue FLNG opportunity
3
2010 Overview
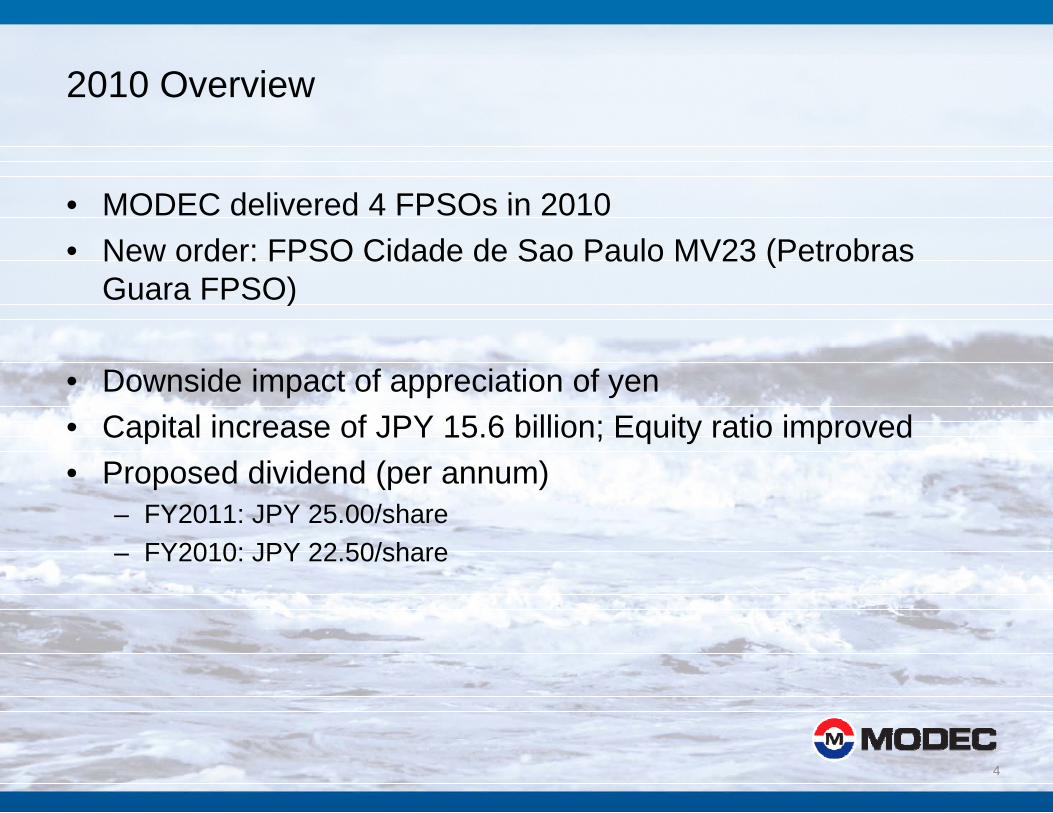
• MODEC delivered 4 FPSOs in 2010• MODEC delivered 4 FPSOs in 2010• New order: FPSO Cidade de Sao Paulo MV23 (Petrobras
Guara FPSO))
• Downside impact of appreciation of yen• Capital increase of JPY 15.6 billion; Equity ratio improved• Proposed dividend (per annum)
FY2011 JPY 25 00/ h– FY2011: JPY 25.00/share– FY2010: JPY 22.50/share
4
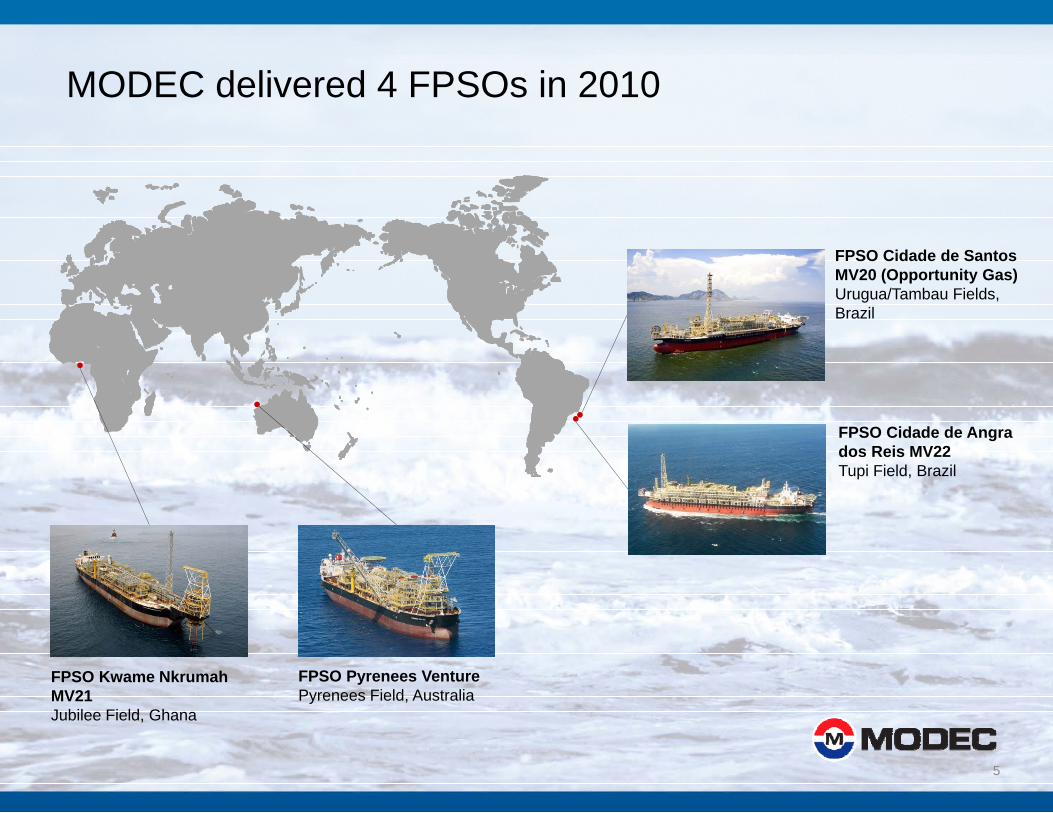
MODEC delivered 4 FPSOs in 2010
FPSO Cidade de Santos MV20 (Opportunity Gas)Urugua/Tambau Fields, Brazil
FPSO Cidade de Angra dos Reis MV22Tupi Field, Brazil
FPSO Pyrenees VenturePyrenees Field, Australia
FPSO Kwame Nkrumah MV21Jubilee Field Ghana
5
Jubilee Field, Ghana
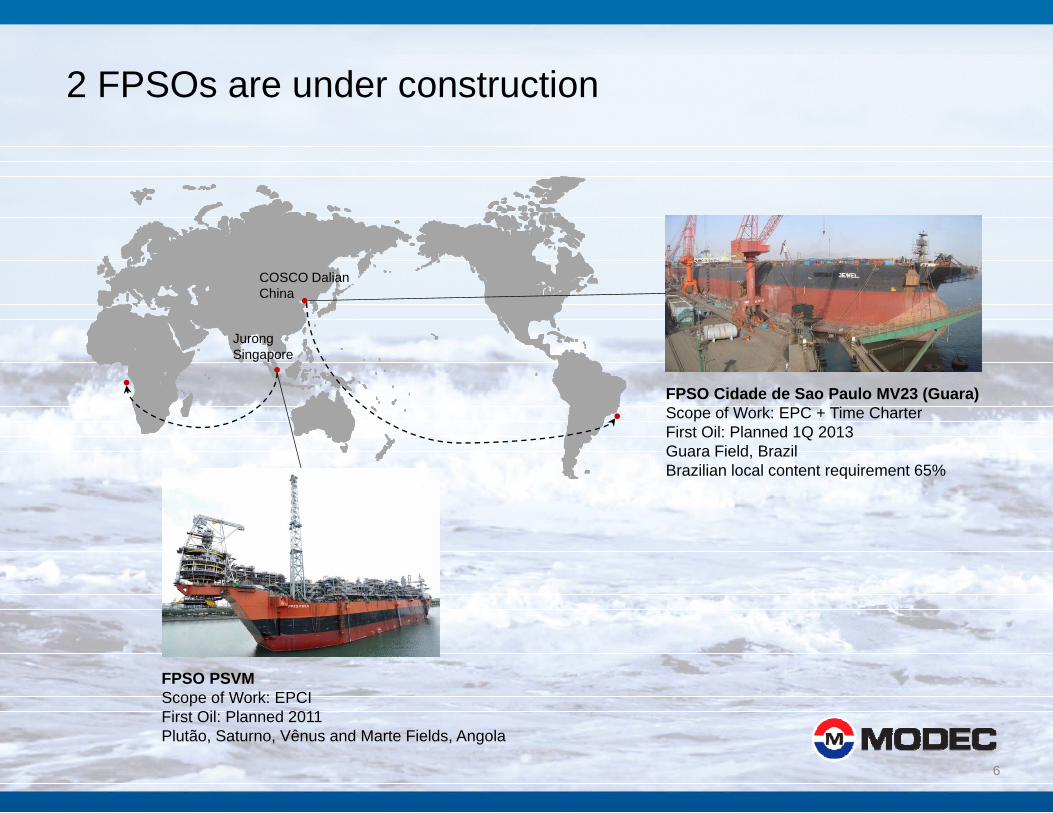
2 FPSOs are under construction
COSCO DalianChina
FPSO Cidade de Sao Paulo MV23 (Guara)S f W k EPC Ti Ch
JurongSingapore
Scope of Work: EPC + Time CharterFirst Oil: Planned 1Q 2013Guara Field, BrazilBrazilian local content requirement 65%
FPSO PSVMScope of Work: EPCIFi t Oil Pl d 2011
6
First Oil: Planned 2011Plutão, Saturno, Vênus and Marte Fields, Angola
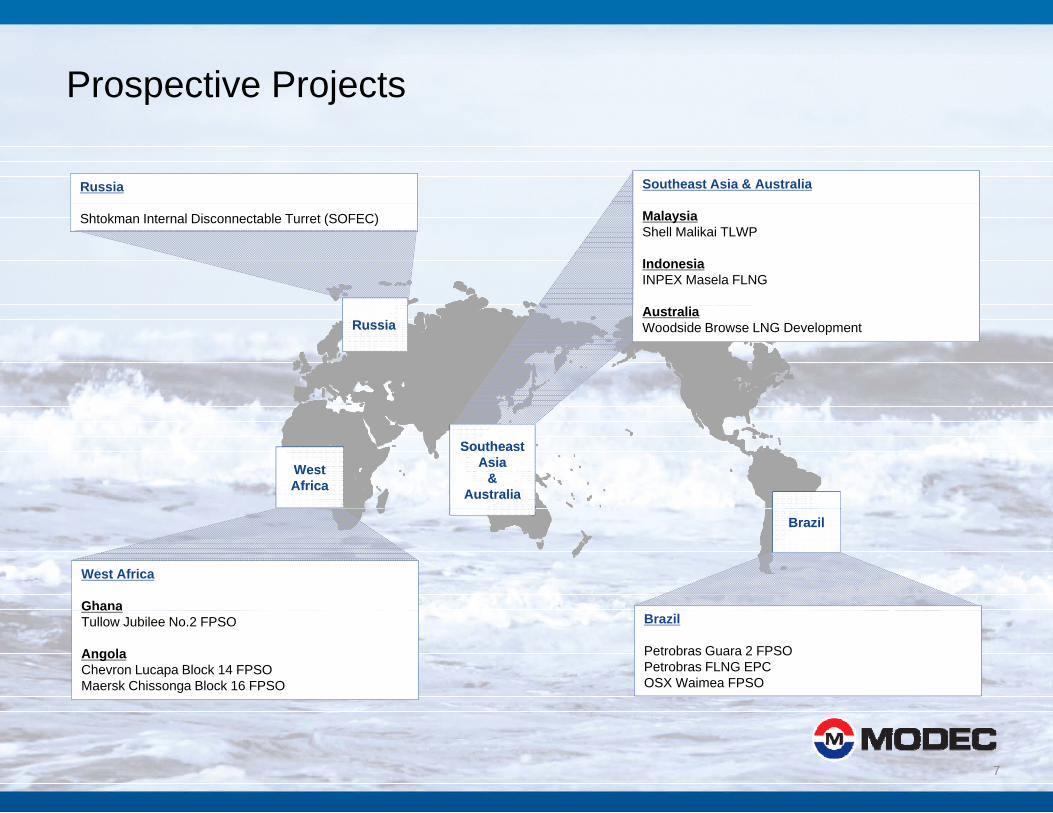
Prospective Projectsp j
Southeast Asia & AustraliaRussia
MalaysiaShell Malikai TLWP
IndonesiaINPEX Masela FLNG
Shtokman Internal Disconnectable Turret (SOFEC)
AustraliaWoodside Browse LNG DevelopmentRussiaRussia
West AfricaWest Africa
Southeast Asia
&Australia
Southeast Asia
&Australia
West Africa
Ghana
BrazilBrazil
G a aTullow Jubilee No.2 FPSO
AngolaChevron Lucapa Block 14 FPSOMaersk Chissonga Block 16 FPSO
Brazil
Petrobras Guara 2 FPSOPetrobras FLNG EPCOSX Waimea FPSO
7
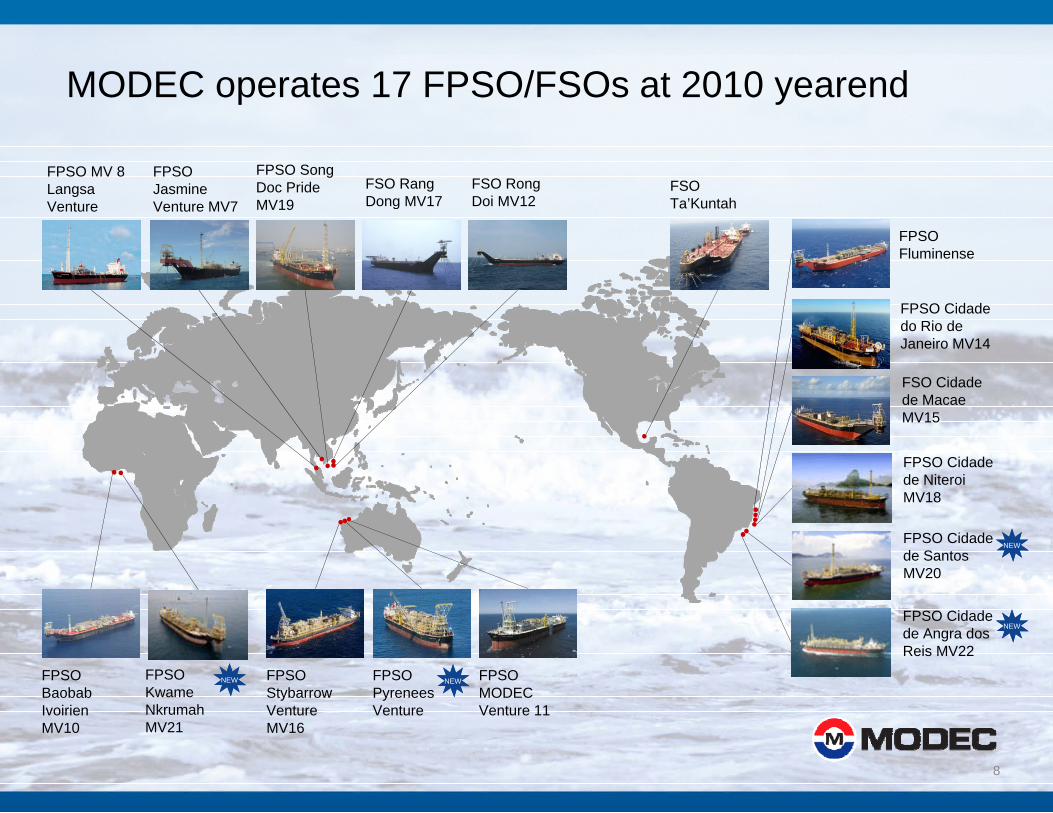
MODEC operates 17 FPSO/FSOs at 2010 yearendp y
FPSO Jasmine V t MV7
FPSO MV 8 Langsa V t
FSO Ta’Kuntah
FSO Rong Doi MV12
FSO Rang Dong MV17
FPSO Song Doc Pride MV19Venture MV7Venture Ta Kuntah
FPSO Cid d
Doi MV12
FPSO Fluminense
Dong MV17MV19
FPSO Cidade do Rio de Janeiro MV14
FSO Cidade de Macae
FPSO Cidade de Niteroi MV18
MV15
FPSO Cidade de Santos MV20
FPSO Cid d
NEWNEW
FPSO Baobab Ivoirien
FPSO MODEC Venture 11
FPSO Stybarrow Venture
FPSO Pyrenees Venture
FPSO Cidade de Angra dos Reis MV22
FPSO Kwame Nkrumah
NEWNEW NEWNEW
NEWNEW
8
Ivoirien MV10
Venture 11Venture MV16
VentureNkrumah MV21
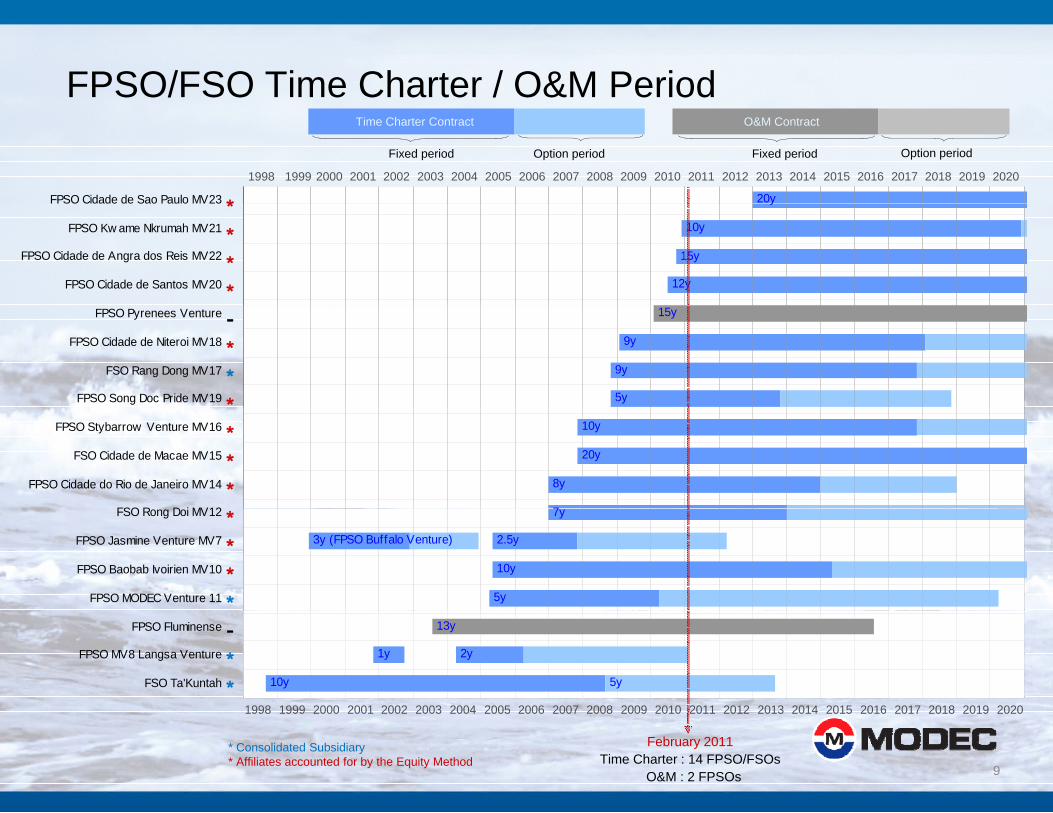
FPSO/FSO Time Charter / O&M Period
20yFPSO Cidade de Sao Paulo MV23
1998 1999 2000 2001 2002 2003 2004 2005 2006 2007 2008 2009 2010 2011 2012 2013 2014 2015 2016 2017 2018 2019 2020
*
Option periodFixed period
Time Charter Contract
Fixed period Option period
O&M Contract
y
10y
15y
12y
FPSO Cidade de Sao Paulo MV23
FPSO Kw ame Nkrumah MV21
FPSO Cidade de Angra dos Reis MV22
FPSO Cidade de Santos MV20
****
15y
9y
9y
5y
FPSO Pyrenees Venture
FPSO Cidade de Niteroi MV18
FSO Rang Dong MV17
FPSO Song Doc Pride MV19
-***
10y
20y
8y
7
FPSO Stybarrow Venture MV16
FSO Cidade de Macae MV15
FPSO Cidade do Rio de Janeiro MV14
FSO R D i MV12
***
7y
3y (FPSO Buffalo Venture)
10y
5y
2.5y
FSO Rong Doi MV12
FPSO Jasmine Venture MV7
FPSO Baobab Ivoirien MV10
FPSO MODEC Venture 11
****
1998 1999 2000 2001 2002 2003 2004 2005 2006 2007 2008 2009 2010 2011 2012 2013 2014 2015 2016 2017 2018 2019 2020
13y
1y
10y 5y
2y
FPSO Fluminense
FPSO MV8 Langsa Venture
FSO Ta'Kuntah
-**
9
1998 1999 2000 2001 2002 2003 2004 2005 2006 2007 2008 2009 2010 2011 2012 2013 2014 2015 2016 2017 2018 2019 2020
* Consolidated Subsidiary* Affiliates accounted for by the Equity Method
February 2011Time Charter : 14 FPSO/FSOs
O&M : 2 FPSOs

Market Overview & Operations ReviewFinancial Results & Outlook
10
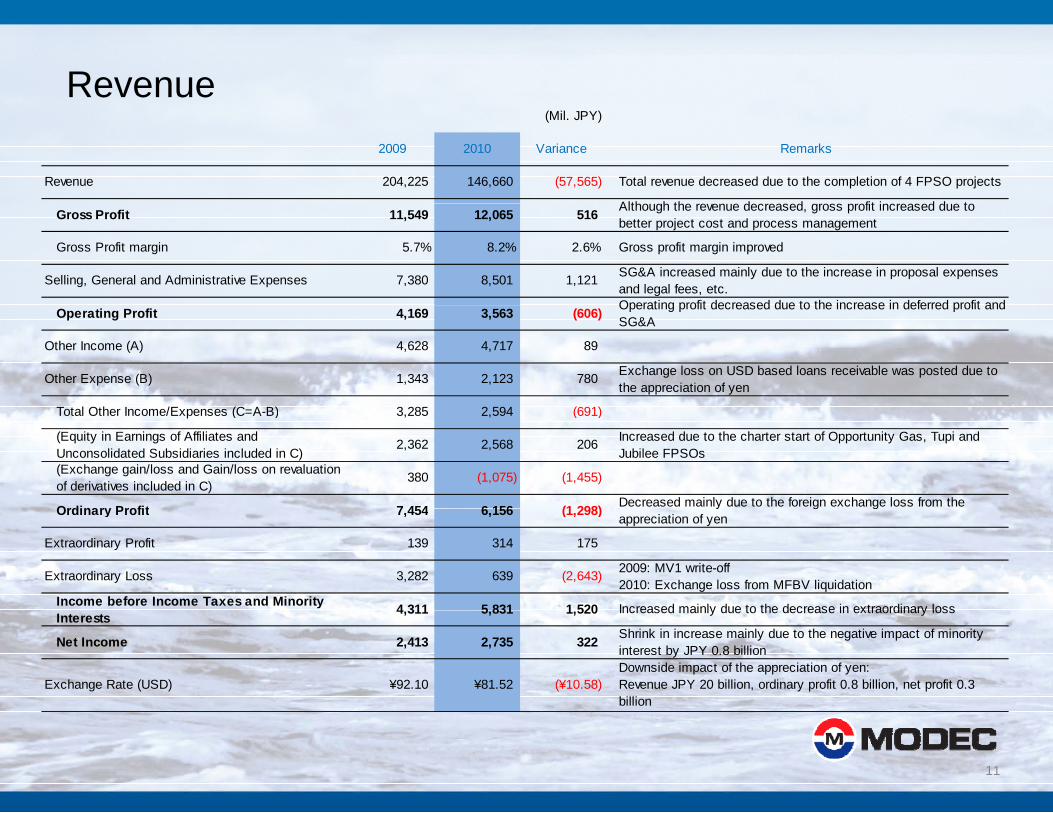
Revenue(Mil. JPY)
2009 2010 Variance Remarks
Revenue 204,225 146,660 (57,565) Total revenue decreased due to the completion of 4 FPSO projects
Alth h th d d fit i d d tGross Profit 11,549 12,065 516 Although the revenue decreased, gross profit increased due tobetter project cost and process management
Gross Profit margin 5.7% 8.2% 2.6% Gross profit margin improved
Selling, General and Administrative Expenses 7,380 8,501 1,121 SG&A increased mainly due to the increase in proposal expensesand legal fees, etc.Operating profit decreased due to the increase in deferred profit andOperating Profit 4,169 3,563 (606) Operating profit decreased due to the increase in deferred profit andSG&A
Other Income (A) 4,628 4,717 89
Other Expense (B) 1,343 2,123 780 Exchange loss on USD based loans receivable was posted due tothe appreciation of yen
T t l Oth I /E (C A B) 3 285 2 594 (691)Total Other Income/Expenses (C=A-B) 3,285 2,594 (691)
(Equity in Earnings of Affiliates andUnconsolidated Subsidiaries included in C)
2,362 2,568 206 Increased due to the charter start of Opportunity Gas, Tupi andJubilee FPSOs
(Exchange gain/loss and Gain/loss on revaluationof derivatives included in C)
380 (1,075) (1,455)
Ordinary Profit 7 454 6 156 (1 298) Decreased mainly due to the foreign exchange loss from theOrdinary Profit 7,454 6,156 (1,298) y g gappreciation of yen
Extraordinary Profit 139 314 175
Extraordinary Loss 3,282 639 (2,643) 2009: MV1 write-off2010: Exchange loss from MFBV liquidation
Income before Income Taxes and Minority 4 311 5 831 1 520 Increased mainly due to the decrease in extraordinary lossInterests 4,311 5,831 1,520 Increased mainly due to the decrease in extraordinary loss
Net Income 2,413 2,735 322 Shrink in increase mainly due to the negative impact of minorityinterest by JPY 0.8 billion
Exchange Rate (USD) ¥92.10 ¥81.52 (¥10.58)Downside impact of the appreciation of yen:Revenue JPY 20 billion, ordinary profit 0.8 billion, net profit 0.3billion
11
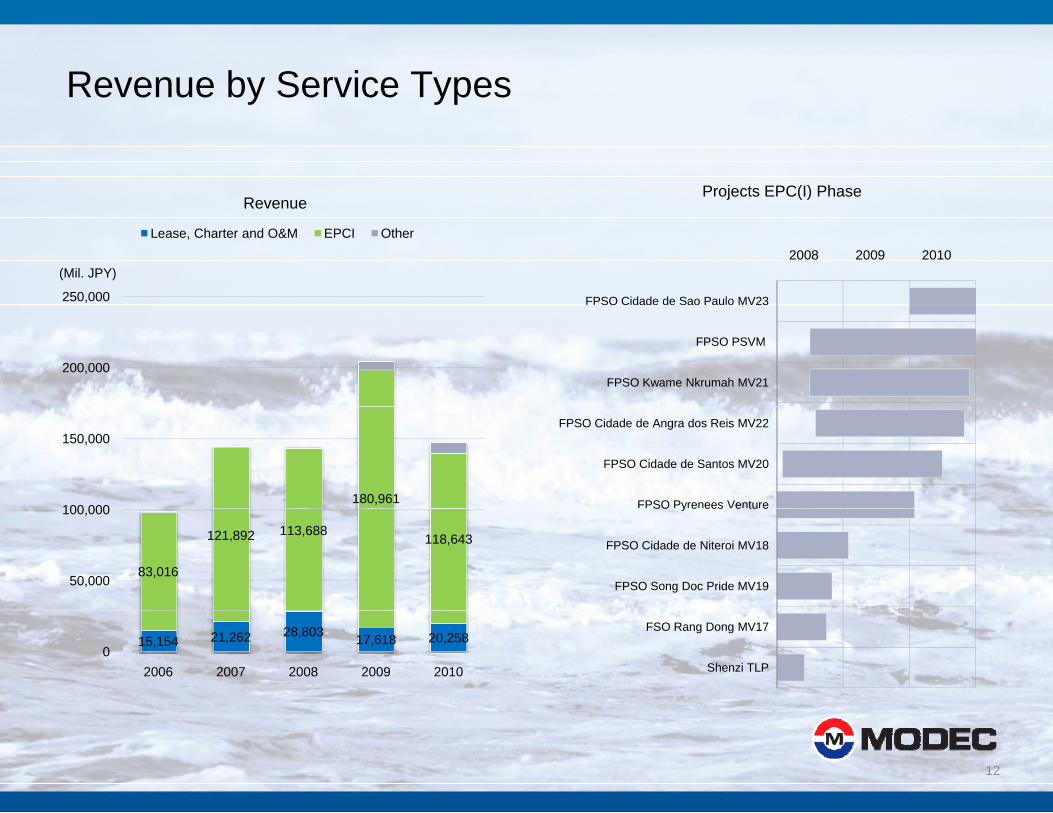
Revenue by Service Typesy yp
Projects EPC(I) PhaseRevenue
FPSO Cidade de Sao Paulo MV23250,000
(Mil. JPY)
Revenue
Lease, Charter and O&M EPCI Other2008 2009 2010
FPSO PSVM
FPSO Kwame Nkrumah MV21200,000
FPSO Cidade de Angra dos Reis MV22
FPSO Cidade de Santos MV20
FPSO Pyrenees Venture180,961100 000
150,000
SO y e ees e tu e
FPSO Cidade de Niteroi MV18
FPSO Song Doc Pride MV1983,016
121,892 113,688 118,643
50,000
100,000
FSO Rang Dong MV17
Shenzi TLP
15,154 21,262 28,803 17,618 20,2580
2006 2007 2008 2009 2010
12
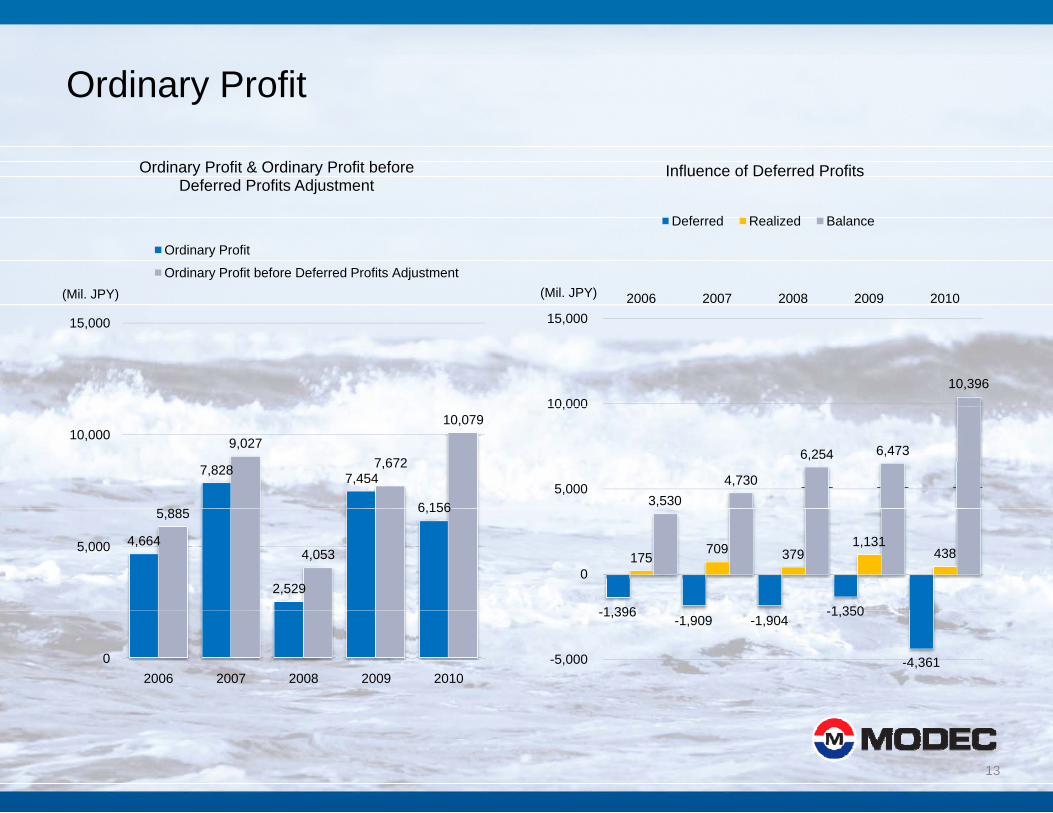
Ordinary Profity
Ordinary Profit & Ordinary Profit before Deferred Profits Adjustment
Influence of Deferred Profits
(Mil. JPY)
Ordinary Profit
Ordinary Profit before Deferred Profits Adjustment
2006 2007 2008 2009 2010(Mil. JPY)
Deferred Realized Balance
15,000
10,39610,000
15,000
7,828 7,454
6 1565 885
9,0277,672
10,07910,000
3,5304,730
6,254 6,473
5,000
10,000
4,664
2,529
6,1565,885
4,0535,000
1 396 1 350
175709 379
1,131438
0
02006 2007 2008 2009 2010
-1,396 -1,909 -1,904 -1,350
-4,361 -5,000
13
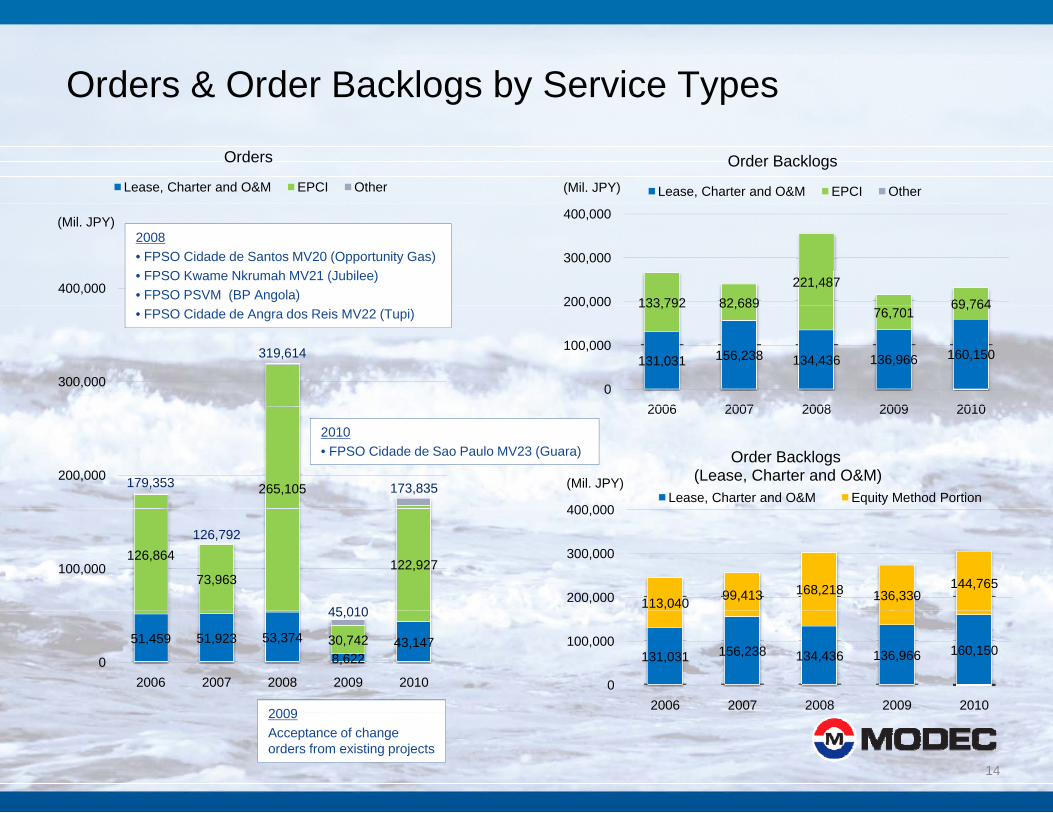
Orders & Order Backlogs by Service Types
Orders
Lease, Charter and O&M EPCI Other
g y yp
(Mil. JPY)
Order Backlogs
Lease, Charter and O&M EPCI Other
400,000
(Mil. JPY)
133 792 82 689221,487
69 764200,000
300,000
400,000
2008• FPSO Cidade de Santos MV20 (Opportunity Gas)• FPSO Kwame Nkrumah MV21 (Jubilee)• FPSO PSVM (BP Angola)
319,614
300,000131,031 156,238 134,436 136,966 160,150
133,792 82,68976,701 69,764
0
100,000
200,000
2006 2007 2008 2009 2010
• FPSO Cidade de Angra dos Reis MV22 (Tupi)
265,105179,353 173,835200,000
2006 2007 2008 2009 2010
400 000
(Mil. JPY)
Order Backlogs(Lease, Charter and O&M)
Lease, Charter and O&M Equity Method Portion
2010• FPSO Cidade de Sao Paulo MV23 (Guara)
126,864
73,963122,927
126,792
45 010
100,000
113,040 99,413 168,218 136,330144,765
200,000
300,000
400,000
51,459 51,923 53,3748,622
43,14730,742
45,010
02006 2007 2008 2009 2010
2009
131,031 156,238 134,436 136,966 160,150
0
100,000
2006 2007 2008 2009 2010
14
2009Acceptance of change orders from existing projects
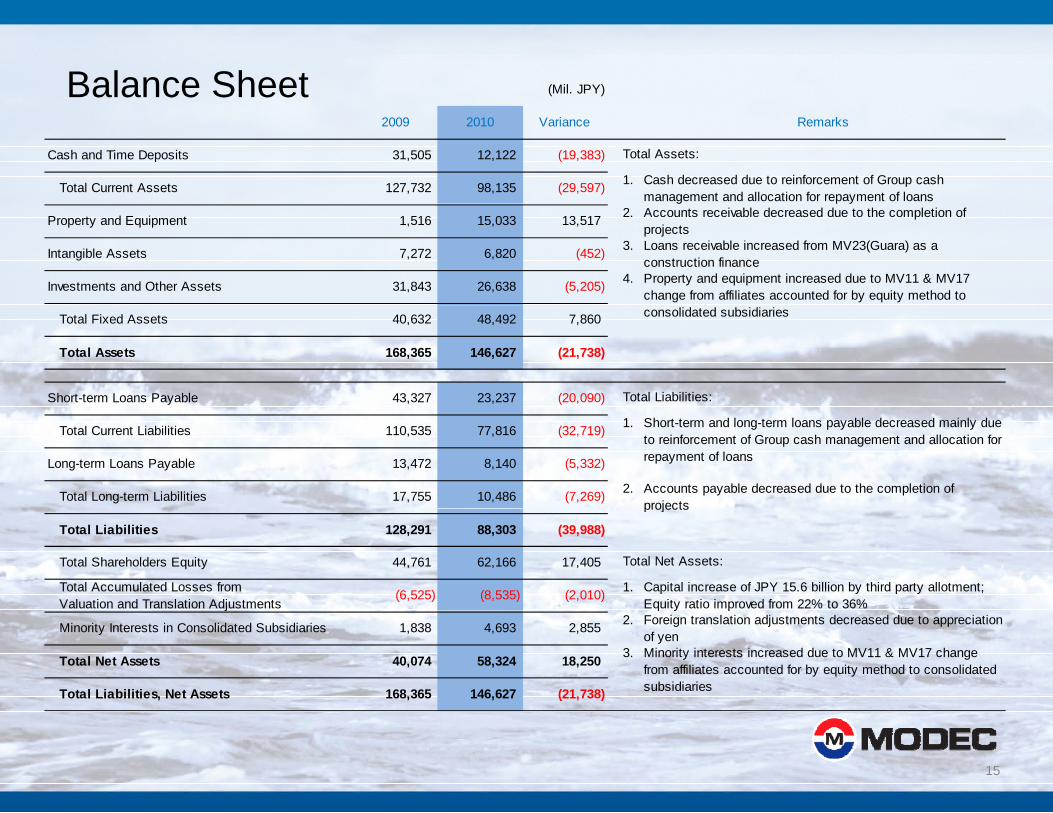
Balance Sheet (Mil. JPY)
2009 2010 Variance Remarks
Cash and Time Deposits 31,505 12,122 (19,383)
Total Current Assets 127,732 98,135 (29,597) 1. Cash decreased due to reinforcement of Group cashmanagement and allocation for repayment of loans
Total Assets:
g p y
Property and Equipment 1,516 15,033 13,517 2. Accounts receivable decreased due to the completion ofprojects
Intangible Assets 7,272 6,820 (452) 3. Loans receivable increased from MV23(Guara) as aconstruction finance
Investments and Other Assets 31,843 26,638 (5,205) 4. Property and equipment increased due to MV11 & MV17change from affiliates accounted for by equity method to
Total Fixed Assets 40,632 48,492 7,860
Total Assets 168,365 146,627 (21,738)
Short-term Loans Payable 43,327 23,237 (20,090) Total Liabilities:
consolidated subsidiaries
Total Current Liabilities 110,535 77,816 (32,719) 1.
Long-term Loans Payable 13,472 8,140 (5,332)
Total Long-term Liabilities 17,755 10,486 (7,269) 2. Accounts payable decreased due to the completion ofprojects
Short-term and long-term loans payable decreased mainly dueto reinforcement of Group cash management and allocation forrepayment of loans
projects
Total Liabilities 128,291 88,303 (39,988)
Total Shareholders Equity 44,761 62,166 17,405
Total Accumulated Losses fromValuation and Translation Adjustments
(6,525) (8,535) (2,010) 1. Capital increase of JPY 15.6 billion by third party allotment;Equity ratio improved from 22% to 36%
Total Net Assets:
j q y p
Minority Interests in Consolidated Subsidiaries 1,838 4,693 2,855 2. Foreign translation adjustments decreased due to appreciationof yen
Total Net Assets 40,074 58,324 18,250 3.
Total Liabilities, Net Assets 168,365 146,627 (21,738)
Minority interests increased due to MV11 & MV17 changefrom affiliates accounted for by equity method to consolidatedsubsidiaries
15
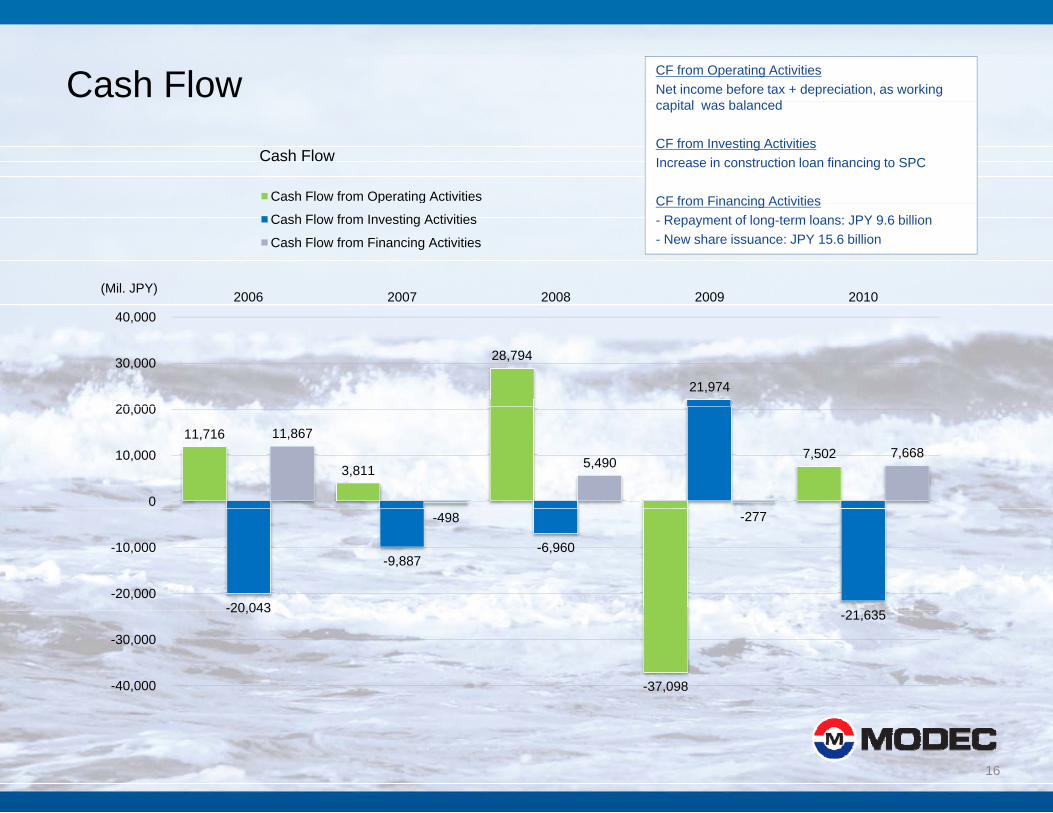
Cash Flow CF from Operating ActivitiesNet income before tax + depreciation, as working
it l b l d
Cash Flow
Cash Flow from Operating Activities
capital was balanced
CF from Investing ActivitiesIncrease in construction loan financing to SPC
CF from Financing Activities
2006 2007 2008 2009 2010(Mil. JPY)
g
Cash Flow from Investing Activities
Cash Flow from Financing Activities
CF from Financing Activities- Repayment of long-term loans: JPY 9.6 billion- New share issuance: JPY 15.6 billion
28,794
21,974
20 000
30,000
40,000
11,716
3,811 7,502
11,867
5,4907,668
0
10,000
20,000
-20 043
-9,887-6,960
21 635
-498 -277
-20,000
-10,000
-37,098
20,043 -21,635
-40,000
-30,000
16
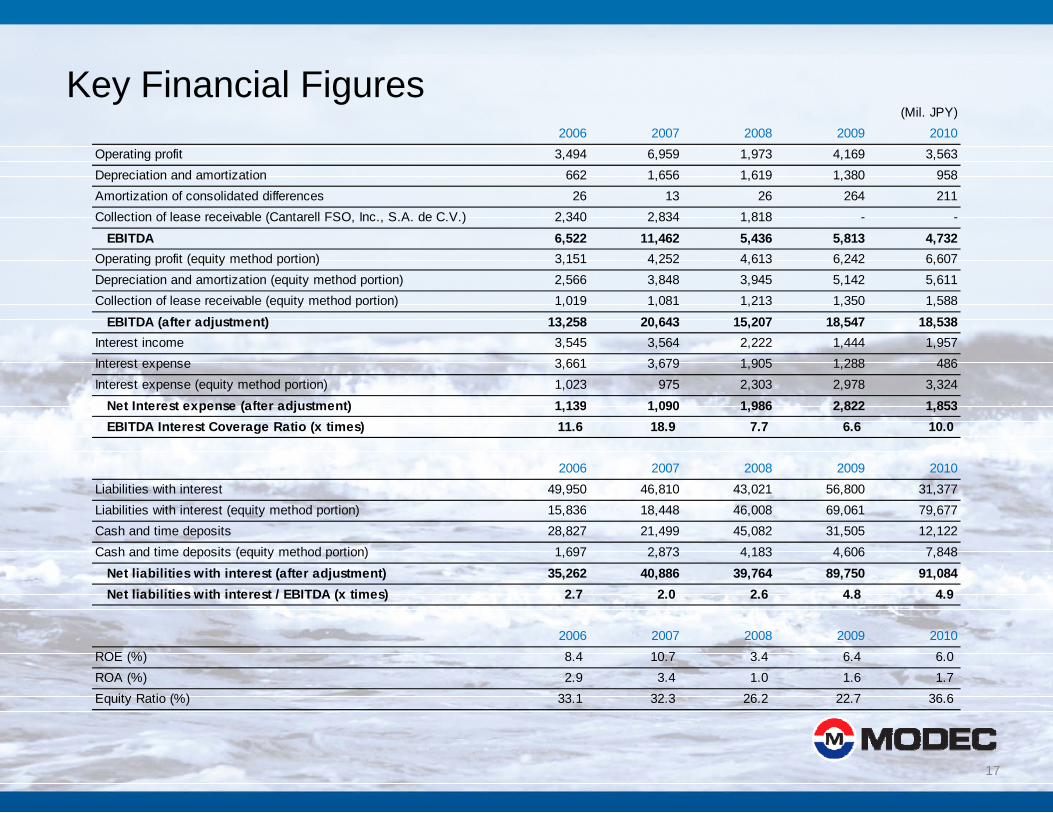
Key Financial Figuresy g(Mil. JPY)
2006 2007 2008 2009 2010Operating profit 3,494 6,959 1,973 4,169 3,563Depreciation and amortization 662 1,656 1,619 1,380 958Amortization of consolidated differences 26 13 26 264 211Collection of lease receivable (Cantarell FSO, Inc., S.A. de C.V.) 2,340 2,834 1,818 - -
EBITDA 6,522 11,462 5,436 5,813 4,732Operating profit (equity method portion) 3,151 4,252 4,613 6,242 6,607Depreciation and amortization (equity method portion) 2,566 3,848 3,945 5,142 5,611Collection of lease receivable (equity method portion) 1,019 1,081 1,213 1,350 1,588( q y p ) , , , , ,
EBITDA (after adjustment) 13,258 20,643 15,207 18,547 18,538Interest income 3,545 3,564 2,222 1,444 1,957Interest expense 3,661 3,679 1,905 1,288 486Interest expense (equity method portion) 1,023 975 2,303 2,978 3,324
Net Interest expense (after adjustment) 1 139 1 090 1 986 2 822 1 853Net Interest expense (after adjustment) 1,139 1,090 1,986 2,822 1,853EBITDA Interest Coverage Ratio (x times) 11.6 18.9 7.7 6.6 10.0
2006 2007 2008 2009 2010Liabilities with interest 49,950 46,810 43,021 56,800 31,377Liabilities with interest (equity method portion) 15 836 18 448 46 008 69 061 79 677Liabilities with interest (equity method portion) 15,836 18,448 46,008 69,061 79,677Cash and time deposits 28,827 21,499 45,082 31,505 12,122Cash and time deposits (equity method portion) 1,697 2,873 4,183 4,606 7,848
Net liabilities with interest (after adjustment) 35,262 40,886 39,764 89,750 91,084Net liabilities with interest / EBITDA (x times) 2.7 2.0 2.6 4.8 4.9
2006 2007 2008 2009 2010ROE (%) 8.4 10.7 3.4 6.4 6.0ROA (%) 2.9 3.4 1.0 1.6 1.7Equity Ratio (%) 33.1 32.3 26.2 22.7 36.6
17
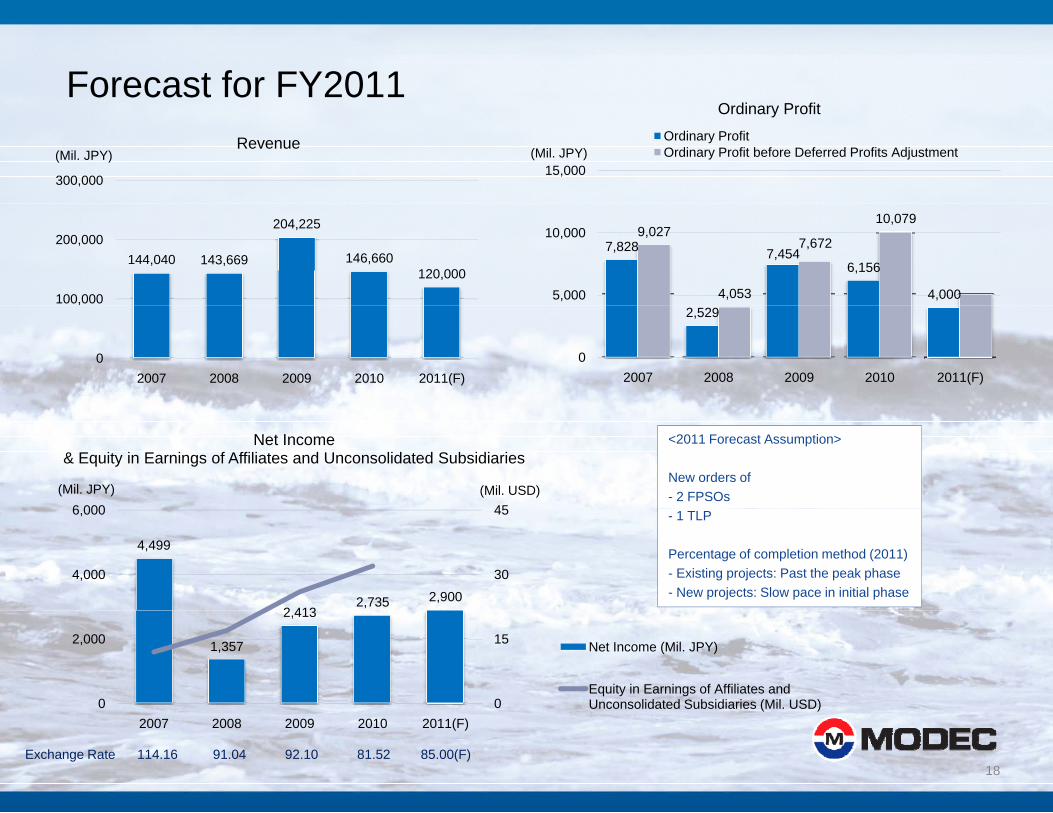
Forecast for FY2011
300,000
(Mil. JPY)Revenue
15,000(Mil. JPY)
Ordinary ProfitOrdinary ProfitOrdinary Profit before Deferred Profits Adjustment
144,040 143,669
204,225
146,660120,000
100,000
200,000 7,828 7,4546,156
4,000
9,027
4,053
7,672
10,079
5,000
10,000
0
,
2007 2008 2009 2010 2011(F)
2,529
02007 2008 2009 2010 2011(F)
456 000(Mil. USD)(Mil. JPY)
Net Income & Equity in Earnings of Affiliates and Unconsolidated Subsidiaries
<2011 Forecast Assumption>
New orders of - 2 FPSOs
4,499
2 4132,735 2,900
30
45
4,000
6,000 - 1 TLP
Percentage of completion method (2011)- Existing projects: Past the peak phase- New projects: Slow pace in initial phase
1,357
2,413
0
15
0
2,000 Net Income (Mil. JPY)
Equity in Earnings of Affiliates and Unconsolidated Subsidiaries (Mil. USD)
18Exchange Rate 114.16 91.04 92.10 81.52 85.00(F)
2007 2008 2009 2010 2011(F)