Embed Size (px)
Citation preview
Mode-Seeking on Hypergraphs for Robust Geometric Model Fitting
Hanzi Wang1,∗, Guobao Xiao1,∗, Yan Yan1, David Suter2
1Fujian Key Laboratory of Sensing and Computing for Smart City, School of Information Science and Engineering, Xiamen University, China2School of Computer Science, The University of Adelaide, Australia
Abstract
In this paper, we propose a novel geometric model fit-
ting method, called Mode-Seeking on Hypergraphs (MSH),
to deal with multi-structure data even in the presence of se-
vere outliers. The proposed method formulates geometric
model fitting as a mode seeking problem on a hypergraph in
which vertices represent model hypotheses and hyperedges
denote data points. MSH intuitively detects model instances
by a simple and effective mode seeking algorithm. In addi-
tion to the mode seeking algorithm, MSH includes a sim-
ilarity measure between vertices on the hypergraph and a
“weight-aware sampling” technique. The proposed method
not only alleviates sensitivity to the data distribution, but al-
so is scalable to large scale problems. Experimental results
further demonstrate that the proposed method has signifi-
cant superiority over the state-of-the-art fitting methods on
both synthetic data and real images.
1. Introduction
Geometric model fitting is a challenging research prob-
lem for a variety of applications in computer vision, such as
optical flow calculation, motion segmentation and homog-
raphy/fundamental matrix estimation. Given that data may
contain outliers, the task of geometric model fitting is to
robustly estimate the number and the parameters of model
instances in the data.
A number of robust geometric model fitting methods
(e.g., [2, 5, 6, 10, 16, 19]) have been proposed to work on
the task. One of the most popular robust fitting methods is
RANSAC [5] due to its efficiency and simplicity. Howev-
er, RANSAC is sensitive to the inlier scale and is originally
designed to fit single-structure data. During the past few
decades, many fitting methods have been proposed to deal
with multi-structure data, such as KF [2], PEARL [6], AK-
SWH [19], J-linkage [16] and T-linkage [10].
Recently, some hypergraph based methods, e.g., [7, 9,
12, 13, 20], have been proposed for model fitting. Com-
*equal contribution
(a)
(c)
1 2 3 4 5 6 7 8 9 100
0.2
0.4
0.6
0.8
1
Th
e m
inim
um
T−
dis
tan
ce
Vertices
(e)
(b)
−1
0
1
−1
0
1
0
0.01
0.02
0.03
0.04
0.05
p1p2
We
igh
tin
g S
co
re
(d)
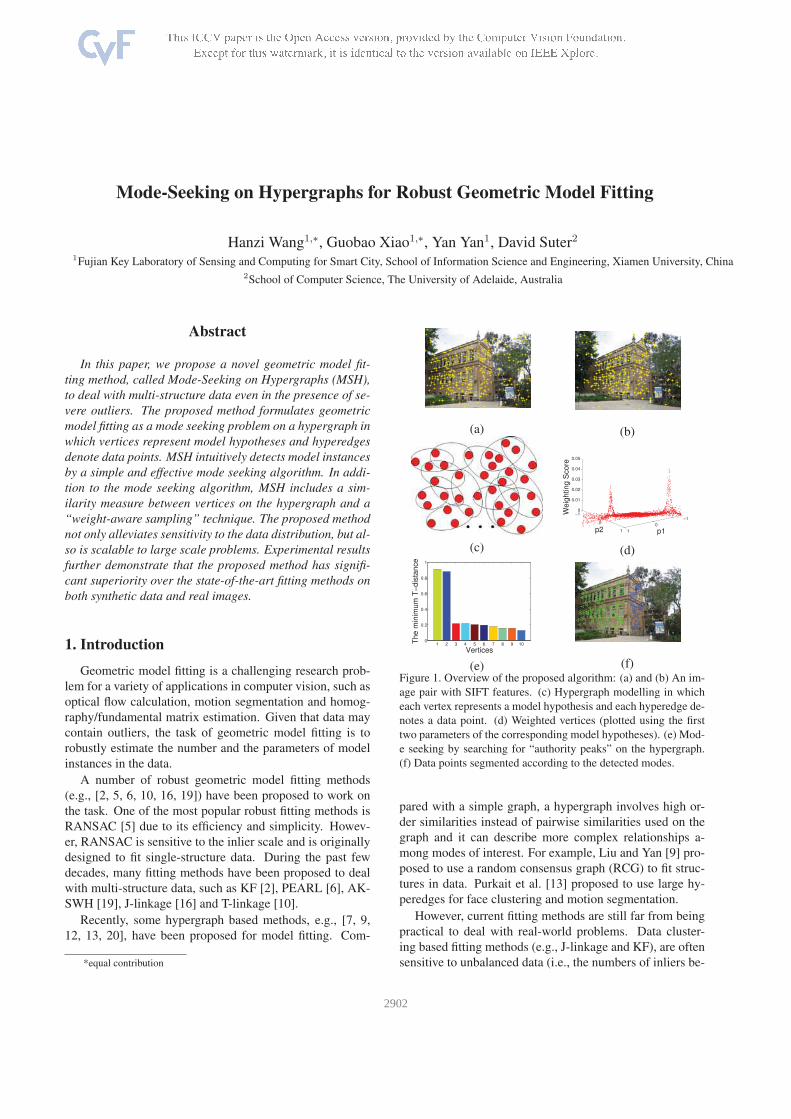
(f)Figure 1. Overview of the proposed algorithm: (a) and (b) An im-
age pair with SIFT features. (c) Hypergraph modelling in which
each vertex represents a model hypothesis and each hyperedge de-
notes a data point. (d) Weighted vertices (plotted using the first
two parameters of the corresponding model hypotheses). (e) Mod-
e seeking by searching for “authority peaks” on the hypergraph.
(f) Data points segmented according to the detected modes.
pared with a simple graph, a hypergraph involves high or-
der similarities instead of pairwise similarities used on the
graph and it can describe more complex relationships a-
mong modes of interest. For example, Liu and Yan [9] pro-
posed to use a random consensus graph (RCG) to fit struc-
tures in data. Purkait et al. [13] proposed to use large hy-
peredges for face clustering and motion segmentation.
However, current fitting methods are still far from being
practical to deal with real-world problems. Data cluster-
ing based fitting methods (e.g., J-linkage and KF), are often
sensitive to unbalanced data (i.e., the numbers of inliers be-
43212902
longing to different model instances in data are significantly
different), which is quite common in practical applications.
In addition, these methods have difficulties in dealing with
data points near the intersection of two model instances.
Hypergraph based fitting methods (e.g., [9, 12]) often need
to project from a hypergraph to an induced graph, which
may cause information-loss and thus impact the accuracy
of the methods. Other robust fitting methods (e.g., AK-
SWH [19], T-linkage [10], HS [20], etc.) also have some
specific problems, such as: some model hypotheses corre-
sponding to model instances in data may be removed during
the selection of significant hypotheses in AKSWH, and the
computational cost of T-linkage is typically high due to the
agglomerative clustering procedure, and HS also has a com-
plexity problem due to the expansion and dropping strategy.
In this paper, we propose a simple and effective mode-
seeking fitting algorithm on hypergraphs to fit and segment
multi-structure data in the parameter space. The proposed
method (MSH), starts from hypergraph modelling, in which
a hypergraph is constructed based on inlier scale estimation
for each dataset. Compared with the hypergraph construct-
ed in the previous methods [7, 9, 12, 13], where a hyper-
edge is constrained to connect with a fixed number of ver-
tices, the hyperedges constructed in this paper can connect
with varying number of vertices. We measure the weight
of each vertex by using the non-parametric kernel density
estimate technique [18]. Based on the hypergraph, a nov-
el mode seeking algorithm is proposed to intuitively detect
modes by searching for “authority peaks”, and we also sam-
ple vertices by using a “weight-aware sampling” technique
to improve the effectiveness of the proposed method. Fi-
nally, we estimate the number and the parameters of model
instances in data according to the detected modes. The main
steps are shown in Fig. 1.
The proposed method (MSH) has three main advantages
over previous model fitting methods. First, the constructed
hypergraphs can effectively represent the complex relation-
ships among model hypotheses and data points, and it can
be directly used for geometric model fitting. Second, MSH
deals with geometric model fitting in the parameter space to
alleviate sensitivity to the data distribution, even in the pres-
ence of seriously unbalanced data. Third, MSH implements
mode seeking by analyzing the similarity between vertices
on the hypergraphs, which is scalable to large scale prob-
lems. We demonstrate that MSH is a highly robust method
for geometric model fitting by conducting extensive experi-
mental evaluations and comparisons in Sec. 5.
2. Hypergraphs and Weighting Score
In this study, the geometric model fitting problem is for-
mulated as a mode-seeking problem on a hypergraph. In
Sec. 2.1, we express the relationships among model hy-
potheses and data points with the hypergraph, in which a
vertex represents a model hypothesis and a hyperedge de-
notes a data point. We also assign each vertex a weighting
score based on the non-parametric kernel density estimate
technique [18] in Sec. 2.2.
2.1. Hypergraphs
A hypergraph G = (V, E ,W) consists of vertices V , hy-
peredges E , and weights W . Each vertex v is weighted by
a weighting score w(v). When v ∈ e, a hyperedge e is inci-
dent with a vertex v. Then an incident matrix H, satisfying
h(v, e) = 1 if v ∈ e and 0 otherwise, is used to represen-
t the relationships between vertices and hyperedges in the
hypergraph G. For a vertex v ∈ V , its degree is defined by
δ(v) =∑
e∈Eh(v, e).
Now we describe the detailed procedure of hypergraph
construction as follows: Given a set of data points X =xi
ni=1, we first sample a set of minimal subsets from X.
A minimal subset contains the minimum number of data
points which is necessary to estimate a model hypothesis
(e.g., 2 for line fitting and 4 for homography fitting). Then
we generate a set of model hypotheses using the minimal
subsets and estimate their inlier scales. In this paper, we use
IKOSE [19] as the inlier scale estimator due to its efficien-
cy. After that, we connect each vertex (i.e., a model hypoth-
esis) to the corresponding hyperedges (i.e., the inliers of the
model hypothesis). Therefore, the complex relationships a-
mong model hypotheses and data points can be effectively
characterized on by the hypergraph. In this manner, we can
directly perform mode-seeking on the hypergraph for model
fitting.
2.2. Weighting Score
We weight a model hypothesis (i.e., a vertex v) and as-
sign a weighting score for the model hypothesis using the
density estimate technique through the following equation
which is similar to [19]
π(v) =1
n
∑
e∈E
Ψ(re(v)/b(v))
s(v)b(v), (1)
where Ψ(·) is a kernel function (such as the Epanechnikov
kernel); re(v) is a residual measured with the Sampon Dis-
tance [17] from the model hypothesis (v) to a data point
(i.e., a hyperedge e); n and s(v) are the number of data
points and the inlier scale of the model hypothesis, respec-
tively; b(v) is a bandwidth.
Since the “good” model hypotheses corresponding to the
model instances in data have significantly more data points
with small residuals than the other “bad” model hypotheses,
the weighting scores of the vertices corresponding to the
“good” model hypotheses should be higher than those of
the other vertices [19]. However, weighting a vertex based
on residuals may be not robust to outliers, especially for
43222903
extreme outliers. To weaken the impacts of outliers, we
only consider the residuals of the corresponding inlier data
points belonging to the model hypotheses. Thus, based on
a hypergraph G, Eq. (1) can be rewritten as
w(v) =1
δ(v)
∑
e∈E
h(v, e)Ψ(re(v)/b(v))
s(v)b(v), (2)
where δ(v) is the degree of vertex v and h(v, e) is an entry
of the incident matrix H belonging to the hypergraph G.
Based on the weighting score, authority peaks on a hy-
pergraph can be defined as follows:
Definition 1 Authority peaks are the vertices that have
the local maximum values of weighting scores on the hyper-
graph.
The vertices that have the local maximum values of
weighting scores correspond to the modes on a hypergraph,
i.e., the model instances in data. This definition is consistent
with the conventional concept of modes, which are defined
as the significant peaks of the density distribution in the pa-
rameter space [3, 4, 22].
3. Mode-Seeking on Hypergraphs
In this section, we perform mode seeking by analyzing
the similarity between vertices on a hypergraph. We de-
velop an effective similarity measure between vertices in
Sec. 3.1 and propose a mode seeking algorithm in Sec. 3.2.
In addition, we further propose a weight-aware sampling
(WAS) technique in Sec. 3.3 to improve the effectiveness of
the proposed algorithm.
3.1. Similarity Measure
An effective similarity measure is proposed to describe
the relationships between any two vertices in a hypergraph
based on the Tanimoto distance [15] (referred to as T-
distance), which measures the degree of overlap between
two hyperedge sets connected by two vertices.
Similar to [10], we first define the preference function of
a vertex vp as
Cvp=
exp−re(vp)s(vp)
, if re(vp) ≤ Es(vp),
0, otherwise,(3)
where E is a threshold (E is usually set to 2.5 to include
98% inliers of a Gaussian distribution). Note that the pref-
erence function of each vertex can be effectively expressed
by Eq. (3), which takes advantages of the information of
residuals of data points.
Considering a hypergraph, we can rewrite Eq. (3) as
Cvp= h(vp, e) exp−
re(vp)
s(vp), ∀e ∈ E . (4)
Then the T-distance between two vertices vp and vqbased on the corresponding preference functions is given
by [15]
T (Cvp, Cvq
) = 1−〈Cvp
, Cvq〉
‖Cvp‖2 + ‖Cvq
‖2 − 〈Cvp, Cvq
〉, (5)
where 〈·, ·〉 and ‖ · ‖ indicate the standard inner product and
the corresponding induced norm, respectively.
Although [10] also employs the T-distance as a similarity
measure, our use of T-distance has significant differences:
1) We define the preference function of a hyperedge set (i.e.,
the inlier data points) with respect to a vertex (i.e., a model
hypothesis), while the authors in [10] define the preference
function of model hypotheses with respect to a data point.
We analyze the preference of a model hypothesis instead
of a data point to alleviates sensitivity to the data distribu-
tion. 2) The T-distance in the proposed method is calculated
without using iterative processes. In contrast, the T-distance
in [10] is iteratively calculated until an agglomerative clus-
tering algorithm segments all data points. Therefore, the
T-distance is used much more efficiently in this study than
that in [10].
3.2. The Mode Seeking Algorithm
Given the vertices of a hypergraph G, we aim to seek
modes by searching for authority peaks which correspond
to model instances in data. Inspired by [14], where each
cluster center is characterized by two attributes (i.e., a high-
er local density than their neighbors and a relatively large
distance from any point that has higher densities to itself),
we search for authority peaks, which are the vertices that
are not only surrounded by their neighbors with lower lo-
cal weighting scores, but also significantly dissimilar to any
other vertices that have higher local weighting scores.
More specifically, based on the similarity measure and
weighting scores, we compute the Minimum T-Distance
(MTD) ηvmin of a vertex v in G as follows:
ηvmin = minvi∈Ω(v)
T (Cv, Cvi), (6)
where Ω(v) = vi|vi ∈ V , w(vi) > w(v). That is, Ω(v)contains all vertices with higher weighing scores than w(v)in G. For the vertex vmax with the highest weighting score,
we set ηvmaxmin = maxT (Cvmax, Cvi)vi∈V .
Note that a vertex with the local maximum value of
weighting score, has a larger MTD value than the other ver-
tices in G. Therefore, we propose to seek modes by search-
ing for the authority peaks, i.e., the vertices with significant-
ly large MTD values.
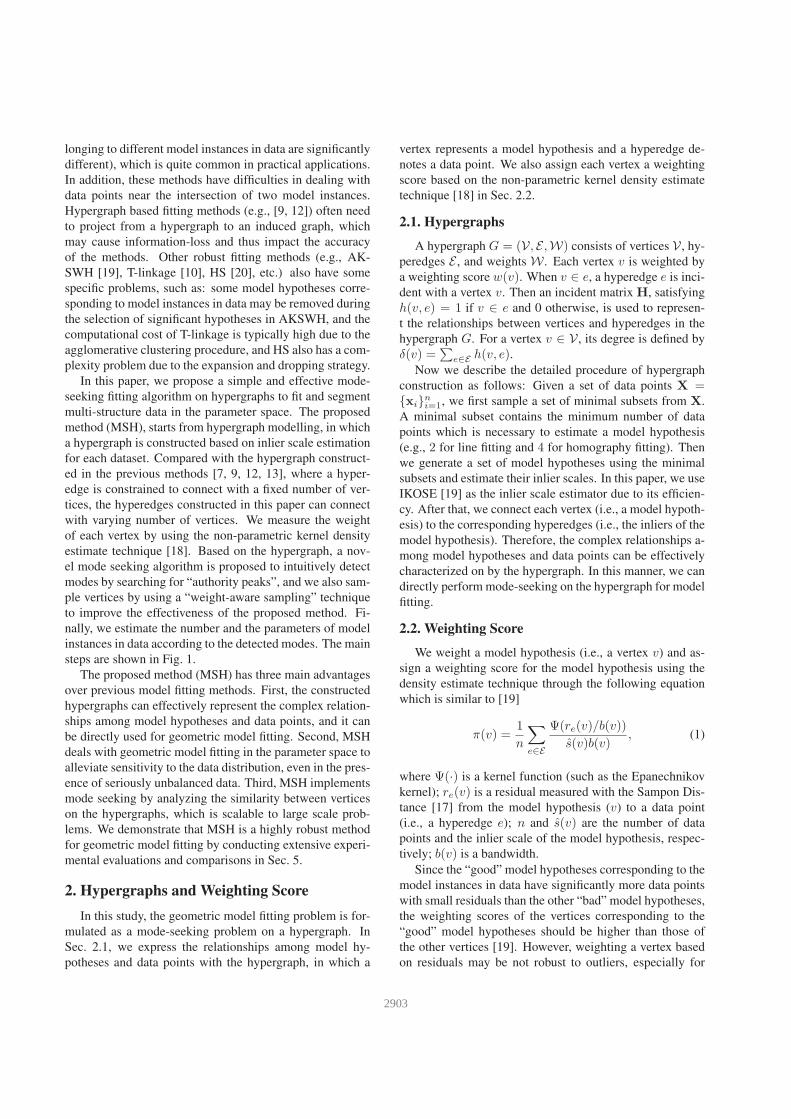
We further illustrate the proposed mode seeking algo-
rithm by using a simple example on the “Star5” dataset.
Fig. 2(a) shows the top 10 largest MTD values belonging to
the corresponding vertices (sorted in the descending order).
43232904
1 2 3 4 5 6 7 8 9 100
0.2
0.4
0.6
0.8
1
Th
e m
inim
um
T−
dis
tan
ce
Vertices
(a)
−1 −0.5 0 0.5 1−1
−0.5
0
0.5
1
(b)Figure 2. Line fitting on the “Star5” dataset. (a) The top 10 largest
MTD values of the corresponding vertices. (b) The five lines cor-
responding to the vertices with the top 5 largest MTD values.
We can see that the top 5 largest MTD values are signifi-
cantly larger than those of the other vertices, and the lines
corresponding to the vertices with the top 5 largest MTD
values are shown in Fig. 2(b).
The proposed mode seeking algorithm works well for
line fitting. This is because the distribution of model hy-
potheses generated for line fitting is dense in the parame-
ter space. However, the distribution of model hypotheses
generated for higher order model fitting applications, such
as homography based segmentation or two-view based mo-
tion segmentation, is often sparse, in which a few bad mod-
el hypotheses (with low weighting score values) may show
anomalously large MTD values as good model hypotheses
(with high weighting score values). This problem will cause
the proposed algorithm to seek modes ineffectively.
3.3. The Weight-Aware Sampling Technique
To solve the above problem, we further propose a simple
technique called the weight-aware sampling (WAS) tech-
nique, which samples vertices according to the weighting
scores on a hypergraph G. In WAS, the probability of sam-
pling a vertex v is computed as w(v)/∑
v∈Vw(v). As
mentioned before, vertices corresponding to good model
hypotheses often have significantly higher weighting score
values than the other vertices. Thus WAS tends to sample
good model hypotheses while rejecting bad model hypothe-
ses. Therefore, for a few bad model hypotheses that may
also show anomalously large MTD values, the probability
of the vertices corresponding to these bad model hypothe-
ses are sampled is quite low due to their low weighting score
values.
To improve the effectiveness of the proposed mode seek-
ing algorithm (as analyzed above), we use WAS to sample
vertices of G to approximate G, obtaining a new hypergraph
G∗. Then we directly perform mode seeking by searching
for authority peaks on G∗ instead of G. In this manner,
we can find that a vertex, which is regarded as an authori-
ty peak, not only has a high weighting score but also has a
large MTD value.
To show the influence of WAS on the performance of
the proposed mode seeking algorithm, we evaluate the al-
1 2 3 4 5 6 7 8 9 100
0.2
0.4
0.6
0.8
1
Th
e m
inim
um
T−
dis
tan
ce
Vertices
(a)
(c)
1 2 3 4 5 6 7 8 9 100
0.2
0.4
0.6
0.8
1
Th
e m
inim
um
T−
dis
tan
ce
Vertices
(b)
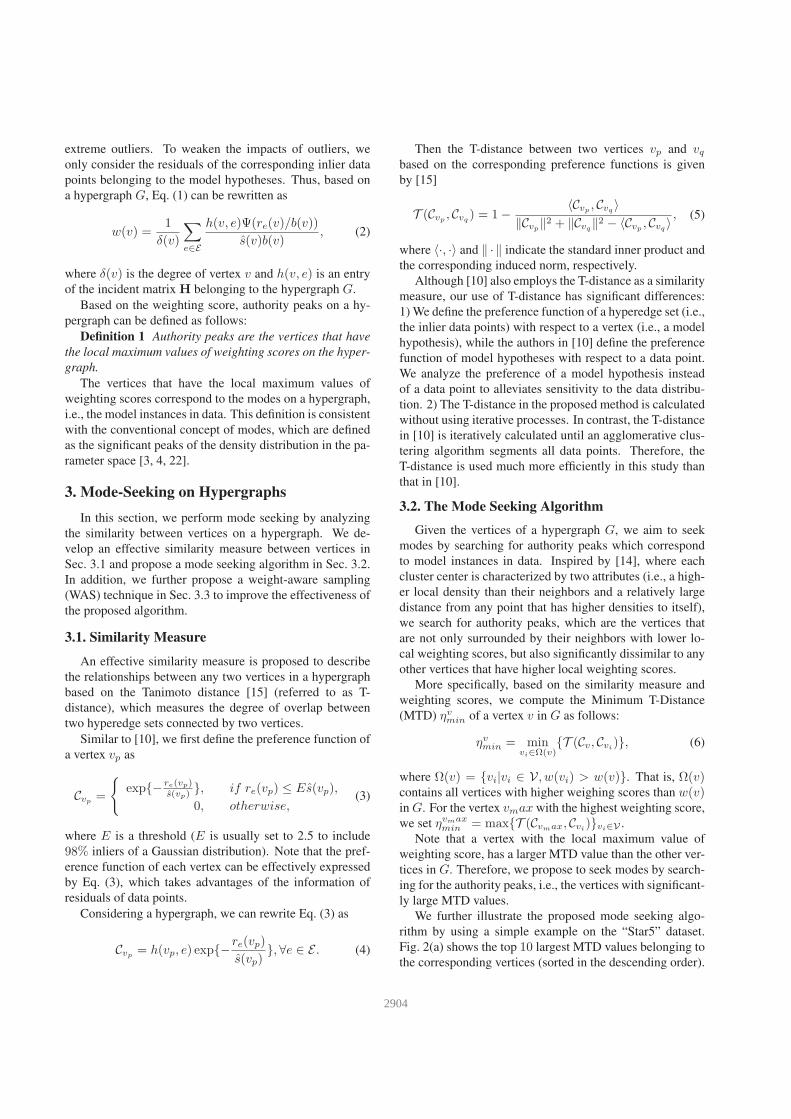
(d)Figure 3. Homography based segmentation on the “Neem” [21].
(a) and (b) The top 10 largest MTD values of the corresponding
vertices obtained by the proposed mode seeking algorithm based
on G and G∗, respectively. (c) and (d) The segmentation results
obtained by the proposed MSH method based on G and G∗, re-
spectively.
gorithm for fitting multiple homographies based on the two
hypergraphs, i.e., G and G∗, as shown in Fig. 3. We show
the top 10 largest MTD values (sorted in descending order)
in Fig. 3(a) and Fig. 3(b) which correspond to G and G∗,
respectively. We can see that the proposed mode seeking
algorithm based on G has difficulty to distinguish the three
significant model hypotheses from the MTD values. In con-
trast, the proposed mode seeking algorithm based on G∗
can effectively find the three significant model hypotheses
by seeking the largest drop in the MTD values. As shown in
Fig. 3(c) and 3(d), the segmentation results further show the
influence of WAS on the proposed MHS method–leading to
more accurate results.
4. The Complete Method
Based on the ingredients described in the previous sec-
tions, we present the complete fitting method in this section.
We summarize the proposed Mode Seeking on Hypergraphs
(MSH) method for geometric model fitting in Algorithm 1.
The proposed MSH seeks modes by directly search-
ing hypergraphs for authority peaks in the parameter s-
pace without requiring iterative processes. The compu-
tational complexity of MSH is mainly governed by Step
3 for computing the T-distance between pairs of vertices.
Therefore, the total complexity approximately amounts to
O(M2), where M is the number of sampling vertices in G∗
and M is empirically about 10% ∼ 20% of vertices in G.
5. Experiments
In this section, we compare the proposed MSH with
several state-of-the-art model fitting methods, including K-
43242905
0
50
100 0
50
1000
20
40
60
80
100
050
100 050
1000
20
40
60
80
100
050
100 050
1000
20
40
60
80
100
0
50
100 0
50
100
0
50
100
(a) Datasets
0
50
100 0
50
1000
20
40
60
80
100
050
100 050
1000
20
40
60
80
100
050
100 050
1000
20
40
60
80
100
0
50
100 0
50
100
0
50
100
(b) KF
0
50
100 0
50
1000
20
40
60
80
100
050
100 050
1000
20
40
60
80
100
050
100 050
1000
20
40
60
80
100
0
50
100 0
50
100
0
50
100
(c) RCG
0
50
100 0
50
1000
20
40
60
80
100
050
100 050
1000
20
40
60
80
100
050
100 050
1000
20
40
60
80
100
0
50
100 0
50
100
0
50
100
(d) AKSWH
0
50
100 0
50
1000
20
40
60
80
100
050
100 050
1000
20
40
60
80
100
050
100 050
1000
20
40
60
80
100
0
50
100 0
50
100
0
50
100
(e) T-linkage
0
50
100 0
50
1000
20
40
60
80
100
050
100 050
1000
20
40
60
80
100
050
100 050
1000
20
40
60
80
100
0
50
100 0
50
100
0
50
100
(f) MSH
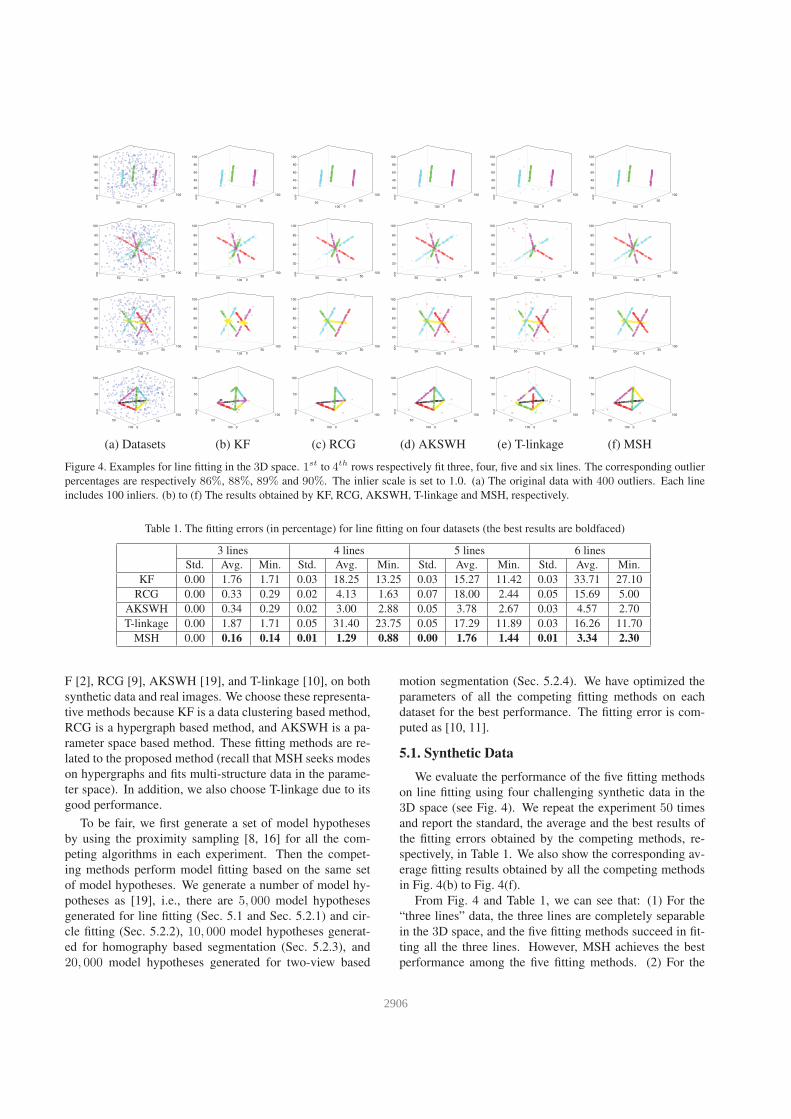
Figure 4. Examples for line fitting in the 3D space. 1st to 4th rows respectively fit three, four, five and six lines. The corresponding outlier
percentages are respectively 86%, 88%, 89% and 90%. The inlier scale is set to 1.0. (a) The original data with 400 outliers. Each line
includes 100 inliers. (b) to (f) The results obtained by KF, RCG, AKSWH, T-linkage and MSH, respectively.
Table 1. The fitting errors (in percentage) for line fitting on four datasets (the best results are boldfaced)
3 lines 4 lines 5 lines 6 lines
Std. Avg. Min. Std. Avg. Min. Std. Avg. Min. Std. Avg. Min.
KF 0.00 1.76 1.71 0.03 18.25 13.25 0.03 15.27 11.42 0.03 33.71 27.10
RCG 0.00 0.33 0.29 0.02 4.13 1.63 0.07 18.00 2.44 0.05 15.69 5.00
AKSWH 0.00 0.34 0.29 0.02 3.00 2.88 0.05 3.78 2.67 0.03 4.57 2.70
T-linkage 0.00 1.87 1.71 0.05 31.40 23.75 0.05 17.29 11.89 0.03 16.26 11.70
MSH 0.00 0.16 0.14 0.01 1.29 0.88 0.00 1.76 1.44 0.01 3.34 2.30
F [2], RCG [9], AKSWH [19], and T-linkage [10], on both
synthetic data and real images. We choose these representa-
tive methods because KF is a data clustering based method,
RCG is a hypergraph based method, and AKSWH is a pa-
rameter space based method. These fitting methods are re-
lated to the proposed method (recall that MSH seeks modes
on hypergraphs and fits multi-structure data in the parame-
ter space). In addition, we also choose T-linkage due to its
good performance.
To be fair, we first generate a set of model hypotheses
by using the proximity sampling [8, 16] for all the com-
peting algorithms in each experiment. Then the compet-
ing methods perform model fitting based on the same set
of model hypotheses. We generate a number of model hy-
potheses as [19], i.e., there are 5, 000 model hypotheses
generated for line fitting (Sec. 5.1 and Sec. 5.2.1) and cir-
cle fitting (Sec. 5.2.2), 10, 000 model hypotheses generat-
ed for homography based segmentation (Sec. 5.2.3), and
20, 000 model hypotheses generated for two-view based
motion segmentation (Sec. 5.2.4). We have optimized the
parameters of all the competing fitting methods on each
dataset for the best performance. The fitting error is com-
puted as [10, 11].
5.1. Synthetic Data
We evaluate the performance of the five fitting methods
on line fitting using four challenging synthetic data in the
3D space (see Fig. 4). We repeat the experiment 50 times
and report the standard, the average and the best results of
the fitting errors obtained by the competing methods, re-
spectively, in Table 1. We also show the corresponding av-
erage fitting results obtained by all the competing methods
in Fig. 4(b) to Fig. 4(f).
From Fig. 4 and Table 1, we can see that: (1) For the
“three lines” data, the three lines are completely separable
in the 3D space, and the five fitting methods succeed in fit-
ting all the three lines. However, MSH achieves the best
performance among the five fitting methods. (2) For the
43252906
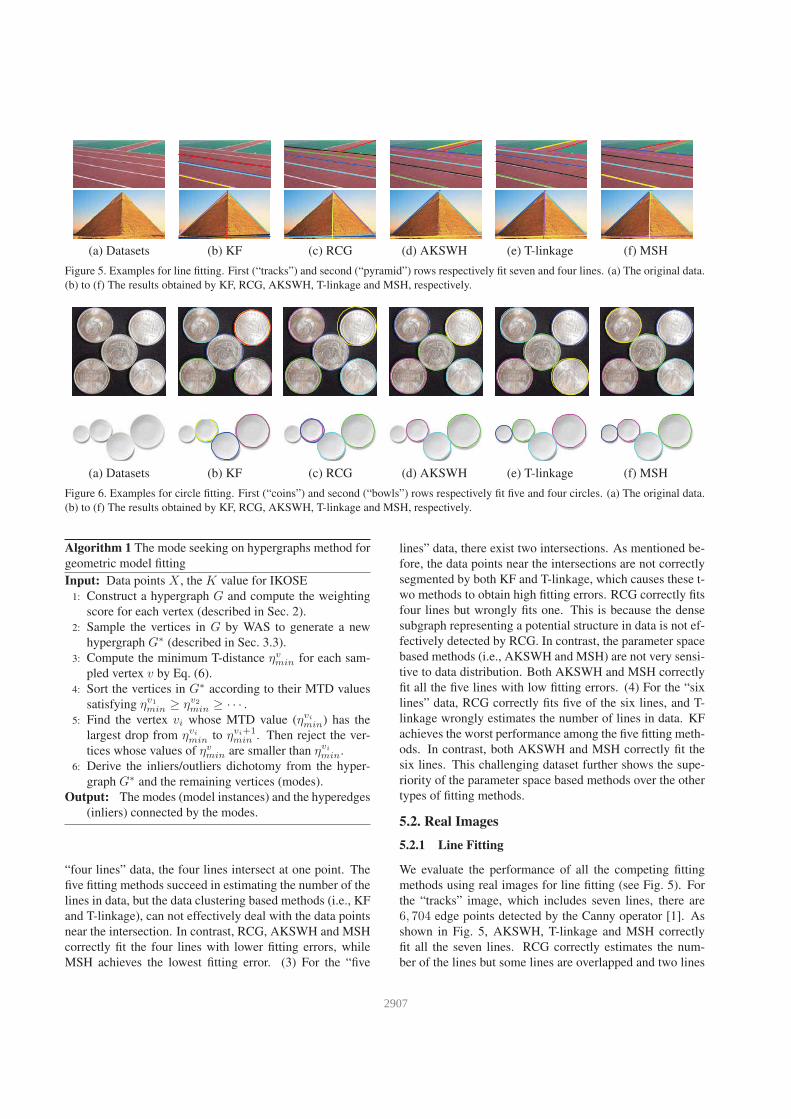
(a) Datasets (b) KF (c) RCG (d) AKSWH (e) T-linkage (f) MSH
Figure 5. Examples for line fitting. First (“tracks”) and second (“pyramid”) rows respectively fit seven and four lines. (a) The original data.
(b) to (f) The results obtained by KF, RCG, AKSWH, T-linkage and MSH, respectively.
(a) Datasets (b) KF (c) RCG (d) AKSWH (e) T-linkage (f) MSH
Figure 6. Examples for circle fitting. First (“coins”) and second (“bowls”) rows respectively fit five and four circles. (a) The original data.
(b) to (f) The results obtained by KF, RCG, AKSWH, T-linkage and MSH, respectively.
Algorithm 1 The mode seeking on hypergraphs method for
geometric model fitting
Input: Data points X , the K value for IKOSE
1: Construct a hypergraph G and compute the weighting
score for each vertex (described in Sec. 2).
2: Sample the vertices in G by WAS to generate a new
hypergraph G∗ (described in Sec. 3.3).
3: Compute the minimum T-distance ηvmin for each sam-
pled vertex v by Eq. (6).
4: Sort the vertices in G∗ according to their MTD values
satisfying ηv1min ≥ ηv2min ≥ · · · .
5: Find the vertex vi whose MTD value (ηvi
min) has the
largest drop from ηvimin to ηvi+1min . Then reject the ver-
tices whose values of ηvmin are smaller than ηvi
min.
6: Derive the inliers/outliers dichotomy from the hyper-
graph G∗ and the remaining vertices (modes).
Output: The modes (model instances) and the hyperedges
(inliers) connected by the modes.
“four lines” data, the four lines intersect at one point. The
five fitting methods succeed in estimating the number of the
lines in data, but the data clustering based methods (i.e., KF
and T-linkage), can not effectively deal with the data points
near the intersection. In contrast, RCG, AKSWH and MSH
correctly fit the four lines with lower fitting errors, while
MSH achieves the lowest fitting error. (3) For the “five
lines” data, there exist two intersections. As mentioned be-
fore, the data points near the intersections are not correctly
segmented by both KF and T-linkage, which causes these t-
wo methods to obtain high fitting errors. RCG correctly fits
four lines but wrongly fits one. This is because the dense
subgraph representing a potential structure in data is not ef-
fectively detected by RCG. In contrast, the parameter space
based methods (i.e., AKSWH and MSH) are not very sensi-
tive to data distribution. Both AKSWH and MSH correctly
fit all the five lines with low fitting errors. (4) For the “six
lines” data, RCG correctly fits five of the six lines, and T-
linkage wrongly estimates the number of lines in data. KF
achieves the worst performance among the five fitting meth-
ods. In contrast, both AKSWH and MSH correctly fit the
six lines. This challenging dataset further shows the supe-
riority of the parameter space based methods over the other
types of fitting methods.
5.2. Real Images
5.2.1 Line Fitting
We evaluate the performance of all the competing fitting
methods using real images for line fitting (see Fig. 5). For
the “tracks” image, which includes seven lines, there are
6, 704 edge points detected by the Canny operator [1]. As
shown in Fig. 5, AKSWH, T-linkage and MSH correctly
fit all the seven lines. RCG correctly estimates the num-
ber of the lines but some lines are overlapped and two lines
43262907
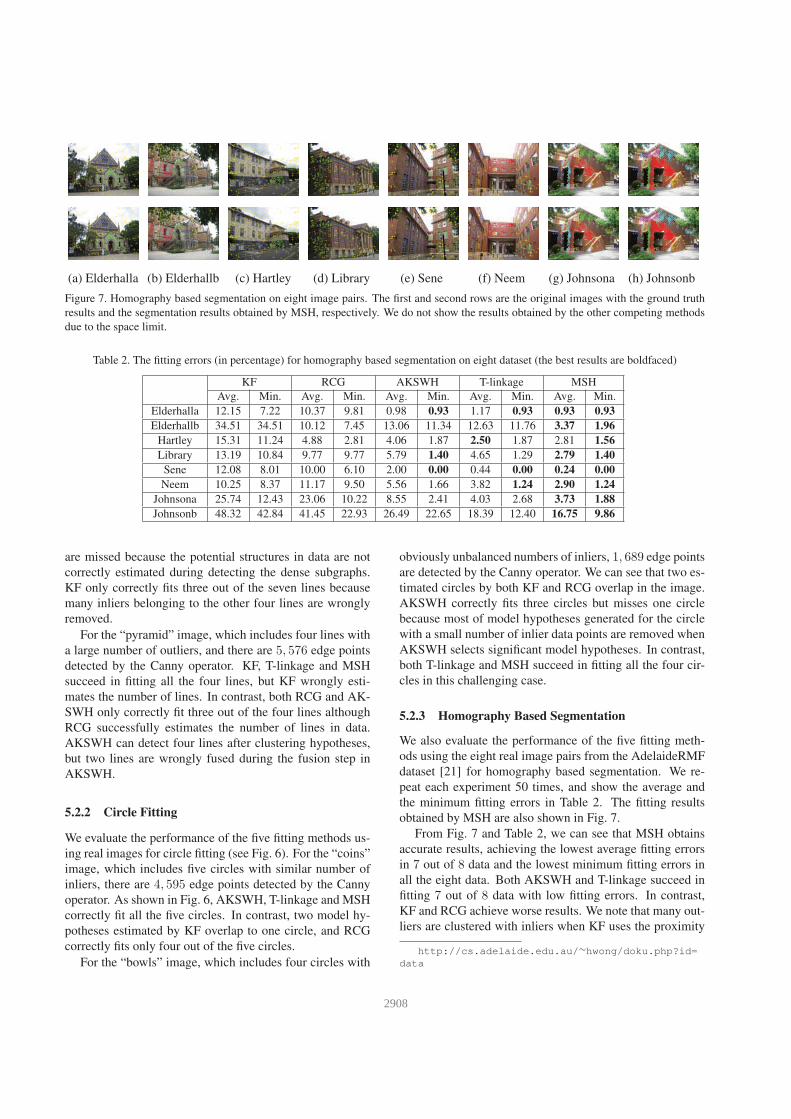
(a) Elderhalla (b) Elderhallb (c) Hartley (d) Library (e) Sene (f) Neem (g) Johnsona (h) Johnsonb
Figure 7. Homography based segmentation on eight image pairs. The first and second rows are the original images with the ground truth
results and the segmentation results obtained by MSH, respectively. We do not show the results obtained by the other competing methods
due to the space limit.
Table 2. The fitting errors (in percentage) for homography based segmentation on eight dataset (the best results are boldfaced)
KF RCG AKSWH T-linkage MSH
Avg. Min. Avg. Min. Avg. Min. Avg. Min. Avg. Min.
Elderhalla 12.15 7.22 10.37 9.81 0.98 0.93 1.17 0.93 0.93 0.93
Elderhallb 34.51 34.51 10.12 7.45 13.06 11.34 12.63 11.76 3.37 1.96
Hartley 15.31 11.24 4.88 2.81 4.06 1.87 2.50 1.87 2.81 1.56
Library 13.19 10.84 9.77 9.77 5.79 1.40 4.65 1.29 2.79 1.40
Sene 12.08 8.01 10.00 6.10 2.00 0.00 0.44 0.00 0.24 0.00
Neem 10.25 8.37 11.17 9.50 5.56 1.66 3.82 1.24 2.90 1.24
Johnsona 25.74 12.43 23.06 10.22 8.55 2.41 4.03 2.68 3.73 1.88
Johnsonb 48.32 42.84 41.45 22.93 26.49 22.65 18.39 12.40 16.75 9.86
are missed because the potential structures in data are not
correctly estimated during detecting the dense subgraphs.
KF only correctly fits three out of the seven lines because
many inliers belonging to the other four lines are wrongly
removed.
For the “pyramid” image, which includes four lines with
a large number of outliers, and there are 5, 576 edge points
detected by the Canny operator. KF, T-linkage and MSH
succeed in fitting all the four lines, but KF wrongly esti-
mates the number of lines. In contrast, both RCG and AK-
SWH only correctly fit three out of the four lines although
RCG successfully estimates the number of lines in data.
AKSWH can detect four lines after clustering hypotheses,
but two lines are wrongly fused during the fusion step in
AKSWH.
5.2.2 Circle Fitting
We evaluate the performance of the five fitting methods us-
ing real images for circle fitting (see Fig. 6). For the “coins”
image, which includes five circles with similar number of
inliers, there are 4, 595 edge points detected by the Canny
operator. As shown in Fig. 6, AKSWH, T-linkage and MSH
correctly fit all the five circles. In contrast, two model hy-
potheses estimated by KF overlap to one circle, and RCG
correctly fits only four out of the five circles.
For the “bowls” image, which includes four circles with
obviously unbalanced numbers of inliers, 1, 689 edge points
are detected by the Canny operator. We can see that two es-
timated circles by both KF and RCG overlap in the image.
AKSWH correctly fits three circles but misses one circle
because most of model hypotheses generated for the circle
with a small number of inlier data points are removed when
AKSWH selects significant model hypotheses. In contrast,
both T-linkage and MSH succeed in fitting all the four cir-
cles in this challenging case.
5.2.3 Homography Based Segmentation
We also evaluate the performance of the five fitting meth-
ods using the eight real image pairs from the AdelaideRMF
dataset [21] for homography based segmentation. We re-
peat each experiment 50 times, and show the average and
the minimum fitting errors in Table 2. The fitting results
obtained by MSH are also shown in Fig. 7.
From Fig. 7 and Table 2, we can see that MSH obtains
accurate results, achieving the lowest average fitting errors
in 7 out of 8 data and the lowest minimum fitting errors in
all the eight data. Both AKSWH and T-linkage succeed in
fitting 7 out of 8 data with low fitting errors. In contrast,
KF and RCG achieve worse results. We note that many out-
liers are clustered with inliers when KF uses the proximity
http://cs.adelaide.edu.au/∼hwong/doku.php?id=
data
43272908
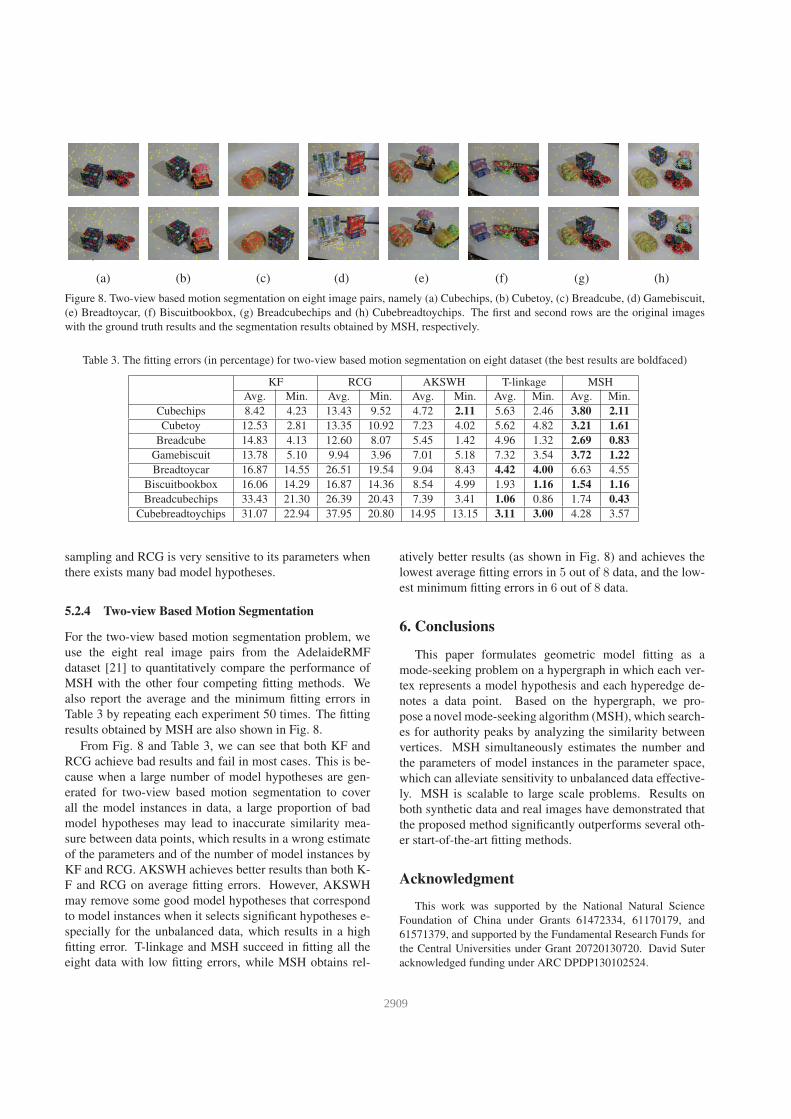
(a) (b) (c) (d) (e) (f) (g) (h)
Figure 8. Two-view based motion segmentation on eight image pairs, namely (a) Cubechips, (b) Cubetoy, (c) Breadcube, (d) Gamebiscuit,
(e) Breadtoycar, (f) Biscuitbookbox, (g) Breadcubechips and (h) Cubebreadtoychips. The first and second rows are the original images
with the ground truth results and the segmentation results obtained by MSH, respectively.
Table 3. The fitting errors (in percentage) for two-view based motion segmentation on eight dataset (the best results are boldfaced)
KF RCG AKSWH T-linkage MSH
Avg. Min. Avg. Min. Avg. Min. Avg. Min. Avg. Min.
Cubechips 8.42 4.23 13.43 9.52 4.72 2.11 5.63 2.46 3.80 2.11
Cubetoy 12.53 2.81 13.35 10.92 7.23 4.02 5.62 4.82 3.21 1.61
Breadcube 14.83 4.13 12.60 8.07 5.45 1.42 4.96 1.32 2.69 0.83
Gamebiscuit 13.78 5.10 9.94 3.96 7.01 5.18 7.32 3.54 3.72 1.22
Breadtoycar 16.87 14.55 26.51 19.54 9.04 8.43 4.42 4.00 6.63 4.55
Biscuitbookbox 16.06 14.29 16.87 14.36 8.54 4.99 1.93 1.16 1.54 1.16
Breadcubechips 33.43 21.30 26.39 20.43 7.39 3.41 1.06 0.86 1.74 0.43
Cubebreadtoychips 31.07 22.94 37.95 20.80 14.95 13.15 3.11 3.00 4.28 3.57
sampling and RCG is very sensitive to its parameters when
there exists many bad model hypotheses.
5.2.4 Two-view Based Motion Segmentation
For the two-view based motion segmentation problem, we
use the eight real image pairs from the AdelaideRMF
dataset [21] to quantitatively compare the performance of
MSH with the other four competing fitting methods. We
also report the average and the minimum fitting errors in
Table 3 by repeating each experiment 50 times. The fitting
results obtained by MSH are also shown in Fig. 8.
From Fig. 8 and Table 3, we can see that both KF and
RCG achieve bad results and fail in most cases. This is be-
cause when a large number of model hypotheses are gen-
erated for two-view based motion segmentation to cover
all the model instances in data, a large proportion of bad
model hypotheses may lead to inaccurate similarity mea-
sure between data points, which results in a wrong estimate
of the parameters and of the number of model instances by
KF and RCG. AKSWH achieves better results than both K-
F and RCG on average fitting errors. However, AKSWH
may remove some good model hypotheses that correspond
to model instances when it selects significant hypotheses e-
specially for the unbalanced data, which results in a high
fitting error. T-linkage and MSH succeed in fitting all the
eight data with low fitting errors, while MSH obtains rel-
atively better results (as shown in Fig. 8) and achieves the
lowest average fitting errors in 5 out of 8 data, and the low-
est minimum fitting errors in 6 out of 8 data.
6. Conclusions
This paper formulates geometric model fitting as a
mode-seeking problem on a hypergraph in which each ver-
tex represents a model hypothesis and each hyperedge de-
notes a data point. Based on the hypergraph, we pro-
pose a novel mode-seeking algorithm (MSH), which search-
es for authority peaks by analyzing the similarity between
vertices. MSH simultaneously estimates the number and
the parameters of model instances in the parameter space,
which can alleviate sensitivity to unbalanced data effective-
ly. MSH is scalable to large scale problems. Results on
both synthetic data and real images have demonstrated that
the proposed method significantly outperforms several oth-
er start-of-the-art fitting methods.
Acknowledgment
This work was supported by the National Natural Science
Foundation of China under Grants 61472334, 61170179, and
61571379, and supported by the Fundamental Research Funds for
the Central Universities under Grant 20720130720. David Suter
acknowledged funding under ARC DPDP130102524.
43282909
References
[1] J. Canny. A computational approach to edge detection. IEEE
Trans. PAMI, (6):679–698, 1986.
[2] T.-J. Chin, H. Wang, and D. Suter. Robust fitting of multiple
structures: The statistical learning approach. In ICCV, pages
413–420, 2009.
[3] M. Cho and K. M. Lee. Mode-seeking on graphs via random
walks. In CVPR, pages 606–613, 2012.
[4] D. Comaniciu and P. Meer. Mean shift: A robust ap-
proach toward feature space analysis. IEEE Trans. PAMI,
24(5):603–619, 2002.
[5] M. A. Fischler and R. C. Bolles. Random sample consensus:
a paradigm for model fitting with applications to image anal-
ysis and automated cartography. Comm. ACM, 24(6):381–
395, 1981.
[6] H. Isack and Y. Boykov. Energy-based geometric multi-
model fitting. IJCV, 97(2):123–147, 2012.
[7] S. Jain and V. M. Govindu. Efficient higher-order cluster-
ing on the grassmann manifold. In ICCV, pages 3511–3518,
2013.
[8] Y. Kanazawa and H. Kawakami. Detection of planar regions
with uncalibrated stereo using distributions of feature points.
In BMVC, pages 1–10, 2004.
[9] H. Liu and S. Yan. Efficient structure detection via random
consensus graph. In CVPR, pages 574–581, 2012.
[10] L. Magri and A. Fusiello. T-linkage: A continuous relaxation
of j-linkage for multi-model fitting. In CVPR, pages 3954–
3961, 2014.
[11] S. Mittal, S. Anand, and P. Meer. Generalized projection-
based m-estimator. IEEE Trans. PAMI, 34(12):2351–2364,
2012.
[12] P. Ochs and T. Brox. Higher order motion models and spec-
tral clustering. In CVPR, pages 614–621, 2012.
[13] P. Purkait, T.-J. Chin, H. Ackermann, and D. Suter. Clus-
tering with hypergraphs: the case for large hyperedges. In
ECCV, pages 672–687, 2014.
[14] A. Rodriguez and A. Laio. Clustering by fast search and find
of density peaks. Science, 344(6191):1492–1496, 2014.
[15] T. Tanimoto. Internal report: Ibm technical report series.
Armonk, NY: IBM, 1957.
[16] R. Toldo and A. Fusiello. Robust multiple structures estima-
tion with j-linkage. In ECCV, pages 537–547. 2008.
[17] P. H. Torr and D. W. Murray. The development and compari-
son of robust methods for estimating the fundamental matrix.
IJCV, 24(3):271–300, 1997.
[18] M. Wand and M. Jones. Kernel smoothing. Chapman and
Hall, 1994.
[19] H. Wang, T.-J. Chin, and D. Suter. Simultaneously fitting
and segmenting multiple-structure data with outliers. IEEE
Trans. PAMI, 34(6):1177–1192, 2012.
[20] Y. Wang, X. Lin, Q. Zhang, and L. Wu. Shifting hypergraphs
by probabilistic voting. In PAKDD, pages 234–246. 2014.
[21] H. S. Wong, T.-J. Chin, J. Yu, and D. Suter. Dynamic and hi-
erarchical multi-structure geometric model fitting. In ICCV,
pages 1044–1051, 2011.
[22] L. Xu, E. Oja, and P. Kultanen. A new curve detec-
tion method: randomized hough transform (rht). PRL,
11(5):331–338, 1990.
43292910


![Extremal problems for convex geometric hypergraphs and ...homepages.math.uic.edu/~mubayi/papers/CGHcrossArXiv.pdfby problems in discrete geometry [4, 18, 2, 1]. Instances of the extremal](https://img.pdfslide.us/doc/110x75/5f4359369c0a3f651232fb9d/extremal-problems-for-convex-geometric-hypergraphs-and-mubayipaperscghcrossarxivpdf.jpg)