Embed Size (px)
Citation preview
Mobility Investment Priorities ProjectEarly Recommendations Report
February 2012
Saving Lives, Time and ResourcesA Member of The Texas A&M University System
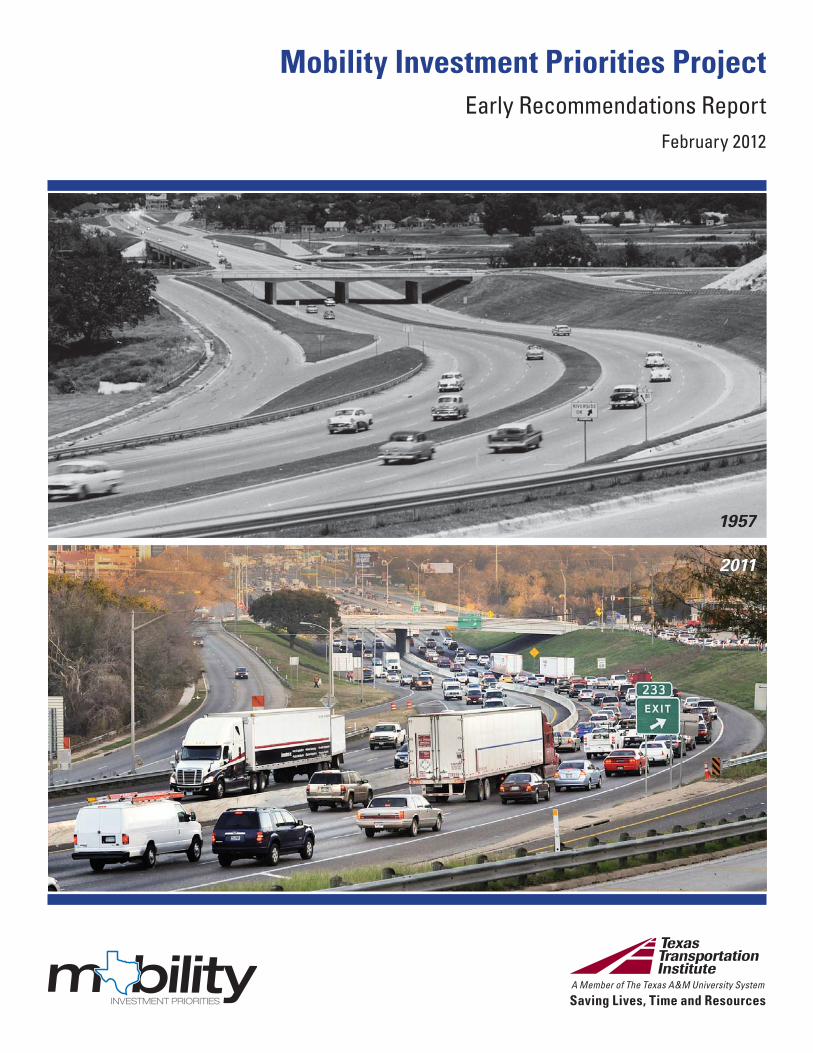
1957
2011
Texas Transportation Institute Report Authors Primary Authors – Tim Lomax, Bill Stockton, David Ellis, and Phil Lasley
Regional Coordinators and Authors – (Austin) Ginger Goodin and Meredith Highsmith; (Dallas-Fort Worth) Jason Crawford, Mary Meyland and Chris Poe; (Houston) Tony Voigt, Robert Benz, and Roma Stevens; (San Antonio) Steve Venglar, and Cesar Quiroga
Congestion Reduction Strategy Authors– Kevin Balke, Curtis Beaty, Tiffiny Britton, Darrell Borchardt, Marcus Brewer, Todd Carlson, Nadeem Chaudhary, Linda Cherrington, Scott Cooner, Jason Crawford, Liang Ding, Casey Dusza, Bill Eisele, David Ellis, Bernie Fette, Bill Frawley, Kay Fitzpatrick, Tina Geiselbrecht, Brianne Glover, Ginger Goodin, Meredith Highsmith, Beverly Kuhn, Greg Larson, Phil Lasley, Roberto Macias, Robert Martin, Curtis Morgan, Nick Norboge, Kwaku Obeng-Boampong, Terri Parker, Steven Ranft, Cathy Reiley, Matt Sandidge, David Schrank, Tom Scullion, Jerry Ullman, Steve Venglar, Juan Villa, Tony Voigt, Jason Wagner, Brittney Weathers, Xiaosi Zeng
Contributors – Linda Castillo, Sonia Chapa, Mark Coppock, Carol Court, Bonnie Duke, Heather Ford, Lauren Geng, John Henry, Debbie Murillo, Sherie Ruter, Sangita Sunkari, Juliet Vallejo, Kelly West, Shanna Yates, Michelle Young
TxDOT Project Director Dr. Shannon Crum
Contributions by Metropolitan Area Agencies
Austin TxDOT–Austin District Capital Area Metropolitan Planning Organization Capital Metro Central Texas Regional Mobility Authority City of Austin Greater Austin Chamber of Commerce Downtown Austin Alliance Downtown Transportation Management
Association Texas Transportation Institute Houston TxDOT–Houston District Houston-Galveston Area Council City of HoustonHarris County Houston METRO Houston TranStar Harris County Toll Road Authority Texas Transportation Institute
Dallas-Fort Worth TxDOT–Dallas and Fort Worth Districts North Central Texas Council of Governments North Texas Tollway Authority City of Dallas City of Ft Worth Dallas Area Rapid Transit Fort Worth Transportation Authority Denton County Transportation Authority City of North Richland Hills City of Richardson City of Haltom City Texas Transportation Institute San Antonio TxDOT–San Antonio District San Antonio-Bexar County Metropolitan Planning
Organization Alamo Area Council of Governments City of San Antonio Alamo Regional Mobility Authority Bexar County VIA Metropolitan Transit Texas Transportation Institute
TABLE OF CONTENTS Page
Introduction .................................................................................................................................................. 1
Purpose of the Early Recommendations Report ...................................................................................... 2
The Congestion Growth Problem.............................................................................................................. 2
Texas’ Congested Corridors ...................................................................................................................... 5
Congestion Reduction Strategy Summary .................................................................................................... 9
Additional Capacity ................................................................................................................................... 9
Traffic Management ............................................................................................................................... 10
Travel Options ......................................................................................................................................... 11
Funding Strategies .................................................................................................................................. 11
Public Engagement ................................................................................................................................. 12
Recommendation Summary ....................................................................................................................... 13
Austin ...................................................................................................................................................... 15
Dallas – Fort Worth ................................................................................................................................. 19
Houston ................................................................................................................................................... 27
San Antonio ............................................................................................................................................. 34
Metropolitan Area Detail ............................................................................................................................ 41
AUSTIN .................................................................................................................................................. A-1
Dallas – Fort Worth .......................................................................................................................... DFW-1
Houston ................................................................................................................................................. H-1
San Antonio .......................................................................................................................................... SA-1
References .................................................................................................................................................. 43

1
INTRODUCTION
Traffic congestion has been a significant problem in Texas’ major metropolitan areas for many years, directly affecting the state’s economic growth and quality of life. About two-thirds of Texas residents live in urban areas that are ranked in the 40 most congested U.S. metro areas, and three metro areas (Houston, Dallas-Fort Worth, and Austin) are in the top 15. Perhaps more disturbing, however, is the fact that not only is congestion high, but Texas traffic problems are also increasing faster than in similar U.S. areas. The four largest metro areas (including San Antonio) rank in the 15 fastest growing congested areas in the U.S. over the last 15 years (1).
Funding for many of the traditional solutions in Texas’ large metro areas is not scheduled to increase and congestion will continue to worsen (2). However, there is a generally accepted path toward improvement involving these elements among other planning steps (3):
First and foremost, state and local transportation agencies must be perceived as doing a good job with the funding and priorities they have. They must be effective and efficient. The agencies must have a coherent plan with sufficient information to convince the public that any additional funding will generate significant benefits and be spent on the most important problems. They must be accountable and transparent. The financing plan must take maximum advantage of all the options that the public will support. The public must understand and support any set of projects, programs, and plans that are developed from the process.
As a part of the General Appropriations Act, 82nd Texas Legislature, 2011 (H.B. 1, TxDOT Rider 42), the Texas Transportation Institute (TTI) was directed to provide assistance to the metropolitan planning organizations, the TxDOT District offices and other project partners in their development of projects and programs to address mobility concerns and to report to the Texas Legislature and the Transportation Commission.
Specifically, TTI is serving as facilitator and coordinator of studies to provide assurance that:
1. Projects addressed have the greatest impact considering factors including congestion, economic benefits, user costs, safety, and pavement quality.
2. The best traffic and demand management principles are being applied to the projects. 3. The funding scenarios take advantage of all feasible options so that public funds provide the
greatest “bang for the buck.” 4. Public participation in concept development ensures the most inclusive planning process
possible. 5. Recommendations are made to the department of transportation at each major decision point
for the projects.
2
The Mobility Investment Priorities project complements existing planning and project development activities in the metro areas. The project assists the agencies in prioritizing and targeting additional mobility improvement funds; it is not intended to replace or supersede existing planning processes and products or current funding allocations for other programs. Each metro area is developing its own set of projects, programs, and plans to address the most congested sections of road; the mix of strategies will be different in each area. The intent of Rider 42 is to ensure that the metro areas are incorporating all of the best congestion reduction practices so that it is clear that funding is being spent as effectively and efficiently as possible while addressing the state’s most congested roadways. Each area’s goals and vision will result in different approaches; if the best public communication principles are used, each of them will reflect the public interests and the best congestion reduction practices.
Purpose of the Early Recommendations Report
This report describes interim conclusions from the first few months of a two-year project. There will be other reports, additional recommendations, and other project ideas over the remaining time. A detailed summary of the possible near-term actions is presented for each metropolitan area. These initial findings may be modified upon more investigation, but this early report identifies projects that are likely to meet the standards identified in the Rider (e.g., significantly reduce congestion in a cost effective manner with a project that makes maximum usage of the possible management and financial options) and allow agencies to continue with project development activities.
The Congestion Growth Problem
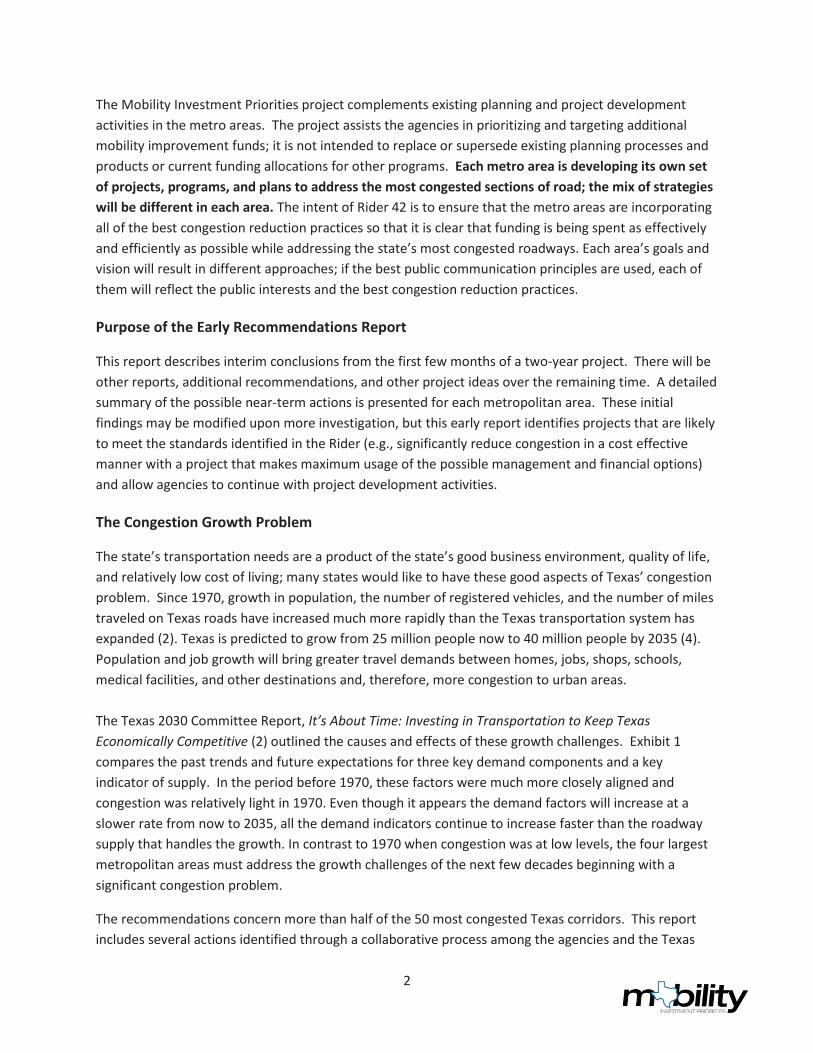
The state’s transportation needs are a product of the state’s good business environment, quality of life, and relatively low cost of living; many states would like to have these good aspects of Texas’ congestion problem. Since 1970, growth in population, the number of registered vehicles, and the number of miles traveled on Texas roads have increased much more rapidly than the Texas transportation system has expanded (2). Texas is predicted to grow from 25 million people now to 40 million people by 2035 (4). Population and job growth will bring greater travel demands between homes, jobs, shops, schools, medical facilities, and other destinations and, therefore, more congestion to urban areas. The Texas 2030 Committee Report, It’s About Time: Investing in Transportation to Keep Texas Economically Competitive (2) outlined the causes and effects of these growth challenges. Exhibit 1 compares the past trends and future expectations for three key demand components and a key indicator of supply. In the period before 1970, these factors were much more closely aligned and congestion was relatively light in 1970. Even though it appears the demand factors will increase at a slower rate from now to 2035, all the demand indicators continue to increase faster than the roadway supply that handles the growth. In contrast to 1970 when congestion was at low levels, the four largest metropolitan areas must address the growth challenges of the next few decades beginning with a significant congestion problem.
The recommendations concern more than half of the 50 most congested Texas corridors. This report includes several actions identified through a collaborative process among the agencies and the Texas
3
Transportation Institute. These actions will contribute to congestion relief by either improving transportation conditions or developing a longer-term congestion relief project by allowing the purchase of right-of-way or the performance of engineering or design studies.
Exhibit 1. Growth in Transportation Demand and Supply in Texas, Annual Percent Increase from 1970 to 2035
Source: 2030 Committee Report, It’s About Time: Investing in Transportation to Keep Texas Economically Competitive, March 2011
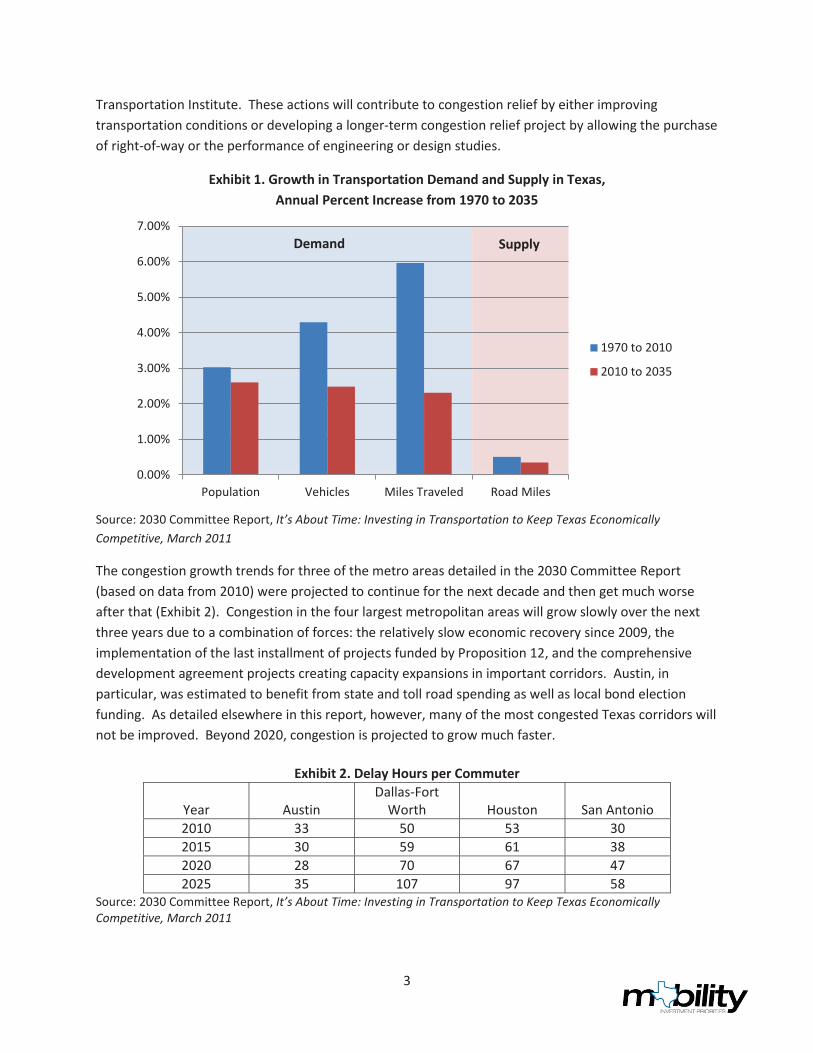
The congestion growth trends for three of the metro areas detailed in the 2030 Committee Report (based on data from 2010) were projected to continue for the next decade and then get much worse after that (Exhibit 2). Congestion in the four largest metropolitan areas will grow slowly over the next three years due to a combination of forces: the relatively slow economic recovery since 2009, the implementation of the last installment of projects funded by Proposition 12, and the comprehensive development agreement projects creating capacity expansions in important corridors. Austin, in particular, was estimated to benefit from state and toll road spending as well as local bond election funding. As detailed elsewhere in this report, however, many of the most congested Texas corridors will not be improved. Beyond 2020, congestion is projected to grow much faster.
Exhibit 2. Delay Hours per Commuter
Year Austin Dallas-Fort
Worth Houston San Antonio 2010 33 50 53 30 2015 30 59 61 38 2020 28 70 67 47 2025 35 107 97 58
Source: 2030 Committee Report, It’s About Time: Investing in Transportation to Keep Texas Economically Competitive, March 2011
0.00%
1.00%
2.00%
3.00%
4.00%
5.00%
6.00%
7.00%
Population Vehicles Miles Traveled Road Miles
1970 to 2010
2010 to 2035
Demand Supply
4
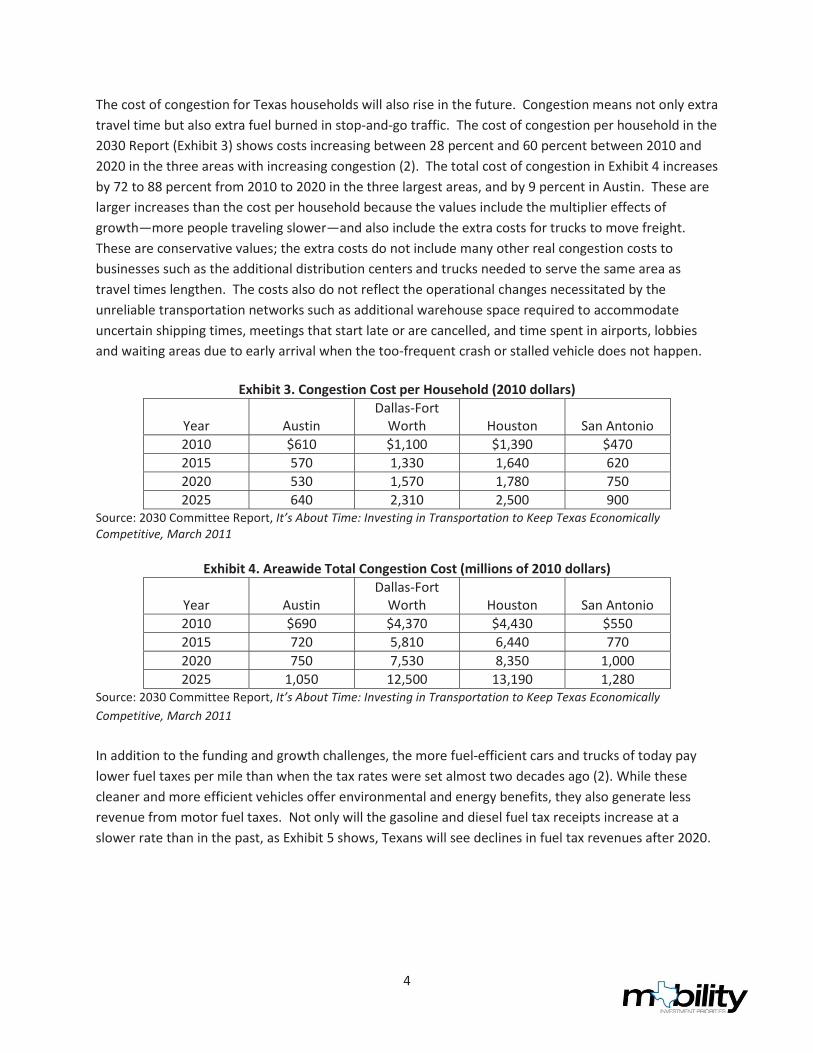
The cost of congestion for Texas households will also rise in the future. Congestion means not only extra travel time but also extra fuel burned in stop-and-go traffic. The cost of congestion per household in the 2030 Report (Exhibit 3) shows costs increasing between 28 percent and 60 percent between 2010 and 2020 in the three areas with increasing congestion (2). The total cost of congestion in Exhibit 4 increases by 72 to 88 percent from 2010 to 2020 in the three largest areas, and by 9 percent in Austin. These are larger increases than the cost per household because the values include the multiplier effects of growth—more people traveling slower—and also include the extra costs for trucks to move freight. These are conservative values; the extra costs do not include many other real congestion costs to businesses such as the additional distribution centers and trucks needed to serve the same area as travel times lengthen. The costs also do not reflect the operational changes necessitated by the unreliable transportation networks such as additional warehouse space required to accommodate uncertain shipping times, meetings that start late or are cancelled, and time spent in airports, lobbies and waiting areas due to early arrival when the too-frequent crash or stalled vehicle does not happen.
Exhibit 3. Congestion Cost per Household (2010 dollars)
Year Austin Dallas-Fort
Worth Houston San Antonio 2010 $610 $1,100 $1,390 $470 2015 570 1,330 1,640 620 2020 530 1,570 1,780 750 2025 640 2,310 2,500 900
Source: 2030 Committee Report, It’s About Time: Investing in Transportation to Keep Texas Economically Competitive, March 2011
Exhibit 4. Areawide Total Congestion Cost (millions of 2010 dollars)
Year Austin Dallas-Fort
Worth Houston San Antonio 2010 $690 $4,370 $4,430 $550 2015 720 5,810 6,440 770 2020 750 7,530 8,350 1,000 2025 1,050 12,500 13,190 1,280
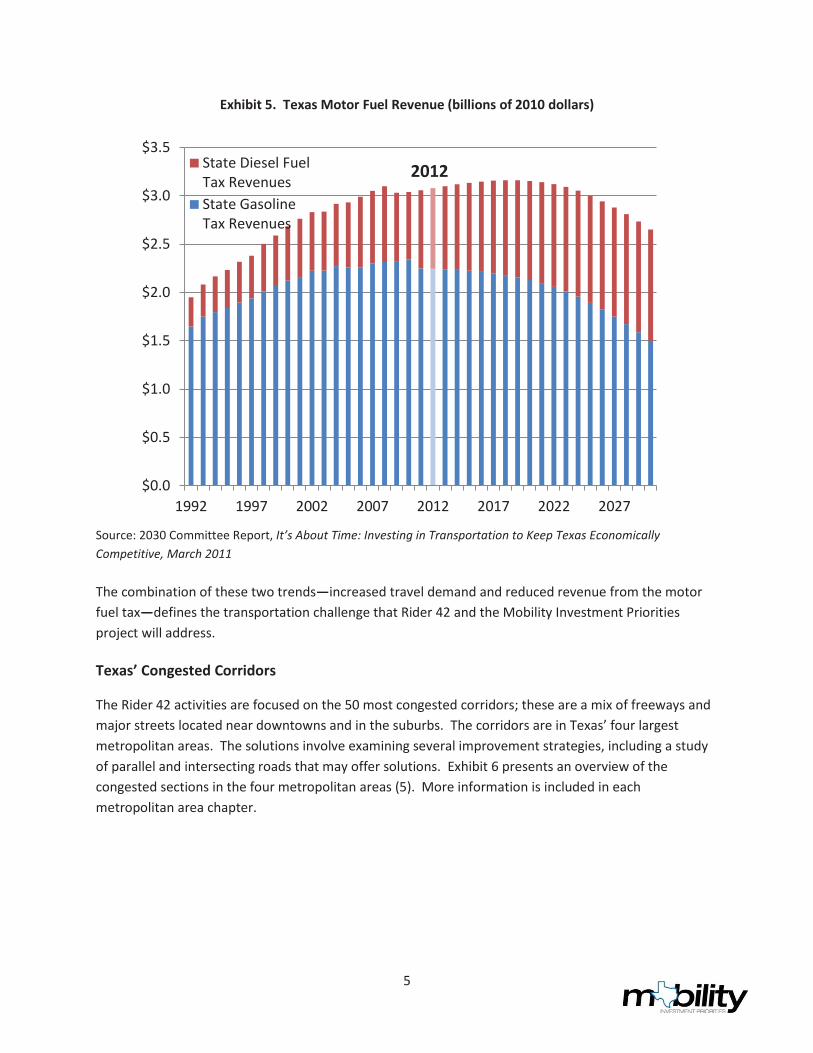
Source: 2030 Committee Report, It’s About Time: Investing in Transportation to Keep Texas Economically Competitive, March 2011 In addition to the funding and growth challenges, the more fuel-efficient cars and trucks of today pay lower fuel taxes per mile than when the tax rates were set almost two decades ago (2). While these cleaner and more efficient vehicles offer environmental and energy benefits, they also generate less revenue from motor fuel taxes. Not only will the gasoline and diesel fuel tax receipts increase at a slower rate than in the past, as Exhibit 5 shows, Texans will see declines in fuel tax revenues after 2020.
5
Exhibit 5. Texas Motor Fuel Revenue (billions of 2010 dollars)
Source: 2030 Committee Report, It’s About Time: Investing in Transportation to Keep Texas Economically Competitive, March 2011 The combination of these two trends—increased travel demand and reduced revenue from the motor fuel tax—defines the transportation challenge that Rider 42 and the Mobility Investment Priorities project will address.
Texas’ Congested Corridors
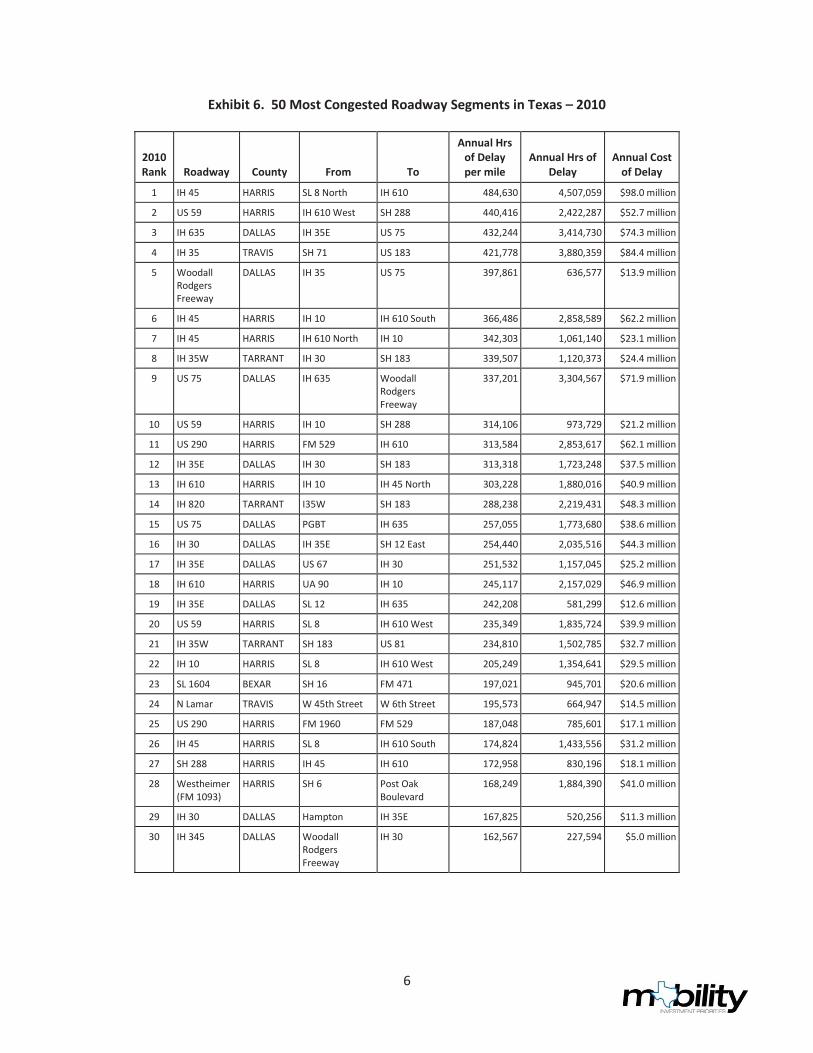
The Rider 42 activities are focused on the 50 most congested corridors; these are a mix of freeways and major streets located near downtowns and in the suburbs. The corridors are in Texas’ four largest metropolitan areas. The solutions involve examining several improvement strategies, including a study of parallel and intersecting roads that may offer solutions. Exhibit 6 presents an overview of the congested sections in the four metropolitan areas (5). More information is included in each metropolitan area chapter.
$0.0
$0.5
$1.0
$1.5
$2.0
$2.5
$3.0
$3.5
1992 1997 2002 2007 2012 2017 2022 2027
State Diesel FuelTax RevenuesState GasolineTax Revenues
2012
6
Exhibit 6. 50 Most Congested Roadway Segments in Texas – 2010
2010 Rank Roadway County From To
Annual Hrs of Delay per mile
Annual Hrs of Delay
Annual Cost of Delay
1 IH 45 HARRIS SL 8 North IH 610 484,630 4,507,059 $98.0 million
2 US 59 HARRIS IH 610 West SH 288 440,416 2,422,287 $52.7 million
3 IH 635 DALLAS IH 35E US 75 432,244 3,414,730 $74.3 million
4 IH 35 TRAVIS SH 71 US 183 421,778 3,880,359 $84.4 million
5 Woodall Rodgers Freeway
DALLAS IH 35 US 75 397,861 636,577 $13.9 million
6 IH 45 HARRIS IH 10 IH 610 South 366,486 2,858,589 $62.2 million
7 IH 45 HARRIS IH 610 North IH 10 342,303 1,061,140 $23.1 million
8 IH 35W TARRANT IH 30 SH 183 339,507 1,120,373 $24.4 million
9 US 75 DALLAS IH 635 Woodall Rodgers Freeway
337,201 3,304,567 $71.9 million
10 US 59 HARRIS IH 10 SH 288 314,106 973,729 $21.2 million
11 US 290 HARRIS FM 529 IH 610 313,584 2,853,617 $62.1 million
12 IH 35E DALLAS IH 30 SH 183 313,318 1,723,248 $37.5 million
13 IH 610 HARRIS IH 10 IH 45 North 303,228 1,880,016 $40.9 million
14 IH 820 TARRANT I35W SH 183 288,238 2,219,431 $48.3 million
15 US 75 DALLAS PGBT IH 635 257,055 1,773,680 $38.6 million
16 IH 30 DALLAS IH 35E SH 12 East 254,440 2,035,516 $44.3 million
17 IH 35E DALLAS US 67 IH 30 251,532 1,157,045 $25.2 million
18 IH 610 HARRIS UA 90 IH 10 245,117 2,157,029 $46.9 million
19 IH 35E DALLAS SL 12 IH 635 242,208 581,299 $12.6 million
20 US 59 HARRIS SL 8 IH 610 West 235,349 1,835,724 $39.9 million
21 IH 35W TARRANT SH 183 US 81 234,810 1,502,785 $32.7 million
22 IH 10 HARRIS SL 8 IH 610 West 205,249 1,354,641 $29.5 million
23 SL 1604 BEXAR SH 16 FM 471 197,021 945,701 $20.6 million
24 N Lamar TRAVIS W 45th Street W 6th Street 195,573 664,947 $14.5 million
25 US 290 HARRIS FM 1960 FM 529 187,048 785,601 $17.1 million
26 IH 45 HARRIS SL 8 IH 610 South 174,824 1,433,556 $31.2 million
27 SH 288 HARRIS IH 45 IH 610 172,958 830,196 $18.1 million
28 Westheimer (FM 1093)
HARRIS SH 6 Post Oak Boulevard
168,249 1,884,390 $41.0 million
29 IH 30 DALLAS Hampton IH 35E 167,825 520,256 $11.3 million
30 IH 345 DALLAS Woodall Rodgers Freeway
IH 30 162,567 227,594 $5.0 million
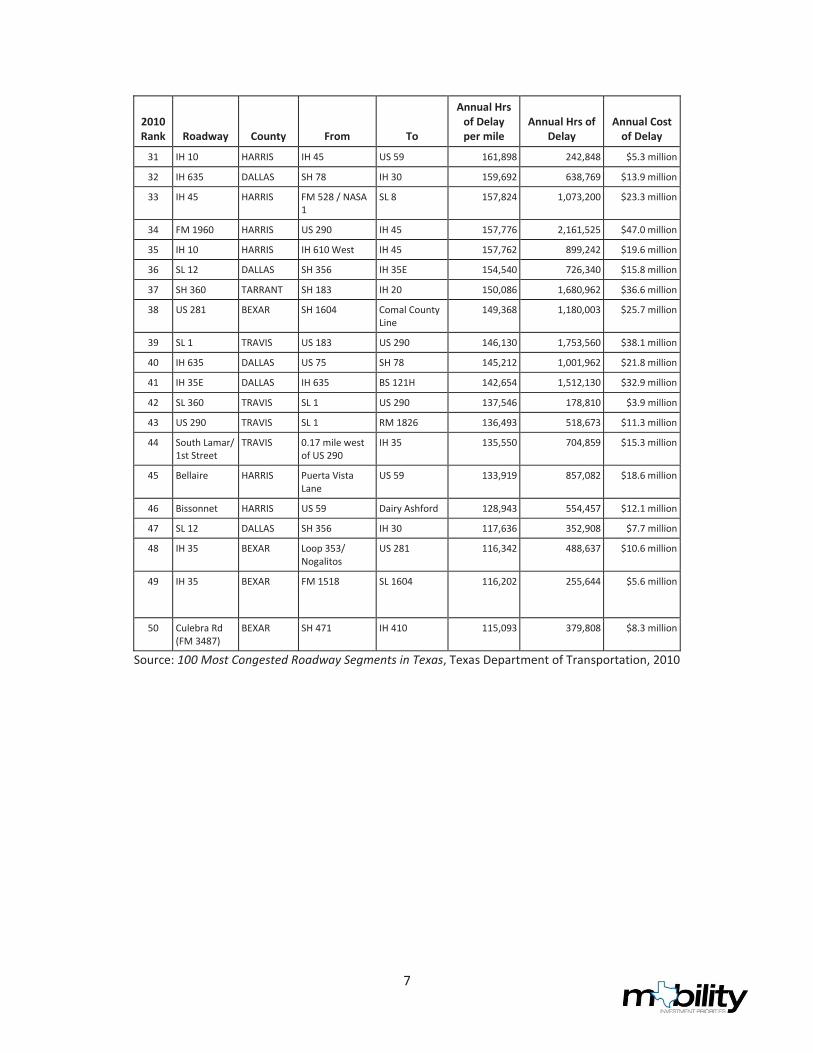
7
2010 Rank Roadway County From To
Annual Hrs of Delay per mile
Annual Hrs of Delay
Annual Cost of Delay
31 IH 10 HARRIS IH 45 US 59 161,898 242,848 $5.3 million
32 IH 635 DALLAS SH 78 IH 30 159,692 638,769 $13.9 million
33 IH 45 HARRIS FM 528 / NASA 1
SL 8 157,824 1,073,200 $23.3 million
34 FM 1960 HARRIS US 290 IH 45 157,776 2,161,525 $47.0 million
35 IH 10 HARRIS IH 610 West IH 45 157,762 899,242 $19.6 million
36 SL 12 DALLAS SH 356 IH 35E 154,540 726,340 $15.8 million
37 SH 360 TARRANT SH 183 IH 20 150,086 1,680,962 $36.6 million
38 US 281 BEXAR SH 1604 Comal County Line
149,368 1,180,003 $25.7 million
39 SL 1 TRAVIS US 183 US 290 146,130 1,753,560 $38.1 million
40 IH 635 DALLAS US 75 SH 78 145,212 1,001,962 $21.8 million
41 IH 35E DALLAS IH 635 BS 121H 142,654 1,512,130 $32.9 million
42 SL 360 TRAVIS SL 1 US 290 137,546 178,810 $3.9 million
43 US 290 TRAVIS SL 1 RM 1826 136,493 518,673 $11.3 million
44 South Lamar/ 1st Street
TRAVIS 0.17 mile west of US 290
IH 35 135,550 704,859 $15.3 million
45 Bellaire HARRIS Puerta Vista Lane
US 59 133,919 857,082 $18.6 million
46 Bissonnet HARRIS US 59 Dairy Ashford 128,943 554,457 $12.1 million
47 SL 12 DALLAS SH 356 IH 30 117,636 352,908 $7.7 million
48 IH 35 BEXAR Loop 353/ Nogalitos
US 281 116,342 488,637 $10.6 million
49 IH 35 BEXAR FM 1518 SL 1604 116,202 255,644 $5.6 million
50 Culebra Rd (FM 3487)
BEXAR SH 471 IH 410 115,093 379,808 $8.3 million
Source: 100 Most Congested Roadway Segments in Texas, Texas Department of Transportation, 2010

8
9
CONGESTION REDUCTION STRATEGY SUMMARY
Rider 42 recognized the role that traffic operations and travel option strategies will play in Texas’ future. The size of the congestion problem in the largest metropolitan areas is more significant than these actions will be able to address alone, but they represent a part of the solution. These strategies were included in the 2030 Committee’s Transportation Action Program, a combination of business, commuter, and agency actions that reduce peak-hour vehicle trips and efficiently use the existing roads.
Many of these strategies are relatively low-cost projects and programs; they have broad public support and can be rapidly implemented. These ideas require innovation, constant attention, and adjustment, but they pay dividends in faster, safer, and more reliable travel, better air quality, and improved economic conditions. Rapidly removing crashed vehicles, timing the traffic signals so that more vehicles see green lights, improving road and intersection designs, or adding a short section of roadway are relatively simple actions with big payoffs. The strategies are more fully described on the Mobility Investment Priorities website (mobility.tamu.edu/mip).
The language in Rider 42 focused the effort on addressing the congestion problems. A critical concept to understand is that congestion on a segment may be caused by a problem on another segment. And likewise, solutions to congestion may lie beyond the bounds of a particular congested highway segment. The solutions to congested corridors may not be on those roadways; there are many methods, projects, and programs to achieve the congestion benefits. The strategies summarized here and mentioned in each metropolitan area discussion can create congestion benefits if they are implemented on the congested road and on many parallel and intersecting roads, lanes, or transit routes.
The array of possible congestion reducing strategies has a variety of implementation timelines. Larger construction projects typically require longer time—in many cases more than 15 years from the idea stage to ribbon cutting. The typical time required for design, environmental clearance, acquisition of right-of-way, and construction can exceed four years in the best of circumstances (6). The Rider 42 project development funds seek to move large projects closer to implementation, but in the interim there are a variety of other congestion relief projects and programs that can be used to reduce stop-and-go traffic on freeways and major streets.
Additional Capacity
Adding capacity is the most frequently cited approach to congestion reduction and is achieved by adding traffic lanes, constructing new roadways, managed lanes, or improving designs. Additional traffic lanes have the ability to alleviate a congested corridor, particularly in bottleneck areas. Constructing new roadways reduces congestion; however, limited right-of-way in congested urban corridors makes this a costly approach. Managed lanes (also called express lanes, high-occupancy vehicle lanes, and high-occupancy toll lanes) can mitigate congestion by designating lanes for trucks or buses. Improvements to roadway and intersection designs increase the number of vehicles that can use the road, alleviating traffic congestion and improving safety. Grade separating roadways (building overpasses and underpasses) can reduce congestion by ensuring continuous traffic flow and removing conflict points.
10
Added Capacity Strategies Acceleration/Deceleration Lane Adding Lanes or Roads Adding New Toll Lanes or Toll Roads Commercial Vehicle Accommodations Displaced Left Turns Diverging Diamond Grade Separation Innovative Intersections Intersection Improvements
Loop Ramps Eliminating Left Turns Managed Lanes (also High-Occupancy Vehicle [HOV] or High-Occupancy Toll Lane [HOT]) Median U-Turns Modern Roundabout One-Way Street Quadrant Intersections Super Street
For more information go to mobility.tamu.edu/mip/strategies
These types of improvements are implemented by public agencies, private companies, or public-private partnerships. Implementation of additional capacity, whether it be expanding the roadway or converting regular lanes into managed lanes, is difficult and can be costly and time consuming.
Traffic Management
Traffic management is an essential component of congestion mitigation and primarily an agency responsibility. It can help improve the efficiency of the system by rapidly clearing collisions and stalled vehicles, improving signal coordination so that travelers see green lights as they move in the peak direction, installing turn lanes, combining driveways, removing chokepoints, and incorporating active traffic management principles such as variable speed limits, providing real-time traffic information that allows instant rerouting and restrictions that maintain a truck-free lane among other strategies.
Agencies are traditionally the technology implementers, but companies can help employees identify options for more efficient travel and offer incentives that build on agency actions.
Traffic Management StrategiesAccess Management Aggressive Incident Clearance Bottleneck Removal Dynamic Merge Control Electronic Toll Collection Systems Express Bus Service Freight Rail Improvements Multimodal Transportation Centers Park and Ride Lots Queue Warning Ramp Configurations Ramp Flow Control Reversible Traffic Lanes
Signal Operations and Management Special Event Traffic Management Temporary Shoulder Use Traveler Information Systems Truck Lane Restrictions Variable Speed Limits Construction Contracting Options Reducing Construction & Maintenance Interference Pavement Recycling Shoulder Pavement Upgrade Sustainable Pavements
For more information go to mobility.tamu.edu/mip/strategies
11
Travel Options
Travel options during peak periods of travel can reduce congestion at very low cost. The physical structure of the transportation network of many large cities can compound congestion as widely distributed workers commute along congested corridors to major activity centers. Reducing single occupant vehicle trips by encouraging practices such as ridesharing or vanpooling can reduce roadway congestion. This encouragement is often helped by implementing parking management and variable pricing on roadways near the major activity centers. The peak-period trips associated with the 8 a.m. to 5 p.m. schedule not only saturate freeway corridors but also clog downtown streets, urban arterials, and parking facilities. Other strategies like telecommuting and flexible work schedule also reduce roadway congestion.
Travel options are implemented by public agencies and private companies depending on the type of program. Public agencies may determine a variable pricing system or create management plans or ordinances that guide efforts to reduce rush hour traffic. Private companies play the key role in offering employee options such as flexible work hours, compressed work weeks, and telecommuting. Shipping companies may also participate by, for example, choosing to transport goods overnight in an effort to meet their deadlines while also reducing roadway congestion during peak travel periods.
Travel Option Strategies Telecommuting Compressed Work Week Variable Pricing Parking Management Vanpool
Trip Reduction Ordinances Land Use Planning Flexible Work Hours
For more information go to mobility.tamu.edu/mip/strategies
Funding Strategies
Funding is a critical aspect of transportation improvements. Projects and roadway improvements will not become reality without a funding mechanism in place. Traditional funding mechanisms such as the motor fuel tax, general revenue funds, and bonds still fund many transportation improvement projects; however, other funding opportunities or mixes of existing finance ideas should be identified in an effort to maximize flexibility in financing improvements.
There are a number of funding strategies that may be used such as pass-through financing, fuel tax, vehicle-miles traveled fee, vehicle sales tax, increased vehicle registration fees, or tax increment financing. Each new or increased fee strategy should be targeted to transportation.
12
Funding Strategies Fuel Tax – Statewide and Local Indexed Fuel Tax Vehicle Registration Fee – Statewide and Local Public-Private Partnership Comprehensive Development Agreement
Pass Through Financing Driver’s License Surcharge Vehicle-Miles Traveled Fee Vehicle Sales Tax Fuel Sales Tax Tax Increment Financing
For more information go to mobility.tamu.edu/mip/strategies
Public Engagement
Public engagement is a crucial aspect of transportation planning, particularly when voter approved funding mechanisms are considered to finance project costs. Public opinion of a proposed project can determine the success or failure of the project. Studies agree that public outreach is a necessary component of successful project planning and can ultimately benefit the decision-making process (7, 8).
Public engagement strategies are implemented by the public agency or a private consulting firm hired to conduct project meetings. The following strategies have a range of costs, but all have been shown to be cost-effective approaches.
Public Engagement Strategies Citizens Advisory Committee Crowdsourcing Electronic Update Fact Sheet Opinion Research
Project Newsletter Project Website Public Hearings And Meetings Social Media Virtual Public Meeting
For more information go to mobility.tamu.edu/mip/strategies
13
RECOMMENDATION SUMMARY
This first recommendations report identifies the initial results of activities being undertaken by the Texas Transportation Institute related to coordinating studies in the four most congested areas of the state. The 82nd Legislature allocated $300 million in Proposition 12 bond proceeds for right-of-way acquisition, feasibility studies and project planning, and engineering work for projects that will relieve congestion on the most congested road segments in the Dallas-Fort Worth, Houston, Austin, and San Antonio metropolitan areas. TTI was directed by the legislature to coordinate studies to ensure the most effective use of these funds, as well as to ensure public participation, to consider the fullest possible range of funding options for project concepts generated under these studies, and to make recommendations to the department at major decision points.
The Mobility Investment Priorities Study has worked with agencies in each of the four metropolitan areas to identify studies, design efforts, or purchases of rights-of-way that meet the goals of Rider 42. This section summarizes the recommendations that will move major projects closer to completion and improve mobility in the four metropolitan areas. More information is included in each corridor summary in previous chapters. Most of these studies or right-of-way purchases can be funded by Proposition 12 bond funds. All of the studies will improve the knowledge of the costs and benefits of major transportation improvements.
Two environmental study types are used throughout the recommendations; a brief description of these two is provided below.
Planning and Environmental Linkages Study -- Planning and Environment Linkages (PEL) studies are an approach to transportation decision making that considers environmental, community, and economic goals early in the planning stage and carries them through project development, design, and construction (9).
A PEL study is typically conducted for either a corridor or a subarea and will examine the needs and potential solution concepts using previous corridor/subarea studies. The PEL process involves a very proactive public involvement process involving all the appropriate stakeholders and transportation partners. The PEL allows the relatively rapid consideration of all available studies and narrows the list of alternatives to those likely to address the diverse travel, economic, social and safety needs of the community and focuses subsequent environmental studies.
National Environmental Policy Act (NEPA) Study -- A National Environmental Policy Act (NEPA) study assesses the environmental impacts of the action and must be completed prior to any improvements being constructed. Various levels of NEPA analysis may be required depending upon the anticipated impacts; these can be determined in the Planning and Environment Linkages Study (10).
14
An Environmental Impact Statement (EIS) is conducted whenever it is anticipated that the federal action will significantly affect the quality of the natural or human environment. An EIS includes consideration of a range of reasonable alternatives, analyzes the potential impacts resulting from the alternatives, and demonstrates compliance with applicable environmental laws, rules, and executive orders.
An Environmental Assessment (EA) is conducted when it is anticipated that a significant impact will not occur. If the assessment indicates, a Finding of No Significant Impact (FONSI) is issued. If a FONSI is not appropriate, additional mitigation or analysis may be required.
Most of the funding recommended in this report is allocated to purchase right-of-way in a few corridors. This is appropriate for the current development stage in those corridors. The corridors and projects are noted; the specific parcels will be identified in subsequent requests by TxDOT. The studies and design efforts will likewise be specified and consultants hired (or in-house work begun) as appropriate for each item.
15
Austin
The City of Austin has nearly doubled in size every 20 years since World War II. The rapid growth of the city has exacerbated traffic congestion in the area. IH 35, North Lamar, and MoPac—the three most congested sections in the metro area—are parallel north-south routes and are, essentially, the same problem. Improvements made to IH 35, for example, will likely reduce congestion on North Lamar and MoPac.
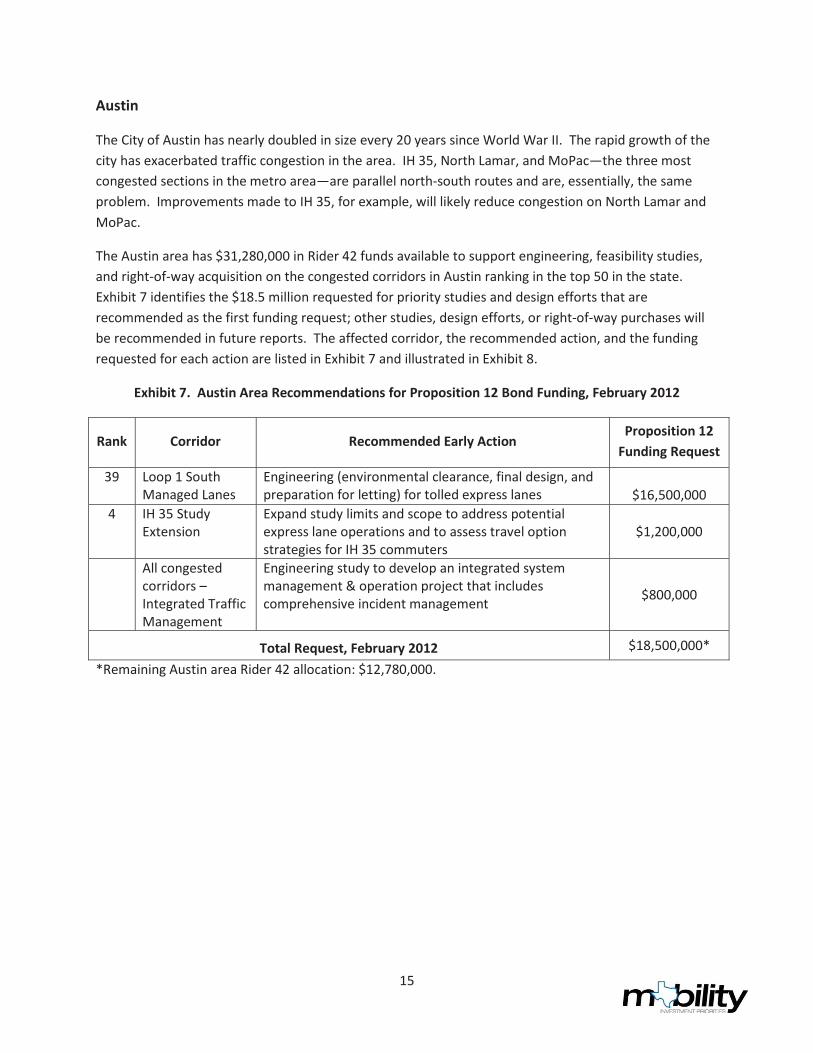
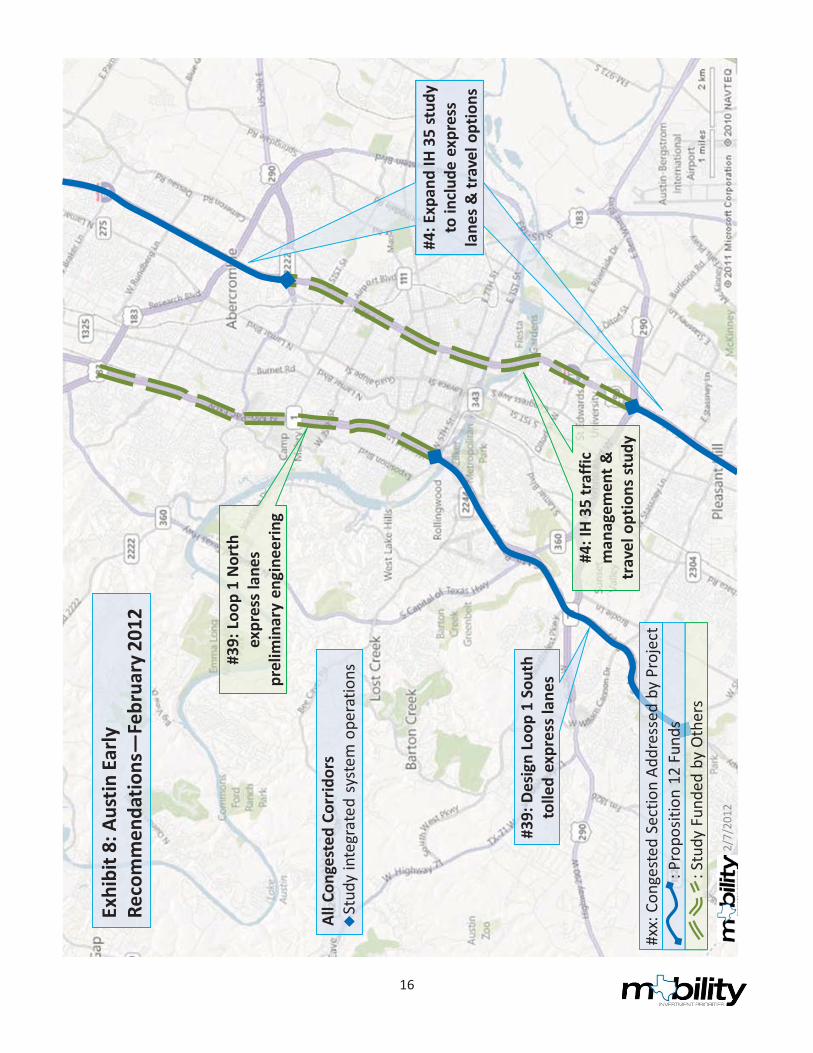
The Austin area has $31,280,000 in Rider 42 funds available to support engineering, feasibility studies, and right-of-way acquisition on the congested corridors in Austin ranking in the top 50 in the state. Exhibit 7 identifies the $18.5 million requested for priority studies and design efforts that are recommended as the first funding request; other studies, design efforts, or right-of-way purchases will be recommended in future reports. The affected corridor, the recommended action, and the funding requested for each action are listed in Exhibit 7 and illustrated in Exhibit 8.
Exhibit 7. Austin Area Recommendations for Proposition 12 Bond Funding, February 2012
Rank Corridor Recommended Early Action Proposition 12
Funding Request
39 Loop 1 South Managed Lanes
Engineering (environmental clearance, final design, and preparation for letting) for tolled express lanes
$16,500,000
4 IH 35 Study Extension
Expand study limits and scope to address potential express lane operations and to assess travel option strategies for IH 35 commuters
$1,200,000
All congested corridors – Integrated Traffic Management
Engineering study to develop an integrated system management & operation project that includes comprehensive incident management $800,000
Total Request, February 2012 $18,500,000*
*Remaining Austin area Rider 42 allocation: $12,780,000.
16
#4: E
xpan
d IH
35
stud
y to
incl
ude
expr
ess
lane
s & tr
avel
opt
ions
Exhi
bit 8
: Aus
tin E
arly
Reco
mm
enda
tions
—Fe
brua
ry 2
012
#39:
Des
ign
Loop
1 S
outh
to
lled
expr
ess l
anes
#4: I
H 35
traf
fic
man
agem
ent &
tr
avel
opt
ions
stud
y
2/7/
2012
All C
onge
sted
Cor
ridor
sSt
udy
inte
grat
ed s
yste
m o
pera
tions
#39:
Loo
p 1
Nor
th
expr
ess l
anes
pr
elim
inar
y en
gine
erin
g
: Stu
dy F
unde
d by
Oth
ers
: Pro
posit
ion
12 F
unds
#x
x: C
onge
sted
Sec
tion
Addr
esse
d by
Pro
ject
17
All Congested Corridors
All of the major capacity-adding projects will require a few years to implement. There are several tactics that can be implemented in the interim to improve traffic congestion before, during, and after construction.
Traffic Management System
The traffic system management and operations practices should be examined and recommendations identified to determine the set of equipment, technologies, policies, practices, facilities, staffing, and/or system needed to achieve integrated, regional transportation management response to recurring and non-recurring traffic events. The need to coordinate actions between regional partners to actively provide multimodal, cross-jurisdictional system management and operations requires that the regional transportation stakeholders, including TxDOT, City of Austin, the Central Texas Regional Mobility Authority (CTRMA), and other local agencies, have the ability to monitor the state of the transportation system, share information, and coordinate traffic management responses across jurisdictional boundaries. Recommendations will also be prepared as to what agreements, institutional arrangements, memoranda of understanding, and procedures are needed for the local agencies to provide better coordination and management of traffic from a regional perspective. Public engagement in developing and finalizing the alternatives, implementation of active traffic management, and travel option strategies will be a major component of the phase.
Proposition 12 bond funds should be used to conduct feasibility and engineering studies related to expanding the traffic system management and operations program for the congested corridors in Austin.
o Requested Funding: $800,000 for an engineering and feasibility study.
IH 35, SH 71 (Ben White Blvd.) to US 183 North (Statewide Congestion Rank #4)
The City of Austin’s IH 35 Corridor Development Program addresses a wide range of potential short and mid-term traffic and demand management strategies to improve the operation of the IH 35 section within the existing freeway footprint from Ben White Boulevard to US 290 East. The study should be extended to cover IH 35 from SH 45 to the south and SH 45 to the north. Initial feedback to the City of Austin from partner jurisdictions (including the Texas Department of Transportation, Capital Metro, and Williamson County) indicates that a bidirectional, concurrent flow managed lane facility should be provided beyond the central Austin corridor, connecting with a potential complementary facility on each end in Williamson County and/or Hays County.
The extended feasibility effort would develop conceptual alternatives for continuous express lanes (the local term for the treatment also known as managed lanes), including ingress/egress and lane separation strategies. An operational concept would be prepared for the preferred alternative, to include system use policies, transit/rideshare features, enabling technologies, system operations procedures, marketing and education, and other required components to deploy a managed lane system solution on IH 35. The study would also identify options that are publicly acceptable through a rigorous public engagement
18
process. In addition, the travel option strategies needed to support the use of the express lanes and a performance monitoring program to ensure the effective operation of all corridor congestion reduction strategies will be developed.
Proposition 12 bond funds should be used to extend the limits of the City’s IH 35 study north of SH 45 in Williamson County to south of SH 45 in Hays County. This study includes the investigation of the feasibility of express lanes in the corridor and the development of operations improvements and travel options required to support congestion reduction in the corridor.
o Requested Funding: $1,200,000 for a project feasibility study.
MoPac/Loop 1, US 183 North to US 290 West (Statewide Congestion Rank #39)
The Central Texas Regional Mobility Authority (CTRMA) and TxDOT are developing tolled express lanes on the north section of Loop 1 between Cesar Chavez Street and Parmer Lane; these activities should be expanded to South MoPac. Public engagement is a key part of the process. The Capital Area Metropolitan Planning Organization (CAMPO) 2035 Regional Transportation Plan calls for tolled managed lanes on this section of Loop 1, with one managed lane in each direction. In cooperation with Capital Metropolitan Transportation Authority (CapMetro), the public transit authority for the metro area, the express lanes will also provide a dedicated transit corridor for buses and registered van pools.
Proposition 12 bond funds should be used for an environmental study, preliminary engineering, and final design to add northbound and southbound express lanes on South MoPac/South Loop 1 from the Cesar Chavez interchange to Slaughter Lane.
o Requested Funding: $16,500,000 for an environmental study, preliminary engineering, final design, and preparation for project letting for a system of express lanes for the South MoPac (Loop 1) corridor between Cesar Chavez Street and Slaughter Lane.
19
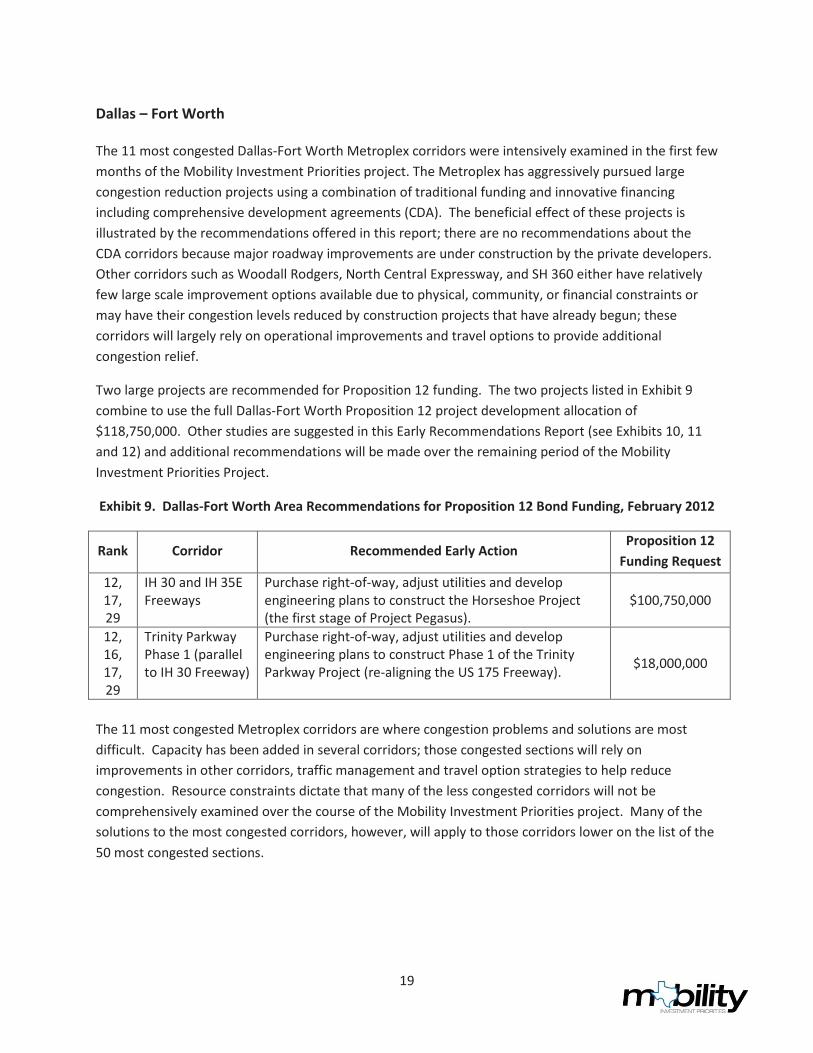
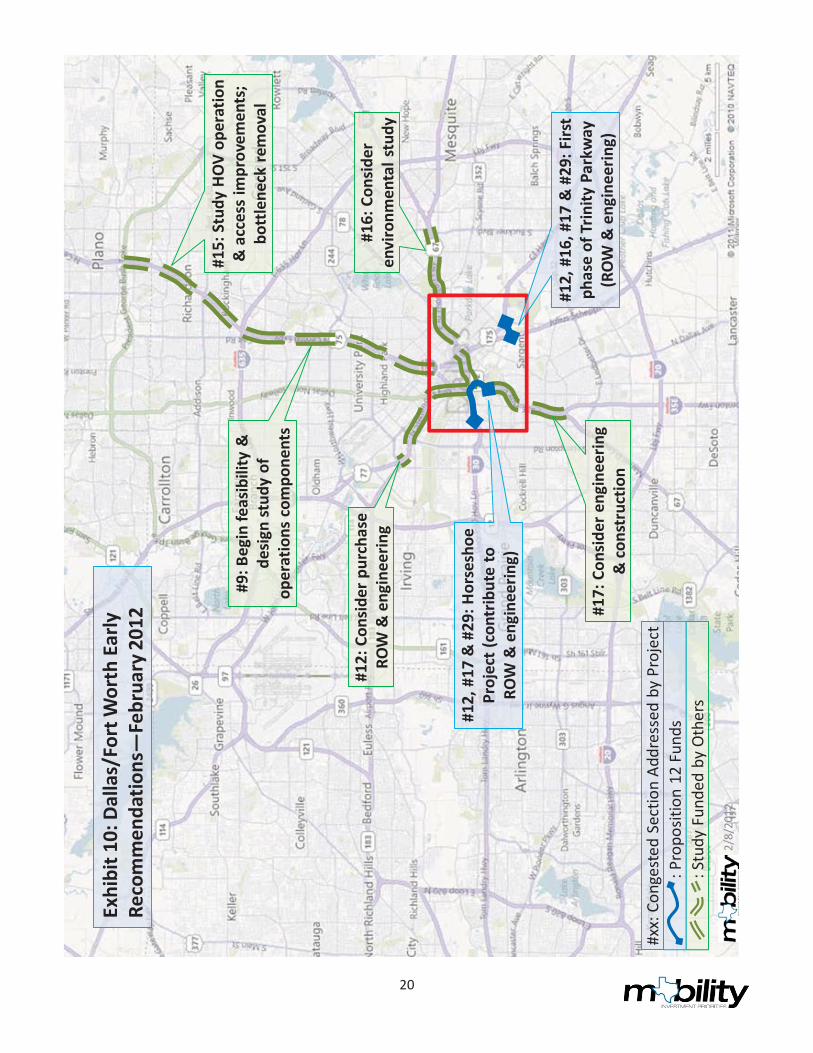
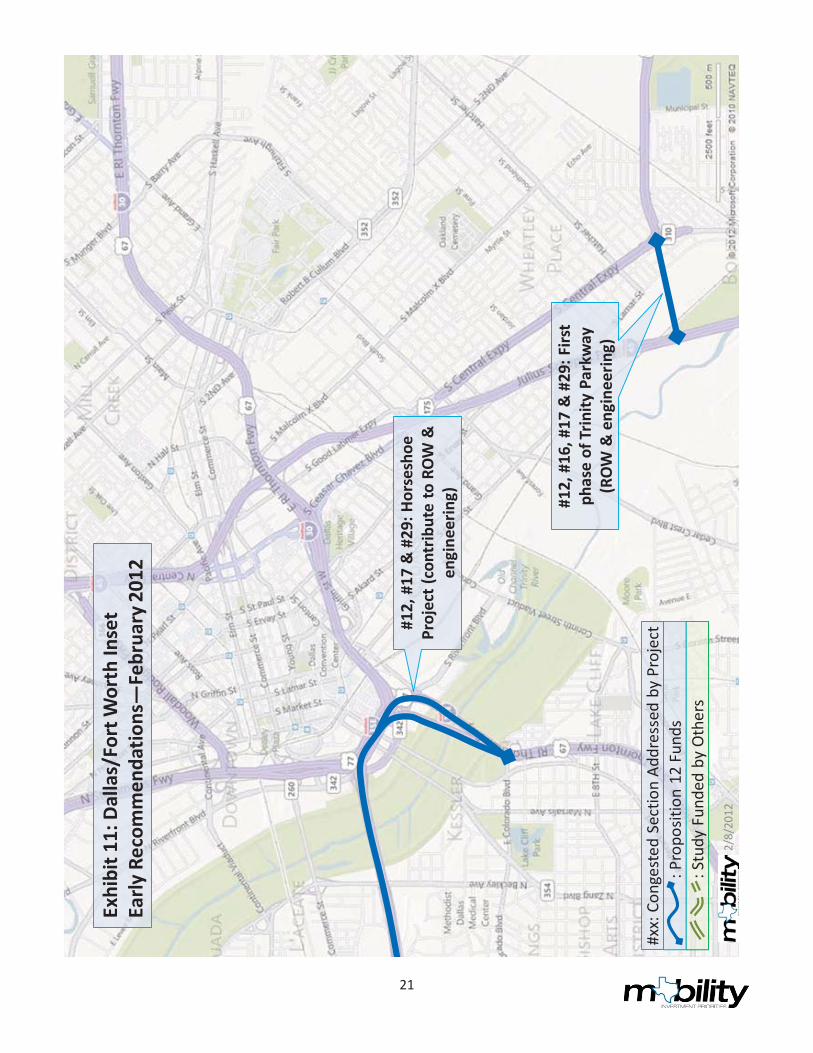
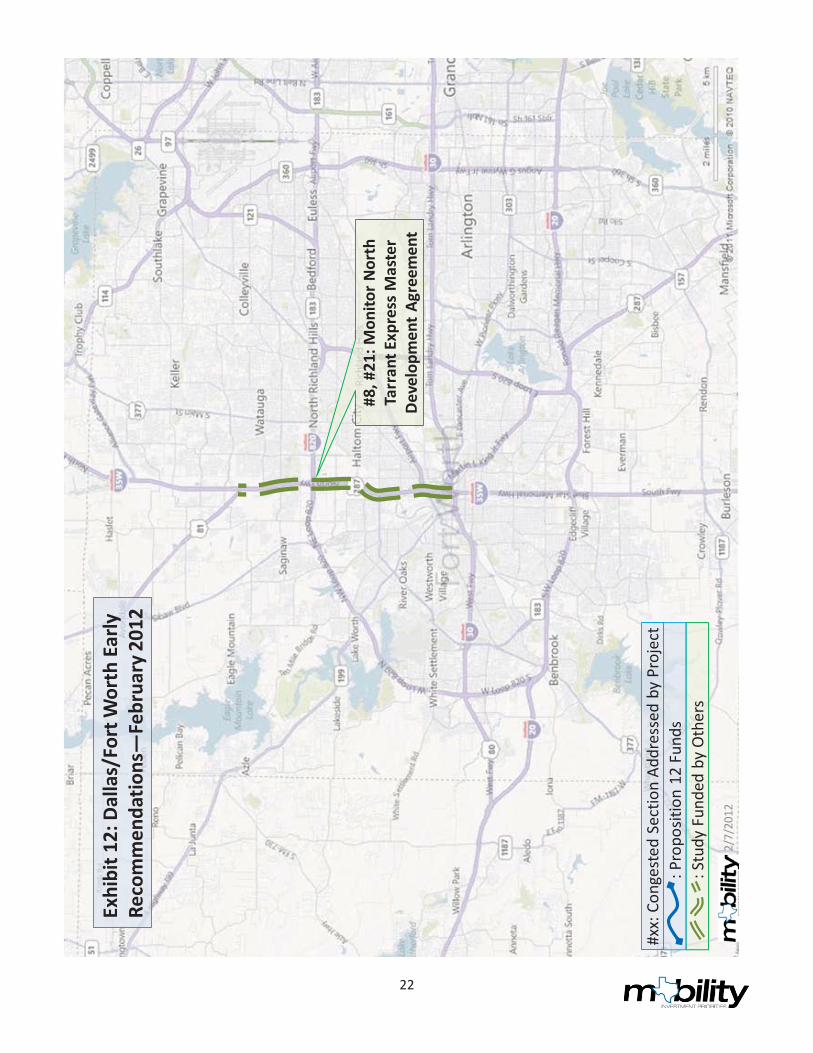
Dallas – Fort Worth
The 11 most congested Dallas-Fort Worth Metroplex corridors were intensively examined in the first few months of the Mobility Investment Priorities project. The Metroplex has aggressively pursued large congestion reduction projects using a combination of traditional funding and innovative financing including comprehensive development agreements (CDA). The beneficial effect of these projects is illustrated by the recommendations offered in this report; there are no recommendations about the CDA corridors because major roadway improvements are under construction by the private developers. Other corridors such as Woodall Rodgers, North Central Expressway, and SH 360 either have relatively few large scale improvement options available due to physical, community, or financial constraints or may have their congestion levels reduced by construction projects that have already begun; these corridors will largely rely on operational improvements and travel options to provide additional congestion relief.
Two large projects are recommended for Proposition 12 funding. The two projects listed in Exhibit 9 combine to use the full Dallas-Fort Worth Proposition 12 project development allocation of $118,750,000. Other studies are suggested in this Early Recommendations Report (see Exhibits 10, 11 and 12) and additional recommendations will be made over the remaining period of the Mobility Investment Priorities Project.
Exhibit 9. Dallas-Fort Worth Area Recommendations for Proposition 12 Bond Funding, February 2012
Rank Corridor Recommended Early Action Proposition 12
Funding Request 12, 17, 29
IH 30 and IH 35E Freeways
Purchase right-of-way, adjust utilities and develop engineering plans to construct the Horseshoe Project (the first stage of Project Pegasus).
$100,750,000
12, 16, 17, 29
Trinity Parkway Phase 1 (parallel to IH 30 Freeway)
Purchase right-of-way, adjust utilities and develop engineering plans to construct Phase 1 of the Trinity Parkway Project (re-aligning the US 175 Freeway). $18,000,000
The 11 most congested Metroplex corridors are where congestion problems and solutions are most difficult. Capacity has been added in several corridors; those congested sections will rely on improvements in other corridors, traffic management and travel option strategies to help reduce congestion. Resource constraints dictate that many of the less congested corridors will not be comprehensively examined over the course of the Mobility Investment Priorities project. Many of the solutions to the most congested corridors, however, will apply to those corridors lower on the list of the 50 most congested sections.
20
2/8/
2012
#12,
#17
& #
29: H
orse
shoe
Pr
ojec
t (co
ntrib
ute
to
ROW
& e
ngin
eerin
g)
#17:
Con
side
r eng
inee
ring
& c
onst
ruct
ion
#15:
Stu
dy H
OV
oper
atio
n &
acc
ess
impr
ovem
ents
; bo
ttle
neck
rem
oval
#9: B
egin
feas
ibili
ty &
de
sign
stud
y of
op
erat
ions
com
pone
nts
#16:
Con
sider
en
viro
nmen
tal s
tudy
#12:
Con
side
r pur
chas
e RO
W &
eng
inee
ring
#12,
#16
, #17
& #
29: F
irst
phas
e of
Trin
ity P
arkw
ay
(RO
W &
eng
inee
ring)
Exhi
bit 1
0: D
alla
s/Fo
rt W
orth
Ear
ly
Reco
mm
enda
tions
—Fe
brua
ry 2
012
: Stu
dy F
unde
d by
Oth
ers
: Pro
posit
ion
12 F
unds
#x
x: C
onge
sted
Sec
tion
Addr
esse
d by
Pro
ject
21
2/8/
2012
#12,
#17
& #
29: H
orse
shoe
Pr
ojec
t (co
ntrib
ute
to R
OW
&
engi
neer
ing) #1
2, #
16, #
17 &
#29
: Firs
t ph
ase
of T
rinity
Par
kway
(R
OW
& e
ngin
eerin
g)
Exhi
bit 1
1: D
alla
s/Fo
rt W
orth
Inse
tEa
rly R
ecom
men
datio
ns—
Febr
uary
201
2
: Stu
dy F
unde
d by
Oth
ers
: Pro
posit
ion
12 F
unds
#x
x: C
onge
sted
Sec
tion
Addr
esse
d by
Pro
ject
22
2/7/
2012
#8, #
21: M
onito
r Nor
th
Tarr
ant E
xpre
ss M
aste
r De
velo
pmen
t Agr
eem
ent
: Stu
dy F
unde
d by
Oth
ers
: Pro
posit
ion
12 F
unds
#x
x: C
onge
sted
Sec
tion
Addr
esse
d by
Pro
ject
Exhi
bit 1
2: D
alla
s/Fo
rt W
orth
Ear
ly
Reco
mm
enda
tions
—Fe
brua
ry 2
012
23
LBJ Freeway (IH 635), IH 35E (Stemmons Freeway) to US 75 (North Central Expressway) (Statewide Congestion Rank #3)
LBJ Infrastructure Group will construct, operate and maintain the managed lanes roadway under a comprehensive development agreement (CDA). As such, there may be no ability for any other entity to make operational changes, suggest changes, or enact improvements. This issue will be studied in future months.
Woodall Rodgers Freeway, IH 35E (Stemmons Freeway) to US 75 (North Central Expressway) (Statewide Congestion Rank #5)
Deficiencies with Woodall Rodgers Freeway are not the principal cause of the congestion. Stemmons Freeway and North Central Expressway, the two freeways on the ends of Woodall Rodgers, are congested and do not allow traffic to efficiently enter and exit those roadways. Adding capacity to Woodall Rodgers would only offer more space for traffic to queue, it would not relieve congestion. There are no specific plans or projects on this roadway beyond the western extension that is under construction, but other solutions will be examined over the next several months.
IH 35W North Freeway, IH 30 (East Freeway) to SH 183 (NE 28th St.) (Statewide Congestion Rank #8)
IH 35W is part of the North Tarrant Express CDA Master Development Agreement. It is not part of the ongoing construction efforts but an agreement to include this facility in the construction efforts is being pursued. This project should have environmental and schematic clearance by mid-2012. Regional planners will monitor IH 35W’s addition to the North Tarrant Express CDA and initiation of construction. If added to the CDA, further planned improvement to the corridor will be reviewed.
The conclusions of the North Tarrant Express Master Development Agreement should be monitored. If construction will not be performed by North Tarrant Express Mobility Partners, additional actions may be required.
US 75 Central Expressway, IH 635 (LBJ Freeway) to Woodall Rodgers Freeway (Statewide Congestion Rank #9)
The current configuration of US 75 will remain for the next few decades. A significant widening was accomplished in the 1990s. Some of the corridor is below ground level and most of the length is surrounded by multi-storied commercial buildings and neighborhoods; Southern Methodist University abuts a portion of the corridor. As there are no plans for additional capacity, this corridor will address congestion through use of light-rail transit capacity and additional traffic management and travel demand management efforts through the FHWA Integrated Corridor Management (ICM) program. The ICM is a comprehensive operations strategy that will integrate systems (freeway, transit, and arterials) to get the full use out of the available capacity. In addition, a traveler information program that gives traffic information to drivers could be developed as part of this project.
24
A feasibility study and design of the operations components identified in the Integrated Corridor Management study should be conducted. Any road construction needed to implement the feasible components along the US 75 corridor should be considered.
IH 35E Stemmons Freeway, IH 30 (Tom Landry Highway) to SH 183 (Airport Freeway) (Statewide Congestion Rank #12)
Additional freeway/high occupancy vehicle (HOV)/managed lane capacity has been recommended in this corridor since 1986 in the Mobility 2000 Plan. A subarea study was undertaken in 1989, which refined the recommended improvement strategy and this portion of IH 35E was included in the Trinity Parkway Major Investment Study (conducted 1996 to 1998) that also confirmed the need for additional freeway and managed lane capacity. The section of freeway from Jefferson Viaduct to Colorado Street is part of a Texas Transportation Commission approved design-build project named the Horseshoe. TxDOT began the procurement for a design-build contractor on the Horseshoe Project (a short, but important bridge rebuilding and bottleneck removal project that is the first stage of Project Pegasus—see www.projectpegasus.org) in December 2011. This project will replace the rapidly deteriorating IH 30 and IH 35E bridges that cross the Trinity River, as well as the connecting roadways where they converge near the Dallas Central Business District.
Due to requirements that the long-range plan must be limited to projects with identified funding, and since this facility was parallel to the proposed Trinity Parkway, it was removed from the financially constrained section of the Mobility 2035 Plan but remains in the vision component of the plan for consideration if additional funding is realized. The project was environmentally cleared through a Finding of No Significant Impact (FONSI) in July 2005. No engineering or right-of-way (ROW) work is being performed for the project.
Proposition 12 bond funds should be used to complete the engineering and right-of-way acquisition for the Horseshoe project. The project will decrease congestion levels on sections of Stemmons, Tom Landry, and South R.L. Thornton Freeways (ranked #12, #17, and #29). Construction funding has been allocated from a variety of other sources including other portions of Proposition 12.
o Required Funding: $47,000,000 in funding for right-of-way purchase/utility relocation and $53,750,000 in engineering funding should be allocated.
If it appears possible to gain a community consensus that construction should proceed on a congestion reduction project for the entire corridor, ROW purchase and engineering along the IH 35E corridor should be started.
IH 820 (Northeast Loop), IH 35W (North Freeway) to SH 183 (Airport Freeway) (Statewide Congestion Rank #14)
North Tarrant Express Mobility Partners will construct, operate and maintain this section of IH 820 under a comprehensive development agreement. This should significantly mitigate the congestion on the roadway. Regional and local planners will monitor areas near the corridor during and after construction to address any resulting congestion.
25
US 75 Central Expressway, SH 190 to IH 635 (LBJ Freeway) (Statewide Congestion Rank #15)
Construction of this corridor was completed in the late 1980s. TxDOT will soon begin the process of hiring a consultant to study possible improvements in this corridor. Congestion can be partially addressed through additional traffic management, travel options, and bottleneck removal efforts on both the freeway and the HOV lane through the FHWA Integrated Corridor Management (ICM) program. TxDOT is also working on the design of interchange improvements on US 75 at the SH 190 interchange that will widen direct-connect ramps and construct auxiliary lanes.
A project planning study and feasibility analysis should be conducted to identify potential HOV lane operations and access improvements on the US 75 corridor. In addition, the feasibility of interchange improvements and bottleneck removal projects at the US 75/SH 190 interchange should also be studied. This might include widening direct-connect ramps, adding short road sections to improve traffic flow or other relatively limited projects.
IH 30 East RL Thornton Freeway, Jefferson Viaduct to SL 12 East (Statewide Congestion Rank #16)
The North Central Texas Council of Governments (NCTCOG) states that improvements on IH 30 from the Jefferson Viaduct to SL 12 East are warranted based on 2035 traffic projections. However, because of financial limitations, this project was not included in Mobility 2035 recommendations but remains in the vision component of the plan for consideration if additional funding is realized. The East Corridor Transportation Study was started in 2004 with preliminary engineering and feasibility. Planned improvements included reconstruction, lane expansion, and new or enhanced HOV/managed lane facilities. The project never completed the formal environmental assessment process.
The Trinity Parkway alignment and funding has not been determined, but when completed it will provide an alternate route to the very congested IH 30 section south of downtown (locally known as the Canyon). The first phase of the Trinity Parkway involves re-aligning the US 175 Freeway to intersect IH 45 in the Trinity River basin. In addition, this will provide safety and community benefits to the US 175 Freeway.
Proposition 12 bond funds should be used to complete engineering and right-of-way acquisition for the Trinity Parkway, Phase 1 project. The project is a key component of the Trinity Parkway Project that will decrease congestion levels on sections of East R.L. Thornton, Stemmons, Tom Landry, and South R.L. Thornton Freeways (ranked #12, #16, #17, and #29). Area agencies indicate that the Trinity Parkway must be operating as an alternate route for construction traffic for the Canyon construction project. Construction funding has been allocated from a variety of other sources including other sections of Proposition 12.
o Required Funding: $5,600,000 in funding for right-of-way purchase/utility relocation and $12,400,000 in engineering funding should be allocated.
The environmental study along the East IH 30 corridor should be completed if it appears possible to gain a community consensus that construction should proceed on a congestion reduction project in this corridor.
26
IH 35E South RL Thornton Freeway, US 67 to Jefferson Viaduct (Statewide Congestion Rank #17)
In 2002, a Major Investment Study (MIS) was initiated that resulted in recommendations for the corridor. The project to widen IH 35E from SH 183 to 8th Street was environmentally cleared through a Finding of No Significant Impact (FONSI) in July 2005. The section of freeway from Jefferson Viaduct to Colorado Street is part of a Texas Transportation Commission approved design-build project named the Horseshoe. TxDOT began the procurement for a design-build contractor on the Horseshoe Project (a short but important bridge rebuilding and bottleneck removal project) in December 2011. Funding has been identified for the section of IH 35E from Reunion Boulevard to south of Colorado Street (including the IH 35E bridges over Trinity River). No funding source has been identified for the approximately $300 million of the Southern Gateway Project section from south of Colorado Street to US 67.
IH 35E from 8th Street to US 67 was environmentally approved in June 2006 through a FONSI. If it appears possible to gain a community consensus that construction should proceed on a congestion reduction project in this entire corridor, engineering work on this section of IH 35E should begin.
IH 35E Stemmons Freeway, SL 12 (Walton Walker Freeway) to IH 635 (LBJ Freeway) (Statewide Congestion Rank #19)
Reconstruction of this section of IH 35E and the addition of managed lanes and connections to LBJ Freeway began in 2011 as part of the LBJ Express project. NCTCOG, TxDOT, and municipalities will continue to monitor congestion and identify and analyze possible improvements to the corridor during construction and completion of the LBJ Express.
IH 35W (North Freeway), SH 183 (N. 28th St.) to US 287 (US 81) (Statewide Congestion Rank #21)
IH 35W is part of the North Tarrant Express CDA Master Development Agreement. It is not part of the ongoing construction efforts, but an agreement to include this facility in the construction efforts is being pursued. This project should have environmental and schematic clearance by mid-2012. Regional planners will monitor IH 35W’s addition to the North Tarrant Express CDA and initiation of construction. If added to the CDA, further planned improvement to the corridor will be reviewed.
The section of IH 35W from IH 820 to US 287 will be traditionally let through TxDOT. The estimated construction cost is $140 million. Letting for this project is anticipated in late 2012.
The conclusions of the North Tarrant Express Master Development Agreement should be monitored. If construction will not be performed by North Tarrant Express Mobility Partners, additional actions may be required.
27
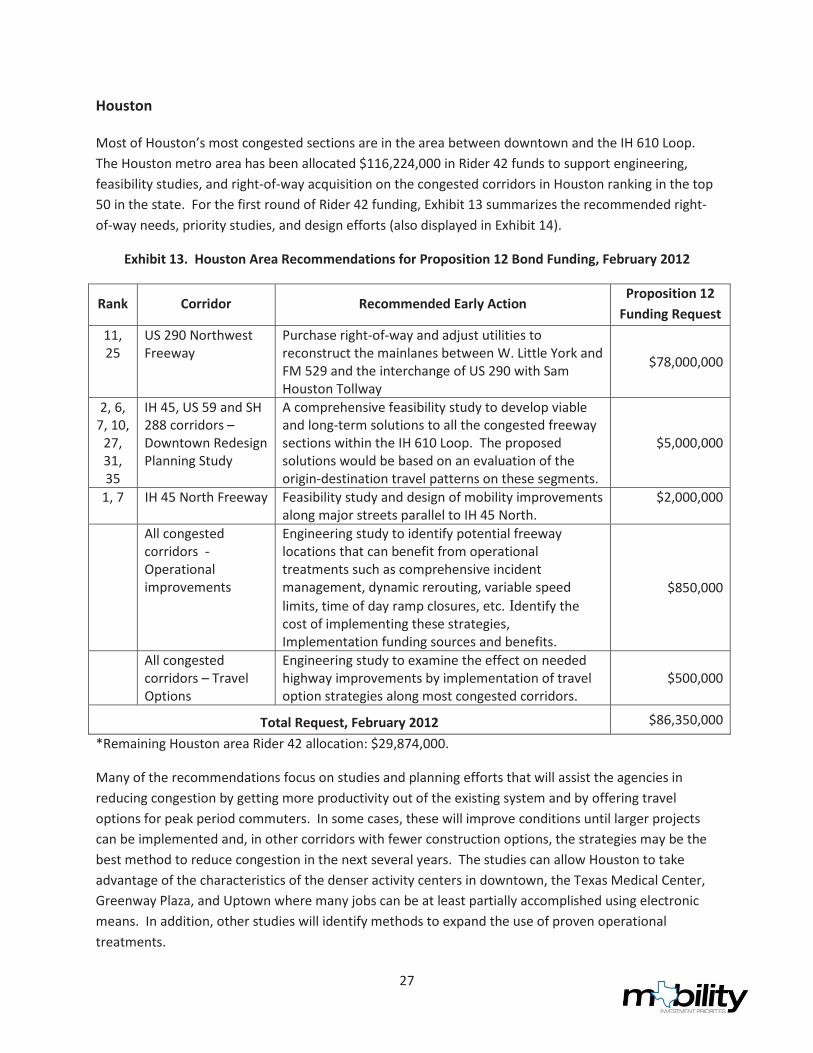
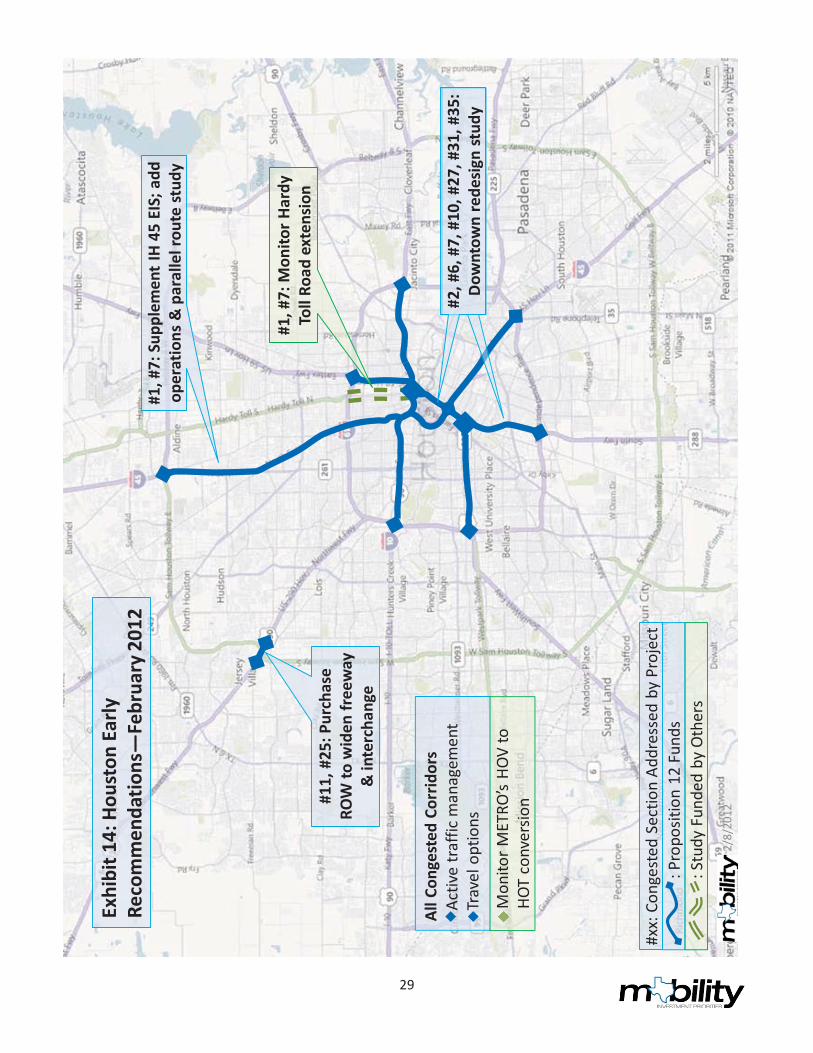
Houston
Most of Houston’s most congested sections are in the area between downtown and the IH 610 Loop. The Houston metro area has been allocated $116,224,000 in Rider 42 funds to support engineering, feasibility studies, and right-of-way acquisition on the congested corridors in Houston ranking in the top 50 in the state. For the first round of Rider 42 funding, Exhibit 13 summarizes the recommended right-of-way needs, priority studies, and design efforts (also displayed in Exhibit 14).
Exhibit 13. Houston Area Recommendations for Proposition 12 Bond Funding, February 2012
Rank Corridor Recommended Early Action Proposition 12
Funding Request 11, 25
US 290 Northwest Freeway
Purchase right-of-way and adjust utilities to reconstruct the mainlanes between W. Little York and FM 529 and the interchange of US 290 with Sam Houston Tollway
$78,000,000
2, 6, 7, 10,
27, 31, 35
IH 45, US 59 and SH 288 corridors – Downtown Redesign Planning Study
A comprehensive feasibility study to develop viable and long-term solutions to all the congested freeway sections within the IH 610 Loop. The proposed solutions would be based on an evaluation of the origin-destination travel patterns on these segments.
$5,000,000
1, 7 IH 45 North Freeway Feasibility study and design of mobility improvements along major streets parallel to IH 45 North.
$2,000,000
All congested corridors - Operational improvements
Engineering study to identify potential freeway locations that can benefit from operational treatments such as comprehensive incident management, dynamic rerouting, variable speed limits, time of day ramp closures, etc. Identify the cost of implementing these strategies, Implementation funding sources and benefits.
$850,000
All congested corridors – Travel Options
Engineering study to examine the effect on needed highway improvements by implementation of travel option strategies along most congested corridors.
$500,000
Total Request, February 2012 $86,350,000
*Remaining Houston area Rider 42 allocation: $29,874,000.
Many of the recommendations focus on studies and planning efforts that will assist the agencies in reducing congestion by getting more productivity out of the existing system and by offering travel options for peak period commuters. In some cases, these will improve conditions until larger projects can be implemented and, in other corridors with fewer construction options, the strategies may be the best method to reduce congestion in the next several years. The studies can allow Houston to take advantage of the characteristics of the denser activity centers in downtown, the Texas Medical Center, Greenway Plaza, and Uptown where many jobs can be at least partially accomplished using electronic means. In addition, other studies will identify methods to expand the use of proven operational treatments.
28
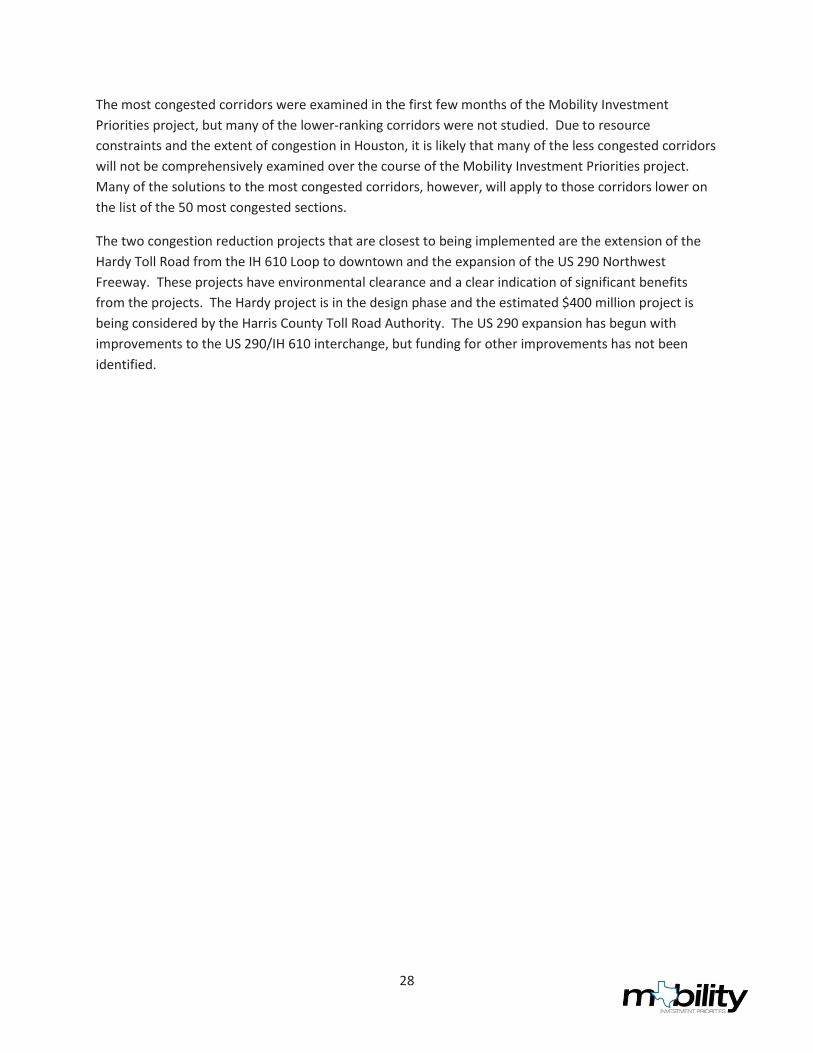
The most congested corridors were examined in the first few months of the Mobility Investment Priorities project, but many of the lower-ranking corridors were not studied. Due to resource constraints and the extent of congestion in Houston, it is likely that many of the less congested corridors will not be comprehensively examined over the course of the Mobility Investment Priorities project. Many of the solutions to the most congested corridors, however, will apply to those corridors lower on the list of the 50 most congested sections.
The two congestion reduction projects that are closest to being implemented are the extension of the Hardy Toll Road from the IH 610 Loop to downtown and the expansion of the US 290 Northwest Freeway. These projects have environmental clearance and a clear indication of significant benefits from the projects. The Hardy project is in the design phase and the estimated $400 million project is being considered by the Harris County Toll Road Authority. The US 290 expansion has begun with improvements to the US 290/IH 610 interchange, but funding for other improvements has not been identified.
29
#1, #
7: S
uppl
emen
t IH
45
EIS;
add
op
erat
ions
& p
aral
lel r
oute
stud
y
#11,
#25
: Pur
chas
e RO
W to
wid
en fr
eew
ay
& in
terc
hang
e
Exhi
bit 1
4: H
oust
on E
arly
Re
com
men
datio
ns—
Febr
uary
201
2
2/8/
2012
All C
onge
sted
Cor
ridor
sAc
tive
traf
fic m
anag
emen
tTr
avel
opt
ions
Mon
itor M
ETRO
’s HO
V to
HO
T co
nver
sion
#1, #
7: M
onito
r Har
dy
Toll
Road
ext
ensio
n
: Stu
dy F
unde
d by
Oth
ers
: Pro
posit
ion
12 F
unds
#x
x: C
onge
sted
Sec
tion
Addr
esse
d by
Pro
ject
#2, #
6, #
7, #
10, #
27, #
31, #
35:
Dow
ntow
n re
desig
n st
udy
30
All Congested Corridors
Downtown Redesign Planning Study
Many of Houston’s most congested sections are on the downtown freeways. Because of their intertwined nature, improving mobility on only one section can adversely affect mobility on a different section. In order to fully understand the problem and identify long-term solutions to the congested segments in the downtown area, a comprehensive planning study that encompasses all freeways within the IH 610 Loop/inner core of Houston is needed.
The initial portion of this study would identify freeway travel patterns. Knowledge about origin-destination patterns helps engineers and planners develop alternatives that can address the needs of both pass-through and local traffic. For example, providing express lanes through downtown could improve mobility by reducing weaving volumes and allowing more efficient use of the available capacity.
The second portion of the study will develop and evaluate alternatives based on the origin-destination patterns. In addition to conventional capacity improvement alternatives, the study would evaluate innovative capacity improvements, active traffic management strategies, and promotion of travel option strategies to improve mobility as an integral component. Public engagement in developing and finalizing the alternatives, implementation of active traffic management, and travel option strategies will be a major component of this phase. The study would also incorporate the recommendations/results of IH 45 North EIS study in developing and analyzing alternatives.
Proposition 12 funds should be used to conduct a study of the downtown freeway traffic and design options.
o Recommended funds: $5,000,000 for the study of travel patterns in the corridor, the development of mobility improvement strategies on the freeways and a significant public engagement effort to maximize the usefulness of the information developed in the IH 45 environmental impact study.
Feasibility Study for Implementing Active Traffic Management Strategies
A study of the possible implementation of active traffic management strategies would identify the appropriate locations along each congested freeway section. Operational treatments such as aggressive incident management, dynamic rerouting, dynamic traveler information, and variable speed limits can play a role in reducing congestion and be implemented quicker and at lower costs than larger capacity- increasing projects. Elements of the study would include:
Cost/benefit of implementing the best practices along each congested corridor. Funding sources for the program. Public engagement strategies to identify which strategies are appropriate and where they can be successful.
Proposition 12 funds should be used to examine the active traffic management strategies that would improve the congested freeway sections.
o Recommended funds: $850,000 for a project planning and feasibility study.
31
Feasibility Study for Implementing Travel Option Strategies
This early action feasibility study would examine the implementation of travel option strategies and the potential benefits and effects on needed highway improvements in the congested corridors. These strategies include but are not limited to flextime, carpooling, and employer sponsored vanpooling, transit, and parking incentives, along the most congested Houston corridors.
Proposition 12 funds should be used to examine the travel option strategies that would improve the congested freeway sections.
o Recommended funds: $500,000 for a feasibility study.
IH 45 North Freeway, Sam Houston Tollway (Beltway 8) to IH 610 (North Loop) and from IH 610N (North Loop) to IH 10 (Katy Freeway) (Statewide Congestion Ranks #1 and #7)
An early action feasibility study to identify mobility improvements along major streets parallel to IH 45 North can make these surface streets more viable alternative routes. The design of these streets and the adjacent developments can be improved. Active traffic management strategies such as variable speed limits, dynamic rerouting using improved surface streets, improved traffic signal systems, and traveler information should also be examined.
Proposition 12 funds should be used to examine mobility improvements including both capacity improvements (wherever possible) and operational treatments on major streets in the IH 45 corridor.
o Recommended funds: $2,000,000 for a feasibility study.
The reversible high occupancy vehicle (HOV) lane from Beltway 8 to IH 610 (North Loop) is not heavily used outside of the peak hours. The operation is being transitioned to a managed high-occupancy toll lane that would offer access to single-occupant vehicles for a toll.
METRO’s dynamic pricing project on the HOV lanes on IH 45 should be monitored.
The Harris County Toll Road Authority (HCTRA) is considering the construction of an extension of the Hardy Toll Road into downtown. There may be a need for additional right-of-way and a role for TxDOT in assisting in implementation.
Decisions related to the extension of Hardy Toll Road from the current terminus at IH 610 to downtown (construction and operations would be conducted by HCTRA) should be monitored and additional action taken if it appears that HCTRA will not construct the extension. This section of freeway is included in the Downtown Redesign Planning Study.
32
US 59 Southwest Freeway, IH 610 (West Loop) to SH 288 (South Freeway) (Statewide Congestion Rank #2)
The reversible HOV lane is not heavily used outside of the peak hours. The operation is being transitioned to a managed high-occupancy toll lane that would offer access to single-occupant vehicles for a toll.
METRO’s dynamic pricing project on the HOV lanes on IH 45 should be monitored. This section of freeway is included in the Downtown Redesign Planning Study.
Four parallel streets offer options to travel on US 59, especially for shorter trips. The design of these streets and the adjacent developments can be improved to make these routes more attractive. The street improvement strategies can be evaluated and acceptable concepts identified through public engagement for additional improvements.
This section of freeway is included in the Downtown Redesign Planning Study. Upon substantial completion of that study, there may be additional study of the major streets in the corridor.
IH 45 Gulf Freeway, IH 10 (Katy Freeway) to IH 610S (South Loop) (Statewide Congestion Rank #6)
The reversible HOV lane is not heavily used outside of the peak hours. The operation is being transitioned to a managed high-occupancy toll lane that would offer access to single-occupant vehicles for a toll.
METRO’s dynamic pricing project on the HOV lanes on IH 45 should be monitored. This section of freeway is included in the Downtown Redesign Planning Study.
Two parallel streets offer options to travel on IH 45 South, especially for shorter trips. The design of these streets and the adjacent developments can be improved to make these routes more attractive.
The street improvement strategies can be evaluated and acceptable concepts identified through public engagement for additional improvements.
This section of freeway is included in the Downtown Redesign Planning Study. Upon substantial completion of that study, there may be additional study of the major streets in the corridor.
US 59 Eastex Freeway, IH 10 (East Freeway) to SH 288 (South Freeway) (Statewide Congestion Rank #10)
This section of Eastex Freeway has a planned widening from 8 to 10 mainlanes and rebuilding the US 59/IH 45 interchange (from IH 45 to SH 288), but there is no funding. Just south of this section, from SH 288 to Spur 527 a widening to six main lanes with auxiliary lanes and four managed lanes is planned but does not have funding.
This section of freeway is included in the Downtown Redesign Planning Study.
33
US 290 Northwest Freeway, FM 529 (Spencer Rd.) to IH 610 (North Loop) (Statewide Congestion Rank #11)
The US 290 Program improvement project includes the reconstruction of US 290 and construction of Hempstead Tollway. The vision of the program includes freeway capacity improvements, addition of managed toll lanes and possible commuter rail along this corridor. Preliminary engineering and the environmental studies have been completed. Final design for certain sections of the corridor has also been completed, but right-of-way has not been purchased.
There are major bottlenecks along the corridor at the interchange of US 290 and Sam Houston Tollway and at the interchange of US 290 and IH 610. (Construction is underway for the reconstruction of IH 610 and US 290). The early action project would provide funding for right-of-way purchase and utility adjustments for planned construction near the interchange of US 290 and Sam Houston Tollway. Construction near the interchange will include additional mainlanes with auxiliary lanes, frontage roads, and grade separations. Construction of frontage roads along Beltway 8 over Union Pacific Railroad and Hempstead Road has been funded by Houston-Galveston Area Council (H-GAC) with Proposition 12 mobility funds.
Proposition 12 funds should be used to purchase right-of-way and relocate utilities near the US 290/Beltway 8 interchange as an early action to allow this project to move forward at a faster pace and address congestion along this segment.
o Recommended funds: $78,000,000 for the purchase of right-of-way and utility adjustment.
34
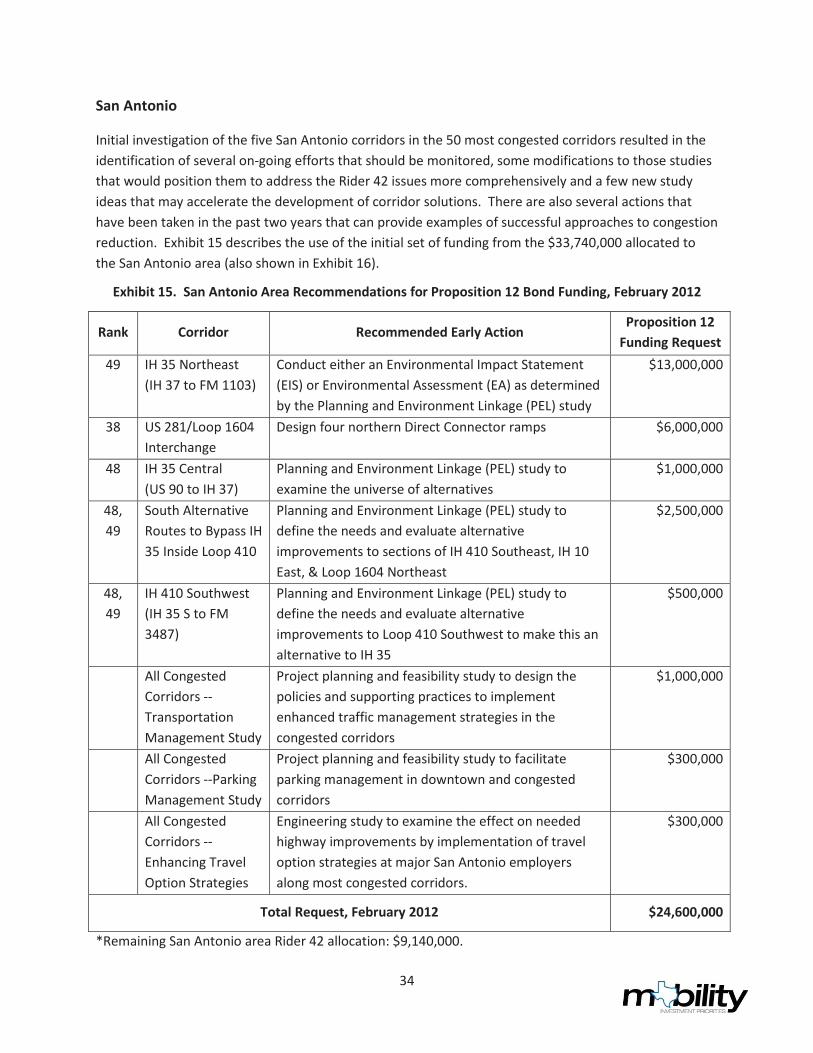
San Antonio
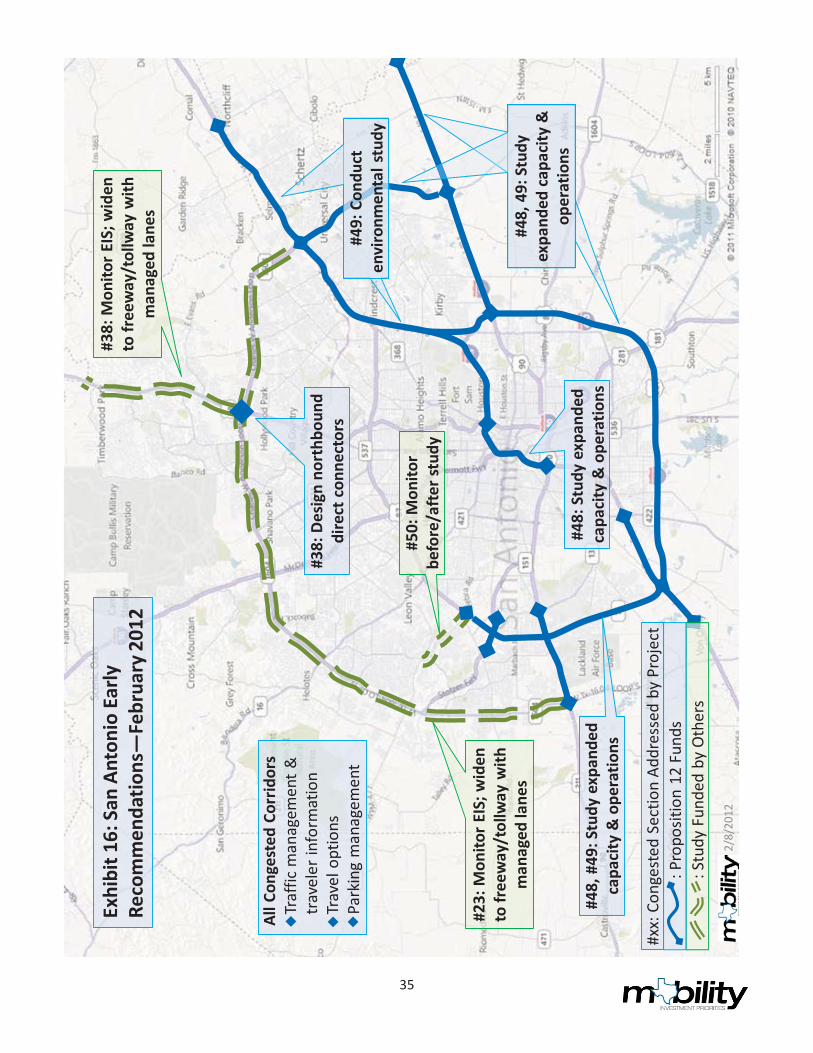
Initial investigation of the five San Antonio corridors in the 50 most congested corridors resulted in the identification of several on-going efforts that should be monitored, some modifications to those studies that would position them to address the Rider 42 issues more comprehensively and a few new study ideas that may accelerate the development of corridor solutions. There are also several actions that have been taken in the past two years that can provide examples of successful approaches to congestion reduction. Exhibit 15 describes the use of the initial set of funding from the $33,740,000 allocated to the San Antonio area (also shown in Exhibit 16).
Exhibit 15. San Antonio Area Recommendations for Proposition 12 Bond Funding, February 2012
Rank Corridor Recommended Early Action Proposition 12
Funding Request 49 IH 35 Northeast
(IH 37 to FM 1103) Conduct either an Environmental Impact Statement (EIS) or Environmental Assessment (EA) as determined by the Planning and Environment Linkage (PEL) study
$13,000,000
38 US 281/Loop 1604 Interchange
Design four northern Direct Connector ramps $6,000,000
48 IH 35 Central (US 90 to IH 37)
Planning and Environment Linkage (PEL) study to examine the universe of alternatives
$1,000,000
48, 49
South Alternative Routes to Bypass IH 35 Inside Loop 410
Planning and Environment Linkage (PEL) study to define the needs and evaluate alternative improvements to sections of IH 410 Southeast, IH 10 East, & Loop 1604 Northeast
$2,500,000
48, 49
IH 410 Southwest (IH 35 S to FM 3487)
Planning and Environment Linkage (PEL) study to define the needs and evaluate alternative improvements to Loop 410 Southwest to make this an alternative to IH 35
$500,000
All Congested Corridors -- Transportation Management Study
Project planning and feasibility study to design the policies and supporting practices to implement enhanced traffic management strategies in the congested corridors
$1,000,000
All Congested Corridors --Parking Management Study
Project planning and feasibility study to facilitate parking management in downtown and congested corridors
$300,000
All Congested Corridors --Enhancing Travel Option Strategies
Engineering study to examine the effect on needed highway improvements by implementation of travel option strategies at major San Antonio employers along most congested corridors.
$300,000
Total Request, February 2012 $24,600,000
*Remaining San Antonio area Rider 42 allocation: $9,140,000.
35
#38:
Mon
itor E
IS; w
iden
to
free
way
/tol
lway
with
m
anag
ed la
nes
#23:
Mon
itor E
IS; w
iden
to
free
way
/tol
lway
with
m
anag
ed la
nes
Exhi
bit 1
6: S
an A
nton
io E
arly
Re
com
men
datio
ns—
Febr
uary
201
2
2/8/
2012
#38:
Des
ign
nort
hbou
nd
dire
ct c
onne
ctor
s
#48:
Stu
dy e
xpan
ded
capa
city
& o
pera
tions
All C
onge
sted
Cor
ridor
sTr
affic
man
agem
ent &
tr
avel
er in
form
atio
nTr
avel
opt
ions
Park
ing
man
agem
ent
#50:
Mon
itor
befo
re/a
fter
stud
y
#48,
49:
Stu
dy
expa
nded
cap
acity
&
oper
atio
ns
: Stu
dy F
unde
d by
Oth
ers
: Pro
posit
ion
12 F
unds
#x
x: C
onge
sted
Sec
tion
Addr
esse
d by
Pro
ject
#49:
Con
duct
en
viro
nmen
tal s
tudy
#48,
#49
: Stu
dy e
xpan
ded
capa
city
& o
pera
tions
36
All Congested Corridors
Corridor Parking Management Study
A parking management study should be conducted for public and publicly accessible parking facilities within Downtown San Antonio and for major employers in highly congested travel corridors, including IH 35 (US 90 West to Fort Sam Houston), IH 10 (IH 35 to IH 37), and IH 37 (IH 10 to IH 35). The study will focus on the effect of parking policies on the need for highway improvements and also include factors such as: parking pricing and regulation; park & ride programs; methods to maximize the use, effectiveness and management of current parking facilities; parking facility urban design; special event parking management, and parking collection systems.
Proposition 12 bond funds should be used for a project planning and feasibility study to identify the role of parking management on reducing the need for road improvements in the congested corridors.
o Requested Funding: $300,000 is requested to fund the planning and feasibility study.
Enhancing Travel Option Strategies among Regional Employers
The effect of travel option strategies such as telecommuting, flextime, and compressed work weeks on the amount of highway improvements required in the congested corridors should be examined. Partnering with major employers in the most congested San Antonio area roadways is one component of a congestion mitigation plan. Surveys of major employers conducted in 2001 and 2004 by the Alamo Area Council of Governments (AACOG) showed relatively low usage of these strategies by major area employers, but the surveys provided no information that would assist AACOG’s outreach staff to understand how, and particularly with whom at these organizations, they could work to initiate or expand travel options. When the groundwork done by a consultant has been completed, AACOG’s Commute Solutions program would be in a strong position to maintain and further expand its employer program.
Proposition 12 bond funds should be used for a two-year project planning and feasibility study to determine the current status of travel option strategies in the San Antonio area and to identify the possible travel option champions at major San Antonio employers (those with substantial travel on the most congested roadways), to assist in initial outreach efforts and to determine the effect of the recommended strategies on the highway improvement needs.
o Requested Funding: $300,000 is requested to fund a planning and feasibility study to conduct a survey, interview key stakeholders, develop and utilize informational materials, and identify the costs and benefits to employers, the workforce and the transportation network.
Transportation Management System Upgrade Feasibility Study
Much of San Antonio TransGuide Intelligent Transportation System (ITS) is outdated or in a severe state of disrepair. TxDOT’s ability to monitor travel conditions and to actively manage congested freeway corridors and traffic crash scenes is severely hampered by a decaying and outdated traffic detection and
37
surveillance technologies; incomplete or malfunctioning communications infrastructure; and insufficient maintenance resources.
The purpose of this study would be to conduct an engineering study to determine what types of improvements are needed to bring the ITS and traffic management strategies that have been deployed in the San Antonio area to the current design specifications and requirements, the costs, resources, and institutional arrangements. Working with the local incident management and transportation agencies, the engineering study should:
Improve traffic management practices among the San Antonio area’s transportation agencies, law enforcement and emergency responders, towing contractors, and other stakeholders. Improve agency interaction, coordination, and communication for severely congested roads, incidents and special events. Improve agency practices and communication to facilitate rapid response and clearance for congestion-causing events. Identify and assess viable alternate routes for diverting traffic when incidents occur in different sections of each freeway facility. Public engagement in developing and finalizing the alternatives, implementation of active traffic management, and travel option strategies should be a major component of this study.
Proposition 12 bond funds should be used for a project planning and feasibility study to facilitate traffic management in the congested corridors.
o Requested Funding: $1,000,000 is requested to fund the planning and feasibility study.
IH 35 Northeast, US 281/IH 37 to FM 1103 (Statewide Congestion Rank #49)
A Planning and Environment Linkage (PEL) study is being managed by TxDOT and Alamo RMA and is scheduled to be completed in July 2012. The outcome of the study is anticipated to be a refined list of alternatives that would address the long-term needs of the IH 35 Northeast corridor; those alternatives would describe the scope of a following National Environmental Policy Act (NEPA) study. This NEPA study would incorporate a study of the origin-destination travel patterns within the IH 35 corridor to determine alternative travel routes.
Proposition 12 bond funds should be used in this corridor for either an Environmental Impact Statement (EIS) or Environmental Assessment (EA) as determined by the Planning and Environment Linkage (PEL) study. A proactive public engagement plan should be a major component of this effort.
o Requested Funding: $13,000,000 is requested to fund the most extensive analysis that might be required by the findings of the PEL study.
IH 35 Central, US 90 to US 281/IH 37 (Statewide Congestion Rank #48)
A Planning and Environment Linkage (PEL) study should examine the needs and associated conceptual alternatives by researching and integrating previous studies performed in the IH 35 Central corridor and determine their relationship to the current conditions. Alternatives would be evaluated against the
38
prevailing environmental constraints as well as the alternative measures of effectiveness and project cost. An extensive public engagement process would be used throughout the duration.
Proposition 12 bond funds should be used in this corridor for a Planning and Environment Linkage (PEL) study to examine the universe of alternatives including adding capacity, travel demand management strategies, support of multimodal options/priority, etc. Due to the elevated section already being in place along with many obvious constraints downtown, considerable innovation will be required to accomplish significant mobility improvements in this section. A proactive public engagement plan should be a major component of this effort to identify publicly acceptable solutions.
o Requested Funding: $1,000,000 is requested to fund the PEL study.
Southern Alternative Routes to Bypass IH 35 Inside Loop 410 (Statewide Congestion Ranks #48 & 49)
The following three studied sections together serve as an alternate route for motorists wishing to bypass the congested areas on IH 35 inside Loop 410. The routes are also important as alternative routes for trucks; the City of San Antonio is currently exploring analysis options for restricting through truck traffic from IH 35 near downtown. Alternatives would be evaluated against the prevailing environmental constraints as well as the alternative measures of effectiveness and project cost. An extensive public engagement process would be used throughout the duration of the study. The three study sections are:
IH 410 Southeast: IH 35 Southwest to IH 10 East IH 10 East: IH 410 to Bexar/Guadalupe County Line. Loop 1604 Northeast: From IH 10 East to IH 35 Northeast.
Proposition 12 bond funds should be used for a PEL study to define the needs and evaluate alternative improvements to the sections of IH 410 Southeast, IH 10 East, and Loop 1604 Northeast in order to make this route a more attractive alternate to IH 35 and improve overall network mobility. One aspect of developing the corridors as the IH 35 alternative route is to support through truck traffic currently using IH 35 through downtown San Antonio.
o Requested Funding: $2,500,000 is requested to fund the PEL study.
IH 410 Southwest: IH 35 South to FM 3487 (Culebra Road) (Statewide Congestion Ranks #48 & 49)
This section of IH 410 can serve as another alternate route for motorists wishing to bypass the congested downtown areas on IH 35 inside Loop 410 by routing around the southwest and north side of San Antonio and connecting to the recently improved IH 410 on the north side of San Antonio to IH 35 North or IH 10 West. Alternatives in a PEL study would be evaluated against the prevailing environmental constraints as well as the alternative measures of effectiveness and project cost. An extensive public engagement process would be used throughout the duration of the study.
Proposition 12 bond funds should be used for a PEL study to define the needs and evaluate alternative improvements to Loop 410 Southwest in order to make this route a more attractive alternate to IH 35 and improve overall network mobility. Some previous work has been
39
completed for this corridor in regard to alternatives analysis, schematic design, and environmental analysis; it is expected that the work effort required would be less than some of the other PEL’s suggested for the San Antonio area. These past study efforts will serve as research and background material for the PEL conducted in the Loop 410 Southwest corridor.
o Requested Funding: $500,000 is requested to fund the PEL study.
US 281/Loop 1604 Interchange (Statewide Congestion Ranks #38)
The construction of four northern direct connectors in conjunction with adding capacity on US 281 is expected to improve mobility along this corridor. This improvement will complement the four southern direct connectors being constructed at this interchange by the Alamo Regional Mobility Authority (RMA). Construction funding is available from a combination of sources and environmental clearance has been obtained, but the design work has not been completed.
Proposition 12 bond funds should be used to complete the detailed design of the northern connectors and the completion of the interchange.
o Requested Funding: $6,000,000 is requested to fund the required design work. The cost estimate is based on 10 percent of the estimated construction cost of $60 million for the four northern director connectors.
SL 1604, SH 16 (Bandera Rd.) to FM 471 (Culebra Rd.) (Statewide Congestion Rank #23)
Superstreet operation was implemented in 2011. The project should be monitored and signal timing adjusted in the SL 1604 corridor to ensure the best possible operation of the existing road.
The signal timing along SL 1604 should be monitored, and the need for additional improvements evaluated.
US 281, Comal County Line to SL 1604 (Anderson Loop) (Statewide Congestion Rank #38)
Superstreet operation was implemented in 2010 on the southern part of this congested corridor. The project should be monitored and signal timing adjusted in the US 281 corridor to ensure the best possible operation of the existing road.
The signal timing along US 281 should be monitored, and the need for additional improvements evaluated.
Culebra Rd. FM 3487, SH 741 (Grissom Rd.) to IH 410 (Statewide Congestion Rank #50)
Culebra Road was widened and operations were improved in 2010 and 2011.
The before-and-after comparison study by the City of San Antonio should be monitored and next steps determined on the remaining congestion on Culebra Road.

40
43
REFERENCES
1. 2011 Urban Mobility Report. Prepared by Texas Transportation Institute For University Transportation Center for Mobility, College Station, Texas. 2011. Available: http://mobility.tamu.edu/corridors/report/
2. It’s About Time: Investing in Transportation to Keep Texas Economically Competitive. Texas 2030 Committee. 2011. Available: http://texas2030committee.tamu.edu/reports/2011/
3. 2008-2012 Initiatives for Funding Transportation Infrastructure Improvements. Prepared by Texas Transportation Institute for the 2030 Needs Committee, College Station, Texas. 2012. http://tti.tamu.edu/group/stsc/
4. Age, Sex, and Race/Ethnicity Population Projections by Migration Scenario for Texas Counties and Regions. Texas State Data Center, San Antonio, Texas. 2008. http://idserportal.utsa.edu/sdc/projections/default.aspx
5. 100 Most Congested Roadway Segments in Texas, 2010. Texas Department of Transportation. http://apps.dot.state.tx.us/apps/top_100/
6. How Are Transportation Projects Funded? North Central Texas Council of Governments. 2010. http://www.nctcog.org/trans/tip/howfunded.asp
7. The Transportation Planning Process: Key Issues. A Briefing Book for Transportation Decisionmakers, Officials, and Staff. Prepared by the Transportation Planning Capacity Building Program, Federal Highway Administration and Federal Transit Administration. Updated September 2007. Publication No. FHWA-HEP-07-039
8. Public Involvement Techniques for Transportation Decision-Making. Prepared by FHWA and FTA, 1996, Publication No. FHWA-PD-96-031
9. Planning and Environmental Linkages. Federal Highway Administration (FHWA). 2011. http://environment.fhwa.dot.gov/integ/index.asp
10. NEPA and Project Development. Federal Highway Administration (FHWA). 2011. http://environment.fhwa.dot.gov/projdev/index.asp