Embed Size (px)
Citation preview

Mobility in the City
46
Public transport
Berlin possesses an outstanding local public transportation network. The network of regional trains, S-Bahn (city train), U-Bahn (subway), trams and buses has a total length of around 1,900 km – roughly equiv-alent to the distance between Berlin and Moscow. Passengers can get on or off at over 3,100 stations and stops. Many U-Bahn and S-Bahn stations – as well as those for regional and mainline trains – have been equipped for disabled access in recent years, with elevators, ramps, escalators and facilities for the sight-impaired. This process is still not

Berlin traffic data | Public transport
47
completed. Each year, 937 million passengers use the U-Bahn, buses and trams operated by Berliner Verkehrsbetriebe (BVG) and 395 million the S-Bahn. Berlin is also very well connected nationally and internationally through rail and air traffic. Infrastructure projects of major importance have been or are in the process of being accomplished, with the opening of the Berlin Hauptbahnhof, the city’s new central station, and construc-tion of the major new Berlin-Brandenburg Airport (BER).
Further information on public transport in Berlin can be obtained on public transport in general at www.stadtentwicklung.berlin.de/ verkehr/politik_planung/oepnv on transport services in Berlin at www.bvg.de on the S-Bahn at www.s-bahn-berlin.de on Verkehrsverbund Berlin-Brandenburg at www.vbbonline.de on DB Bahn at www.bahn.de

48
Mobility in the City
Transport network Completion or reconstruction since 1990
U-Bahn U-Bahn
S-Bahn S-Bahn
Tram Tram
DB Bahn DB Bahn (realization of the so-called „Mushroom Concept”)
Development of the public transport network since 1990
Source: Senate Department for Urban Development and the Environment of the State of Berlin Content processing: LK Argus GmbH

Berlin traffic data | Public transport
49
Public transport network1) and stations
1) Trafficable network2) Line kilometres3) Length of routes in operation4) Estimated data, fluctuations in network length due to line changes resulting from building works
Source: Senate Department for Urban Development and the Environment of the State of Berlin; BVG Berliner Verkehrsbetriebe AG; S-Bahn Berlin GmbH; VBB Verkehrsverbund Berlin-Brandenburg GmbH
1992 1994 1996 1998 2000 2002 2004 2006 2008 2010 2012
Regional railway network (in km) 100.0 120.9 123.5 148.2 153.1 4) 156.0 4) 152.0 4) 211.3 213.2 213.2 204.6
Regional stations 9 10 13 13 15 16 15 19 21 21 21
S-Bahn network (in km) 200.4 209.5 222.3 249.0 251.8 255.3 256.5 257.0 257.0 256.2 256.2
S-Bahn stations 97 115 117 128 130 131 131 131 132 132 132
U-Bahn network (in km)2) 134.5 137.9 142.9 143.3 144.2 144.2 144.2 144.2 144.9 146.3 146.3
U-Bahn stations 160 162 167 169 170 170 170 170 170 173 173
Tram network (in km)3) 178.3 176.8 179.8 181.6 187.7 187.7 187.7 189.4 189.7 189.7 191.2
Bus lanes per direction (in km) 67.1 67.1 93.3 94.4 99.8 101.5 101.9 101.7 101.4 101.4 101.1
Source: Senate Department for Urban Development and the Environment of the State of Berlin; BVG Berliner Verkehrsbetriebe AG; S-Bahn Berlin GmbH; VBB Verkehrsverbund Berlin-Brandenburg GmbH
Regional railway network
S-Bahn network
U-Bahn network
Tram network
Bus lanes
19941998
20022006
20102012
19921996
20002004
2008
Length of routes in operation in kilometres
50
100
150
200
250
300
19941998
20022006
20102012
19921996
20002004
20081994
19982002
20062010
20121992
19962000
20042008
19941998
20022006
20102012
19921996
20002004
20081994
19982002
20062010
20121992
19962000
20042008
Public transport network

50
Mobility in the City
U-Bahn
S-Bahn
Regional railway
Tram
Golm
KarowNauen
Teltow
Elstal
Seddin
Priort
Kablow
Erkner
Staaken Spandau
Wannsee
RüdnitzBasdorf
Südkreuz
Rehfelde
Saarmund
Schwante
Vehlefanz
Bärenklau
Zühlsdorf
Rangsdorf
Dahlewitz
Herrensee
Rehbrücke
Falkensee
Zernsdorf
Marquardt
Großbeeren
Ostbahnhof
Karlshorst
Strausberg
Michendorf
Wustermark
Finkenkrug
Brieselang
Werneuchen
Schönwalde
Birkengrund
Schöneweide
Ahrensfelde
Hennigsdorf
Niederlehme
Hangelsberg
Pirschheide
Potsdam Hbf
Hauptbahnhof
Birkenwerder
Albrechtshof
Ludwigsfelde
Fangschleuse
Schönerlinde
Griebnitzsee
Jungfernheide
Gesundbrunnen
Caputh-Geltow
Wilhelmshorst
Velten (Mark)
Charlottenhof
Alexanderplatz
Charlottenburg
Werder (Havel)
Seefeld (Mark)
Ferch-Lienewitz
Lichterfelde Ost
Hohenschönhausen
Dallgow Döberitz
Ahrensfelde Nord
Ludwigsfelde-Struveshof
Caputh Schwielowsee
Zoologischer Garten
Königs Wusterhausen
Blumberg (bei Berlin)
Bernau (bei Berlin)Hohen Neuendorf West
Ahrensfelde Friedhof
Medienstadt Babelsberg
Blankenfelde (Kreis Zossen)
Flughafen Berlin-Schönefeld
Friedersdorf (bei Kgs Wusterh)
Kremmen Oranienburg Wensickendorf
Wandlitz
Wandlitzsee
Seegefeld
Zeesen
Park Sanssouci
Lichtenberg
Public rail passenger transport network (2013)
Source: Senate Department for Urban Development and the Environment of the State of Berlin; route network plan Berlin Content processing: LK Argus GmbH

Berlin traffic data | Public transport
51
Barrier-free access to S via ramp Barrier-free access to S + U via ramp U-Bahn
Barrier-free access to S via lift Barrier-free access to S + U via lift S-Bahn
Barrier-free access to U via ramp Regional railway
Barrier-free access to U via lift
Barrier-free stations in the S- and U-Bahn network (2013)
Source: Senate Department for Urban Development and the Environment of the State of Berlin; route network plan Berlin Content processing: LK Argus GmbH

52
Mobility in the City
Barrier-free stations
Source: Senate Department for Urban Development and the Environment of the State of Berlin; route network plan Berlin Content processing: LK Argus GmbH
Barrier-free access to S via ramp Barrier-free access to S + U via ramp U-Bahn
Barrier-free access to S via lift Barrier-free access to S + U via lift S-Bahn
Barrier-free access to U via ramp Regional railway
Barrier-free access to U via lift
Barrier-free stations in the S- and U-Bahn network in the city centre (2013)
U-Bahn stations S-Bahn stations Main line stations Regional stations
2008 2010 2012 2008 2010 2012 2008 2010 2012 2008 2010 2012
Stations, total 170 173 173 132 132 132 7 7 7 1) 14 21
with lifts 64 80 89 90 97 103 6 6 6 1) 11 14
with ramps 9 9 9 15 15 14 2 2 2 1) 1 3
with escalators 92 94 94 35 36 38 6 6 6 1) 6 10
with facilities for the blind 93 106 110 75 100 114 5 5 5 1) 9 10
with information and SOS telephones 170 173 173 89 89 89 4 4 4 1) 4 4
1) No survey was made in 2008.
Source: Senate Department for Urban Development and the Environment of the State of Berlin; BVG Berliner Verkehrsbetriebe AG; S-Bahn Berlin GmbH; DB Station & Service AG

Berlin traffic data | Public transport
53
Public transport passenger volume
Public transport passenger volume1)
1995 1997 1999 2001 2003 2005 2007 2009 2011 2012 6)
Annual passenger volume, total (in millions) 1,146 1,085 1,107 1,137 1,253 1,307 1,324 1.351 1,375 1,386
Passengers BVG (U-Bahn, bus & tram) (in millions) 872 789 787 798 890 3) 907 904 925 937 937
Passengers S-Bahn (in millions) 245 264 280 296 315 357 371 371 5) 383 395
Passengers in regional transport (in millions) 29 32 40 43 48 43 4) 49 55 55 54
Local network passengers, total (in millions)2) 1,038 1,136 1,185 1,227 1,237 1,260 1,281 1,291
1) Passenger volume S-Bahn and regional transport including Brandenburg2) Local public transportation network passengers outside the city, and S-Bahn passengers of all transportation providers in Verkehrsbund Berlin-Brandenburg (VBB)3) From 2003 new survey and projection4) From 2005 new survey and projection5) Stagnation in passenger volume as a result of the S-Bahn crisis6) Figures for regional transportation and totals still provisional (later revision possible)
Source: BVG Berliner Verkehrsbetriebe AG; S-Bahn Berlin GmbH; VBB Verkehrsverbund Berlin-Brandenburg GmbH
1995 1997
19992001
20032005
20072009
2011
2012
Passengers in millions
200
400
600
800
1,000
1,200
1,400
1,600
BVG
S-Bahn
Regional transport
Source: BVG Berliner Verkehrsbetriebe AG; S-Bahn Berlin GmbH; VBB Verkehrsverbund Berlin-Brandenburg GmbH

54
Mobility in the City
1) Based on traffic survey from 2007
Source: VMZ Berlin Betreibergesellschaft mbH; Senate Department for Urban Development and the Environment of the State of Berlin; Center Nahverkehr Berlin (CNB) Content processing: LK Argus GmbH
Average number of working-day passengers in the public transport network by transport mode1)
Number of U-Bahn passengers Number of S-Bahn passengers Number of tram passengers Number of bus passengers per average working day per average working day per average working day per average working day
10,000 10,000 10,000 10,000
20,000 20,000 20,000 20,000
40,000 40,000 40,000 40,000
80,000 80,000 80,000 80,000

Berlin traffic data | Public transport
55
Public transport vehicle stock
1998 2000 2002 2004 2006 2008 2010 2012
S-Bahn stock of two-carriage trains (“quarter-trains”) 777 733 766 759 690 632 650 650
U-Bahn train carriages, total 1448 1379 1391 1372 1274 1268 1243 1242
Wide profile 890 866 868 854 772 766 767 766
Small profile 558 513 523 518 502 502 476 476
Tram carriages, total 557 572 599 602 574 540 391 6) 378 6)
Tatra multiple units 388 388 388 387 366 333 237 6) 189 6)
Carriages 64 64 64 64 57 56 0 6) 0 6)
Low-floor articulated multiple units 105 120 147 150 150 150 150 150
Special vehicles 1 1
Flexity 1 4 39
Omnibuses, total 1485 1369 1554 1388 1310 1298 1323 1316
Double-decker 646 464 381 387 388 360 413 415
Single-decker 487 495 644 466 517 387 400 416
Articulated buses 257 300 402 426 311 477 443 468
Special vehicles and bus pool 95 110 127 109 94 74 67 17 7)
Lines in the public transport daytime network (2012)1)
Public transport performance
Number
Regional railway lines 18
S-Bahn lines 15
U-Bahn lines 10
Tram lines, total 22
MetroTram lines 9
Omnibus lines, total 149
MetroBus lines 17
Express bus lines 13
2004 2006 2008 2010 2011 2012
Kilometres travelled (in millions)2)3)
U-Bahn 20,4 20,3 19,4 5) 20,6 20,9 21,1
Tram 21,0 20,1 18,3 5) 19,1 19,2 19,3
Omnibus 91,0 89,3 83,5 5) 87,2 87,8 88,2
Train kilometres (in millions)4)
S-Bahn (excluding Brandenburg) 29,0 29,0 29,0 29,0 29,0 29,0
1) As at: 31.12.2012; Public transport daytime network operates from about 4.30 a.m. to about 1 a.m.
Source: BVG Berliner Verkehrsbetriebe AG; S-Bahn Berlin GmbH
2) Only passenger transportation journeys as defined by transportation contracts3) U-Bahn and tram transport kilometres, omnibus transport kilometres4) Planned annual transport performance5) Influenced by the BVG strike
Source: Senate Department for Urban Development and the Environment of the State of Berlin; BVG Berliner Verkehrsbetriebe AG; S-Bahn Berlin GmbH
6) Only passenger transportation journeys as defined by transportation contracts7) Excluding bus pool
Source: BVG Berliner Verkehrsbetriebe AG; S-Bahn Berlin GmbH

56
Mobility in the City
Cyclists using S-Bahn on workdays1) (2012)
Number of S-Bahn passengers with bicycles per workday1
500
1,000
2,000
1) Monday to Thursday
Source: Center Nahverkehr Berlin (CNB); S-Bahn Berlin GmbH Content processing: LK Argus GmbH
S-Bahn passengers with bicycles as a proportion of total S-Bahn passengers
Below 2%
2% to 4%
4% and above

Berlin traffic data | Public transport
57
Cyclists using S-Bahn on Sundays and public holidays (2012)
Source: Center Nahverkehr Berlin (CNB); S-Bahn Berlin GmbH Content processing: LK Argus GmbH
Number of S-Bahn passengers with bicycles per Sunday or public holiday
500
1.000
2.000
Number of S-Bahn passengers with proportion of total S-Bahn passengers
Below 2%
2% to 4%
4% to 6%
6% and above
58
Mobility in the City
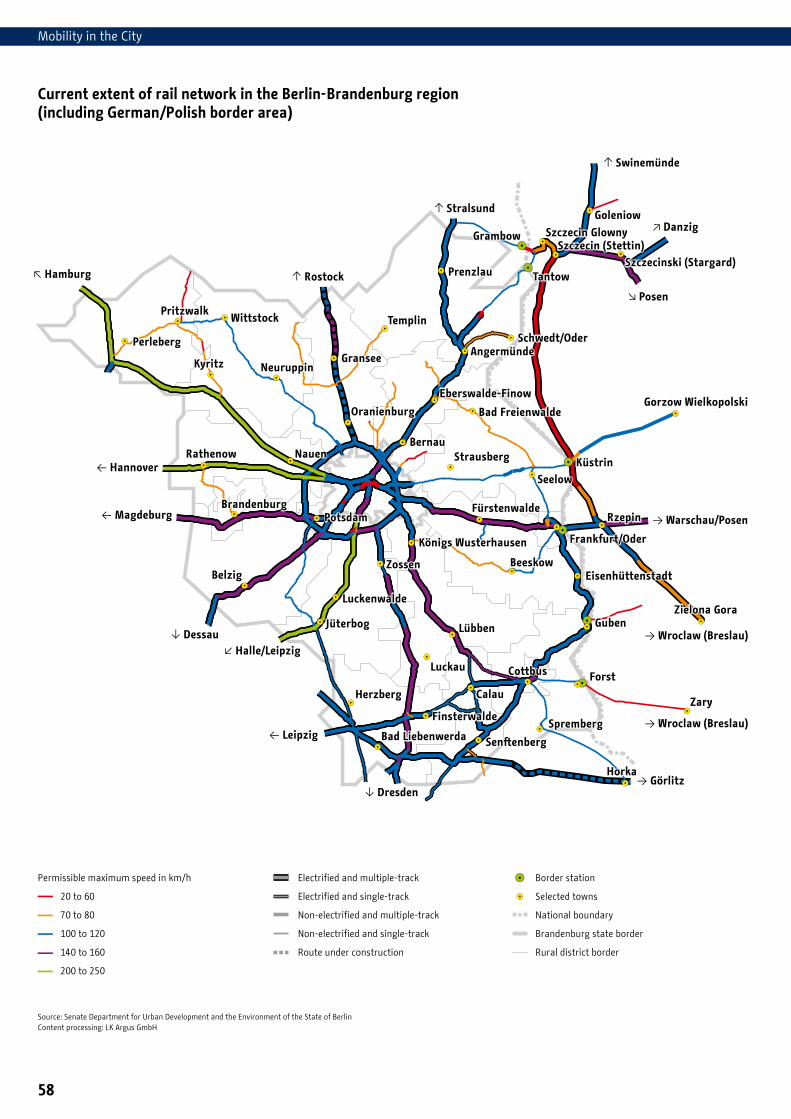
Current extent of rail network in the Berlin-Brandenburg region (including German/Polish border area)
Source: Senate Department for Urban Development and the Environment of the State of Berlin Content processing: LK Argus GmbH
Zary
Rzepin
Goleniow
Zielona Gora
Szczecin GlownySzczecin (Stettin)
Gorzow Wielkopolski
Szczecinski (Stargard)
Küstrin
Grambow
Tantow
Horka
Nauen
ForstCalau
Guben
Kyritz
Belzig
Luckau
Bernau
Zossen
Seelow
Lübben
Templin
Gransee
Beeskow
Potsdam
Cottbus
Rathenow
Herzberg
Jüterbog
Prenzlau
Neuruppin
WittstockPritzwalk
Perleberg
Spremberg
Angermünde
Strausberg
Brandenburg
Oranienburg
Luckenwalde
Senftenberg
Finsterwalde
Schwedt/Oder
Fürstenwalde
Frankfurt/Oder
Bad Liebenwerda
Bad FreienwaldeEberswalde-Finow
Eisenhüttenstadt
Königs Wusterhausen
m Swinemünde
m Stralsund
m Rostock
o Danzig
p Posen
q Warschau/Posen
q Wroclaw (Breslau)
q Wroclaw (Breslau)
q Görlitzn Dresden
j Leipzig
k Halle/Leipzign Dessau
j Magdeburg
j Hannover
l Hamburg
Permissible maximum speed in km/h Electrified and multiple-track Border station
20 to 60 Electrified and single-track Selected towns
70 to 80 Non-electrified and multiple-track National boundary
100 to 120 Non-electrified and single-track Brandenburg state border
140 to 160 Route under construction Rural district border
200 to 250

Berlin traffic data | Public transport
59
Zary
Rzepin
Goleniow
Zielona Gora
Szczecin GlownySzczecin (Stettin)
Gorzow Wielkopolski
Szczecinski (Stargard)
Küstrin
Grambow
Tantow
Horka
Nauen
ForstCalau
Guben
Kyritz
Belzig
Luckau
Bernau
Zossen
Seelow
Lübben
Templin
Gransee
Beeskow
Potsdam
Cottbus
Rathenow
Herzberg
Jüterbog
Prenzlau
Neuruppin
WittstockPritzwalk
Perleberg
Spremberg
Angermünde
Strausberg
Brandenburg
Oranienburg
Luckenwalde
Senftenberg
Finsterwalde
Schwedt/Oder
Fürstenwalde
Frankfurt/Oder
Bad Liebenwerda
Bad FreienwaldeEberswalde-Finow
Eisenhüttenstadt
Königs Wusterhausen
m Swinemünde
m Stralsund
m Rostock
o Danzig
p Posen
q Warschau/Posen
q Wroclaw (Breslau)
q Wroclaw (Breslau)
q Görlitzn Dresden
j Leipzig
k Halle/Leipzign Dessau
j Magdeburg
j Hannover
l Hamburg
Journey time in rail transport
Source: DB Bahn timetables
Distancein km
100 200 300 400 500 600 700 800
2:00 4:00 6:00 8:00 10:00 12:00 14:00 16:00Journey timein hours
Brussels
Vienna
Stuttgart
Munich
Amsterdam
Mannheim
Krakau
Cologne
Warsaw
Frankfurt/Main
Düsseldorf
Nuremberg
Gdańsk
Copenhagen
Malmö
Prague
Bremen
Wroclow
Hamburg
Hanover
Poznań
Dresden
Leipzig
Stettin20132010200719961990

60
Mobility in the City
Passenger volume in air transport Flight movements
1994 1996 1998 2000 2002 2004 2006 2008 2010 2012
Passengers, total (in millions) 10.3 11.0 11.8 13.3 12.2 14.9 18.5 21.4 22.3 25.3
Tegel 7.3 8.4 8.9 10.3 9.9 11.0 11.8 14.5 15.0 18.2
Tempelhof 1.0 0.7 0.9 0.8 0.6 0.4 0.6 0.3 1) 1)
Schönefeld 1.9 1.9 2.0 2.2 1.7 3.4 6.1 6.6 7.3 7.1
Flight movements, total (in 1,000) 213.8 219.9 219.9 232.2 212.9 222.9 250.5 267.4 235.2 242.9
Tegel 96.3 121.7 120.1 134.3 127.5 137.9 140.6 161.2 158.6 171.1
Tempelhof 63.4 49.1 55.0 49.8 48.0 36.4 42.2 37.4 1) 1)
Schönefeld 54.2 49.1 44.8 48.0 37.4 48.6 69.7 68.8 76.6 71.8
Passenger volume and flight movements
19941996
1998 2000
20022004
20062008
2010 1)
2012 1)
Flight movements (in 1,000)Passengers (in millions)
5
10
15
20
25
50
150
100
200
250
300
19941996
1998 2000
20022004
20062008
2010 1)
2012 1)
1) Closure of Tempelhof Airport on 31.10.2008 Source: Flughafen Berlin Brandenburg GmbH, traffic statistics
Schönefeld
Tempelhof
Tegel
Schönefeld
Tempelhof
Tegel
1) Closure of Tempelhof Airport on 31.10.2008 Source: Flughafen Berlin Brandenburg GmbH, traffic statistics
1) Closure of Tempelhof Airport on 31.10.2008 Source: Flughafen Berlin Brandenburg GmbH, traffic statistics

Berlin traffic data | Public transport
61