Embed Size (px)
Citation preview
MOBILE MARKETING AND USER RETENTION
BEST PRACTICES FOR SOCIAL MOBILE APPLICATIONS
RESEARCH REPORT
Author: Vit Sochor
Student number: 61805
Education: International Business and Management Studies
Study year/semester: Semester 2, 2014-2015
School: HZ University of Applied Sciences
Supervisor: F.J.M. Peeters
Place and date: Vlissingen, May 25, 2015
i
PREFACE This thesis is submitted as a graduation thesis for a Bachelor's Degree in Business
Administration at HZ University of Applied Sciences. It is a final thesis for a study program
International Business & Management Studies. The thesis supervisor was F.J.M. Peeters, a
lecturer at HZ University of Applied Sciences, and the in-company supervisor was Martyn
Simpson, director of the Bright Side of Life Computer Consultancy.
This research was done as a part of a graduation internship conducted at Bright Side of Life
Computer Consultancy (BSL), a Dutch company located in Breukelen, the Netherlands. The
research about Mobile Marketing and User Retention was a part of a whole graduation project,
together with working for the company as an online marketing intern. Bright Side of Life
Computer Consultancy develops software, web, and mobile applications.
As an online marketing intern at BSL Computer Consultancy, I was in charge of the marketing of
its mobile applications, mainly a new social mobile application called DilemmaMatch. This
research concerns Mobile Marketing and User Retention strategies and marketing efforts in
general, but is focused on social mobile applications and specifically the DilemmaMatch.
I would like to thank my thesis supervisor, F.J.M. Peeters for the guidance, directions and
support during the writing process of the thesis.
ii
SUMMARY The research report concerns the research on mobile marketing and user retention.
Smartphones with mobile internet access and mobile applications have become parts of our
daily lives. However, there are over a million of mobile applications in both leading app stores
and therefore it is very difficult to make an application visible. Bright Side of Life Computer
Consultancy developed a social mobile application DilemmaMatch, which has to compete with
more than 30,000 other applications in the same category in both app stores. Competing means
not only in downloads but also in user retention and engagement. This research is done for the
company BSL Computer Consultancy and researches what are the best ways to market a new
social mobile application targeting young adults. DilemmaMatch is a free social mobile
application, which based on elaborated algorithms and users’ interest settings and dilemma
answers finds people with similar opinions. The basic application is available for free from the
leading app stores, but there is also a paid premium version with additional features. Mobile
marketing allows the opportunity to reach customers search with other interactive sources.
Mobile marketing is a section of digital marketing and Mobile Marketing Association defines
mobile marketing as a set of practices that enables organizations to communicate and engage
with their audience in an interactive and relevant manner through and with any mobile device or
network. User retention is also one of the main objectives. The research directly implicate the
answer to the question “How can The Bright Side of Life attract 10.000 active DilemmaMatch
users before the end of 2015?”.
The research shows that social media, mainly Facebook and Instagram are heavily used among
the target audience as well as the fact that iOS users install more mobile applications than
Android users. The research found that users don’t install and delete apps very often and have
preference for free mobile apps.
The research suggests DilemmaMatch to utilize the full power of social networks Facebook and
Instagram, and initiate more sophisticated ASO (app store optimization) in order to get new
users. The content of the app should be renewed more frequently and communication or chat
function should be added to DilemmaMatch in order to retain existing users.
TABLE OF CONTENTS Preface .......................................................................................................................................................................................... i
Summary .................................................................................................................................................................................... ii
1. Introduction ........................................................................................................................................................................ 1
1.1 Problem statement .................................................................................................................................................. 2
1.2 Objective ....................................................................................................................................................................... 3
1.2.1 DilemmaMatch ..................................................................................................................................................... 3
1.3. Research question .................................................................................................................................................. 4
1.3.1 Sub-Questions ...................................................................................................................................................... 4
2. Literature Review ............................................................................................................................................................ 5
2.1 Mobile Marketing ..................................................................................................................................................... 5
2.1.1 Characteristics of Mobile Marketing ........................................................................................................... 6
2.2 Mobile Applications ................................................................................................................................................ 7
2.2.1 Mobile App Stores ............................................................................................................................................... 7
2.2.2 Social Mobile Applications .............................................................................................................................. 8
2.3 User Retention ........................................................................................................................................................... 8
3. Method ................................................................................................................................................................................. 10
3.1 Units and Constructs ............................................................................................................................................ 10
3.1.1 Units of Analysis ................................................................................................................................................ 10
3.1.2 Constructs ............................................................................................................................................................ 10
3.1.3 Variables ............................................................................................................................................................... 11
3.2 Research Strategy .................................................................................................................................................. 11
3.3 Research Design ...................................................................................................................................................... 12
3.3.1 Population ............................................................................................................................................................ 13
3.3.2 Sample ................................................................................................................................................................... 13
3.4 Reliability and Validity ....................................................................................................................................... 14
3.5 Ethical Aspects ......................................................................................................................................................... 14
4. Results .................................................................................................................................................................................. 15
4.1 Demographics .......................................................................................................................................................... 15
4.2 Social Media usage ................................................................................................................................................. 16
4.3 Smartphone usage ................................................................................................................................................. 17
4.4 Mobile Applications savviness ........................................................................................................................ 17
4.4.1 Mobile Applications Installations ............................................................................................................... 17
4.4.2 Mobile Applications Usage ............................................................................................................................ 21
4.4.3 Readiness to pay for Apps ............................................................................................................................. 24
4.5 User Retention - Mobile Applications ......................................................................................................... 25
4.6 DilemmaMatch - Awareness ............................................................................................................................ 30
4.7 Marketing Approaches – Social Mobile Application ........................................................................... 30
4.7.1 Assessment of Marketing Approaches ..................................................................................................... 30
4.7.2 Recommendations for Marketing .............................................................................................................. 31
5. Conclusion and Discussion ....................................................................................................................................... 32
5.1 Conclusion .................................................................................................................................................................. 40
5.2 Discussion .................................................................................................................................................................. 36
5.2.1 Societal and Practical Implications ............................................................................................................ 36
5.2.2 Methodological Implications ........................................................................................................................ 39
Bibliography .......................................................................................................................................................................... 42
Appendices ............................................................................................................................................................................. 44
Appendix I – Graphs and Figures........................................................................................................................... 44
Appendix II – Full Questionnaire .......................................................................................................................... 49
List of tables and figures
Figure 3.1.1 – Units of analysis, population and constructs 10
Figure 4.1.1 - Gender composition of survey respondents 44
Figure 4.1.2 - Age composition of survey respondents 44
Figure 4.2.1 - Social media usage (18-35 years) 16
Figure 4.2.2 - Exclusive social media usage (18-35 years) 16
Figure 4.3.1 - Smartphone (OS) usage among young adults between 18-35 years of age 45
Figure 4.4.1.1 - Downloaded mobile applications among smartphone users (18-35 years) 18
Figure 4.4.1.2 - Relationship between smartphone type and installed/downloaded mobile applications 18
Figure 4.4.1.3 - Monthly frequency of mobile app installations (18-35 years) 45
Figure 4.4.1.4 - Sources of mobile application search and installations 46
Figure 4.4.1.5 - Factors leading to download/installation of mobile applications 20
Figure 4.4.1.6 - Relationship between smartphone type and factors leading to mobile application download 21
Figure 4.4.2.1 - Frequency of using mobile applications among smartphone users (18-35 years) 46
Figure 4.4.2.2 - Daily mobile applications usage among smartphone users (18-35 years) 22
Figure 4.4.2.3 - Mobile applications usage by type of application among smartphone users (18-35 years) 23
Figure 4.4.3.1 - Have you ever purchased an App or made an In-app purchase? 24
Figure 4.4.3.2 - Preference of free vs paid mobile applications (18-35 years old) 47
Figure 4.4.3.3 - Amount willing to pay for mobile application divided by smartphone (OS) types 25
Figure 4.5.1 - User retention - The reasons to use mobile application again after installing 26
Figure 4.5.2 - Push notifications usage 26
Figure 4.5.3 - User retention - Factors for regular mobile applications usage among smartphone users (18-35) 28
Figure 4.5.4 - Time frame for uninstalling mobile applications after last use 28
Figure 4.5.5 - Reasons for uninstalling or deleting mobile applications 29
Figure 4.6.1 - Awareness of social mobile application DilemmaMatch 47
Figure 4.7.1.1 - Mobile marketing approaches for marketing of social mobile application targeting smartphone users between 18 and 35 years of age 30
Figure 4.7.2.1 - Recommendations for marketing of social mobile application 48
1
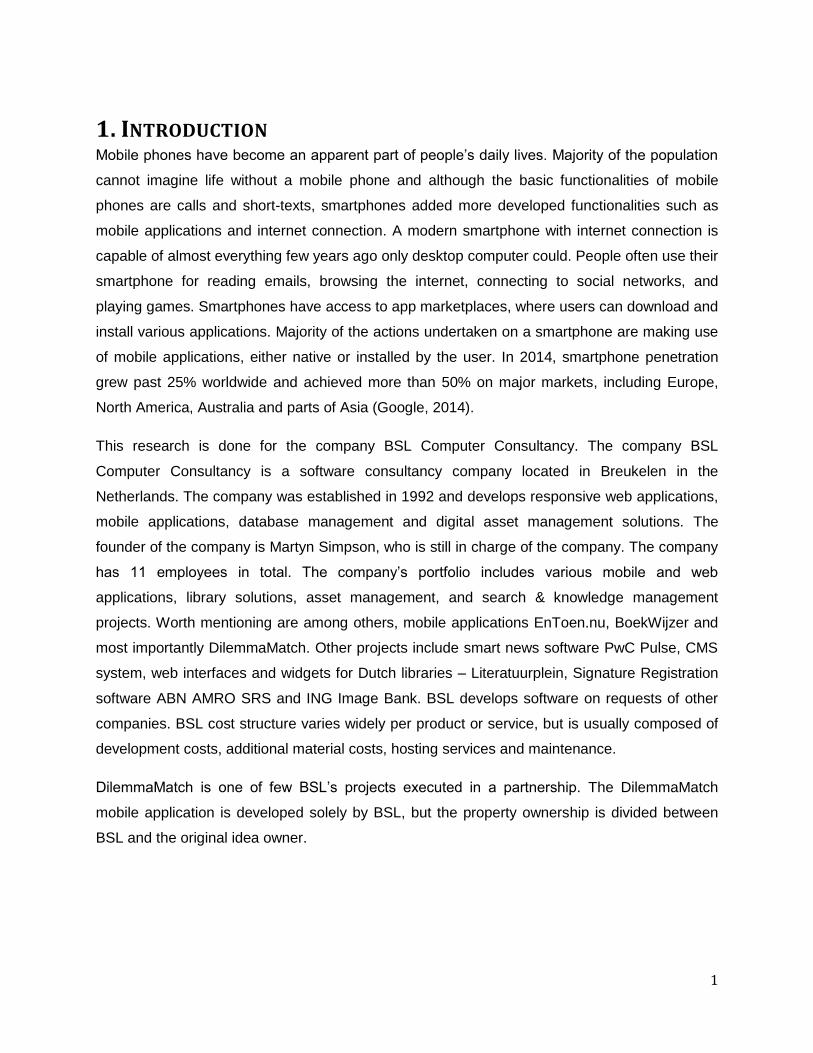
1. INTRODUCTION Mobile phones have become an apparent part of people’s daily lives. Majority of the population
cannot imagine life without a mobile phone and although the basic functionalities of mobile
phones are calls and short-texts, smartphones added more developed functionalities such as
mobile applications and internet connection. A modern smartphone with internet connection is
capable of almost everything few years ago only desktop computer could. People often use their
smartphone for reading emails, browsing the internet, connecting to social networks, and
playing games. Smartphones have access to app marketplaces, where users can download and
install various applications. Majority of the actions undertaken on a smartphone are making use
of mobile applications, either native or installed by the user. In 2014, smartphone penetration
grew past 25% worldwide and achieved more than 50% on major markets, including Europe,
North America, Australia and parts of Asia (Google, 2014).
This research is done for the company BSL Computer Consultancy. The company BSL
Computer Consultancy is a software consultancy company located in Breukelen in the
Netherlands. The company was established in 1992 and develops responsive web applications,
mobile applications, database management and digital asset management solutions. The
founder of the company is Martyn Simpson, who is still in charge of the company. The company
has 11 employees in total. The company’s portfolio includes various mobile and web
applications, library solutions, asset management, and search & knowledge management
projects. Worth mentioning are among others, mobile applications EnToen.nu, BoekWijzer and
most importantly DilemmaMatch. Other projects include smart news software PwC Pulse, CMS
system, web interfaces and widgets for Dutch libraries – Literatuurplein, Signature Registration
software ABN AMRO SRS and ING Image Bank. BSL develops software on requests of other
companies. BSL cost structure varies widely per product or service, but is usually composed of
development costs, additional material costs, hosting services and maintenance.
DilemmaMatch is one of few BSL’s projects executed in a partnership. The DilemmaMatch
mobile application is developed solely by BSL, but the property ownership is divided between
BSL and the original idea owner.
2
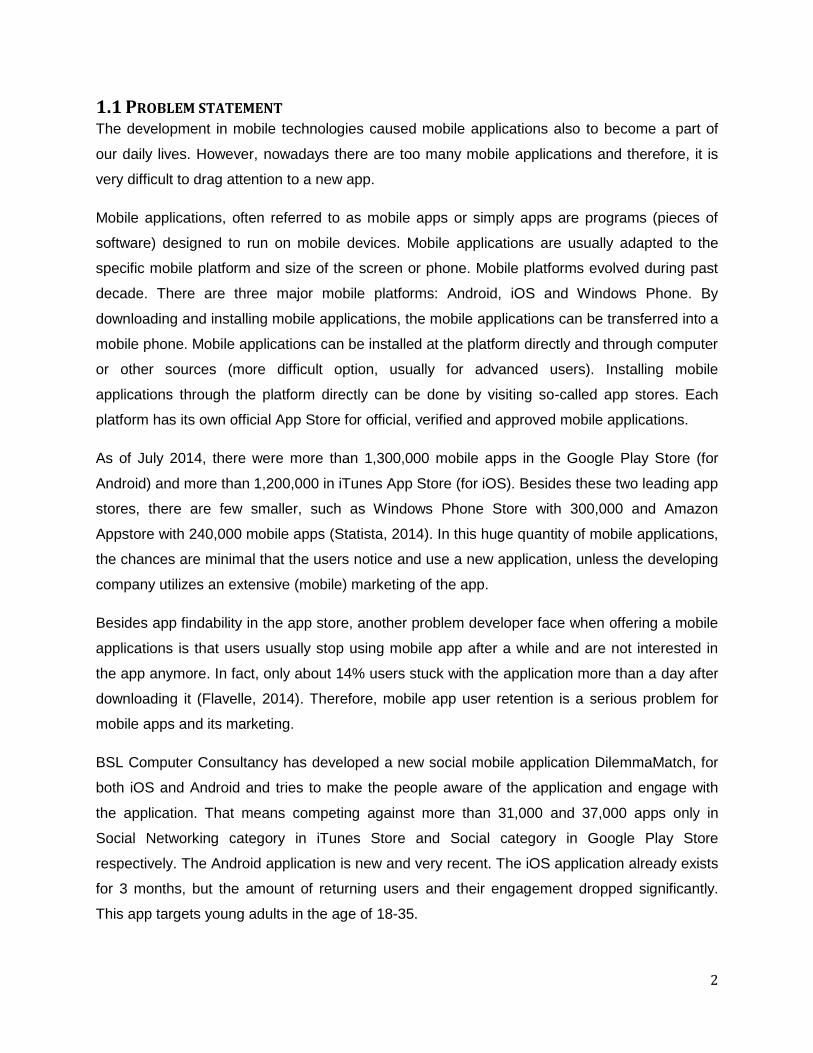
1.1 PROBLEM STATEMENT The development in mobile technologies caused mobile applications also to become a part of
our daily lives. However, nowadays there are too many mobile applications and therefore, it is
very difficult to drag attention to a new app.
Mobile applications, often referred to as mobile apps or simply apps are programs (pieces of
software) designed to run on mobile devices. Mobile applications are usually adapted to the
specific mobile platform and size of the screen or phone. Mobile platforms evolved during past
decade. There are three major mobile platforms: Android, iOS and Windows Phone. By
downloading and installing mobile applications, the mobile applications can be transferred into a
mobile phone. Mobile applications can be installed at the platform directly and through computer
or other sources (more difficult option, usually for advanced users). Installing mobile
applications through the platform directly can be done by visiting so-called app stores. Each
platform has its own official App Store for official, verified and approved mobile applications.
As of July 2014, there were more than 1,300,000 mobile apps in the Google Play Store (for
Android) and more than 1,200,000 in iTunes App Store (for iOS). Besides these two leading app
stores, there are few smaller, such as Windows Phone Store with 300,000 and Amazon
Appstore with 240,000 mobile apps (Statista, 2014). In this huge quantity of mobile applications,
the chances are minimal that the users notice and use a new application, unless the developing
company utilizes an extensive (mobile) marketing of the app.
Besides app findability in the app store, another problem developer face when offering a mobile
applications is that users usually stop using mobile app after a while and are not interested in
the app anymore. In fact, only about 14% users stuck with the application more than a day after
downloading it (Flavelle, 2014). Therefore, mobile app user retention is a serious problem for
mobile apps and its marketing.
BSL Computer Consultancy has developed a new social mobile application DilemmaMatch, for
both iOS and Android and tries to make the people aware of the application and engage with
the application. That means competing against more than 31,000 and 37,000 apps only in
Social Networking category in iTunes Store and Social category in Google Play Store
respectively. The Android application is new and very recent. The iOS application already exists
for 3 months, but the amount of returning users and their engagement dropped significantly.
This app targets young adults in the age of 18-35.
3
1.2 OBJECTIVE The objective of this research is to find out what are the appropriate marketing tools and
marketing methods for marketing of mobile application DilemmaMatch and social mobile
applications in general, in order to achieve more application downloads and to keep users
engaged with the app. The goal of the research is to find and utilize mobile application
marketing methods and determine which methods are suitable for the social mobile application
DilemmaMatch and for the target audience.
The goal of this project is to find out what steps and marketing efforts can be used to increase
the user retention and engagement of users of the social mobile application DilemmaMatch.
This research helps the company by finding the right way to approach the potential and
engaged DilemmaMatch users.
1.2.1 DILEMMAMATCH Mobile marketing campaigns are highly personalized and individual and therefore, can imply a
different perception among DilemmaMatch Social mobile application for iOS and Android
devices to help users find new friends who think like them and who share common interests – in
other words, to find their Soulmates.
The app works on a principle of answering Dilemmas. DilemmaMatch finds, based on the users’
interest category settings and answers to specific (current) dilemmas, people who share
common beliefs, hobbies and opinions (DilemmaMatch, 2015). The app works on Facebook
API, and therefore is only accessible by login using Facebook account. DilemmaMatch app
automatically creates a profile user profile and this profile is then updated with answered
dilemmas, earned badges and adjusted interests. Based on the users’ profile, DilemmaMatch
creates a list of people who answer in a similar way and have interests sorted in similar way – in
other words, your potential Soulmates and shows the potential match in percentage, based on
DilemmaMatch algorithms. The connection with the Soulmates, can be simply established via
Facebook.
DilemmaMatch has three different versions, free, promotional and premium. The free version is
the version available in store free of charge. The promotional version is a special version which
was available for free during the application launch, which contains some extra features such as
creating own dilemmas and monitoring results. The premium version of the application can be
acquired as an in-app purchase and the benefit is that it removes third-party ads from the whole
application and, if not acquired with the promo version, adds the option to create dilemmas.
4
DilemmaMatch for iOS was launched November 24, 2014 and Android version was released
later, on February 19, 2015. The iOS app is already in its version 1.0.6 and the Android app has
the latest version 1.0.4 with many new features, such as comparing Soulmates match with
Facebook friends or earning badges for answered Dilemmas.
DilemmaMatch promotional materials and videos are available in the media section of the
DilemmaMatch.com website: http://dilemmamatch.com/media.
1.3. RESEARCH QUESTION How can the Bright Side of Life attract 10.000 active DilemmaMatch users before the end of
2015?
1.3.1 SUB-QUESTIONS What are mobile applications?
How are social mobile applications defined?
What are the specifications of the target group (young adults)?
How familiar are the young adults with DilemmaMatch?
What are the characteristics of DilemmaMatch users?
How extensive is app usage in different regions and countries?
How large is the competition for social mobile applications?
What are the existing recommendations on the ways of mobile apps marketing?
What is user retention in mobile applications?
How to achieve higher user retention?
5
2. LITERATURE REVIEW There are various researches in the field of mobile application marketing and user retention.
Researches have been conducted mainly about the mobile marketing practices in general. This
means marketing and m-commerce using mobile applications. However, for this research the
main focus is to market a mobile application and how this is perceived from the user
perspective. Moreover, the researches about mobile marketing are slightly outdated and mainly
concern specific markets or regions. The main factor of DilemmaMatch is that it has no specific
regional restrictions, but concerns more specific audience. Mobile applications are growing
market with many possibilities. Many possibilities mean, however, also many challenges.
Therefore, more specific and recent research should be conducted.
2.1 MOBILE MARKETING Mobile devices allow the opportunity to combine information search with other interactive
sources. Mobile marketing is a section of digital marketing, and it is considered as an
instrument, it is the new trend in modern direct marketing that offers numerous possibilities for
personalized customer communication via mobile devices. Mobile marketing offers direct
communication with consumers, anytime and anyplace (Scharl, Dickinger, & Murphy, 2005).
According to Leppäniemi (2008, p. 49), the most academically correct definition of mobile
marketing is: ‘using interactive wireless media to provide customers with time and location
sensitive, personalized information that promotes goods, services and ideas, thereby generating
value for all stakeholders’ (Leppäniemi, 2008). Mobile Marketing Association, a global
association established to lead the growth of mobile marketing and advertising and their related
technologies revised the definition of mobile marketing. The definition, according to MMA is that
“Mobile Marketing is a set of practices that enables organizations to communicate and engage
with their audience in an interactive and relevant manner through and with any mobile device or
network” (Mobile Marketing Association, 2009).
Whether one or another definition, all definitions base on personalized communication through a
mobile device. However, MMA probably defined the most accurate description of what mobile
marketing really is. Additional information to the definition, include clarification of terms used in
the definition, such as that the “set of practices” includes “activities, institutions, processes,
industry players, standards, advertising and media, direct response, promotions, relationship
management, CRM, customer services, loyalty, social marketing, and all the many faces and
facets of marketing.” To “engage” means to “start relationships, acquire, generate activity,
stimulate social interaction with organization and community members, and be present at time
6
of consumers expressed need.” Furthermore, engagement can be initiated by the consumer
(“Pull” in form of a click or response) or by the marketer (“Push”) (Mobile Marketing Association,
2009).
2.1.1 CHARACTERISTICS OF MOBILE MARKETING Mobile marketing campaigns are highly personalized and individual and therefore, can imply a
different perception among different people. Mobile marketing can be considered as a separate
discipline, but it can also be used as a part of more complex marketing campaigns by
integrating in a marketing communication mix, which includes a variety of different marketing
channels and messages, called cross-media marketing. According to Karjaluoto, the special
features of mobile channel benefit from the use mobile devices and include mobility and
reachability, direct marketing, intractability, two-way communication, branding, viral-marketing,
time and personalization (Karjaluoto, 2007). Unlike other marketing channels, mobile devices
are connected wirelessly, which therefore allows the communication to be time and location
independent.
As Varnali presented in his research, a comprehensive review of mobile marketing literature
defined six important strategic best practices: (1) mobile marketing messages need to be
permission based, highly relevant, highly targeted, attention grabbing, to the point, personalized
and of value-added content; (2) having instant and recognizable benefit provided by the mobile
marketing (3) should address security and privacy concerns of the mobile users (4) mobile
applications must be innovative, user-friendly despite technological limitations of mobile
devices; (5) using suitable mobile technologies for successful implementation which is likely to
enhance efficiency and effectiveness and (6) users should collaborate and co-operate, and the
applications should be consumer centric (Varnali & Ayşegül, 2010).
Mobile marketing incentives should take the advantage of using the enhanced targeting with the
mobile channel and define the target audience in order to be able to achieve the degree of
personalization of the communicated message. The audience can be distinguished based on
categories that represent dimensions like professional and personal lives, hobbies, tastes,
geography, motivation and other dimensions. For each of these categories or dimensions,
different and specifically designed and targeted messages can be used (Tetere, 2011).
There are various tools for utilization of mobile marketing incentives. However, this research
focuses further on mobile applications as a marketing media to use for marketing and
advertising but also to be advertised.
7
2.2 MOBILE APPLICATIONS Mobile applications are the key part of this research. Mobile applications have become
indispensable part of our life. With the first smartphones, world launched a small revolution,
when smartphones have started to become a common thing and people began to use
smartphones to access internet more often. Mobile environment has become a major e-
commerce platform, game platform, advertising platform, and general media platform for
television shows, movies, videos, and e-books. In short, it’s become the personal computer all
over again, just in a much smaller form.
Mobile applications, often referred to as mobile apps or simply apps are programs (pieces of
software) designed to run on mobile devices. Mobile applications are usually adapted to the
specific mobile platform and size of the screen or phone. Mobile applications are commonly
designed to be controlled by touches and other gestures. There are three major mobile
platforms: Android, iOS and Windows Phone. These platforms are not inter-compatible and
therefore, mobile applications have to be developed and distributed for each platform
individually. By downloading and installing mobile applications, they can get into the mobile
phone. Mobile applications can be installed at the platform directly and through computer or
other sources (more difficult option, usually for advanced users). Installing mobile applications
through the platform directly is being done by visiting app stores. Each platform has its own
official App Store for official, verified and approved mobile applications. Mobile applications,
commonly shortened as ‘apps’, are not only standalone apps or games, but also an important
part of a business portfolio. Due to the fact that 143 million U.S. Internet users (almost 60% of
all Internet users) access the Web at least part of the time from mobile devices and smartphone
penetration in 2013 was 56% in the U.S., mobile apps play an important role (Traver & Laudon,
2014). This fact means that also web intensive mobile application have its place on the market.
Smartphones are often used as multi-activity portals, 89% of smartphone users use their
smartphones for communication (e-mail, messages, social network), 58% to stay informed
(news, magazines) and 91% for entertainment (apps, games, videos). Smartphone users in the
U.S. have on average 33 apps installed and have used 12 apps in the past 30 days (Google,
2013).
2.2.1 MOBILE APP STORES Mobile app stores are digital distribution platforms for mobile devices. Digital distribution
platforms are intended to provide mobile software to mobile devices. In the app stores, various
mobile applications are stored for download to mobile devices. Mobile app stores serve as a
8
platform to connect mobile applications developers with the users of the mobile applications.
The users of the mobile applications are actually become customers of the phone
manufacturers and application developers. The mobile app developers submit their mobile
applications to the app store to offer these applications to the smartphone users on specific
platform. There are separate official and verified mobile app stores for each of the platforms
(Android, iOS, Windows Phone). Moreover, for some platforms, there are also unofficial mobile
application stores. The mobile applications in the app stores are divided into specific categories.
The app stores have a general ranking and category ranking. The ranking of the mobile
applications in the app stores depends on various factors, such as keywords, popularity, amount
of downloads, install/uninstall ratio and application reviews. Some of the ranking factors are
manageable while it is not possible to influence others. The process of optimizing the mobile
application to get higher ranking in the app store results is called ASO (App Store Optimization).
Mobile app stores are a popular source of mobile applications. As of July 2014, there were more
than 1,300,000 mobile apps in the Google Play Store for Android and more than 1,200,000 in
iTunes App Store for iOS. Besides these two leading app stores, there are few smaller, such as
Windows Phone Store (for Windows Phone) and Amazon Appstore (for Android) counting for
300,000 and 240,000 mobile apps respectively (Statista, 2014).
2.2.2 SOCIAL MOBILE APPLICATIONS Social mobile applications, also known as social apps, include communication tools and
interactive tools often based on the Internet. Communication tools typically handle the capturing,
storing and presentation of communication, usually in form of text but also including audio and
video as communications tools. Interactive tools handle mediated interactions between a pair or
group of users. They focus on establishing and maintaining a connection among users. Social
networking is the practice of expanding the number of social contacts by making connections.
(TechTarget, 2006) Focusing on two largest app stores, iTunes and Google Play, there are
31,777 current active applications in Social Networking category on the iTunes App Store
(Pocket Gamer, 2012) and 36,933 applications in Social category in the Google Play Store (App
Brain, 2015). Although these two categories are slightly different in definition, there are similar
apps in both categories in both app stores. The target application of this research,
DilemmaMatch, belongs to these two categories.
2.3 USER RETENTION Customer retention is one of the main relationship marketing objectives. Currently the
perception and application of customer retention is significantly valuable for companies.
9
Therefore, this also applies to the mobile apps, where the revenue model is the application
itself.
Research paper Factors influencing customer retention (Tamuliene & Gabryte, 2014) suggests
that for a standard service, the main user retention factors are customer satisfaction,
relationship quality and switching costs or acquiring costs. The switching costs have the
greatest impact on customer retention. The impact of relationship quality is also very significant.
The study revealed that a good relationship with the client is important because the quality of
relationships has a direct impact on customer retention and customer satisfaction. Improving
relations increases the emotional damages, so the customers are reluctant to change.
In mobile application world, there are no switching costs. There is no penalty of uninstalling an
app and if a user uninstalls an app it can install it later again, even if the app price changed in
the meantime. DilemmaMatch is a free application and therefore there are no acquiring costs,
unless the user decides to purchase the premium version. Premium version users might be
bond more to the application and therefore have higher retention due to the fact they purchased
the application.
Banyte and Dovaliene (2014) analyzed the relations between customer engagement into value
creation and customer loyalty. The research illustrates conceptual model of customer
engagement into value creation and customer loyalty. There are links between customer
engagement and customer loyalty, but the specifics depend on the context (Banyte &
Dovaliene, 2014).
Creation of best value for customer while involving customers into the process is considered to
be the basis for the development of long-term relationships with customers resulting in customer
retention and loyalty (Egan, 2011). Direct link between customer engagement into value
creation and customer loyalty was studied by Auh et al. (2007). The research suggests
increasing customers’ motivation to co-produce involves managing the service experience such
that customers perceive the relationship as equitable. Those with a stronger affective
commitment to the organization are more motivated to make the most of their co-production
opportunities, but building customers’ affective bonds with an organization is no simple task.
(Auh, Bell, McLeod, & Shih, 3, 2007)
These links between customer engagement and customer loyalty can be applied as a model for
user retention. The results of these researches can be considered as a base for the retention
10
manners within the DilemmaMatch app. As the researches suggested, customers or users in
the case of mobile app should be directly involved in the value creation in order to build
customer loyalty and increase customer retention.
3. METHOD Choosing the right research method is key in order to be able to properly research the subject
and answer the research question adequately. To find the answer to the main research question
concerning the best ways to market social mobile application targeting young adults,
combination of qualitative and quantitative research is used.
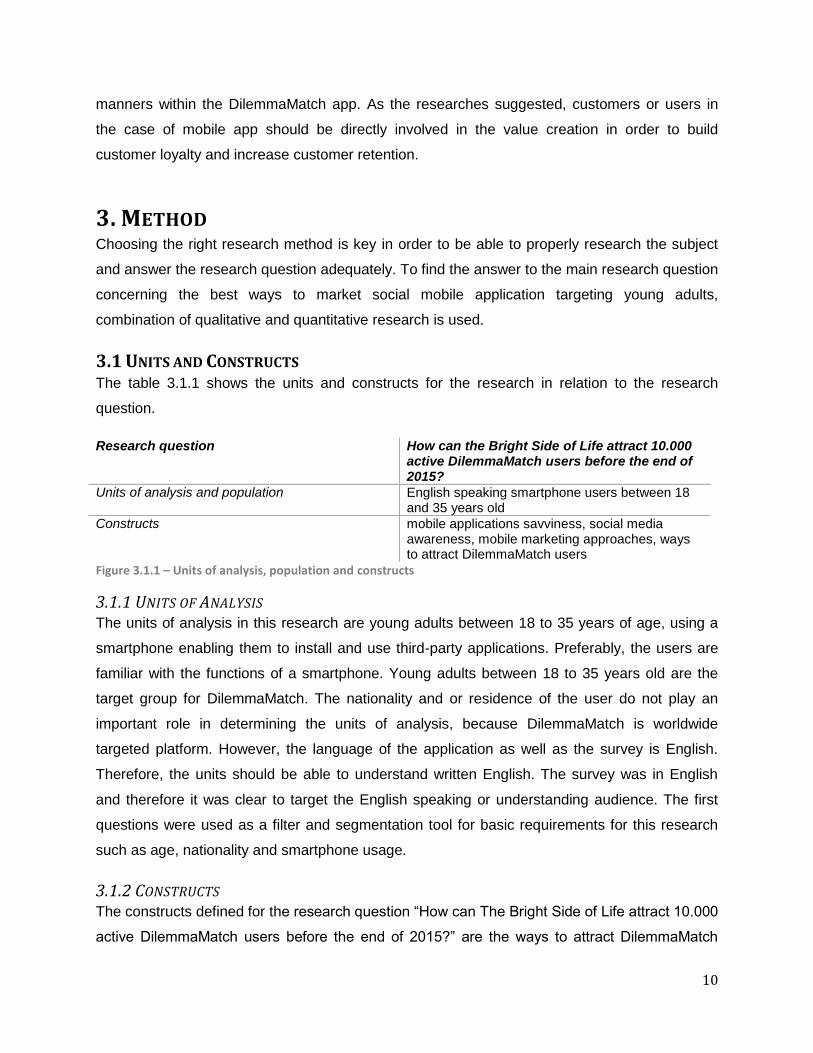
3.1 UNITS AND CONSTRUCTS The table 3.1.1 shows the units and constructs for the research in relation to the research
question.
Research question How can the Bright Side of Life attract 10.000 active DilemmaMatch users before the end of 2015?
Units of analysis and population English speaking smartphone users between 18 and 35 years old
Constructs mobile applications savviness, social media awareness, mobile marketing approaches, ways to attract DilemmaMatch users
Figure 3.1.1 – Units of analysis, population and constructs
3.1.1 UNITS OF ANALYSIS The units of analysis in this research are young adults between 18 to 35 years of age, using a
smartphone enabling them to install and use third-party applications. Preferably, the users are
familiar with the functions of a smartphone. Young adults between 18 to 35 years old are the
target group for DilemmaMatch. The nationality and or residence of the user do not play an
important role in determining the units of analysis, because DilemmaMatch is worldwide
targeted platform. However, the language of the application as well as the survey is English.
Therefore, the units should be able to understand written English. The survey was in English
and therefore it was clear to target the English speaking or understanding audience. The first
questions were used as a filter and segmentation tool for basic requirements for this research
such as age, nationality and smartphone usage.
3.1.2 CONSTRUCTS The constructs defined for the research question “How can The Bright Side of Life attract 10.000
active DilemmaMatch users before the end of 2015?” are the ways to attract DilemmaMatch
11
users, mobile applications savviness and social media awareness. The construct is measured
by the survey questions based on the theoretical framework or results of the preliminary
research. The frequency of and reasons for the specific constructs is measured. Other primary
constructs are age, gender and nationality.
3.1.3 VARIABLES In order to be able to analyze the data from the research properly, there are variables needed to
group or categorize the answers and to make possible to determine relationships and draw
conclusions. The variables for this research with specific attributes include categorical as well as
continuous variables. Categorical variables include nominal, dichotomous and ordinal variables.
In this research, these categories are represented by the type of smartphone (nominal), gender
(dichotomous), and age (ordinal). Continuous variables include interval and ratio variables. In
this research, these are among others represented by the time of uninstalling apps (interval),
push notifications usage (interval) and the amount of mobile applications additionally installed
(ratio). The variables for social media awareness are measured by usage of social networks.
The variables for mobile applications savviness are time spent on apps, frequency of using
apps, types of apps, goals for using apps, number of apps installed in mobile device and
readiness to pay for apps. These variables have different categories. Usage of social networks,
types of apps and goals for using apps are nominal categorical variables, while frequency of
using apps is continuous ratio variable. Time spent on apps, readiness to pay for apps and the
number of apps installed in mobile device, are continuous interval variables.
3.2 RESEARCH STRATEGY The research strategy used for the research is quantitative research. Quantitative research
strategy is used in order to provide numerical data and results which can be processed easily in
a logical matter.
To collect the relevant and reliable data in an amount sufficient to generalize, a one-time survey
was used. The objective of the survey is to collect information by recording responses about the
units of the analysis, smartphone users between 18 to 35 years of age.
A survey is the best option for this research, due to the fact that allows to collect larger amounts
of data in a very efficient, sophisticated and economical manner. Moreover, the data collected
using surveys are standardized, allowing easy comparison. In addition, the survey strategy is
perceived as authoritative and is comparatively easy to explain and to understand. The survey
strategy allows more control over the research process and it is easily possible to generate
12
findings that are representative of the whole population from a sample (Saunders, Lewis, &
Thornhill, 2009).
A survey as a research method allows the collection of data about constructs of the units of
analysis and describes the constructs or discovers the relationships between the constructs and
the units of analysis (Baarda, 2014).
The aim of this research is to record as many survey responses as possible, within the relevant
target audience. The one-time survey was sent to the smartphone users between 18 to 35 years
of age. The first few questions in the survey served as an informative and filter questions to
confirm the eligibility of the respondent for this research. By doing so, the minority of non-
smartphone users were not eligible to take part in the research.
As mentioned earlier, there were quantitative aspects of research used in the survey. There are
quantitative questions to determine frequencies and measure the numerical distributions.
However, there are also a few qualitative questions determining the diversity of the topic. The
survey contains both closed and open questions and all the questions are analyzed and
researched using statistical models in order to generate representative findings and determine
relationships between the answers.
3.3 RESEARCH DESIGN Although there were be both qualitative and quantitative aspects of research used in the survey,
the vast majority of the research is conducted using a quantitative research method. There was
a preliminary research conducted in order to gain more insights into the existing theory and
literature concerning the mobile applications marketing.
The survey is the main source of information about the best marketing techniques for user
retention and engagement with a social mobile application DilemmaMatch as well as the ways
to attract new active users. The data for this research were collected by survey questions and
thorough assessment of existing materials. Based on the fact that attitude and opinion
questionnaire are types suitable for this research, the descriptive research method is used. As
mentioned earlier, Google Forms were used for creating and administering the questionnaire.
Therefore, it was an Internet-mediated questionnaire completed by the respondents.
Internet-mediated questionnaires in general can be constructed, conducted, and evaluated with
ease. They enable to obtain a large and more diverse sample than in traditional research, which
increases statistical power. Internet research can sample individuals beyond the people known
13
to the researcher. Moreover, internet-based research is better in this way because of the fact
that internet-based research prevents experimenter demand effects, simply meaning that the
respondents would not see any direct relation between the researcher, the product and to the
respondents and this does not influence their answers. In an internet research, data is
automatically coded and stored in the response management system so the data entry errors
are eliminated (Barak, 2012). Eliminating errors is important in order to timely and properly
process the results. Furthermore, reduced cost of conducting research is another benefit of an
internet research. Internet-mediated research is therefore completely suitable for this research.
3.3.1 POPULATION The research targets theoretical/potential users of the social mobile application DilemmaMatch.
The mobile application DilemmaMatch is available in globally (in all national app store versions)
and the language of the application is English. Therefore, the units of the analysis in this
research are English speaking smartphone users between 18 to 35 years of age. The units of
the analysis represent the population. Statistics show that there is a total of 1,500 million
English speaking people worldwide, together native and non-native (Statista, 2015). The world
population in the category of 18-35 is difficult to measure, but is estimated to be are around 26%
(CIA, 2014). The total worldwide smartphone penetration was 25% in 2014. However, the
smartphone penetration is higher in the category of 18-35. According to the research Our Mobile
Planet conducted by Ipsos, Google and the Mobile Marketing Association, the smartphone
penetration in this category is 65.5% (Google, 2014).
According to these percentages, the estimated population for this research is approximately
255.5 million people. The population for the study is too large. Therefore, sampling of the
population is used.
3.3.2 SAMPLE The population sampling for this quantitative research was done as convenience samples.
There is no register or database of smartphone users available. This survey was an internet-
mediated questionnaire for which convenience sampling is the most suitable. The aim for this
survey is to gather opinions from at least 100 people. With a population of 255.5 million and
normal distribution (50%), confidence level of 95% and 10% margin of error, the required
sample size is 97. The bigger the size of the sample, the more accurate the research results
are. Therefore, the aim was to have at least 100 respondents.
14
3.4 RELIABILITY AND VALIDITY The reliability and validity of the questionnaire was be tested by a few pilot respondents and
experienced researchers/professionals who received the pilot/test survey. The feedback
included suggestions and helped to actually test, whether the questions are perceived in the
way they were meant and whether the questionnaire leads to consistent and reliable answers.
The internal validity of the questionnaire was tested by presenting the survey in its pilot phase to
a fellow researcher for explanation and comments.
This made sure that the questions are valid as well as reliable and clear and objective to the
research question. The survey should have at least 100 unique respondents, to represent
sample big enough to draw any possible conclusions and for the research to be reliable and
useful.
3.5 ETHICAL ASPECTS The questionnaire was handled by Google Forms, an online tool secured with SSL that is only
accessible by the person specified by the researcher. The responses to the questionnaire were
recorded fully anonymously and did not require any personal or confidential information. The
responses were also handled anonymously. However, they are stored in the response
management system of Google Forms. The responses were used solely for this specific
research.
15
4. RESULTS Estimated population for this research in is around 255.5 million people. With a population of
255.5 million and normal distribution (50%), confidence level of 95% and 10% margin of error,
the required sample size was 97. In order to provide quality results, the aim was to gather at
least 100 responses.
In total, 251 respondents answered the survey. Of all the 251 responses, there were 9 invalid
responses, 3 people in not-targeted age categories (1 person in age category 0-17 and 2 people
in age category 35+). Moreover, there were 6 responses of people not using a smartphone.
These invalid responses were not used in the further investigation of the results.
Therefore, the total number of respondents used in the results equals 242. The accuracy of the
research is therefore better with 242 total valid responses, than originally estimated 100
responses.
4.1 DEMOGRAPHICS The questionnaire received 242 valid responses. The demographic composition of the
respondents has been analyzed in categories age and gender.
The survey was answered by 242 people. The genders were almost equally represented in the
responses. With 113 responses, male respondents accounted for 47% share of gender
composition. The remaining 53% were represented by 129 female respondents. The figure 4.1.1
shows a pie chart of the gender composition (see Appendix I).
Age was another important factor to distinguish the demographics. Age, as a variable was
divided into 5 categories: 0-17, 18-25, 25-30, 30-35 and 35+ and described in figure 4.1.2 (see
Appendix I). The responses in categories 0-17 and 35+ were not eligible to take part in the
research. There were only 3 responses in the categories not eligible for the research, 1 and 2 in
categories 0-17 and 35+ respectively.
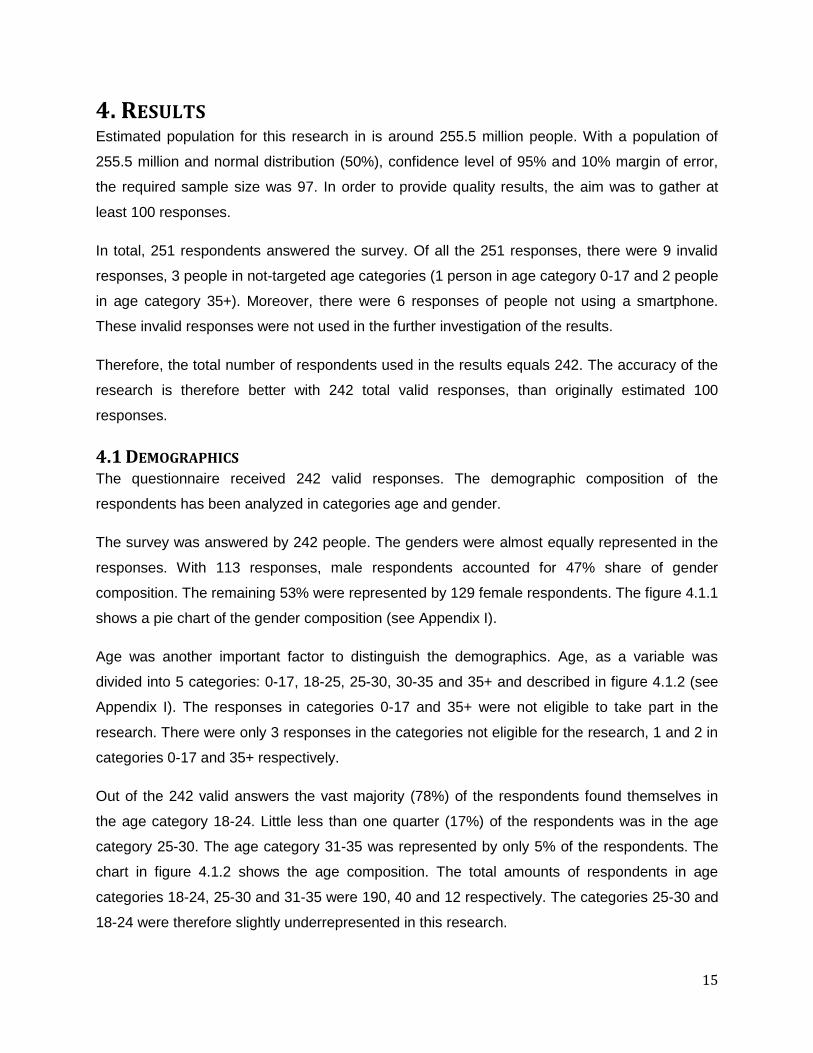
Out of the 242 valid answers the vast majority (78%) of the respondents found themselves in
the age category 18-24. Little less than one quarter (17%) of the respondents was in the age
category 25-30. The age category 31-35 was represented by only 5% of the respondents. The
chart in figure 4.1.2 shows the age composition. The total amounts of respondents in age
categories 18-24, 25-30 and 31-35 were 190, 40 and 12 respectively. The categories 25-30 and
18-24 were therefore slightly underrepresented in this research.
16
4.2 SOCIAL MEDIA USAGE Social media awareness measured by social media usage variable is yet another construct in
this research. There were two main factors measured to determine social media usage. These
outcomes have been generated from one question about social media usage. There is social
media awareness in general assessing what social media the respondents use. The other was
to determine whether the social media usage of the specific social media channel or network
was exclusive.
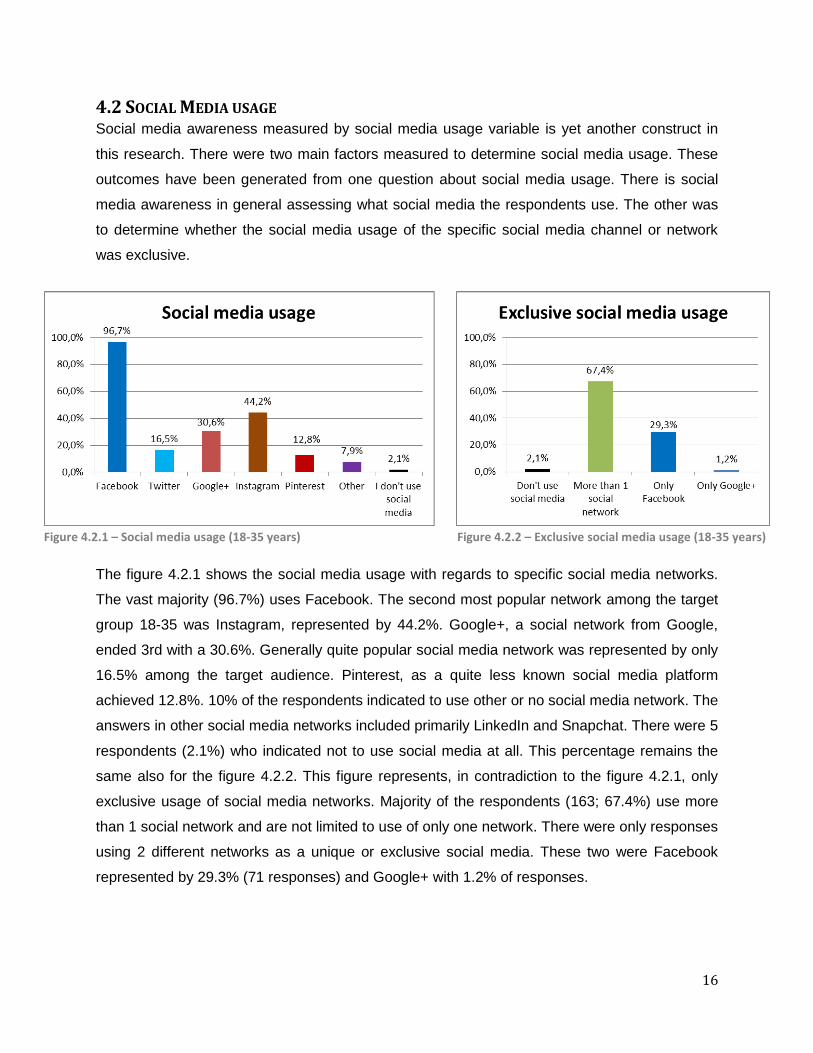
The figure 4.2.1 shows the social media usage with regards to specific social media networks.
The vast majority (96.7%) uses Facebook. The second most popular network among the target
group 18-35 was Instagram, represented by 44.2%. Google+, a social network from Google,
ended 3rd with a 30.6%. Generally quite popular social media network was represented by only
16.5% among the target audience. Pinterest, as a quite less known social media platform
achieved 12.8%. 10% of the respondents indicated to use other or no social media network. The
answers in other social media networks included primarily LinkedIn and Snapchat. There were 5
respondents (2.1%) who indicated not to use social media at all. This percentage remains the
same also for the figure 4.2.2. This figure represents, in contradiction to the figure 4.2.1, only
exclusive usage of social media networks. Majority of the respondents (163; 67.4%) use more
than 1 social network and are not limited to use of only one network. There were only responses
using 2 different networks as a unique or exclusive social media. These two were Facebook
represented by 29.3% (71 responses) and Google+ with 1.2% of responses.
Figure 4.2.1 – Social media usage (18-35 years) Figure 4.2.2 – Exclusive social media usage (18-35 years)
17
4.3 SMARTPHONE USAGE This research focuses mainly on smartphones and mobile applications savviness. As a part of
the introductory questions indicative for mobile applications savviness and behavior of users of
different smartphone types, smartphone usage was investigated. In order to be able to properly
evaluate the mobile applications savviness as a construct, usage of different smartphone
operating systems (further referred to as OS) was researched as a variable.
As it was mentioned at the beginning of the results chapter, there were 6 answers indicating the
respondents don’t use smartphones. Therefore, these answers have been removed. The
remaining 242 valid responses have been divided further into various smartphone or OS type
the specific respondent uses. As shown in figure 4.3.1 (see Appendix I), the highest share (157;
65%) took the respondents using smartphone running Android OS. The second highest share
(70; 29%) of respondents indicated usage of iPhone smartphones running iOS. There were 5%
(13 respondents) who answered they are using a smartphone with Windows Phone OS. There
were 2 respondents whose answers were they are using other type of smartphone OS. The
answers in other might have included Blackberry smartphones or older smartphones still
running Symbian.
4.4 MOBILE APPLICATIONS SAVVINESS Mobile applications savviness and usage is one of the main constructs in this research. There
were more questions assessing mobile applications usage and savviness among the survey
respondents. The variables for mobile applications savviness are time spent on apps, frequency
of using apps, types of apps, goals for using apps, number of apps installed in mobile device
and readiness to pay for apps. These variables have different categories.
4.4.1 MOBILE APPLICATIONS INSTALLATIONS The first question to assess the mobile application savviness construct was to determine how
many downloaded mobile applications does the respondents have on their smartphone.
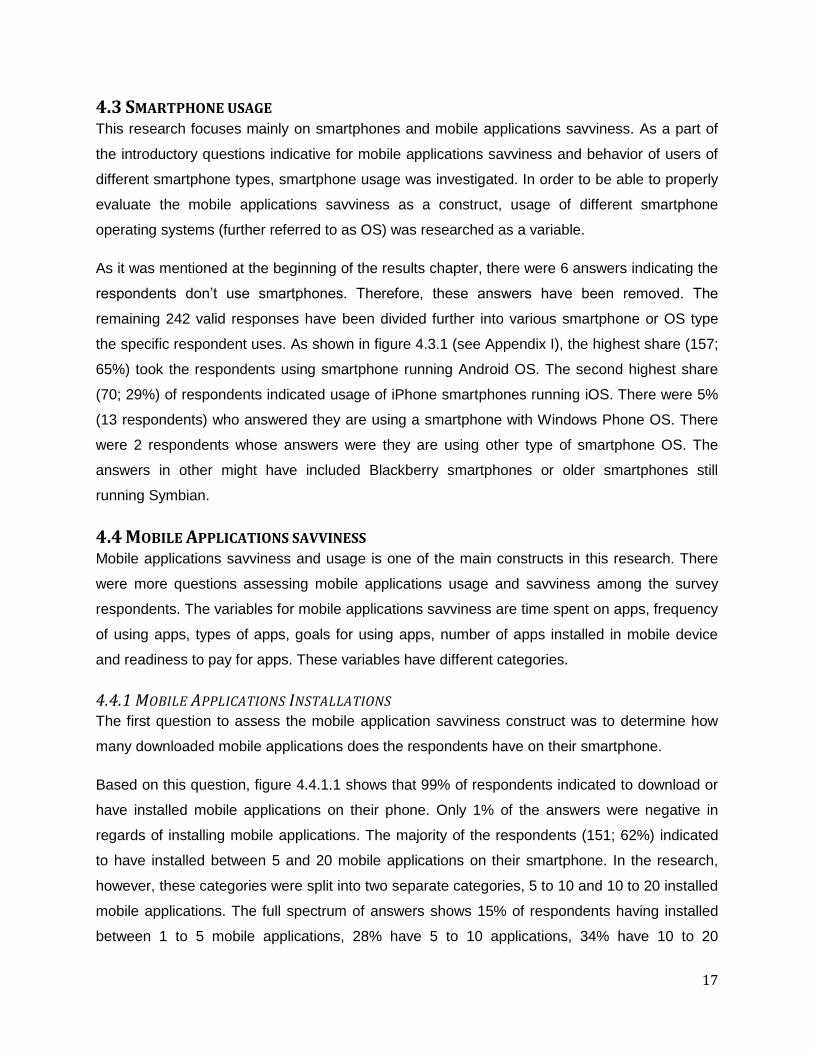
Based on this question, figure 4.4.1.1 shows that 99% of respondents indicated to download or
have installed mobile applications on their phone. Only 1% of the answers were negative in
regards of installing mobile applications. The majority of the respondents (151; 62%) indicated
to have installed between 5 and 20 mobile applications on their smartphone. In the research,
however, these categories were split into two separate categories, 5 to 10 and 10 to 20 installed
mobile applications. The full spectrum of answers shows 15% of respondents having installed
between 1 to 5 mobile applications, 28% have 5 to 10 applications, 34% have 10 to 20
18
applications and 12% have 20 to 30 applications installed on their smartphones. The last 23
(10%) respondents indicated to have installed more than 30 mobile applications and having
more than 30 applications on their smartphones.
Figure 4.4.1.1 – Downloaded mobile applications among smartphone users (18-35 years)
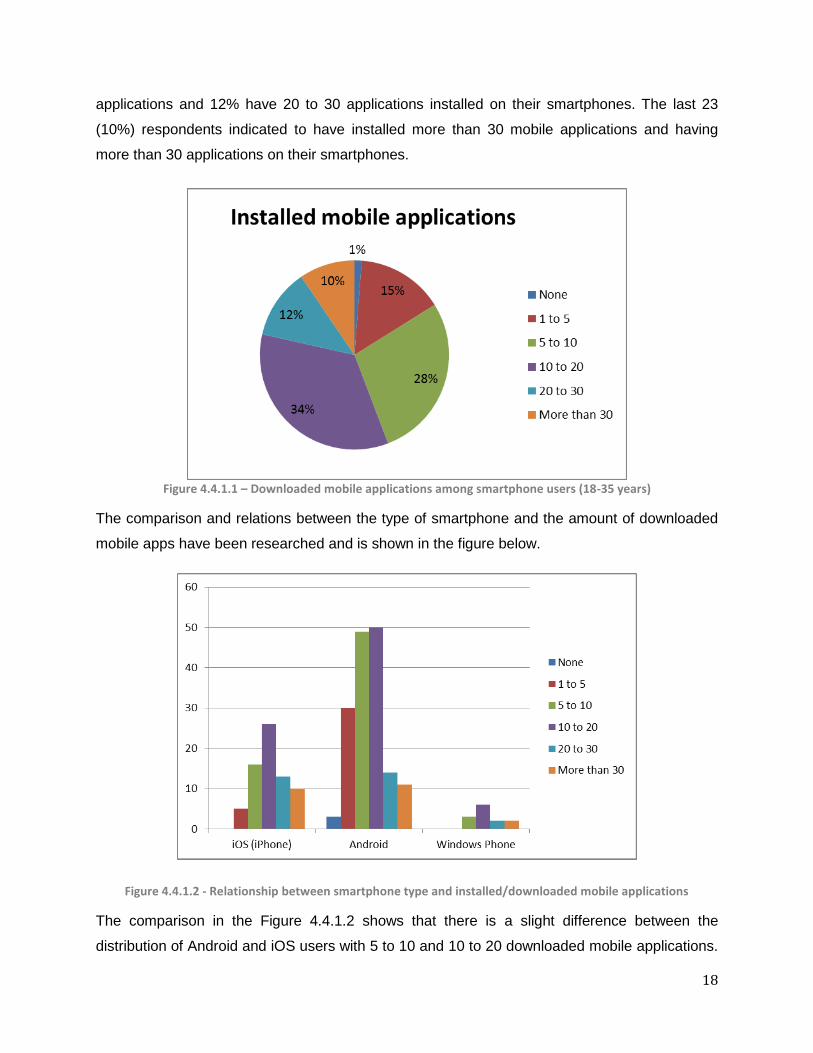
The comparison and relations between the type of smartphone and the amount of downloaded
mobile apps have been researched and is shown in the figure below.
Figure 4.4.1.2 - Relationship between smartphone type and installed/downloaded mobile applications
The comparison in the Figure 4.4.1.2 shows that there is a slight difference between the
distribution of Android and iOS users with 5 to 10 and 10 to 20 downloaded mobile applications.
19
While the amount of Android users with 5 to 10 (49; 31.2%) and 10 to 20 (50; 31.8%) mobile
application is almost equal, these numbers differ significantly at users with iOS and Windows
Phone. On iOS, these numbers are 22.9% users with 5 to 10 downloaded applications and
37.1% users having 10 to 20 installed mobile applications. On Windows Phone, there is even
bigger difference in these numbers. There are 23.1% users with 5 to 10 applications and exactly
the double, 46.2% users with 10 to 20 downloaded applications on Windows Phone. Moreover,
there are 1.9% users having installed absolutely no additional applications on Android
smartphone, while this figure is zero at iOS or Windows Phone. The percentage of respondents
having installed 20 to 30 mobile applications compares 8.9% Android users with 18.6% iOS
users and 15.4% users on Windows Phone. The percentage share of users with more than 30
downloaded applications is 7% on Android, 14.3% on iOS, and 15.4% on Windows Phone.
Another factor to research the construct of mobile applications savviness and usage is the
frequency of app installations; the period for estimation of mobile application installs has been
selected as one month.
The figure 4.4.1.3 (see Appendix I) shows the represents the frequency of mobile app
installations by showing the answers to how many mobile applications do the respondents
install per month. There vast majority of respondents here (165; 68%) indicated to install only 1-
2 mobile apps per month. There were 32 respondents (13%) who answered to install 0
applications per month, not necessarily meaning installing no apps at all, but possibly to install
mobile applications less often. Another 15% (37 respondents) answered to install 3-5 mobile
applications per month and 4% answered to install 5-10 mobile applications per month. There
was no one who answered to install more than 10 mobile applications a month.
In order to be able to properly analyze the mobile applications savviness, it was necessary to
research the sources of mobile applications installations. Figure 4.4.1.4 (see Appendix I) shows
the various sources of mobile applications installs together with the questionnaire responses.
The sources for mobile application sources have been defined as App store, online forums, app
review websites, social media, articles, company websites, and other. There was also an option
to choose when using only pre-installed apps. Almost all of the respondents (93.4%) indicated
to use App Store as a source to search for mobile apps There were even 148 respondents who
indicated to use the App Store directly as the only source of searching for and installing mobile
apps. The second largest sources of app search according to the respondents were social
media with 16.1%, followed by app review websites with 12% and online forums with 10.3%. All
20
the other app search and install sources received only less than 10% responses. These include
articles (8.7%), company websites directly (6.2%) and other (2.9%). There were 3.3%
respondents who answered to only use pre-installed mobile applications.
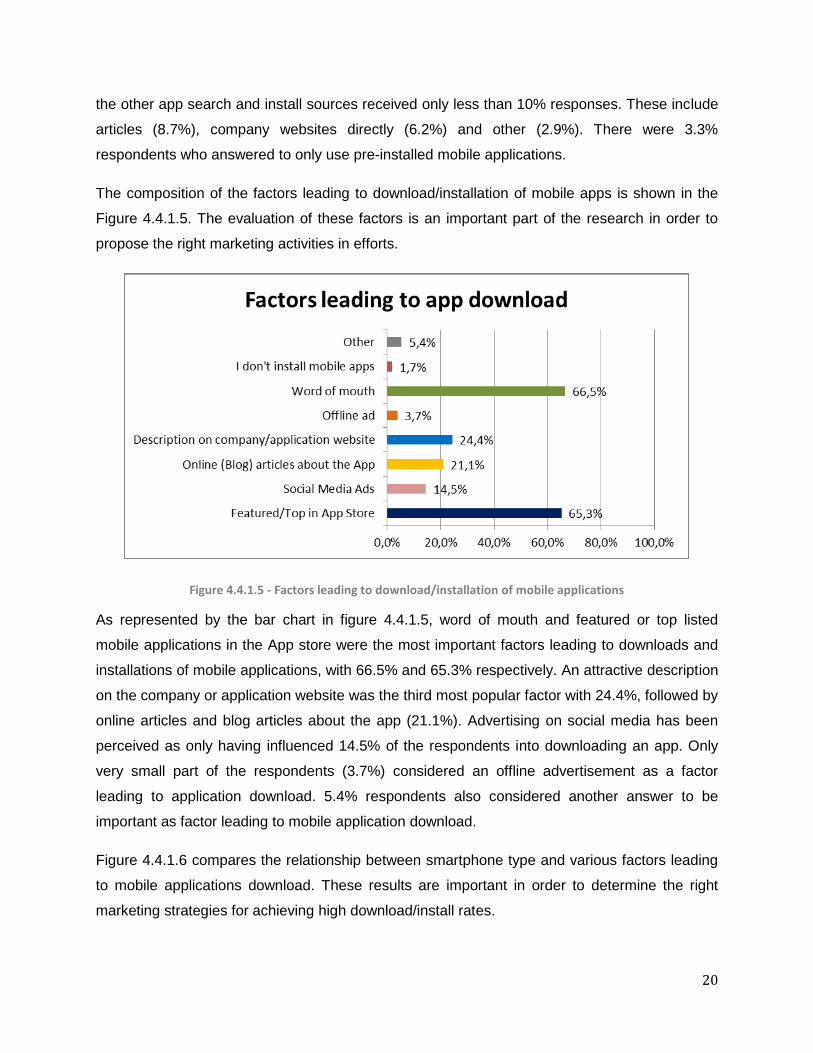
The composition of the factors leading to download/installation of mobile apps is shown in the
Figure 4.4.1.5. The evaluation of these factors is an important part of the research in order to
propose the right marketing activities in efforts.
Figure 4.4.1.5 - Factors leading to download/installation of mobile applications
As represented by the bar chart in figure 4.4.1.5, word of mouth and featured or top listed
mobile applications in the App store were the most important factors leading to downloads and
installations of mobile applications, with 66.5% and 65.3% respectively. An attractive description
on the company or application website was the third most popular factor with 24.4%, followed by
online articles and blog articles about the app (21.1%). Advertising on social media has been
perceived as only having influenced 14.5% of the respondents into downloading an app. Only
very small part of the respondents (3.7%) considered an offline advertisement as a factor
leading to application download. 5.4% respondents also considered another answer to be
important as factor leading to mobile application download.
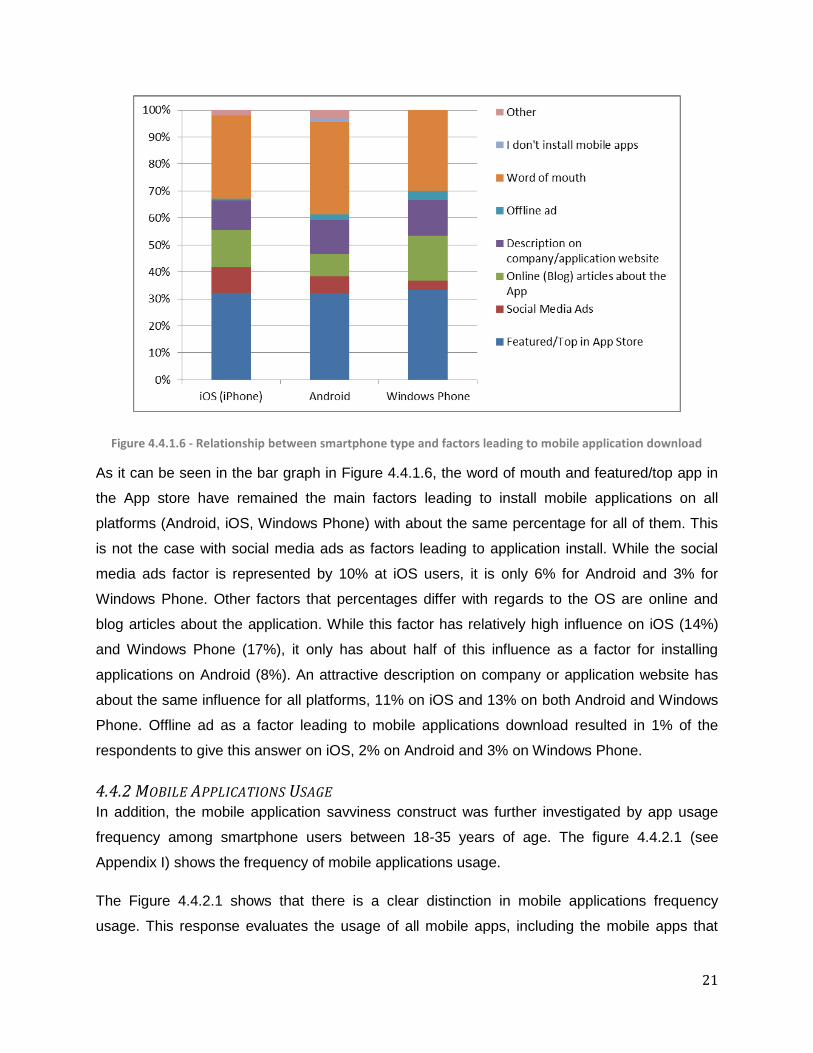
Figure 4.4.1.6 compares the relationship between smartphone type and various factors leading
to mobile applications download. These results are important in order to determine the right
marketing strategies for achieving high download/install rates.
21
Figure 4.4.1.6 - Relationship between smartphone type and factors leading to mobile application download
As it can be seen in the bar graph in Figure 4.4.1.6, the word of mouth and featured/top app in
the App store have remained the main factors leading to install mobile applications on all
platforms (Android, iOS, Windows Phone) with about the same percentage for all of them. This
is not the case with social media ads as factors leading to application install. While the social
media ads factor is represented by 10% at iOS users, it is only 6% for Android and 3% for
Windows Phone. Other factors that percentages differ with regards to the OS are online and
blog articles about the application. While this factor has relatively high influence on iOS (14%)
and Windows Phone (17%), it only has about half of this influence as a factor for installing
applications on Android (8%). An attractive description on company or application website has
about the same influence for all platforms, 11% on iOS and 13% on both Android and Windows
Phone. Offline ad as a factor leading to mobile applications download resulted in 1% of the
respondents to give this answer on iOS, 2% on Android and 3% on Windows Phone.
4.4.2 MOBILE APPLICATIONS USAGE In addition, the mobile application savviness construct was further investigated by app usage
frequency among smartphone users between 18-35 years of age. The figure 4.4.2.1 (see
Appendix I) shows the frequency of mobile applications usage.
The Figure 4.4.2.1 shows that there is a clear distinction in mobile applications frequency
usage. This response evaluates the usage of all mobile apps, including the mobile apps that
22
were pre-installed on the phone. The vast majority, namely 82.2% of the respondents indicated
that they use mobile applications at least once a day. Another 13.6% respondents use mobile
applications at least 2 to 3 times a week. Only 2.1% use mobile applications once a week, 1.2%
once in a month and 0.4% less often. Also 0.4% of the respondents answered they don’t use
mobile apps.
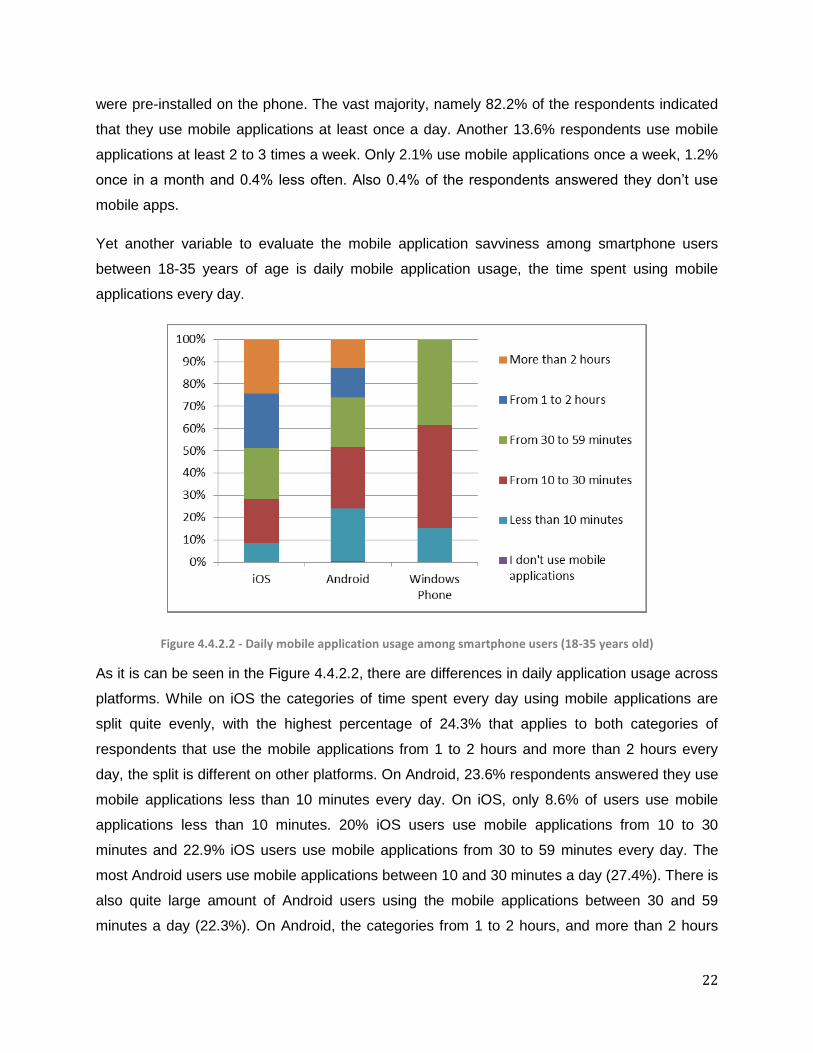
Yet another variable to evaluate the mobile application savviness among smartphone users
between 18-35 years of age is daily mobile application usage, the time spent using mobile
applications every day.
Figure 4.4.2.2 - Daily mobile application usage among smartphone users (18-35 years old)
As it is can be seen in the Figure 4.4.2.2, there are differences in daily application usage across
platforms. While on iOS the categories of time spent every day using mobile applications are
split quite evenly, with the highest percentage of 24.3% that applies to both categories of
respondents that use the mobile applications from 1 to 2 hours and more than 2 hours every
day, the split is different on other platforms. On Android, 23.6% respondents answered they use
mobile applications less than 10 minutes every day. On iOS, only 8.6% of users use mobile
applications less than 10 minutes. 20% iOS users use mobile applications from 10 to 30
minutes and 22.9% iOS users use mobile applications from 30 to 59 minutes every day. The
most Android users use mobile applications between 10 and 30 minutes a day (27.4%). There is
also quite large amount of Android users using the mobile applications between 30 and 59
minutes a day (22.3%). On Android, the categories from 1 to 2 hours, and more than 2 hours
23
are represented by 13.4% and 12.7% respectively. Windows Phone users only used three
categories of answers: less than 10 minutes (15.4%), from 10 to 30 minutes (38.5%), and from
30 to 59 minutes (46.2%), where the most users use mobile apps between 30 to 59 minutes
every day.
The construct of mobile application savviness and mobile applications usage variable are
researched by the popularity in usage of different types of mobile applications.
Utilities
Entertainment Games News Banking Time
Management Search Tools
Social Networking Sports
Travel/Navigation Weather
Mean 2.55785124 2.987603 2.64876 2.599174 2.099174 3.235537 2.53719 4.045455 2.376033 3.458678 3.024793 Standard Error 0.080473258 0.076011 0.086576 0.081787 0.087997 0.089155 0.084676 0.084304 0.08772 0.074083 0.080915
Mode 3 3 2 2 1 4 1 5 1 4 4 Standard Deviation 1.251870108 1.182449 1.346803 1.272303 1.36892 1.386919 1.317242 1.311456 1.36461 1.152459 1.258747
Sample Variance 1.567178766 1.398186 1.813878 1.618755 1.873941 1.923545 1.735126 1.719917 1.862162 1.328161 1.584445 Range 4 4 4 4 4 4 4 4 4 4 4
Minimum 1 1 1 1 1 1 1 1 1 1 1 Maximum 5 5 5 5 5 5 5 5 5 5 5
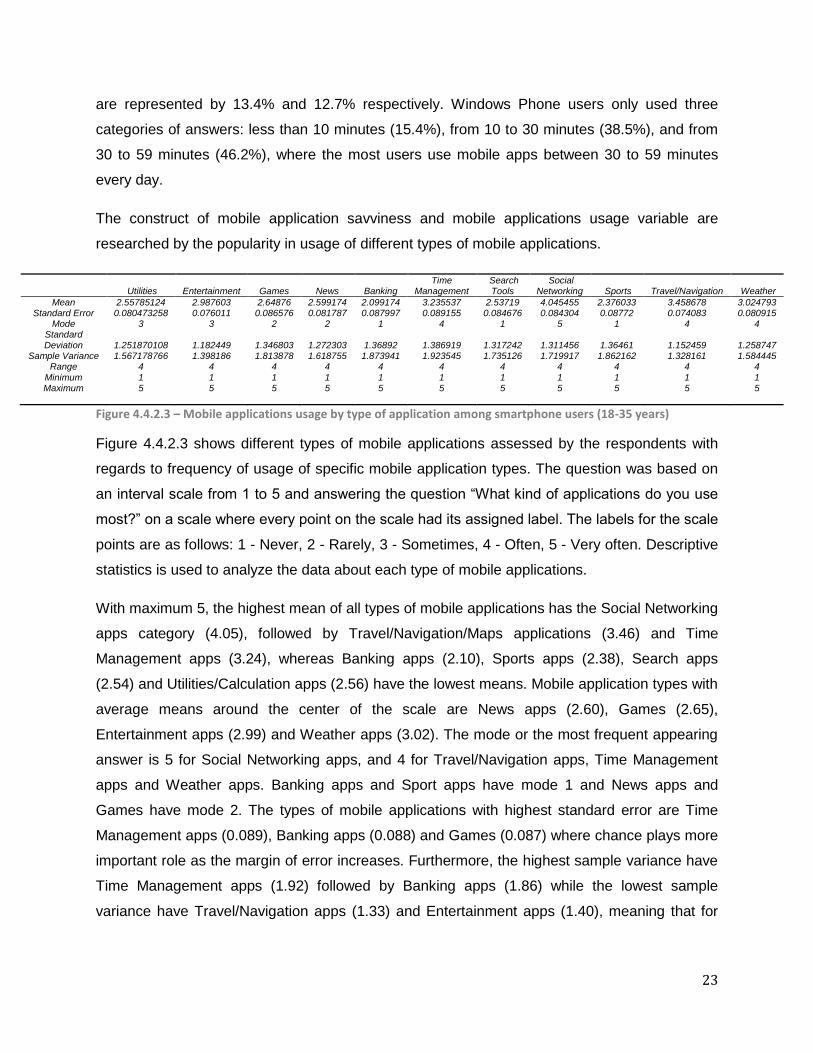
Figure 4.4.2.3 – Mobile applications usage by type of application among smartphone users (18-35 years)
Figure 4.4.2.3 shows different types of mobile applications assessed by the respondents with
regards to frequency of usage of specific mobile application types. The question was based on
an interval scale from 1 to 5 and answering the question “What kind of applications do you use
most?” on a scale where every point on the scale had its assigned label. The labels for the scale
points are as follows: 1 - Never, 2 - Rarely, 3 - Sometimes, 4 - Often, 5 - Very often. Descriptive
statistics is used to analyze the data about each type of mobile applications.
With maximum 5, the highest mean of all types of mobile applications has the Social Networking
apps category (4.05), followed by Travel/Navigation/Maps applications (3.46) and Time
Management apps (3.24), whereas Banking apps (2.10), Sports apps (2.38), Search apps
(2.54) and Utilities/Calculation apps (2.56) have the lowest means. Mobile application types with
average means around the center of the scale are News apps (2.60), Games (2.65),
Entertainment apps (2.99) and Weather apps (3.02). The mode or the most frequent appearing
answer is 5 for Social Networking apps, and 4 for Travel/Navigation apps, Time Management
apps and Weather apps. Banking apps and Sport apps have mode 1 and News apps and
Games have mode 2. The types of mobile applications with highest standard error are Time
Management apps (0.089), Banking apps (0.088) and Games (0.087) where chance plays more
important role as the margin of error increases. Furthermore, the highest sample variance have
Time Management apps (1.92) followed by Banking apps (1.86) while the lowest sample
variance have Travel/Navigation apps (1.33) and Entertainment apps (1.40), meaning that for
24
the categories with lower sample variance the data have more accurate results due to the fact
the results don’t vary that much.
4.4.3 READINESS TO PAY FOR APPS The research assesses the readiness to pay for apps in three different ways; whether the
respondent have ever made an in-app purchase or purchased an app, what is the general
preference trend in free/paid apps and how much are the respondents willing to pay for a
premium app.
The first factor was to find out what is the percentage of 18-35 years old smartphone users that
purchased an app or made in-app purchase.
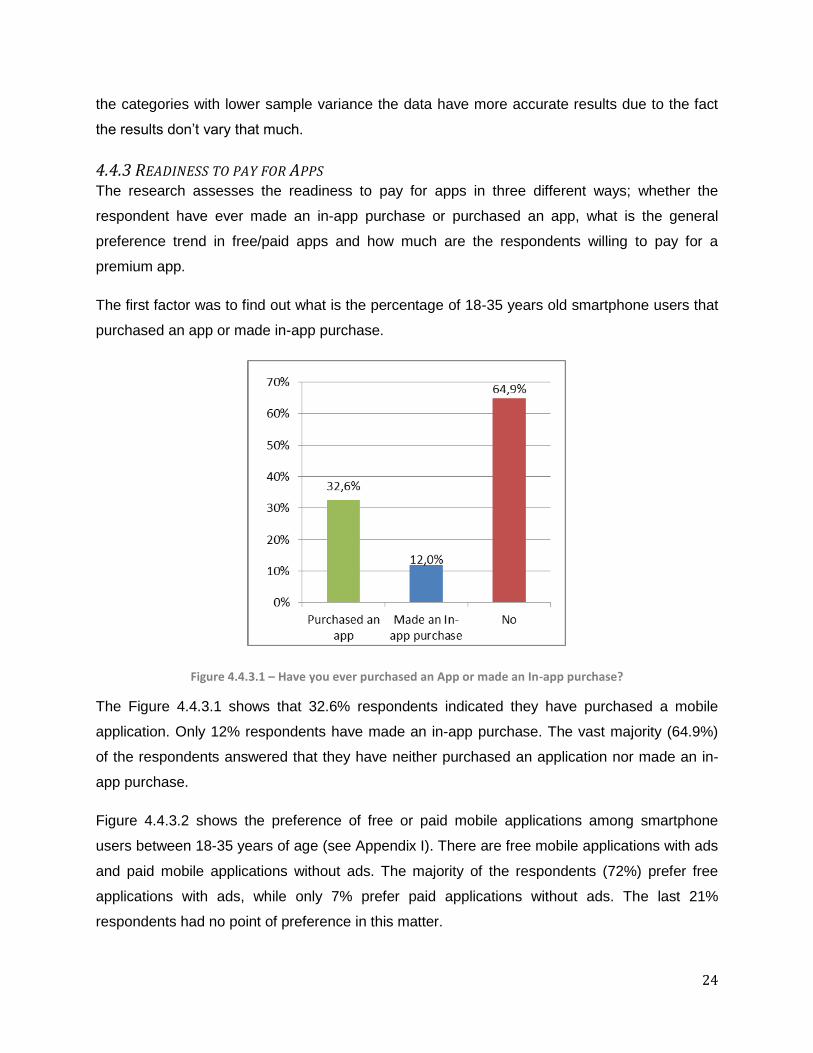
Figure 4.4.3.1 – Have you ever purchased an App or made an In-app purchase?
The Figure 4.4.3.1 shows that 32.6% respondents indicated they have purchased a mobile
application. Only 12% respondents have made an in-app purchase. The vast majority (64.9%)
of the respondents answered that they have neither purchased an application nor made an in-
app purchase.
Figure 4.4.3.2 shows the preference of free or paid mobile applications among smartphone
users between 18-35 years of age (see Appendix I). There are free mobile applications with ads
and paid mobile applications without ads. The majority of the respondents (72%) prefer free
applications with ads, while only 7% prefer paid applications without ads. The last 21%
respondents had no point of preference in this matter.
25
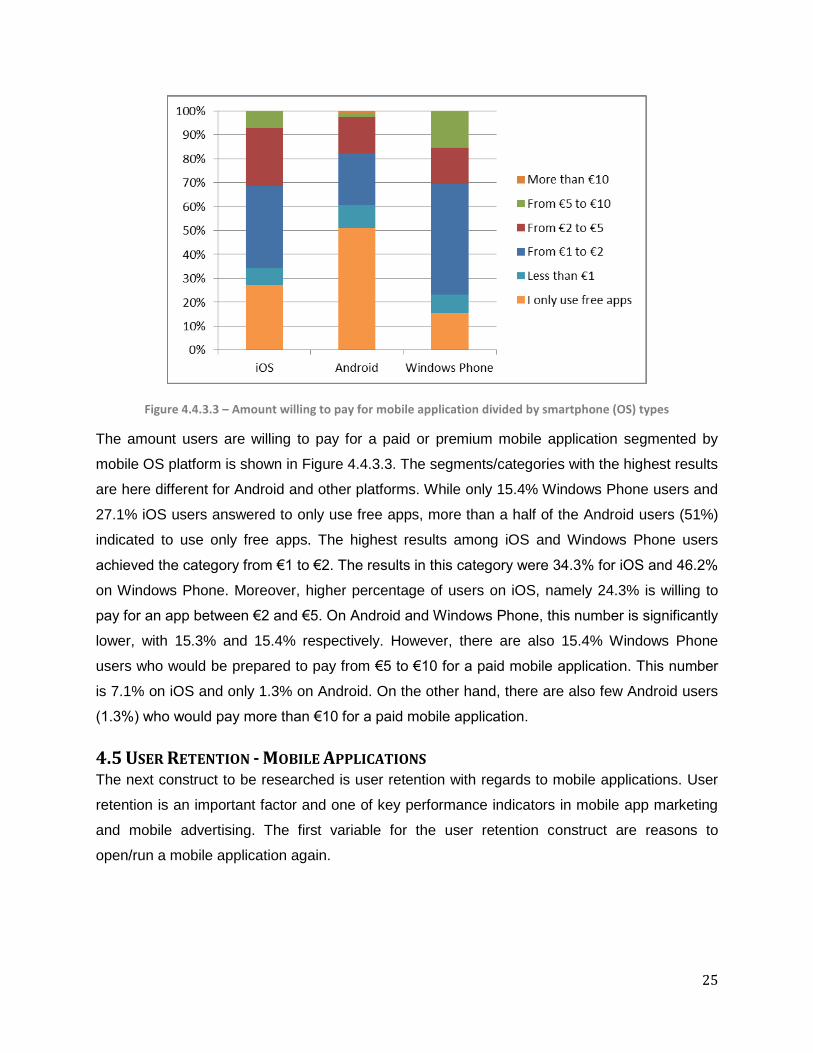
Figure 4.4.3.3 – Amount willing to pay for mobile application divided by smartphone (OS) types
The amount users are willing to pay for a paid or premium mobile application segmented by
mobile OS platform is shown in Figure 4.4.3.3. The segments/categories with the highest results
are here different for Android and other platforms. While only 15.4% Windows Phone users and
27.1% iOS users answered to only use free apps, more than a half of the Android users (51%)
indicated to use only free apps. The highest results among iOS and Windows Phone users
achieved the category from €1 to €2. The results in this category were 34.3% for iOS and 46.2%
on Windows Phone. Moreover, higher percentage of users on iOS, namely 24.3% is willing to
pay for an app between €2 and €5. On Android and Windows Phone, this number is significantly
lower, with 15.3% and 15.4% respectively. However, there are also 15.4% Windows Phone
users who would be prepared to pay from €5 to €10 for a paid mobile application. This number
is 7.1% on iOS and only 1.3% on Android. On the other hand, there are also few Android users
(1.3%) who would pay more than €10 for a paid mobile application.
4.5 USER RETENTION - MOBILE APPLICATIONS The next construct to be researched is user retention with regards to mobile applications. User
retention is an important factor and one of key performance indicators in mobile app marketing
and mobile advertising. The first variable for the user retention construct are reasons to
open/run a mobile application again.
26
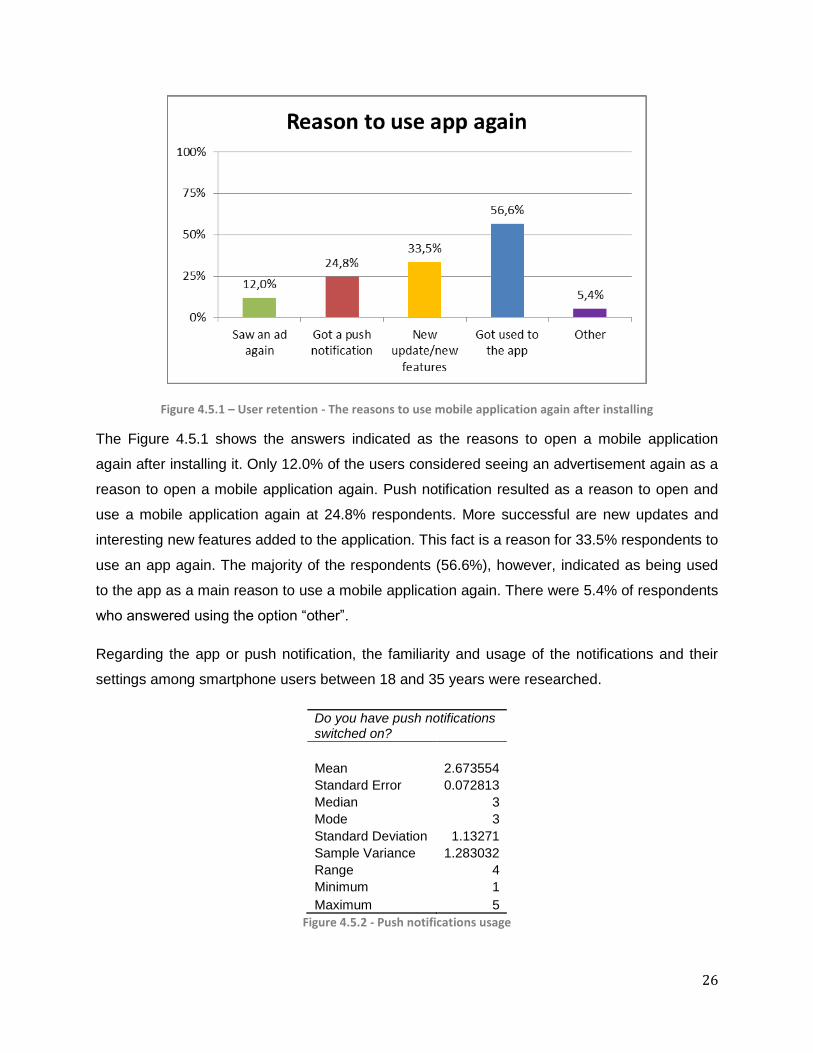
Figure 4.5.1 – User retention - The reasons to use mobile application again after installing
The Figure 4.5.1 shows the answers indicated as the reasons to open a mobile application
again after installing it. Only 12.0% of the users considered seeing an advertisement again as a
reason to open a mobile application again. Push notification resulted as a reason to open and
use a mobile application again at 24.8% respondents. More successful are new updates and
interesting new features added to the application. This fact is a reason for 33.5% respondents to
use an app again. The majority of the respondents (56.6%), however, indicated as being used
to the app as a main reason to use a mobile application again. There were 5.4% of respondents
who answered using the option “other”.
Regarding the app or push notification, the familiarity and usage of the notifications and their
settings among smartphone users between 18 and 35 years were researched.
Do you have push notifications switched on?
Mean 2.673554
Standard Error 0.072813
Median 3
Mode 3
Standard Deviation 1.13271
Sample Variance 1.283032
Range 4
Minimum 1
Maximum 5
Figure 4.5.2 - Push notifications usage
27
The results from Figure 4.5.1 indicated that mobile app (push) notifications resulted as reason to
open an app again at 24.8% respondents. Figure 4.5.2 shows how intensive is the usage of
push notifications among smartphone users between 18 and 35 years of age. The interval scale
for push notification usage was defined using 5 numerical options (from 1 to 5), 1 meaning to
never use and switch off all app notifications and 5 meaning having all notifications always
turned on. Therefore an interval measurement level is being used. The table additionally shows
mean, standard error, median, mode standard deviation, sample variance and range. Median,
or the middle value, is 3 in this case. Mode is also 3 in this case, being the value that appears
most often in a set of data, in this case responses/results. Mean is the standard average and for
this set of data, its value is 2.67.
The relation of the mean of 2.67 to the bar graph in Figure 4.5.1 would mean that roughly 40%
of the users have mobile app (push) notifications more often than not and relates to the results
in Figure 4.5.1 that 24.8% respondents consider push notification being a reason for using a
mobile app again. This would mean a little more than a half of the users who actually use push
notification consider it a reason to use an app again.
The sample variance indicates how far the scores are spread out from the mean. Variance for
this set of data is 1.28. The standard error is an important measure for determining the margin
of error. The standard error for this set of data is 0.73 meaning how important role chance plays
in within given results.
In order to properly analyze the significance of various user retentions factors for mobile
marketing, reasons for regular app usage have been researched. The reasons for regular
mobile applications usage were determined as app having changing or renewing content,
possibility to create content in the app, possibility to customize the app, and other.
28
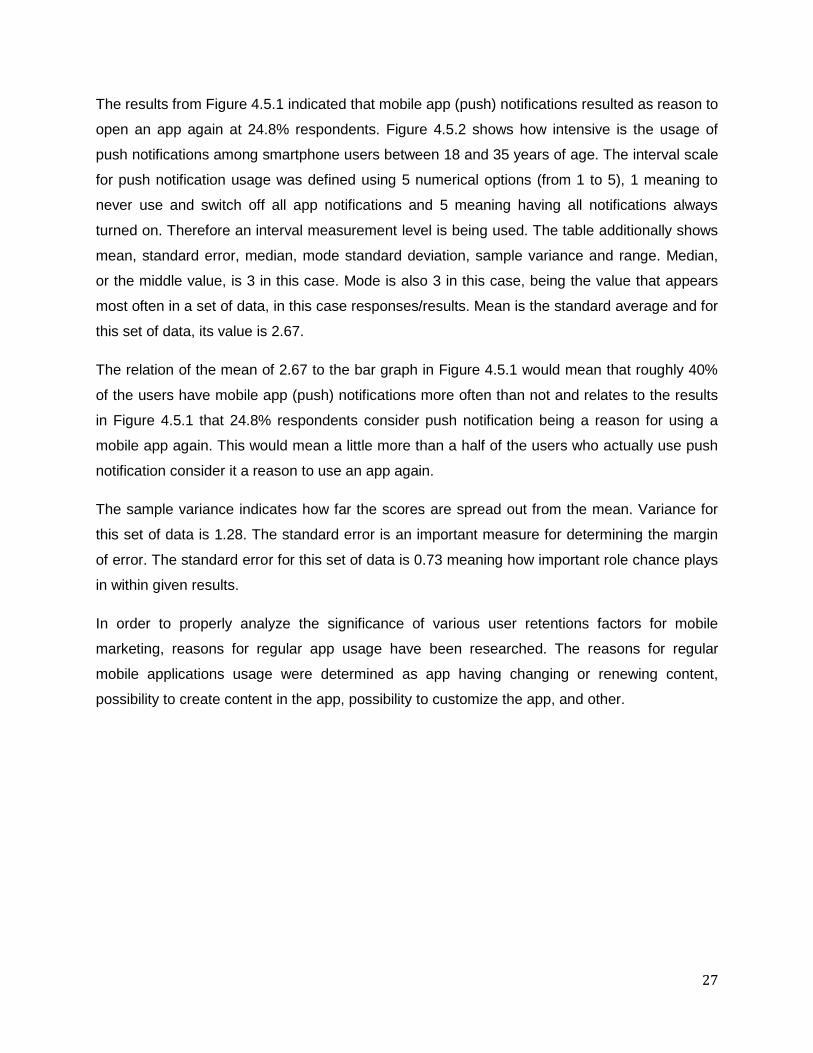
Figure 4.5.3 – User retention - Factors for regular mobile applications usage among smartphone users (18-35)
The highest response rate (53.3%) had changing or renewing content as a reason for regular
app use. Both possibilities to create own content in the app and possibility to customize the app
were equally important with both scoring 28.9%. Significant number of respondents answered
with the option “other”, representing mostly communication purpose and usefulness as reasons
to use an app regularly. Another 12.4% of the respondents answered to not use mobile
applications regularly.
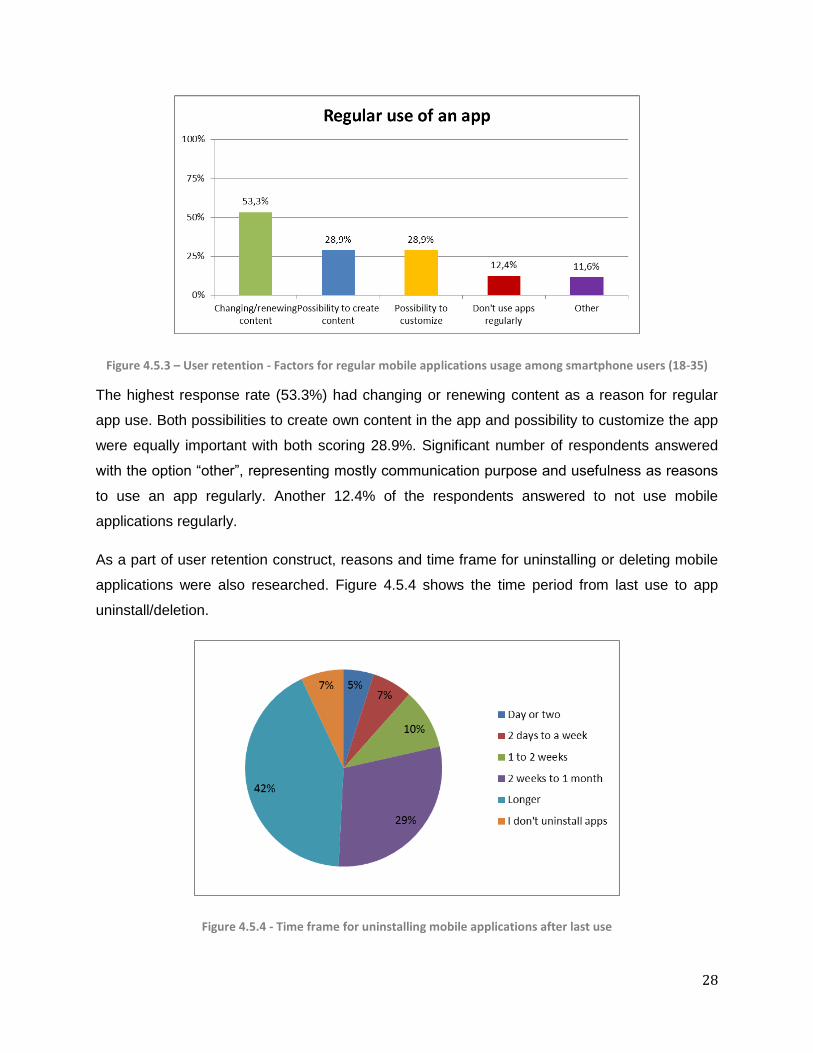
As a part of user retention construct, reasons and time frame for uninstalling or deleting mobile
applications were also researched. Figure 4.5.4 shows the time period from last use to app
uninstall/deletion.
Figure 4.5.4 - Time frame for uninstalling mobile applications after last use
29
Most respondents (71%) only uninstall mobile applications after not using them for more than 2
weeks. This number is split in the research into two categories; 2 weeks to a month and longer
than 1 month. The percentage split was 29% and 42%, respectively. The third most common
response was 1 to 2 weeks with 10%. There are 12% of mobile applications users who uninstall
their applications within a week of not using them. The 12% consist of 5% of respondents who
delete their mobile application after a day or two of not using them and 7% respondents who
delete their apps between 2 days and a week. There are 7% users who don’t uninstall apps at
all.
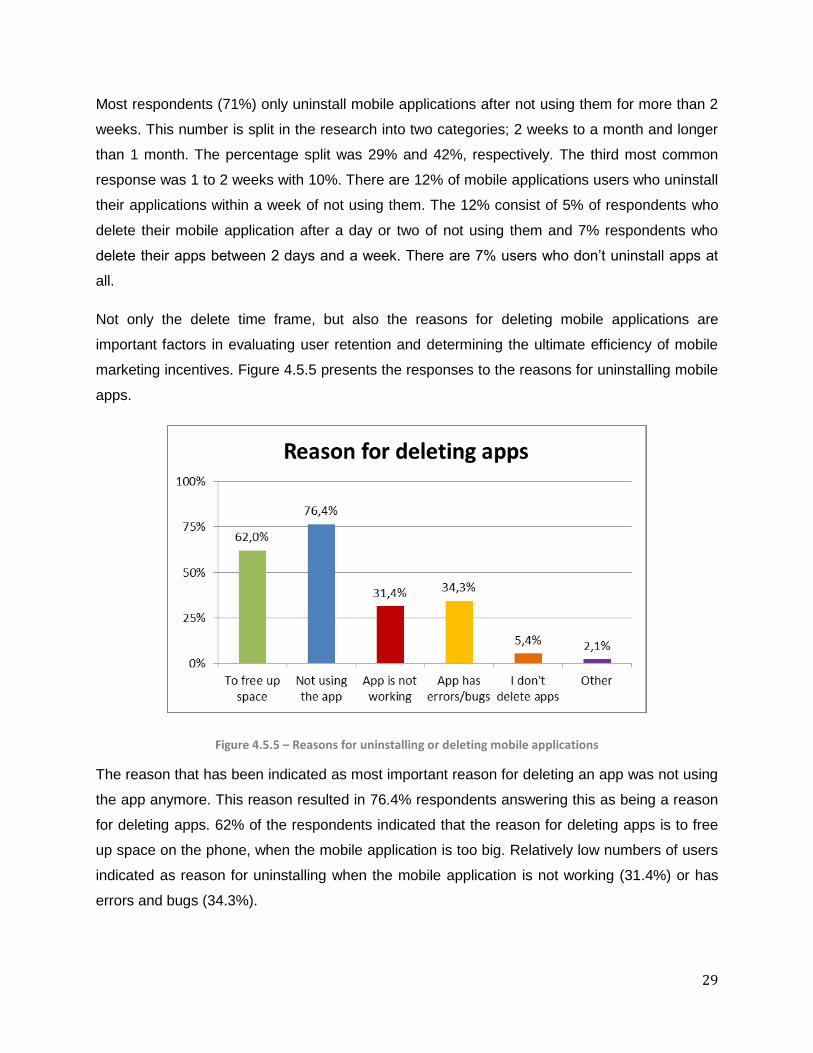
Not only the delete time frame, but also the reasons for deleting mobile applications are
important factors in evaluating user retention and determining the ultimate efficiency of mobile
marketing incentives. Figure 4.5.5 presents the responses to the reasons for uninstalling mobile
apps.
Figure 4.5.5 – Reasons for uninstalling or deleting mobile applications
The reason that has been indicated as most important reason for deleting an app was not using
the app anymore. This reason resulted in 76.4% respondents answering this as being a reason
for deleting apps. 62% of the respondents indicated that the reason for deleting apps is to free
up space on the phone, when the mobile application is too big. Relatively low numbers of users
indicated as reason for uninstalling when the mobile application is not working (31.4%) or has
errors and bugs (34.3%).
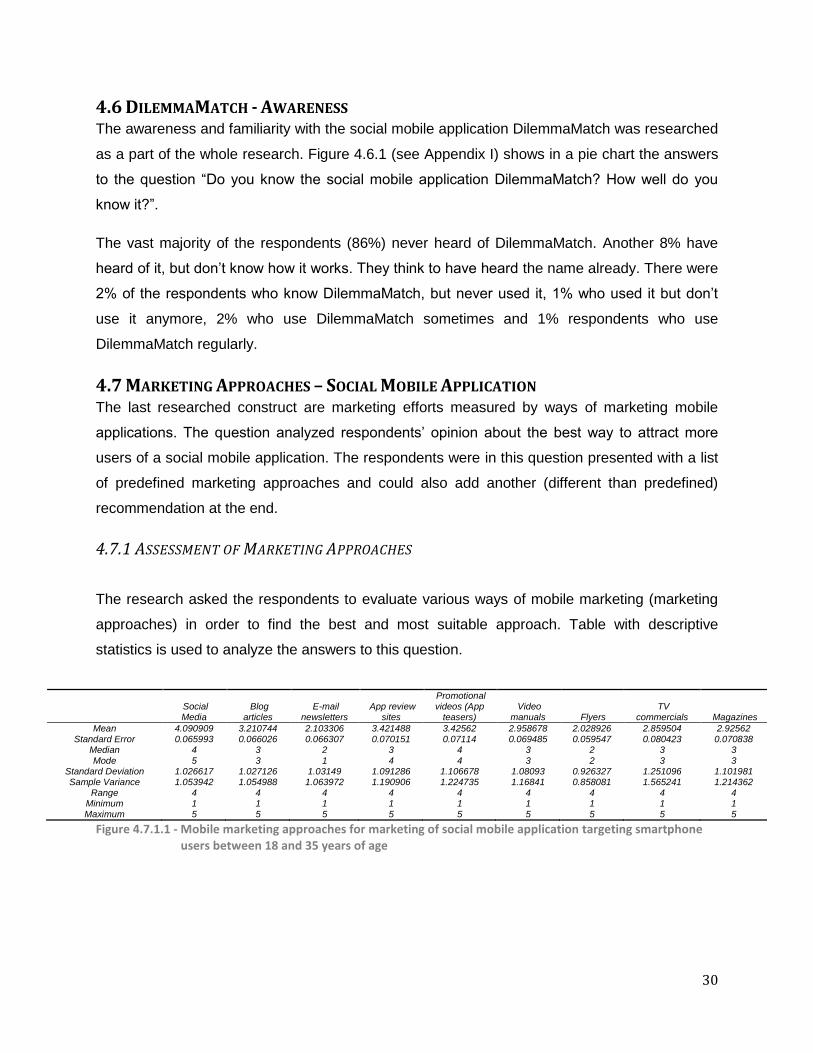
30
4.6 DILEMMAMATCH - AWARENESS The awareness and familiarity with the social mobile application DilemmaMatch was researched
as a part of the whole research. Figure 4.6.1 (see Appendix I) shows in a pie chart the answers
to the question “Do you know the social mobile application DilemmaMatch? How well do you
know it?”.
The vast majority of the respondents (86%) never heard of DilemmaMatch. Another 8% have
heard of it, but don’t know how it works. They think to have heard the name already. There were
2% of the respondents who know DilemmaMatch, but never used it, 1% who used it but don’t
use it anymore, 2% who use DilemmaMatch sometimes and 1% respondents who use
DilemmaMatch regularly.
4.7 MARKETING APPROACHES – SOCIAL MOBILE APPLICATION The last researched construct are marketing efforts measured by ways of marketing mobile
applications. The question analyzed respondents’ opinion about the best way to attract more
users of a social mobile application. The respondents were in this question presented with a list
of predefined marketing approaches and could also add another (different than predefined)
recommendation at the end.
4.7.1 ASSESSMENT OF MARKETING APPROACHES
The research asked the respondents to evaluate various ways of mobile marketing (marketing
approaches) in order to find the best and most suitable approach. Table with descriptive
statistics is used to analyze the answers to this question.
Figure 4.7.1.1 - Mobile marketing approaches for marketing of social mobile application targeting smartphone users between 18 and 35 years of age
Social Media
Blog articles
E-mail newsletters
App review sites
Promotional videos (App
teasers) Video
manuals Flyers TV
commercials Magazines
Mean 4.090909 3.210744 2.103306 3.421488 3.42562 2.958678 2.028926 2.859504 2.92562 Standard Error 0.065993 0.066026 0.066307 0.070151 0.07114 0.069485 0.059547 0.080423 0.070838
Median 4 3 2 3 4 3 2 3 3
Mode 5 3 1 4 4 3 2 3 3 Standard Deviation 1.026617 1.027126 1.03149 1.091286 1.106678 1.08093 0.926327 1.251096 1.101981 Sample Variance 1.053942 1.054988 1.063972 1.190906 1.224735 1.16841 0.858081 1.565241 1.214362
Range 4 4 4 4 4 4 4 4 4 Minimum 1 1 1 1 1 1 1 1 1 Maximum 5 5 5 5 5 5 5 5 5
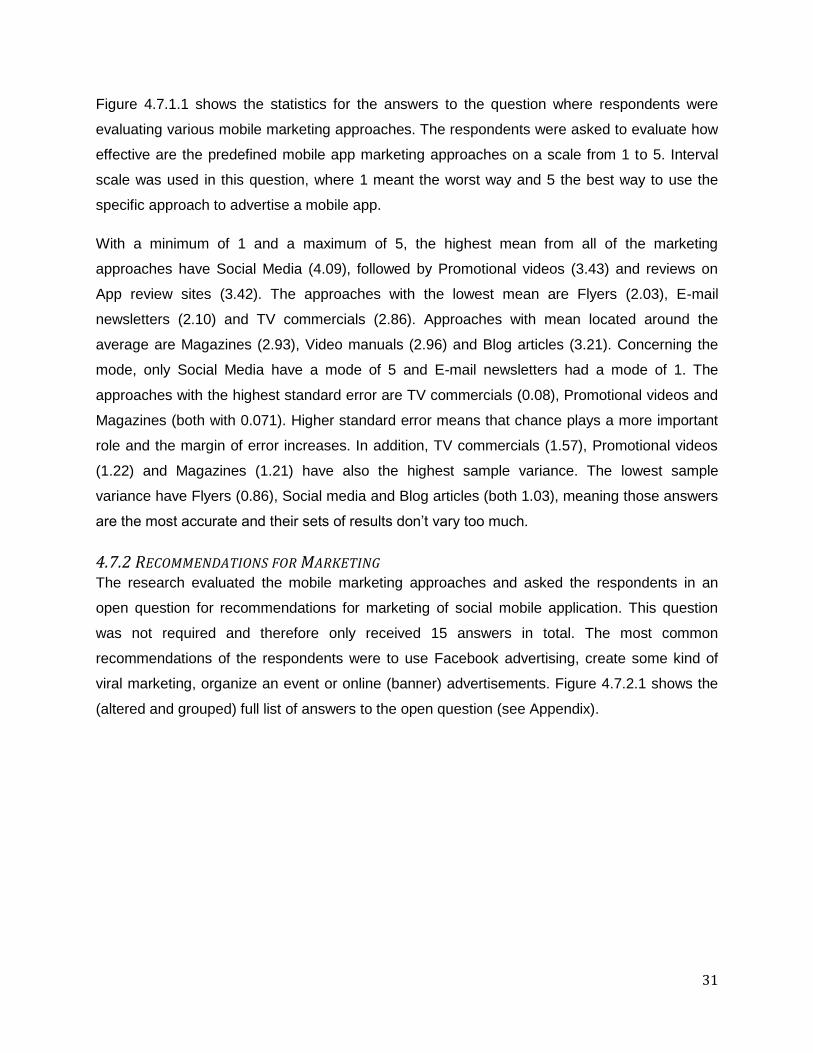
31
Figure 4.7.1.1 shows the statistics for the answers to the question where respondents were
evaluating various mobile marketing approaches. The respondents were asked to evaluate how
effective are the predefined mobile app marketing approaches on a scale from 1 to 5. Interval
scale was used in this question, where 1 meant the worst way and 5 the best way to use the
specific approach to advertise a mobile app.
With a minimum of 1 and a maximum of 5, the highest mean from all of the marketing
approaches have Social Media (4.09), followed by Promotional videos (3.43) and reviews on
App review sites (3.42). The approaches with the lowest mean are Flyers (2.03), E-mail
newsletters (2.10) and TV commercials (2.86). Approaches with mean located around the
average are Magazines (2.93), Video manuals (2.96) and Blog articles (3.21). Concerning the
mode, only Social Media have a mode of 5 and E-mail newsletters had a mode of 1. The
approaches with the highest standard error are TV commercials (0.08), Promotional videos and
Magazines (both with 0.071). Higher standard error means that chance plays a more important
role and the margin of error increases. In addition, TV commercials (1.57), Promotional videos
(1.22) and Magazines (1.21) have also the highest sample variance. The lowest sample
variance have Flyers (0.86), Social media and Blog articles (both 1.03), meaning those answers
are the most accurate and their sets of results don’t vary too much.
4.7.2 RECOMMENDATIONS FOR MARKETING The research evaluated the mobile marketing approaches and asked the respondents in an
open question for recommendations for marketing of social mobile application. This question
was not required and therefore only received 15 answers in total. The most common
recommendations of the respondents were to use Facebook advertising, create some kind of
viral marketing, organize an event or online (banner) advertisements. Figure 4.7.2.1 shows the
(altered and grouped) full list of answers to the open question (see Appendix).
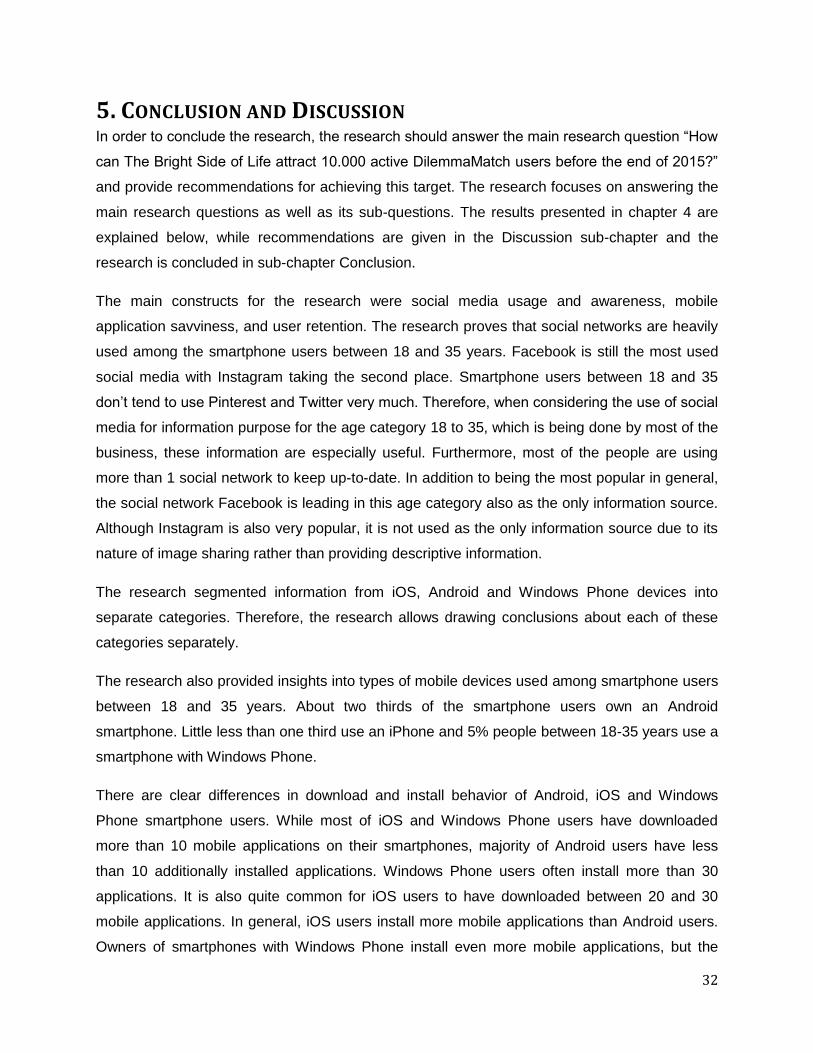
32
5. CONCLUSION AND DISCUSSION In order to conclude the research, the research should answer the main research question “How
can The Bright Side of Life attract 10.000 active DilemmaMatch users before the end of 2015?”
and provide recommendations for achieving this target. The research focuses on answering the
main research questions as well as its sub-questions. The results presented in chapter 4 are
explained below, while recommendations are given in the Discussion sub-chapter and the
research is concluded in sub-chapter Conclusion.
The main constructs for the research were social media usage and awareness, mobile
application savviness, and user retention. The research proves that social networks are heavily
used among the smartphone users between 18 and 35 years. Facebook is still the most used
social media with Instagram taking the second place. Smartphone users between 18 and 35
don’t tend to use Pinterest and Twitter very much. Therefore, when considering the use of social
media for information purpose for the age category 18 to 35, which is being done by most of the
business, these information are especially useful. Furthermore, most of the people are using
more than 1 social network to keep up-to-date. In addition to being the most popular in general,
the social network Facebook is leading in this age category also as the only information source.
Although Instagram is also very popular, it is not used as the only information source due to its
nature of image sharing rather than providing descriptive information.
The research segmented information from iOS, Android and Windows Phone devices into
separate categories. Therefore, the research allows drawing conclusions about each of these
categories separately.
The research also provided insights into types of mobile devices used among smartphone users
between 18 and 35 years. About two thirds of the smartphone users own an Android
smartphone. Little less than one third use an iPhone and 5% people between 18-35 years use a
smartphone with Windows Phone.
There are clear differences in download and install behavior of Android, iOS and Windows
Phone smartphone users. While most of iOS and Windows Phone users have downloaded
more than 10 mobile applications on their smartphones, majority of Android users have less
than 10 additionally installed applications. Windows Phone users often install more than 30
applications. It is also quite common for iOS users to have downloaded between 20 and 30
mobile applications. In general, iOS users install more mobile applications than Android users.
Owners of smartphones with Windows Phone install even more mobile applications, but the
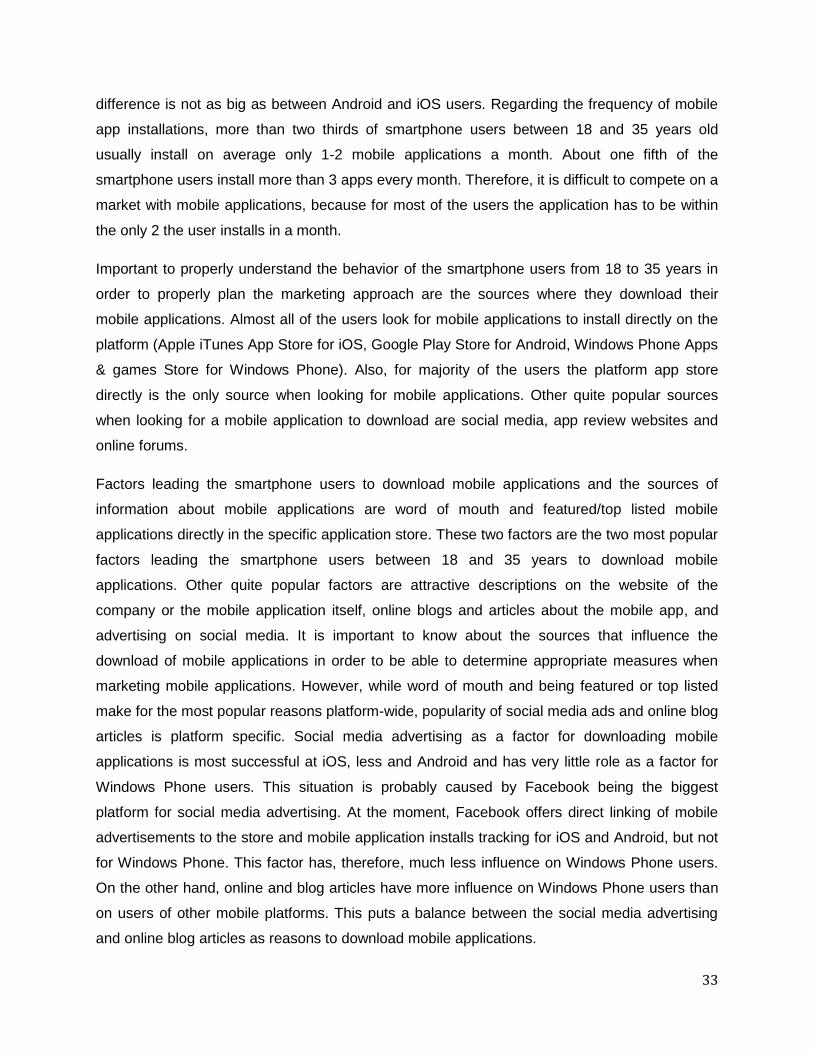
33
difference is not as big as between Android and iOS users. Regarding the frequency of mobile
app installations, more than two thirds of smartphone users between 18 and 35 years old
usually install on average only 1-2 mobile applications a month. About one fifth of the
smartphone users install more than 3 apps every month. Therefore, it is difficult to compete on a
market with mobile applications, because for most of the users the application has to be within
the only 2 the user installs in a month.
Important to properly understand the behavior of the smartphone users from 18 to 35 years in
order to properly plan the marketing approach are the sources where they download their
mobile applications. Almost all of the users look for mobile applications to install directly on the
platform (Apple iTunes App Store for iOS, Google Play Store for Android, Windows Phone Apps
& games Store for Windows Phone). Also, for majority of the users the platform app store
directly is the only source when looking for mobile applications. Other quite popular sources
when looking for a mobile application to download are social media, app review websites and
online forums.
Factors leading the smartphone users to download mobile applications and the sources of
information about mobile applications are word of mouth and featured/top listed mobile
applications directly in the specific application store. These two factors are the two most popular
factors leading the smartphone users between 18 and 35 years to download mobile
applications. Other quite popular factors are attractive descriptions on the website of the
company or the mobile application itself, online blogs and articles about the mobile app, and
advertising on social media. It is important to know about the sources that influence the
download of mobile applications in order to be able to determine appropriate measures when
marketing mobile applications. However, while word of mouth and being featured or top listed
make for the most popular reasons platform-wide, popularity of social media ads and online blog
articles is platform specific. Social media advertising as a factor for downloading mobile
applications is most successful at iOS, less and Android and has very little role as a factor for
Windows Phone users. This situation is probably caused by Facebook being the biggest
platform for social media advertising. At the moment, Facebook offers direct linking of mobile
advertisements to the store and mobile application installs tracking for iOS and Android, but not
for Windows Phone. This factor has, therefore, much less influence on Windows Phone users.
On the other hand, online and blog articles have more influence on Windows Phone users than
on users of other mobile platforms. This puts a balance between the social media advertising
and online blog articles as reasons to download mobile applications.
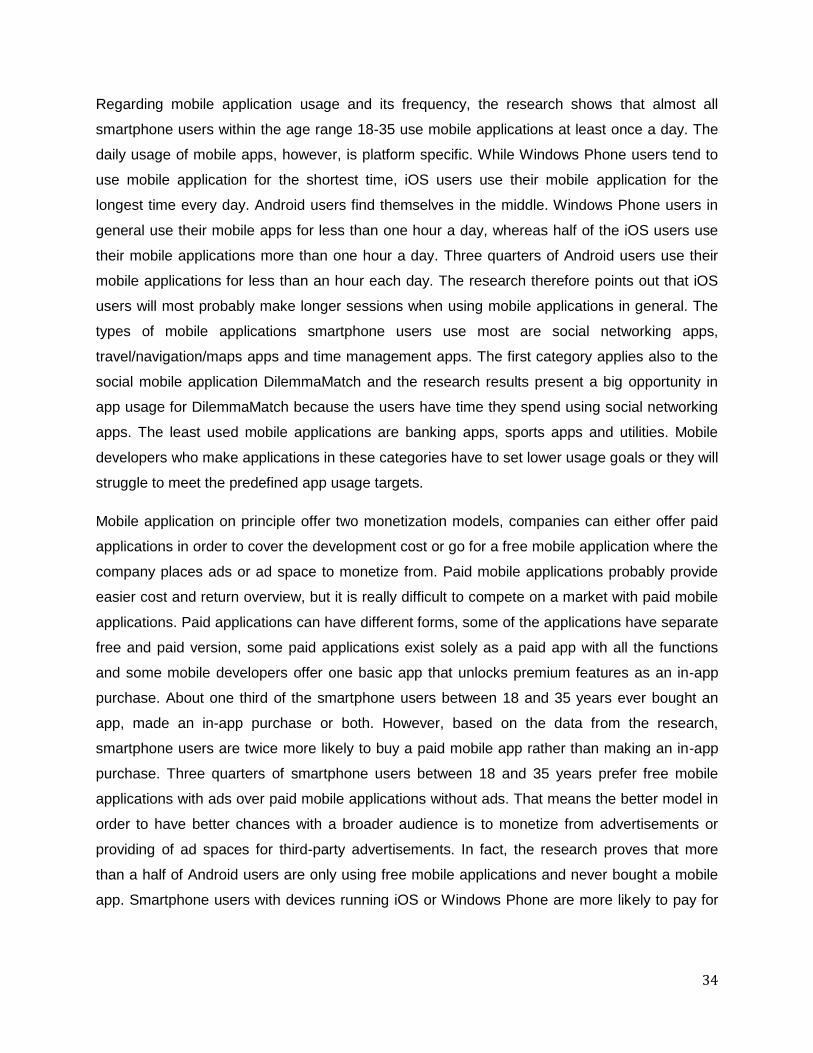
34
Regarding mobile application usage and its frequency, the research shows that almost all
smartphone users within the age range 18-35 use mobile applications at least once a day. The
daily usage of mobile apps, however, is platform specific. While Windows Phone users tend to
use mobile application for the shortest time, iOS users use their mobile application for the
longest time every day. Android users find themselves in the middle. Windows Phone users in
general use their mobile apps for less than one hour a day, whereas half of the iOS users use
their mobile applications more than one hour a day. Three quarters of Android users use their
mobile applications for less than an hour each day. The research therefore points out that iOS
users will most probably make longer sessions when using mobile applications in general. The
types of mobile applications smartphone users use most are social networking apps,
travel/navigation/maps apps and time management apps. The first category applies also to the
social mobile application DilemmaMatch and the research results present a big opportunity in
app usage for DilemmaMatch because the users have time they spend using social networking
apps. The least used mobile applications are banking apps, sports apps and utilities. Mobile
developers who make applications in these categories have to set lower usage goals or they will
struggle to meet the predefined app usage targets.
Mobile application on principle offer two monetization models, companies can either offer paid
applications in order to cover the development cost or go for a free mobile application where the
company places ads or ad space to monetize from. Paid mobile applications probably provide
easier cost and return overview, but it is really difficult to compete on a market with paid mobile
applications. Paid applications can have different forms, some of the applications have separate
free and paid version, some paid applications exist solely as a paid app with all the functions
and some mobile developers offer one basic app that unlocks premium features as an in-app
purchase. About one third of the smartphone users between 18 and 35 years ever bought an
app, made an in-app purchase or both. However, based on the data from the research,
smartphone users are twice more likely to buy a paid mobile app rather than making an in-app
purchase. Three quarters of smartphone users between 18 and 35 years prefer free mobile
applications with ads over paid mobile applications without ads. That means the better model in
order to have better chances with a broader audience is to monetize from advertisements or
providing of ad spaces for third-party advertisements. In fact, the research proves that more
than a half of Android users are only using free mobile applications and never bought a mobile
app. Smartphone users with devices running iOS or Windows Phone are more likely to pay for
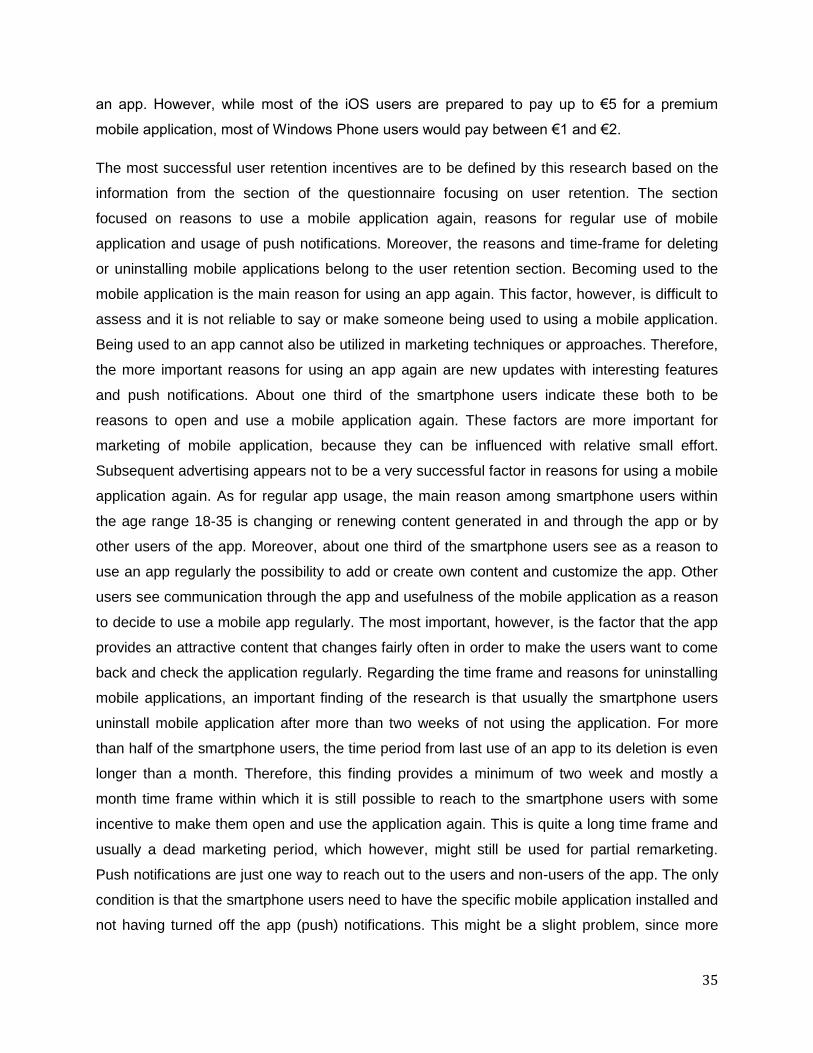
35
an app. However, while most of the iOS users are prepared to pay up to €5 for a premium
mobile application, most of Windows Phone users would pay between €1 and €2.
The most successful user retention incentives are to be defined by this research based on the
information from the section of the questionnaire focusing on user retention. The section
focused on reasons to use a mobile application again, reasons for regular use of mobile
application and usage of push notifications. Moreover, the reasons and time-frame for deleting
or uninstalling mobile applications belong to the user retention section. Becoming used to the
mobile application is the main reason for using an app again. This factor, however, is difficult to
assess and it is not reliable to say or make someone being used to using a mobile application.
Being used to an app cannot also be utilized in marketing techniques or approaches. Therefore,
the more important reasons for using an app again are new updates with interesting features
and push notifications. About one third of the smartphone users indicate these both to be
reasons to open and use a mobile application again. These factors are more important for
marketing of mobile application, because they can be influenced with relative small effort.
Subsequent advertising appears not to be a very successful factor in reasons for using a mobile
application again. As for regular app usage, the main reason among smartphone users within
the age range 18-35 is changing or renewing content generated in and through the app or by
other users of the app. Moreover, about one third of the smartphone users see as a reason to
use an app regularly the possibility to add or create own content and customize the app. Other
users see communication through the app and usefulness of the mobile application as a reason
to decide to use a mobile app regularly. The most important, however, is the factor that the app
provides an attractive content that changes fairly often in order to make the users want to come
back and check the application regularly. Regarding the time frame and reasons for uninstalling
mobile applications, an important finding of the research is that usually the smartphone users
uninstall mobile application after more than two weeks of not using the application. For more
than half of the smartphone users, the time period from last use of an app to its deletion is even
longer than a month. Therefore, this finding provides a minimum of two week and mostly a
month time frame within which it is still possible to reach to the smartphone users with some
incentive to make them open and use the application again. This is quite a long time frame and
usually a dead marketing period, which however, might still be used for partial remarketing.
Push notifications are just one way to reach out to the users and non-users of the app. The only
condition is that the smartphone users need to have the specific mobile application installed and
not having turned off the app (push) notifications. This might be a slight problem, since more
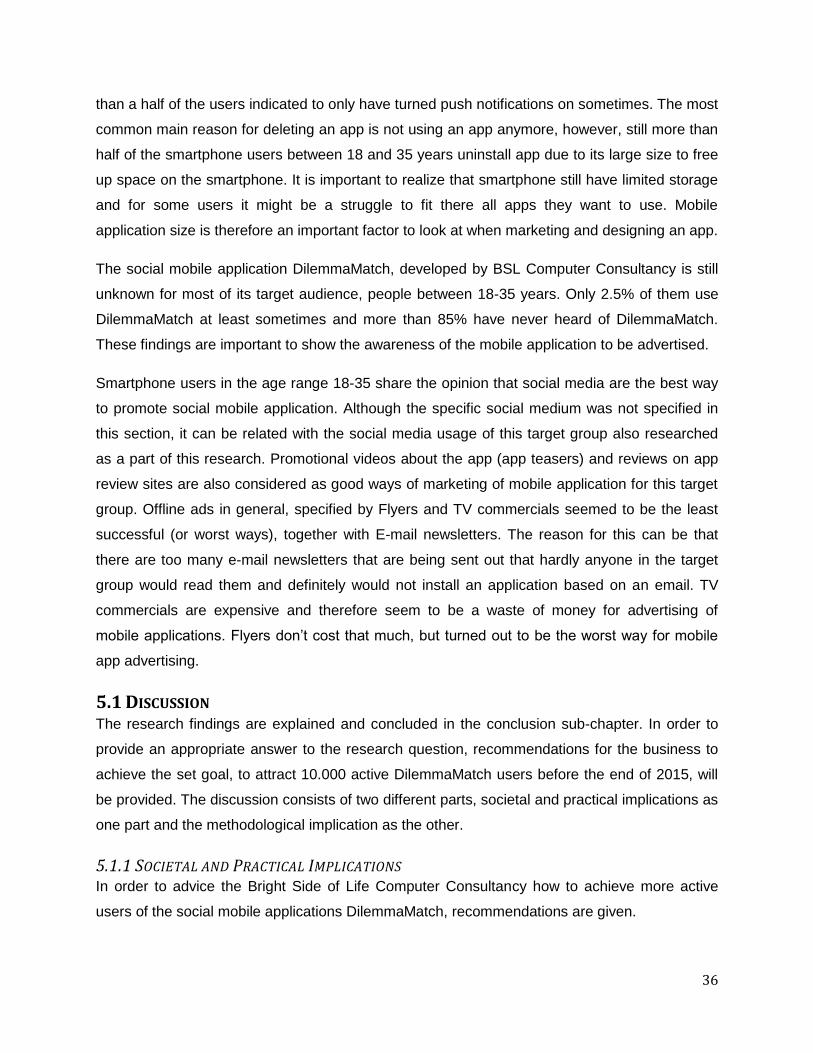
36
than a half of the users indicated to only have turned push notifications on sometimes. The most
common main reason for deleting an app is not using an app anymore, however, still more than
half of the smartphone users between 18 and 35 years uninstall app due to its large size to free
up space on the smartphone. It is important to realize that smartphone still have limited storage
and for some users it might be a struggle to fit there all apps they want to use. Mobile
application size is therefore an important factor to look at when marketing and designing an app.
The social mobile application DilemmaMatch, developed by BSL Computer Consultancy is still
unknown for most of its target audience, people between 18-35 years. Only 2.5% of them use
DilemmaMatch at least sometimes and more than 85% have never heard of DilemmaMatch.
These findings are important to show the awareness of the mobile application to be advertised.
Smartphone users in the age range 18-35 share the opinion that social media are the best way
to promote social mobile application. Although the specific social medium was not specified in
this section, it can be related with the social media usage of this target group also researched
as a part of this research. Promotional videos about the app (app teasers) and reviews on app
review sites are also considered as good ways of marketing of mobile application for this target
group. Offline ads in general, specified by Flyers and TV commercials seemed to be the least
successful (or worst ways), together with E-mail newsletters. The reason for this can be that
there are too many e-mail newsletters that are being sent out that hardly anyone in the target
group would read them and definitely would not install an application based on an email. TV
commercials are expensive and therefore seem to be a waste of money for advertising of
mobile applications. Flyers don’t cost that much, but turned out to be the worst way for mobile
app advertising.
5.1 DISCUSSION The research findings are explained and concluded in the conclusion sub-chapter. In order to
provide an appropriate answer to the research question, recommendations for the business to
achieve the set goal, to attract 10.000 active DilemmaMatch users before the end of 2015, will
be provided. The discussion consists of two different parts, societal and practical implications as
one part and the methodological implication as the other.
5.1.1 SOCIETAL AND PRACTICAL IMPLICATIONS In order to advice the Bright Side of Life Computer Consultancy how to achieve more active
users of the social mobile applications DilemmaMatch, recommendations are given.
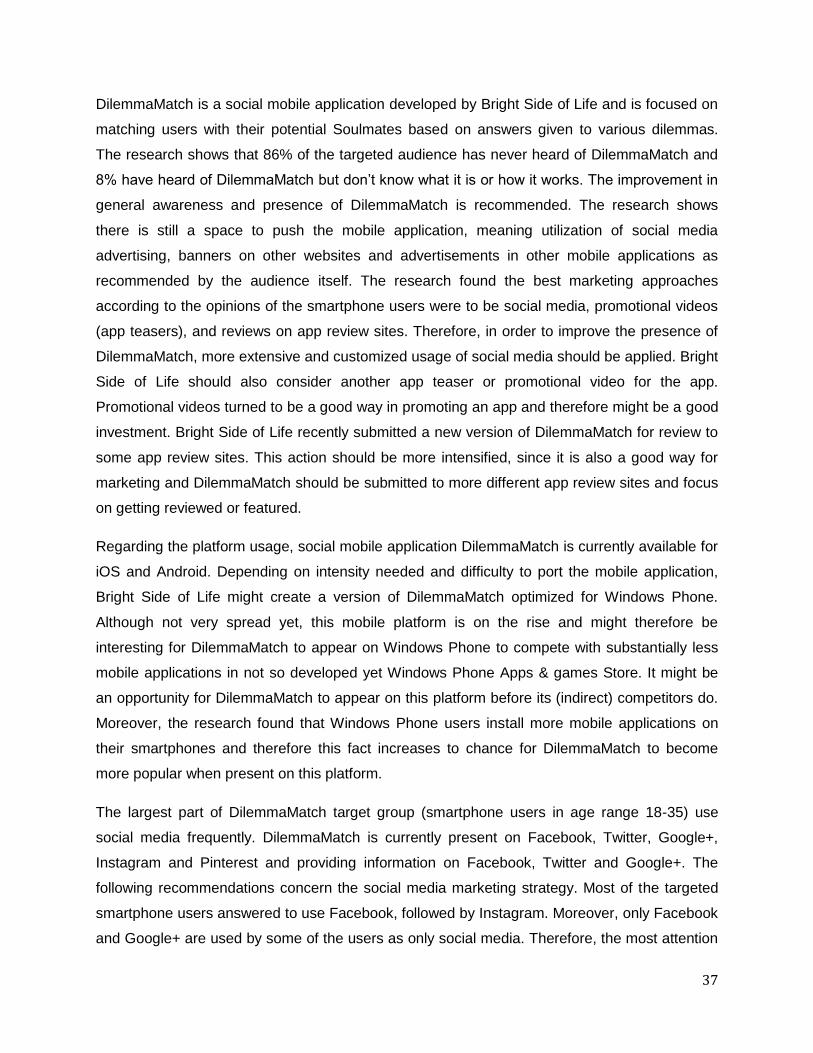
37
DilemmaMatch is a social mobile application developed by Bright Side of Life and is focused on
matching users with their potential Soulmates based on answers given to various dilemmas.
The research shows that 86% of the targeted audience has never heard of DilemmaMatch and
8% have heard of DilemmaMatch but don’t know what it is or how it works. The improvement in
general awareness and presence of DilemmaMatch is recommended. The research shows
there is still a space to push the mobile application, meaning utilization of social media
advertising, banners on other websites and advertisements in other mobile applications as
recommended by the audience itself. The research found the best marketing approaches
according to the opinions of the smartphone users were to be social media, promotional videos
(app teasers), and reviews on app review sites. Therefore, in order to improve the presence of
DilemmaMatch, more extensive and customized usage of social media should be applied. Bright
Side of Life should also consider another app teaser or promotional video for the app.
Promotional videos turned to be a good way in promoting an app and therefore might be a good
investment. Bright Side of Life recently submitted a new version of DilemmaMatch for review to
some app review sites. This action should be more intensified, since it is also a good way for
marketing and DilemmaMatch should be submitted to more different app review sites and focus
on getting reviewed or featured.
Regarding the platform usage, social mobile application DilemmaMatch is currently available for
iOS and Android. Depending on intensity needed and difficulty to port the mobile application,
Bright Side of Life might create a version of DilemmaMatch optimized for Windows Phone.
Although not very spread yet, this mobile platform is on the rise and might therefore be
interesting for DilemmaMatch to appear on Windows Phone to compete with substantially less
mobile applications in not so developed yet Windows Phone Apps & games Store. It might be
an opportunity for DilemmaMatch to appear on this platform before its (indirect) competitors do.
Moreover, the research found that Windows Phone users install more mobile applications on
their smartphones and therefore this fact increases to chance for DilemmaMatch to become
more popular when present on this platform.
The largest part of DilemmaMatch target group (smartphone users in age range 18-35) use
social media frequently. DilemmaMatch is currently present on Facebook, Twitter, Google+,
Instagram and Pinterest and providing information on Facebook, Twitter and Google+. The
following recommendations concern the social media marketing strategy. Most of the targeted
smartphone users answered to use Facebook, followed by Instagram. Moreover, only Facebook
and Google+ are used by some of the users as only social media. Therefore, the most attention
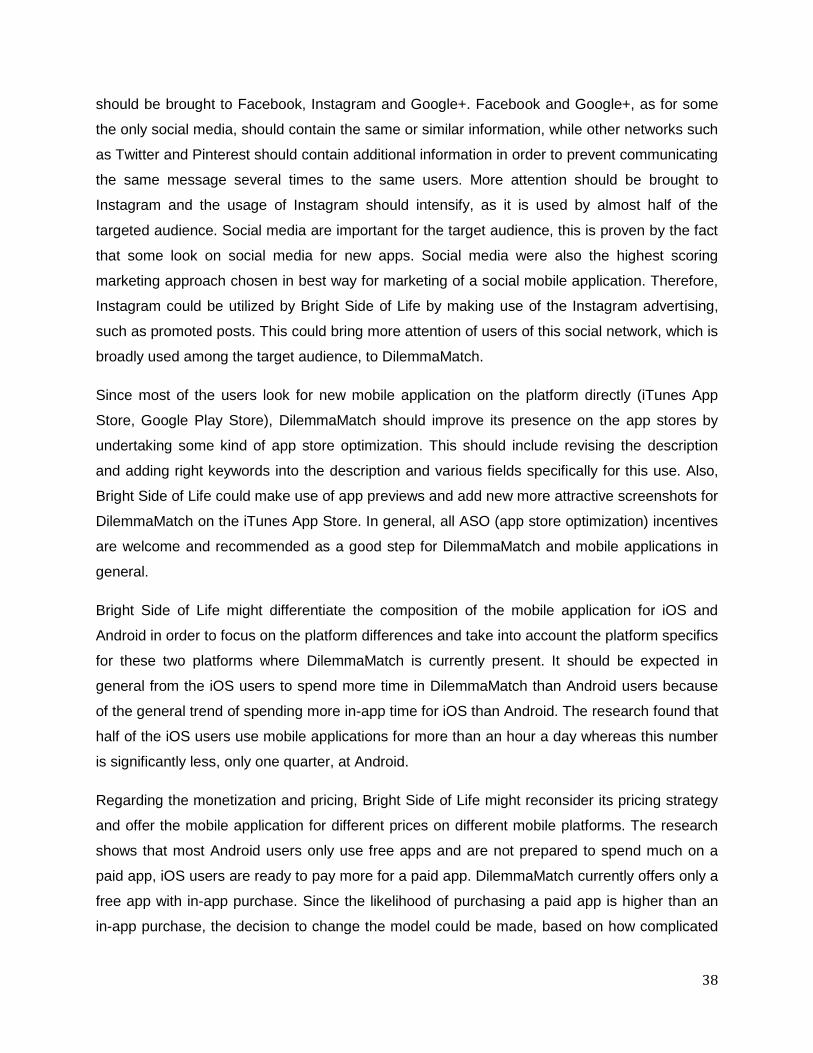
38
should be brought to Facebook, Instagram and Google+. Facebook and Google+, as for some
the only social media, should contain the same or similar information, while other networks such
as Twitter and Pinterest should contain additional information in order to prevent communicating
the same message several times to the same users. More attention should be brought to
Instagram and the usage of Instagram should intensify, as it is used by almost half of the
targeted audience. Social media are important for the target audience, this is proven by the fact
that some look on social media for new apps. Social media were also the highest scoring
marketing approach chosen in best way for marketing of a social mobile application. Therefore,
Instagram could be utilized by Bright Side of Life by making use of the Instagram advertising,
such as promoted posts. This could bring more attention of users of this social network, which is
broadly used among the target audience, to DilemmaMatch.
Since most of the users look for new mobile application on the platform directly (iTunes App
Store, Google Play Store), DilemmaMatch should improve its presence on the app stores by
undertaking some kind of app store optimization. This should include revising the description
and adding right keywords into the description and various fields specifically for this use. Also,
Bright Side of Life could make use of app previews and add new more attractive screenshots for
DilemmaMatch on the iTunes App Store. In general, all ASO (app store optimization) incentives
are welcome and recommended as a good step for DilemmaMatch and mobile applications in
general.
Bright Side of Life might differentiate the composition of the mobile application for iOS and
Android in order to focus on the platform differences and take into account the platform specifics
for these two platforms where DilemmaMatch is currently present. It should be expected in
general from the iOS users to spend more time in DilemmaMatch than Android users because
of the general trend of spending more in-app time for iOS than Android. The research found that
half of the iOS users use mobile applications for more than an hour a day whereas this number
is significantly less, only one quarter, at Android.
Regarding the monetization and pricing, Bright Side of Life might reconsider its pricing strategy
and offer the mobile application for different prices on different mobile platforms. The research
shows that most Android users only use free apps and are not prepared to spend much on a
paid app, iOS users are ready to pay more for a paid app. DilemmaMatch currently offers only a
free app with in-app purchase. Since the likelihood of purchasing a paid app is higher than an
in-app purchase, the decision to change the model could be made, based on how complicated
39
are the database connections for the app. DilemmaMatch could thus offer two separate mobile
applications, one free app with ads and one paid app without advertisements, with premium
features.
Getting new downloads and new users is important, but DilemmaMatch already has more than
15.000 downloads and therefore, should also focus on user retention rather than only on gaining
new users. The most common reasons for application usage that can be influenced by the
company are a new application version with attractive new features, and push notifications.
Bright Side of Life recently started with pushing notifications, this is a really good approach and
should be carried on. Reasons for regular applications usage include regularly changing and
renewing content, possibility to create own content, possibility to customize the app, and the
possibility to communicate through the app. In order to achieve higher user retention rate and
therefore have more active users, new content (in this case Dilemmas) should be regularly
added to the DilemmaMatch App. Moreover, the users should be able to create their own
content (such as Dilemmas) and be able to customize the appearance or the contents shown to
them in the app. Last but not least, the option to communicate with other users directly in the
app would make the users to stick to the app for longer time and would be a step forward to
more active users. Such function can be included as a chat or other communication form with
other users of the DilemmaMatch app. The research found that there is a significant time period
between last app use and app deletion, this time period could be used to pull the users back
into the app by means of notifications targeted on people who stopped using the application, but
still have it installed. One of the reasons for deleting mobile apps that could be tackled by the
developers is to minimize the app size. The social mobile application DilemmaMatch has only
9.27MB for Android, whereas the app size for iOS is significantly more, namely 45.5MB.
These recommendations are important measures to take into account when promoting
DilemmaMatch or any other social mobile applications. While the recommendations are specific
to Bright Side of Life Computer Consultancy and its social mobile application DilemmaMatch its
parts can be useful and applied to various other mobile applications.
5.1.2 METHODOLOGICAL IMPLICATIONS The predefined confidence level for this research was 95%. Based on this information, the
required sample size for achieving a maximum of 10% margin of error were 97 responses. The
actual sample size of 251 respondents and 242 valid responses within the estimated population
of 255.5 million people provided margin of error 6.3% given the confidence level 95%. The
40
response distribution was predefined as 50%, due to the sample not being really skewed in any
way. These figures imply that the confidence level – the tolerated amount of uncertainty – of
95% means that 1 in 20 would be more than the margin of error away from the true answer. The
margin of error is amount of tolerated untrue answers expressed in percentage.
With the confidence level of 95% the research can generalize and apply the results to the
population, considering that these results have certain reliability. However, it still remains a
probability and it is not certain that the research results present opinions and characteristics of
the whole population.
The questionnaire was evenly distributed and answered by both men and women and therefore
can provide reliable answer to the research question. DilemmaMatch social mobile application is
targeting smartphone users from 18 to 35 years of age. The different age category
segmentation for this research was 18-24, 25-30 and 31-15.
The research analyzed the smartphone usage, social media awareness, mobile application
savviness and user retention among smartphone users in the age range 18 to 35 years. For this
research quantitative research method was used. The data were collected in a form of an
anonymous questionnaire. The quantitative method allowed analyzing the data and drawing
conclusion from data collected from more than 250 total respondents. Quantitative research
allows using statistics and based on statistical probability generalize the results to apply them
from the sample to the population, assuming the sample is large enough. The final 242 valid
answer were more than the aimed 100, which resulted in more accurate findings and lower
margin of error.
5.2 CONCLUSION For future researches in the field of marketing of (social) mobile applications, qualitative
research could be used in order to collect more elaborated opinions and represent the opinions
of smartphone users in qualitative data instead of quantified numbers.
Future researches may base on the data collected in this research and analyze specific fields of
mobile applications marketing with a more in-depth approach. DilemmaMatch is a global social
mobile application and therefore, this research was not limited to specific geographical area.
Future researches can be applied to study the behavior of smartphone users in the same age
range in specific country or a region. For a more in-depth research in social mobile applications,
future research might compare two competing mobile applications on this market and gather
41
information about what factor make specific application better than the other. This would provide
in result more specific data rather than examples.
42
BIBLIOGRAPHY App Brain. (2015, March 27). App Brain Stats - Most popular Google Play categories. Retrieved March
28, 2015, from App Brain: http://www.appbrain.com/stats/android-market-app-categories
Auh, S., Bell, S. J., McLeod, C. S., & Shih, E. (3, 2007). Co-production and customer loyalty in financial
services. Journal of Retailing 83, 359–370.
Baarda, B. (2014). Research. This is it! Groningen/Houten: Noordhoff Uitgevers bv.
Banyte, J., & Dovaliene, A. (2014). Relations between customer engagement into value creation and
customer loyalty. Procedia - Social and Behavioral Sciences 156, 484-489.
Barak, A. (2012). How Internet-Mediated Research Changes Science. In A. Barak, Psychological
Aspects of Cyberspace - Theory, Research, Applications (pp. 268-294). Cambridge: Cambridge
University Press.
CIA. (2014). The World Factbook. Retrieved April 4, 2015, from Central Intelligence Agency:
https://www.cia.gov/library/publications/the-world-factbook/fields/2010.html
DilemmaMatch. (2015, March 26). DilemmaMatch Press kit. Retrieved March 28, 2015, from
DilemmaMatch: http://dilemmamatch.com/
Egan, J. (2011). Relationship Marketing: Exploring Relational Strategies in Marketing. Financial
Times/Prentice Hall.
Flavelle, M. (2014, May). Mobile retention benchmarks for 2014 vs 2013 show a 50% drop in D1
retention (Guest post). Retrieved March 27, 2015, from @andrewchen:
http://andrewchen.co/mobile-retention-benchmarks-for-2014-vs-2013-show-a-50-drop-
in-d1-retention-guest-post/
Google. (2013, May). Our Mobile Planet: Understanding the Mobile Consumer. Retrieved March 28,
2015, from Think Insights with Google: http://services.google.com/fh/files/misc/omp-
2013-us-en.pdf
Google. (2014). Our Mobile Planet. Retrieved March 22, 2015, from Think Insights with Google:
http://think.withgoogle.com/mobileplanet/
Karjaluoto, H. (2007). Insights into the implementation of mobile marketing campaigns.
International Journal of Mobile Marketing (2), 10-20.
Leppäniemi, M. (2008). Mobile Marketing Communications in Consumer Markets. Oulu: Oulu
University Press.
Mobile Marketing Association. (2009, November 17). MMA Updates Definition of Mobile Marketing.
Retrieved March 25, 2015, from Mobile Marketing Association:
http://mmaglobal.com/news/mma-updates-definition-mobile-marketing
43
Pocket Gamer. (2012, September). App Store Metrics. Retrieved March 20, 2015, from Pocket
Gamer: http://www.pocketgamer.biz/metrics/app-store/categories/
Saunders, M., Lewis, P., & Thornhill, A. (2009). Research Methods for Business Students. Harlow:
Pearson Education Limited.
Scharl, A., Dickinger, A., & Murphy, J. (2005). Diffusion and success factors of mobile marketing.
Electronic Commerce Research and Applications 4, 159–173.
Statista. (2014, July). Number of apps available in leading app stores. Retrieved March 28, 2015,
from Statista: http://www.statista.com/statistics/276623/number-of-apps-available-in-
leading-app-stores/
Statista. (2015). The most spoken languages worldwide (speakers and native speaker in millions).
Retrieved April 3, 2015, from Statista: http://www.statista.com/statistics/266808/the-
most-spoken-languages-worldwide/
Statista Inc. (2014, July). Number of apps available in leading app stores. Retrieved March 28, 2015,
from Statista: http://www.statista.com/statistics/276623/number-of-apps-available-in-
leading-app-stores/
Tamuliene, V., & Gabryte, I. (2014). Factors influencing customer retention: case study of
Lithuanian mobile operators. Procedia - Social and Behavioral Sciences 156, 447-451.
TechTarget. (2006, January). Social Networking. Retrieved March 16, 2015, from Techtarget:
http://whatis.techtarget.com/definition/social-networking
Tetere, M. (2011). Mobile marketing: brand performance and implications on brand identity. Aarhus:
Aarhus School of Business and Social Sciences.
Traver, C. G., & Laudon, K. C. (2014). E - commerce. New Jersey: Pearson Education, Inc.
Varnali, K., & Ayşegül, T. (2010). Mobile marketing research: The-state-of-the-art. International
Journal of Information Management (30), 144–151.
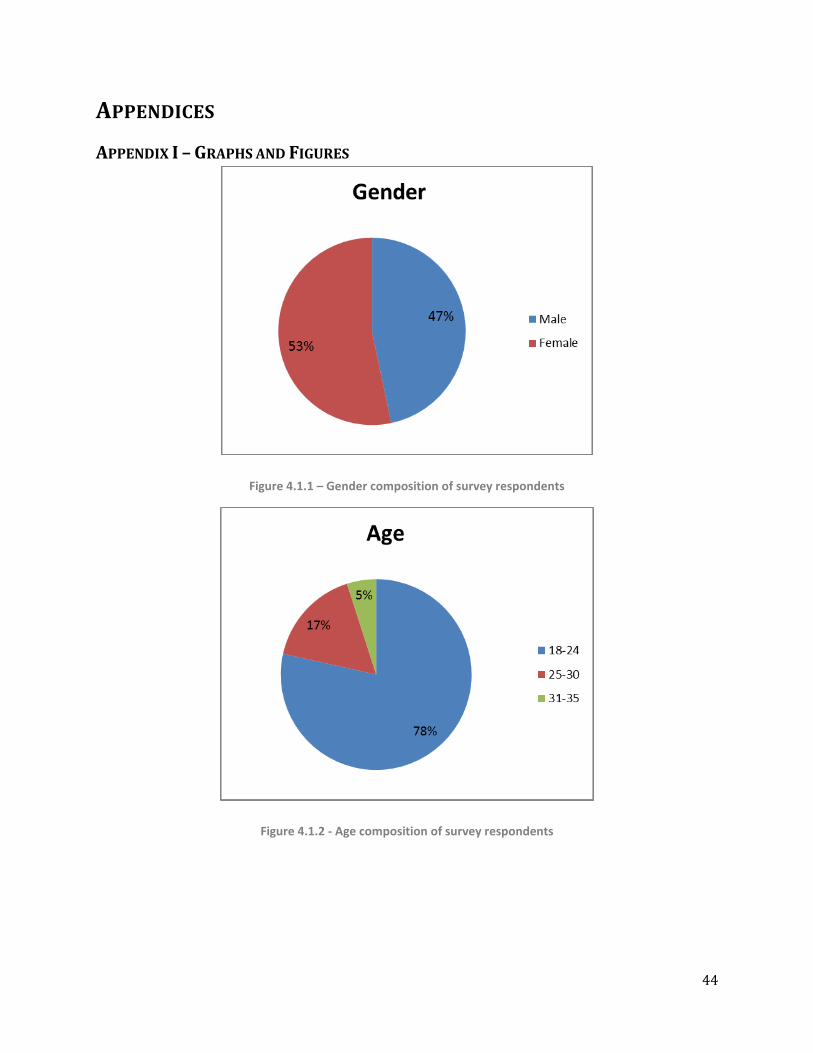
44
APPENDICES
APPENDIX I – GRAPHS AND FIGURES
Figure 4.1.1 – Gender composition of survey respondents
Figure 4.1.2 - Age composition of survey respondents
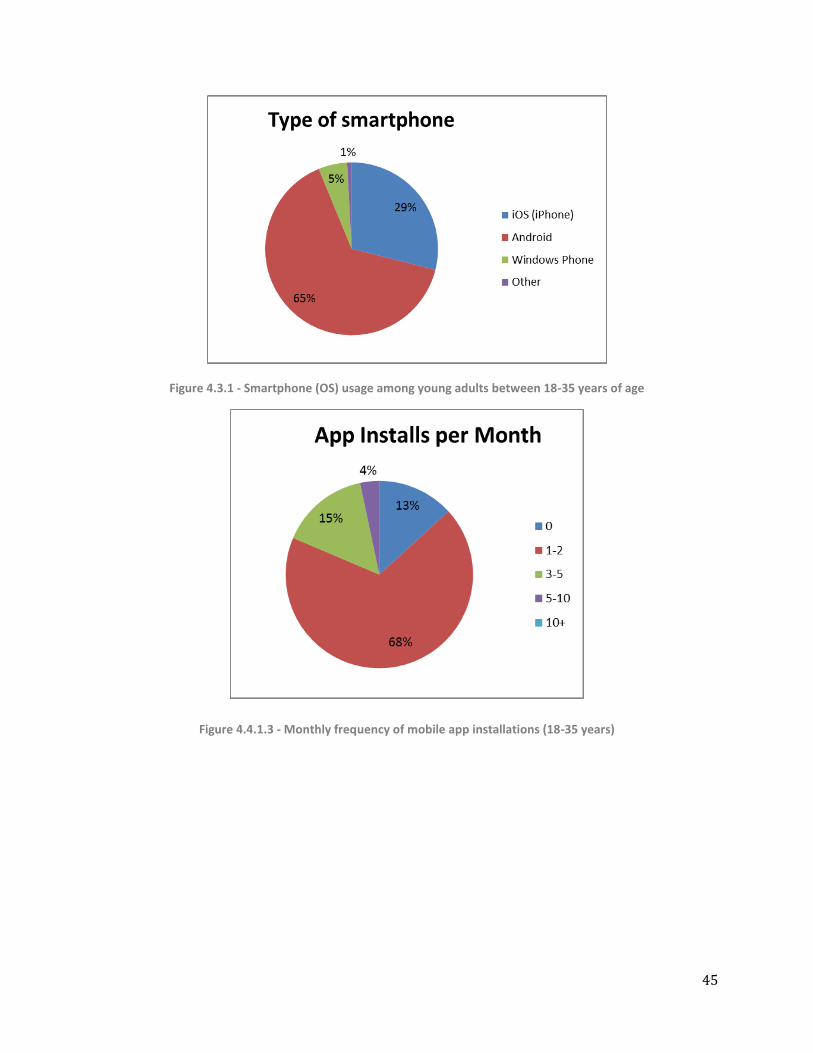
45
Figure 4.3.1 - Smartphone (OS) usage among young adults between 18-35 years of age
Figure 4.4.1.3 - Monthly frequency of mobile app installations (18-35 years)
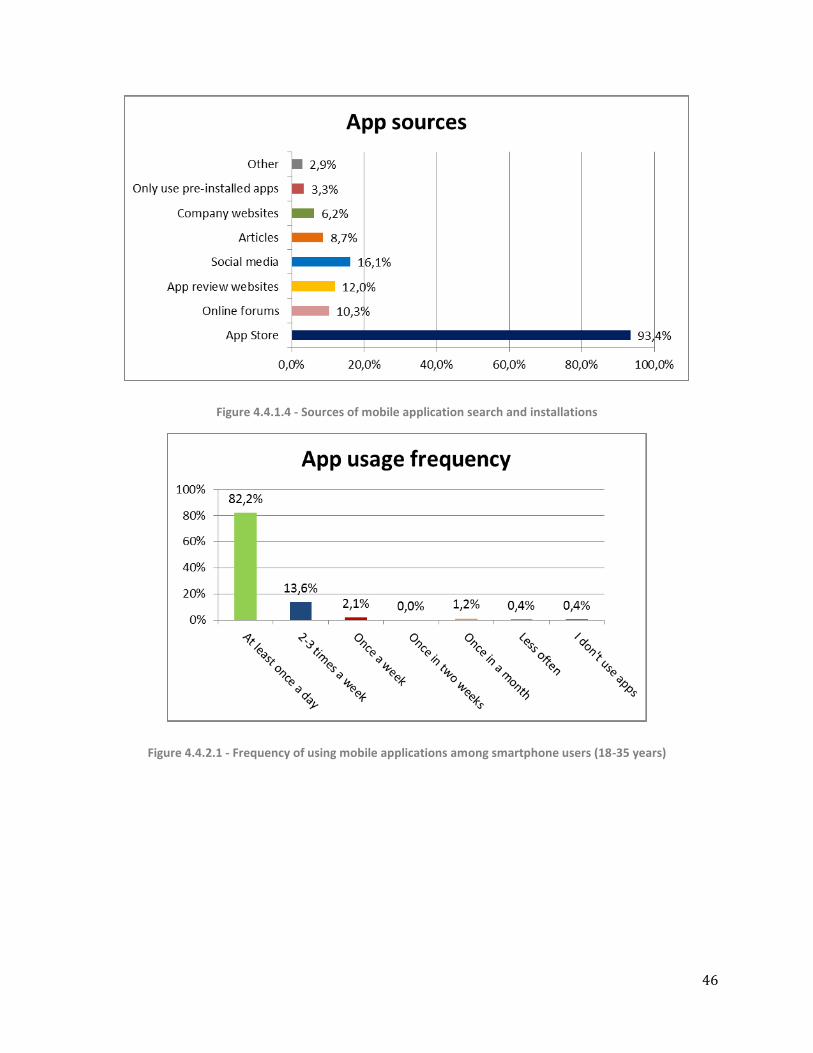
46
Figure 4.4.1.4 - Sources of mobile application search and installations
Figure 4.4.2.1 - Frequency of using mobile applications among smartphone users (18-35 years)
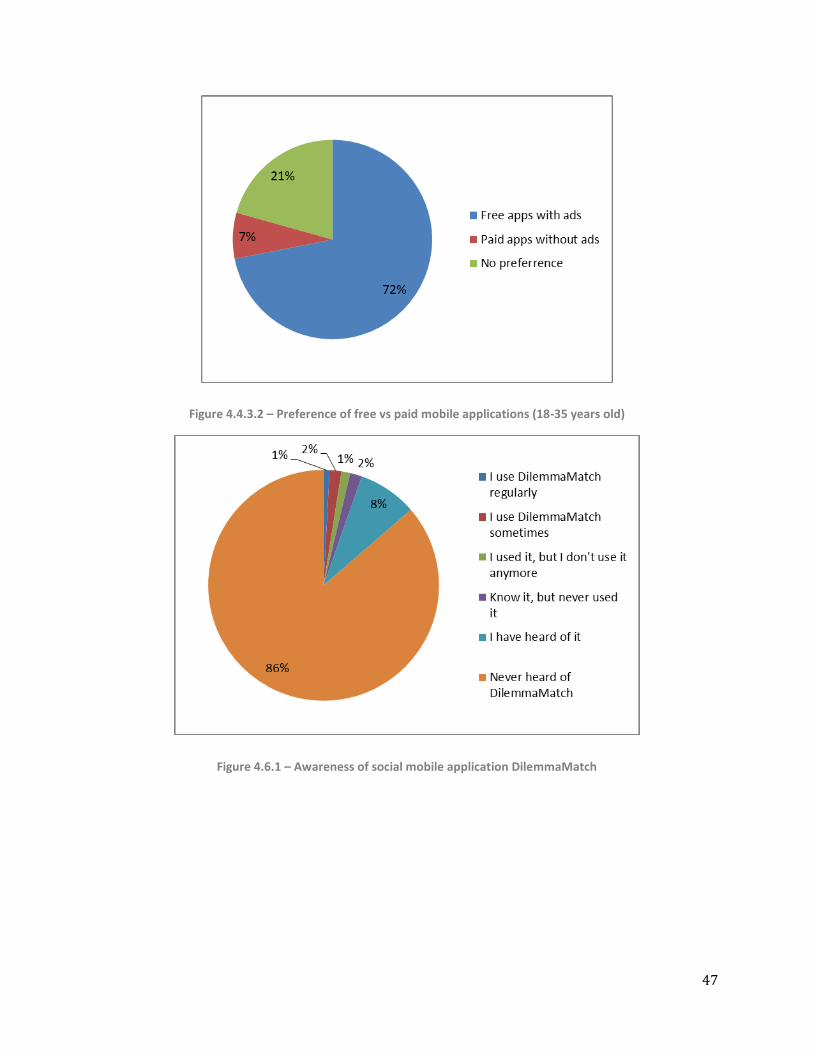
47
Figure 4.4.3.2 – Preference of free vs paid mobile applications (18-35 years old)
Figure 4.6.1 – Awareness of social mobile application DilemmaMatch
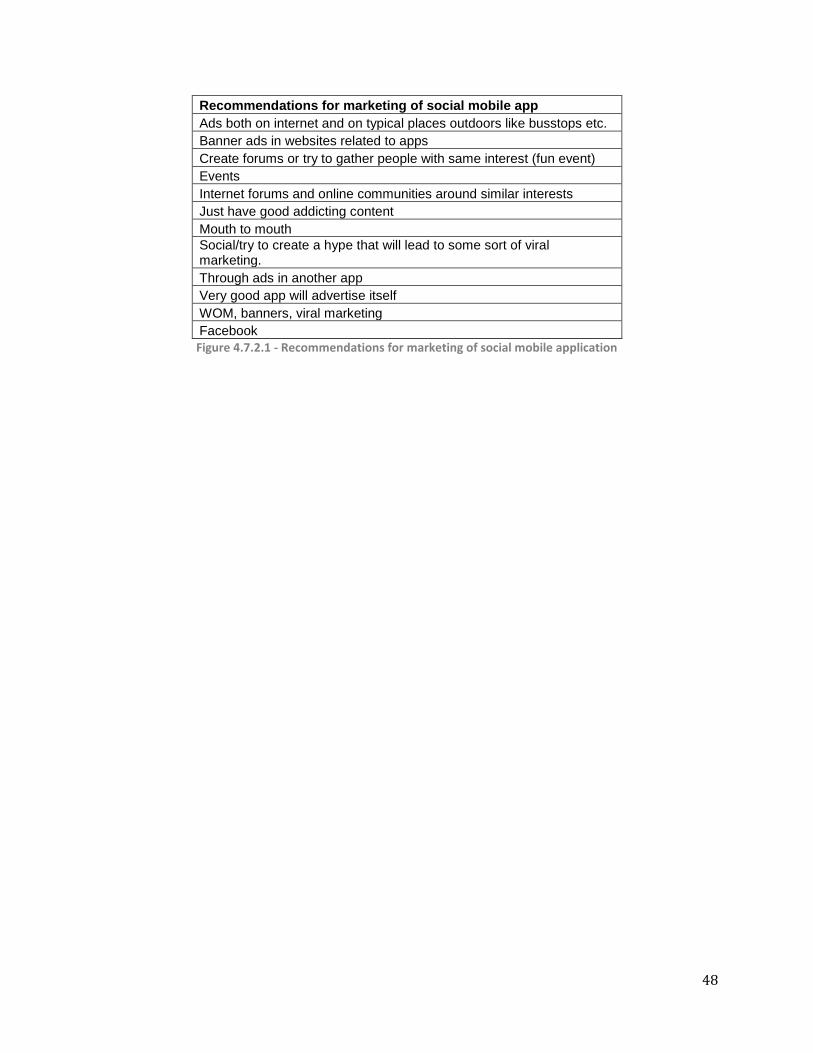
48
Recommendations for marketing of social mobile app
Ads both on internet and on typical places outdoors like busstops etc.
Banner ads in websites related to apps
Create forums or try to gather people with same interest (fun event)
Events
Internet forums and online communities around similar interests
Just have good addicting content
Mouth to mouth
Social/try to create a hype that will lead to some sort of viral marketing.
Through ads in another app
Very good app will advertise itself
WOM, banners, viral marketing
Figure 4.7.2.1 - Recommendations for marketing of social mobile application
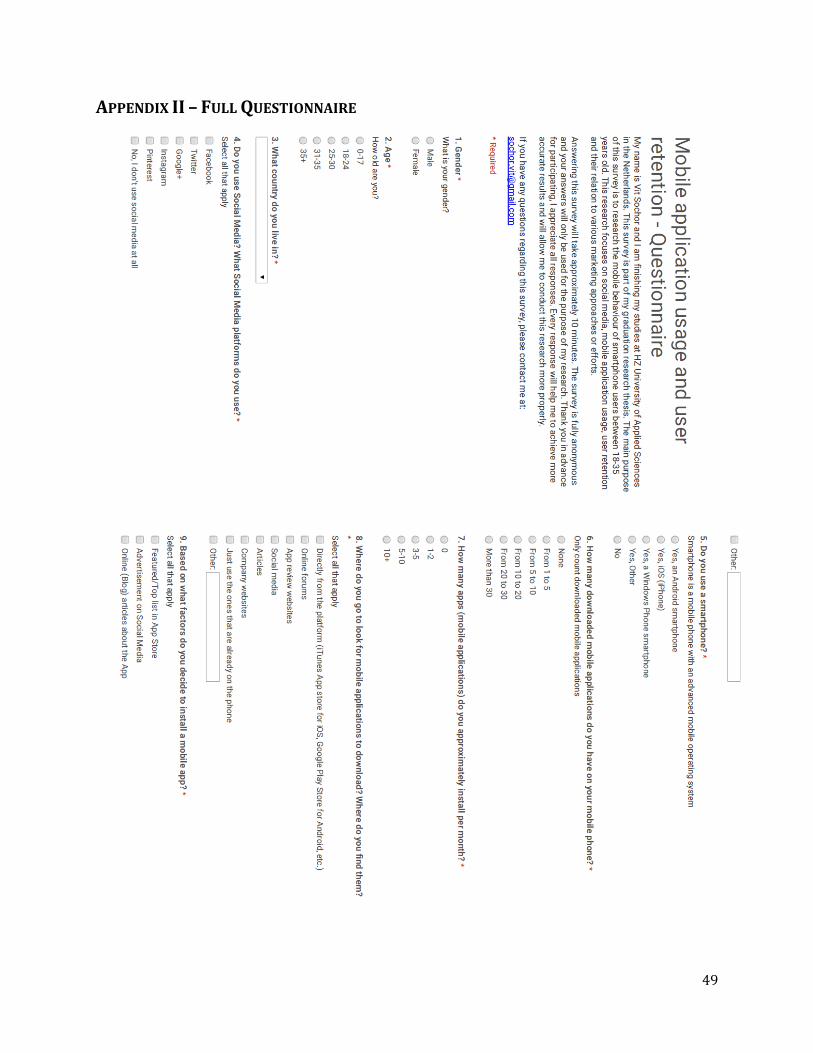
49
APPENDIX II – FULL QUESTIONNAIRE
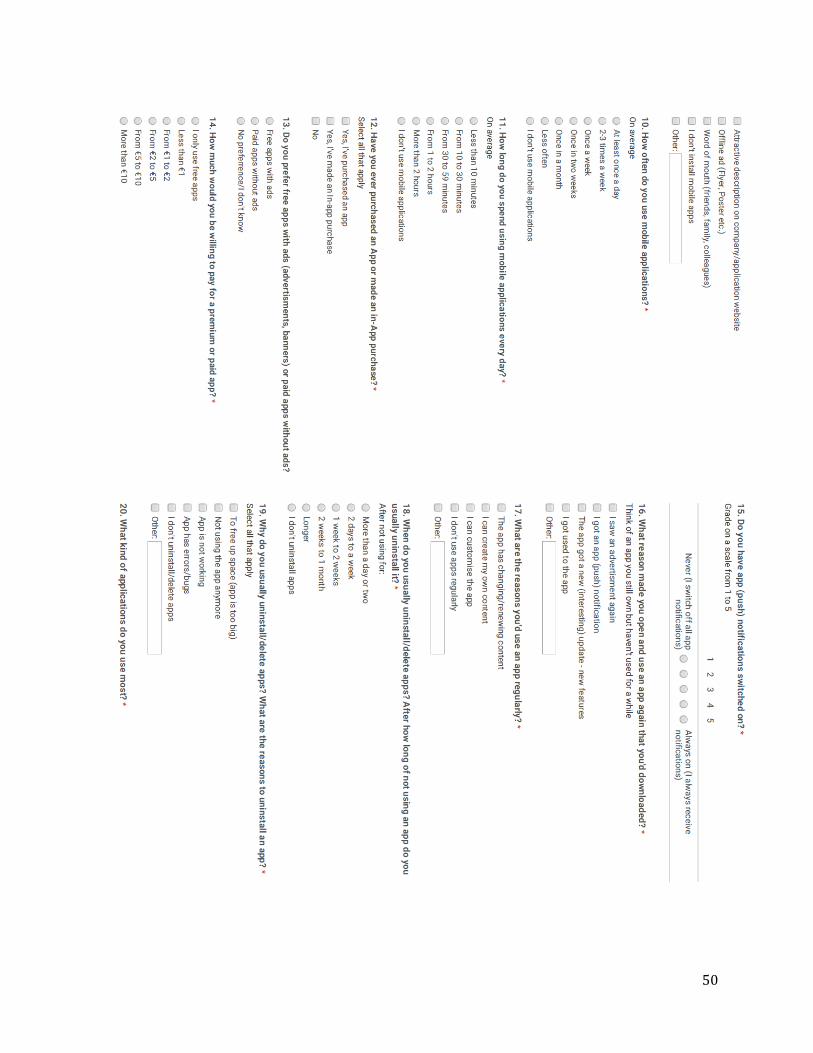
50
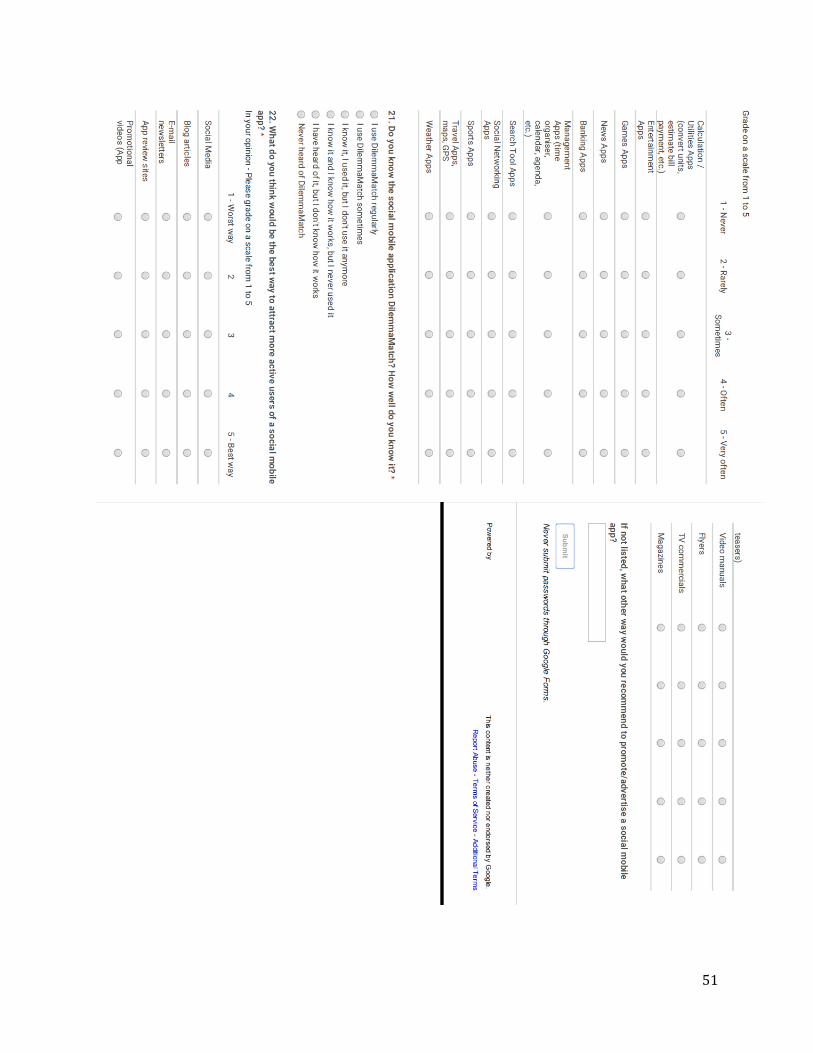
51