Embed Size (px)
Citation preview

forum
Mobile Broadcast Technologies
Link Budgets Update 02/2009

Mobile Broadcast Technologies
Link Budgets Update 02/2009
February 2009

Broadcast Mobile Technologies – Link Budgets 02/2009 Page 2 of 36
This bmcoforum white paper has been edited by the members of the “Network
structure and coverage expectations” work item.
Information contained in this report only reflects solely the author’s view on the
subject based on intensive best-effort research of published materials, deduc-
tive reasoning and calculated speculations. While the author and publishers
have done their best to ensure the accuracy of all the information, they, how-
ever, can accept no responsibility for any loss or inconvenience sustained as a
result of information contained in this volume.
The information contained in this paper can be freely used but a refer-
ence should be made to this document.
Broadcast Mobile Technologies – Link Budgets 02/2009 Page 3 of 36
Content:
1. Introduction .....................................................................................................5
2. Usage scenarios ...............................................................................................6
3. Link Budget Evaluation ..................................................................................7
4. Technology independent parameters ............................................................11
4.1. Quality of Coverage............................................................................................. 11
4.2. Penetration losses ................................................................................................ 11
4.3. Combined Field strength variation.................................................................... 12
4.4. Antenna gain........................................................................................................ 13
4.5. Other losses .......................................................................................................... 13
5. Network architecture dependent factors.......................................................15
5.1. SFN gain............................................................................................................... 15
5.2. Antenna diversity gain ........................................................................................ 15
6. Technology dependent parameters ...............................................................16
6.1. Bandwidth............................................................................................................ 16
6.2. Noise Figure ......................................................................................................... 16
6.3. Carrier-to-Noise ratio ......................................................................................... 17 6.3.1. DVB-T........................................................................................................................17 6.3.2. DVB-H........................................................................................................................18 6.3.3. MediaFLO ..................................................................................................................19 6.3.4. T-DMB .......................................................................................................................19 6.3.5. DVB-SH .....................................................................................................................20
6.4. Coverage classes .................................................................................................. 21
7. Reference minimum field strengths for network planning..........................22
7.1. DVB-T .................................................................................................................. 22
7.2. DVB-H.................................................................................................................. 23
7.3. MediaFLO............................................................................................................ 25
7.4. T-DMB.................................................................................................................. 27
7.5. DVB-SH................................................................................................................ 28
7.6. Global comparison of specific configurations................................................... 30
Broadcast Mobile Technologies – Link Budgets 02/2009 Page 4 of 36
8. Reference minimum terminal sensitivity ......................................................31
8.1. DVB-T .................................................................................................................. 31
8.2. DVB-H.................................................................................................................. 31
8.3. T-DMB.................................................................................................................. 32
8.4. DVB-SH................................................................................................................ 32
9. Conclusion .....................................................................................................33
10. References......................................................................................................34
11. On bmcoforum “Broadcast Network Structure and Coverage Expectations” Group.....................................................................................35
Annex: Area vs. Edge Coverage .............................................................................36
Broadcast Mobile Technologies – Link Budgets 02/2009 Page 5 of 36
1. Introduction For the planning of radio networks, a traditional approach consists in defining
the required minimum median field strength that must be offered in a target
area and then predict the locations where this level can be reached, using plan-
ning tools.
This document intends to list, for the various usage scenarios, what standard
field strength values should be used for network planning of DVB-T, DVB-H, T-
DMB, MediaFLO and DVB- SH1 services. In addition, it also provides the corre-
sponding required minimum terminal sensitivity in each usage scenario.
This document is an update of bmcoforum white paper on link budgets, first
published in 2007. This second version is based on the latest additional per-
formance test results available for the most prominent Mobile Broadcast Tech-
nologies in Europe. It also gives practical reference terminal sensitivity figures,
and numerous technical clarifications.
1 DVB-SH (DVB-Satellite Services to Handhelds) was formerly named DVB-SSP (Satellite Services
to Portables).

Broadcast Mobile Technologies – Link Budgets 02/2009 Page 6 of 36
2. Usage scenarios Whatever the technology, four use cases are considered, in line with definitions
from [1], [3]:
Class A: Outdoor reception where the portable terminal with an attached or
built-in antenna is used. Reception is considered at 1.5 m above ground level,
at a speed of 3km/h.
Class B: Indoor reception where the portable terminal with an attached or
built-in antenna is used. The terminal is at 1.5 m above floor level on the
ground floor, in a room with a window in an external wall.
Because field experiments have produced varied estimates of the impact of
building penetration, two sub-categories for class B are further defined:
Class B1: Light-indoor reception, for a portable terminal close to a win-
dow in a lightly shielded room.
Class B2: Deep-indoor reception, for a portable terminal located further
away from a window, in a highly shielded room.
Class C: Mobile reception where the terminal is located in a moving vehicle and
receives the signal from an external, outdoor antenna. Reception is considered
at 1.5m2 above ground level at a speed of up to 130km/h.
Class D: Mobile reception where the terminal is located in a moving vehicle and
receives the signal from an attached or built-in antenna. Reception is consid-
ered at 1.5m above ground level at a speed of up to 130km/h.
Class of Reception
Situation Characteristics
Class C Mobile roof-top 1.5m above ground level,
up to 130km/h
Class A Outdoor pedestrian 1.5m above ground level,
3km/h
Class D Mobile in-car 1.5m above ground level,
up to 130km/h
Class B1 Light-indoor 1.5m above ground floor
level, 3km/h,
lightly shielded building
Class B2 Deep-indoor 1.5m above ground floor
level, 3km/h,
highly shielded building
Table 1: Classes of reception, by expected order of increasing
difficulty of reception
2 1.5 m height is a worst case value, but realistic in several countries.

Broadcast Mobile Technologies – Link Budgets 02/2009 Page 7 of 36
3. Link Budget Evaluation The minimum median equivalent field strength required outdoor at 1.5 m above
ground level is given by formula (4) in the following paragraphs. This formula is
obtained by evaluating the link budget in a three-step process, as illustrated in
Figure 1:
Figure 1: Reference Model for Link Budget evaluation
1) The required minimum received power level (PSmin) is calculated at the
front-end tuner input (in dBm).
2) The required field strength (Emin) near the receiving antenna is calculated, for a given antenna gain (in dBµV/m).
3) Finally, the minimum median equivalent field strength (Emed) required
outdoor is calculated, including margins for indoor or outdoor coverage with
the wanted percentage of covered locations.
Step1: minimum required RF power level at the receiver input (PSmin)
The minimum required RF input power level (PSmin) is related to the Carrier-to-
Noise Ratio (C/N), the receiver Noise Figure (F) and the spectrum Bandwidth
(B) by using the following formula:
BFkT
P
Pn
P
N
C SS
0
minmin ==
Where:
Pn = Receiver Noise input Power {W} [or {dBW} / {dBm} ]
F=Receiver Noise Figure [10log10(F) in {dB}]
PSmin = Minimum receiver input power {W} [or {dBW} / {dBm} ]
k = Boltzmann's Constant (k= 1.38 x 10⁻²³ {Ws/K})
T0 = Absolute temperature (T0 = 290° {K})
B = Receiver noise bandwidth {Hz}
Taking logarithm of both sides of previous formula and expressing B in MHz
gives PSmin:
(1) { }{ }
{ } { }( )MHzdBdB
dBmS BFN
CP 10min log10114+−+
=
F

Broadcast Mobile Technologies – Link Budgets 02/2009 Page 8 of 36
Step2: Minimum required field strength at the antenna input (Emin)
The input RF power level PSmin (Watt or dBm) is practical in laboratory condi-
tions, but in the field or in an anechoic chamber – i.e. using using a complete
terminal including the antenna – the field strength (dBµV/m) is needed instead.
Assuming a receiving antenna gain (G) and a working frequency (f), the re-
quired field strength (Emin) is calculated versus the minimum RF input power
level (PSmin) by using the following formulas:
PSmin = Aa x Φmin Aa = Effective antenna aperture {m2} (or {dBm2})
minΦ = Minimum power flux density at receiving place
{W/m2} or {dBW/m²}
with ( )
Z
E 2
min
min=Φ
Emin= Equivalent minimum field strength near the antenna
{V/m} or {dBmV/m}
Z = Free space wave impedance {Ohms}
and π
λ4
2
×= GAa λ= Wavelength of the signal {m}
λ= c/f with c= Light speed {m/s}
f= Carrier Frequency {Hz}
G = Antenna Gain compared to isotropic antenna {dBi}
And finally, a combination of the three previous formulas gives Emin, the
equivalent minimum field strength which has to be measured near the antenna
to ensure a good reception:
G
P
c
fE Smin
min 304π=
Or, expressing the parameters in decibels:
{ } { } { } { }( ) 8.132log20min 10min/ −+−= MHzdBidBWSmdBV fGPE
Using the following conversion formulas:
{ } { } 120//min += mdBVmdBµV EE
{ } { } 30+= dBWSdBmS PP
equation (2) gives Emin with a more convenient unit of measurement:
(2) { } { } { } { }( ) 2.77log20min 10min/ ++−= MHzdBidBmSmVdB fGPE µ ([7] §10.1)
Note: The Total Radiated Sensitivity (TRS) as defined in 3GPP to characterize
receiver together with antenna [9] may be used instead of antenna gain and
receiver sensitivity. TRS measurement is on the way to be specified within the
framework of MBRAI / EICTA in IEC 62002-4. Whenever using TRS, formula (2)
becomes:
(2bis) { } { } { }( ) 2.77log20min 10/ ++= MHzdBmmVdB fTRSE µ
πεµ
1200
0 ==
Broadcast Mobile Technologies – Link Budgets 02/2009 Page 9 of 36
Step3: Minimum median equivalent field strength outdoor with
coverage margin (Emed)
Macro-scale variations of the field strength are very important for the coverage
assessment (see section 4.3).
For outdoor reception, only the outdoor environment causes signal varia-
tions.
For indoor signals, the given variation corresponds to the cumulative ef-
fects of outdoor and indoor or in-vehicle environments. As outdoor and in-
door macro-scale variations of the field strength were found to follow a “log
Normal” law, the combined standard deviation (σ) is given by:
( ) ( )22po σσσ +=
where σp is the standard deviation of the indoor penetration loss (see sec-
tion 4.2)
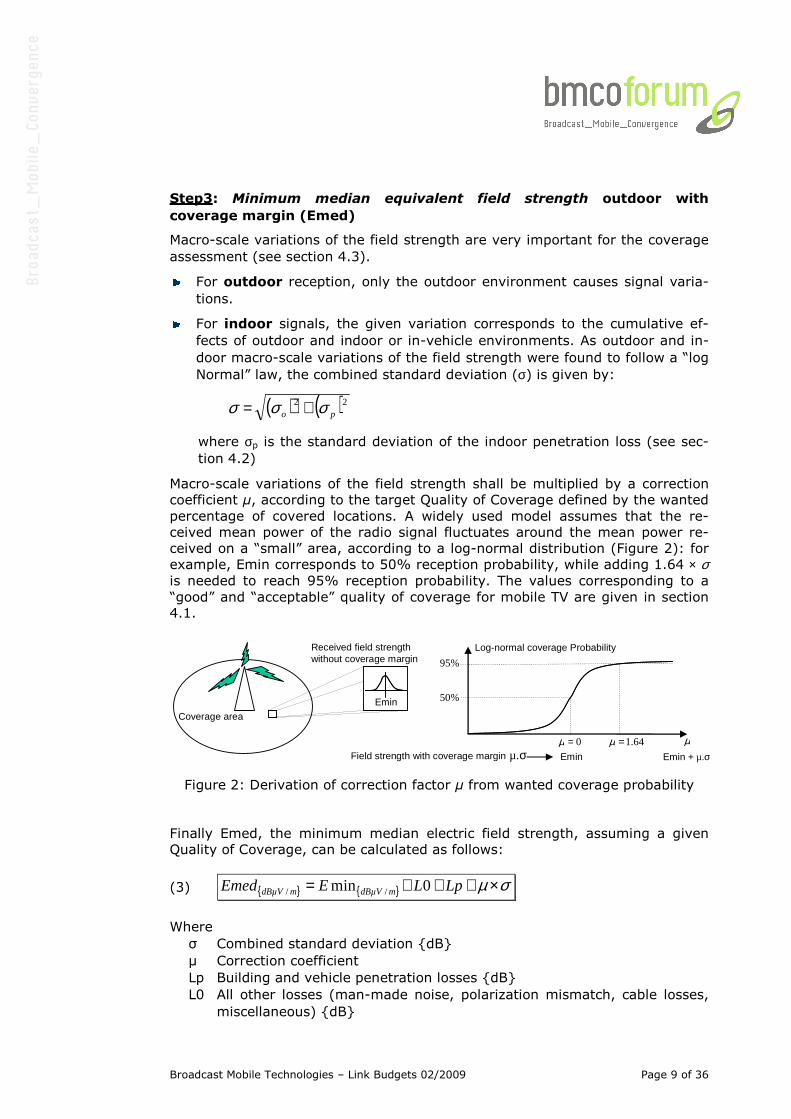
Macro-scale variations of the field strength shall be multiplied by a correction
coefficient µ, according to the target Quality of Coverage defined by the wanted
percentage of covered locations. A widely used model assumes that the re-
ceived mean power of the radio signal fluctuates around the mean power re-
ceived on a “small” area, according to a log-normal distribution (Figure 2): for
example, Emin corresponds to 50% reception probability, while adding 1.64 × σ is needed to reach 95% reception probability. The values corresponding to a
“good” and “acceptable” quality of coverage for mobile TV are given in section 4.1.
Emin
0=µ
%50
%95
64.1=µ
Log-normal coverage Probability
Field strength with coverage margin µ.σ Emin + µ.σ
µ
Coverage area
Received field strengthwithout coverage margin
Emin
Figure 2: Derivation of correction factor µ from wanted coverage probability
Finally Emed, the minimum median electric field strength, assuming a given
Quality of Coverage, can be calculated as follows:
(3) { } { } σµ ×+++= LpLEEmed mdBµVmdBµV 0min //
Where
σ Combined standard deviation {dB}
µ Correction coefficient
Lp Building and vehicle penetration losses {dB}
L0 All other losses (man-made noise, polarization mismatch, cable losses,
miscellaneous) {dB}
Broadcast Mobile Technologies – Link Budgets 02/2009 Page 10 of 36
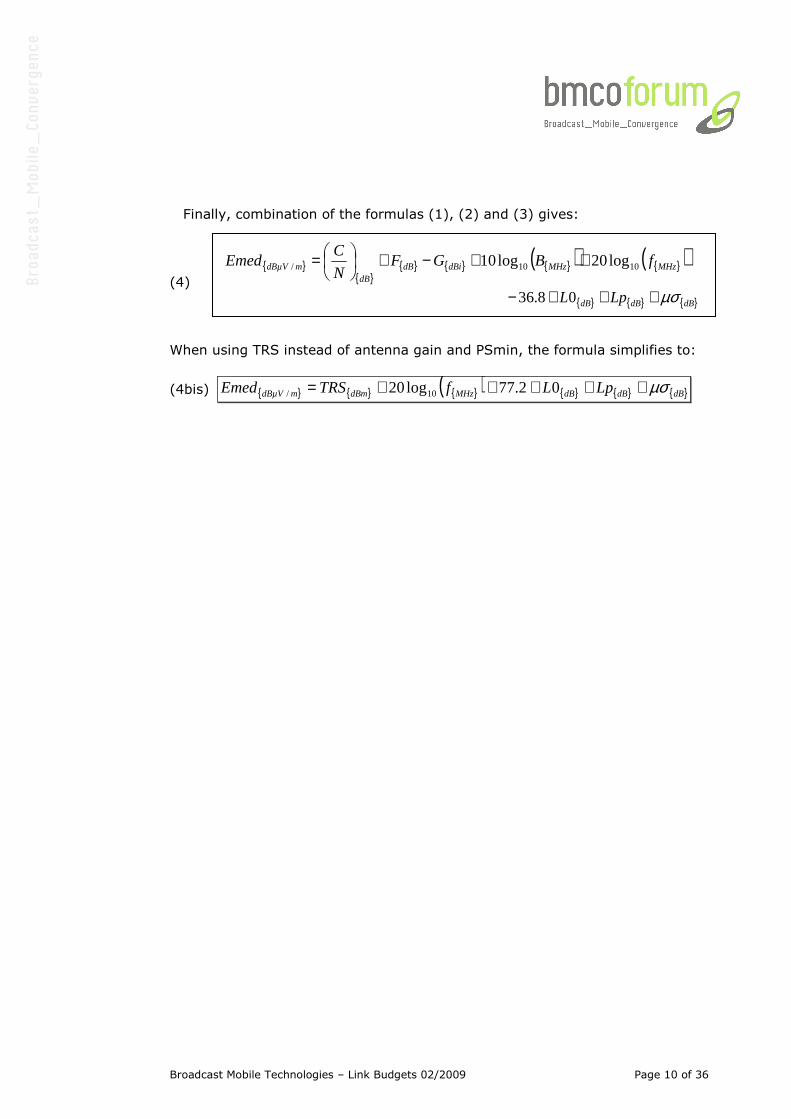
Finally, combination of the formulas (1), (2) and (3) gives:
(4)
When using TRS instead of antenna gain and PSmin, the formula simplifies to:
(4bis) { } { } { }( ) { } { } { }dBdBdBMHzdBmmdBµV LpLfTRSEmed µσ+++++= 02.77log20 10/
{ }{ }
{ } { } { }( ) { }( )MHzMHzdBidBdB
mdBµV fBGFN
CEmed 1010/ log20log10 ++−+
=
{ } { } { }dBdBdB LpL µσ+++− 08.36

Broadcast Mobile Technologies – Link Budgets 02/2009 Page 11 of 36
4. Technology independent parameters
4.1. Quality of Coverage
For a given small area of 100mx100m, the quality of coverage is classified as:
• "Good",
o if at least 95 % of receiving locations at the edge of the area are
covered for portable reception (Class A,B);
o if at least 99 % of receiving locations within it are covered for
mobile reception (Class C, D)3;
• "Acceptable",
o if at least 70 % of locations at the edge of the area are covered
for portable reception (Class A,B);
o if at least 90 % of receiving locations within it are covered for
mobile reception (Class C, D)3;
The correction coefficient can then be derived, assuming a normal distribution
of field strengths.
Quality of Coverage Class A,B Class C,D
Good 95%, µ=1.64 99%, µ=2.33
Acceptable 70%, µ=0.52 90%, µ=1.28
Table 2: Quality of coverage and corresponding
correction coefficient µ.
4.2. Penetration losses
For class B and D, additional building and vehicle penetration losses must be
taken into account.
In class B, the average value of the building penetration loss is the difference
between the average value of the outdoor signal level distribution and the av-
erage value of the indoor signal level distribution at the same height.
Lp= Eoutaverage - Einaverage
3 99% and 90% coverage of the area respectively correspond to approximately 95% and 70%
edge coverage of the area, see Annex .

Broadcast Mobile Technologies – Link Budgets 02/2009 Page 12 of 36
Band VHF4 UHF5 L-band4 S-band6
Penetration
loss Lp
Loss Stand.
Dev.
Loss Stand.
Dev.
Loss7 Stand.
Dev.
Loss Stand.
Dev.
Class C none none none none none none none none
Class A none none none none none none none none
Class D 7 dB none 7 dB none 7 dB none 7 dB none
Class B1 9 dB σp=4.5 dB 11 dB σp=5 dB 13 dB σp=5 dB 14 dB σp= 5 dB
Class B2 15 dB σp=5 dB 17 dB σp=6 dB 19 dB σp=6 dB 19 dB σp= 6 dB
Table 3: Penetration losses
4.3. Combined Field strength variation
Macro-scale variations of the field strength are very important for the coverage
assessment. For outdoor signals, the standard value of σo=5.5dB (from [2]) is
used.
In case of class B and D, the given variation corresponds to the cumulative of
the outdoor signal variation and the indoor or in-vehicle variation, as listed in
the previous section.
Since
σ= (σo2 + σp
2)1/2
the following values for the combined field strength variation are thus derived:
Combined
Field Strength
Variation σσσσ
VHF
UHF
L-Band
S-Band
Class C σ=5.5 dB σ=5.5 dB σ=5.5 dB σ=5.5 dB
Class A σ=5.5 dB σ=5.5 dB σ=5.5 dB σ=5.5 dB
Class D σ=5.5 dB σ=5.5 dB σ=5.5 dB σ=5.5 dB
Class B1 σ=7.1 dB σ=7.4 dB σ=7.4 dB σ=7.4 dB
Class B2 σ=7.4 dB σ=8.1 dB σ=8.1 dB σ=8.1 dB
Table 4: Field strength variation
4 From T-DMB trials in Australia (T-Systems). These figures are also in line with document “CRA /
DRBA T-DAB Sydney Trial – Building penetration loss Survey Band III and L-Band”, 12 oct 2005. 5 From DVB-H trials in Finland and France
6 These values are extrapolated from L-band in order to have consistent penetration losses figures
across the entire frequency range. State of the art practice in UMTS network planning from Al-catel-Lucent differs slightly: 10-12 dB / 18-21 dB penetration losses for respectively light/deep indoor, and respectively 8/10 dB combined field strength variation (in Table 4).
7 L-Band penetration losses match a linear extrapolation from VHF and UHF

Broadcast Mobile Technologies – Link Budgets 02/2009 Page 13 of 36
4.4. Antenna gain The antenna gain below is defined as the maximum gain on the antenna pat-
tern. The achievable antenna gain can be characterised as follows:
Frequency (MHz) Class A,B,D with
built-in antenna
Class A,B,D with
attached antenna
Class C
VHF Band III (225) -16 dBi8 -12 dBi9, 10 -3 dBi11
UHF (474) -10 dBi12 -6 dBi9 0 dBi11
UHF (698) -7 dBi12 -3 dBi9 0 dBi11
UHF (858) -5 dBi12 -1 dBi9 1 dBi11
L-Band -5 dBi / 0 dBi13 -3 dBi / 0 dBi13 0 dBi 13
S-Band (2170) -3 dBi14 0 dBi14 +2 dBi14
Table 5: Antenna gain
In the following link budget calculations, built-in antennas are considered for
classes A, B, D.
4.5. Other losses
Other losses must be considered in the link budget. To take all other possible
losses into account, an additional loss has to be included in the link budget.
This shall account for:
- Practical antenna gain with respect to maximum gain (depending on an-
tenna pattern, possible polarisation mismatch, …),
- Implementation losses (front-end performances),
- Cable loss in the case of car roof-top antenna (class C),
- Man-made noise.
8 From measurements at IRT. 9 +4 dBi with respect to an integrated antenna. This relative value originates from EBU B/BCP
group and document EBU Tech 3317 (Planning parameters for hand-held reception v2, july 2007) 10 Applies to a handheld terminal, i.e. with limited length antenna extension. Bigger portable termi-
nals have a better antenna gain (e.g. -6 dBi for 75 cm reported in Digital Radio Australia “Plan-ning F/S and derivation T-DAB reception for mobile and indoor” report, 29th jan 2008)
11 From EICTA MBRAI interface specifications v2.0, June 2007 12 From DVB-H Implementation Guidelines ETSI TR 102 377 V1.2.1 (2005-11) 13 -5 dBi: currently used for planning, referred to 1 dBi in ETSI TR 101 758 V2.1.1 (2000-11) 14 From DVB-SH Implementation Guidelines ETSI TS 102 584 V1.1.1, sections 10.1.2.2 and 4.2.6.2

Broadcast Mobile Technologies – Link Budgets 02/2009 Page 14 of 36
There are many possible loss values for each individual item above, depending
on usage scenario and technology. Considering that it is unlikely that all effects
would occur simultaneously, a global value in the order of 3 dB to 5 dB used for
all classes.
DVB-H in UHF MediaFLO in
UHF
T-DMB in VHF
and L-Band
DVB-SH in
S-Band15
Loss 3 dB 3 dB 5 dB 1 dB
Table 6: “Other losses” values
15 To be confirmed based on future lab and field tests using the first integrated handheld terminals.
“Other losses” for S band is estimated at 1 dB since: the section 4.4 already considers a practical antenna gain, no cable loss is foreseen with low noise amplifier at antenna in case of roof top configuration, the noise figure performance of section 6.2 already takes into account front-end implementation loss and finally man made noise is negligible in S band.

Broadcast Mobile Technologies – Link Budgets 02/2009 Page 15 of 36
5. Network architecture dependent factors The factors in this section are highly dependent on specific network architecture
and equipment implementations. For this reason they are not included in the
link budget calculation.
5.1. SFN gain
The “SFN gain” (Single Frequency Network) is the reduction of number of
transmitters to cover a given area using synchronised transmitters compared to
the number of independent MFN transmitters. Depending on the network to-
pology, this transmitter savings may be carefully translated into an average
increase of coverage.
However, the SFN gain is not persistent across all points of the network, so it
will not be considered in the link budget.
5.2. Antenna diversity gain
Antenna diversity accounts for the possibility for a receiver to use several re-
ceive antennas to exploit multi-path propagation.
In general, this feature may not be implemented on all devices, so it will not be
considered in the link budget.
In the case of DVB-SH, it is foreseen that antenna diversity will be used, with
the expected diversity gains:
DVB-SH Reception diversity
gain
C – Mobile roof-top16 2.5 dB / 4.0 dB17
A – outdoor 2.5 dB / 4.0 dB
D – Mobile in-car > 2.5 dB
B1 – Light indoor16 6 dB
B2 – Deep indoor 6 dB
Table 7: Measured antenna diversity
gain in DVB-SH terminal18
16 From field trials performed by Alcatel in Pau in 2008 17 Alcatel field trials show an average diversity gain in outdoor of 2.5 dB in rural environment and
4.0 dB in urban environment 18 Measured with experimental receivers. To be confirmed using the first integrated handheld termi-
nals.

Broadcast Mobile Technologies – Link Budgets 02/2009 Page 16 of 36
6. Technology dependent parameters
6.1. Bandwidth
Receiver bandwidths to be considered in link budget calculations are listed be-
low:
Channel (MHz) 1.7 5 6 7 8
DVB-T¸DVB-H (MHz) - 4.75 5.71 6.66 7.61
MediaFLO (MHz) - 4.52 5.42 6.32 7.23
T-DMB (MHz) 1.54 - - - -
DVB-SH (MHz) 1.52 4.7519 5.71 6.66 7.61
Table 8: Signal bandwidth
6.2. Noise Figure
The receiver noise figure essentially depends on frequency, and on the band-
width each technology is designed for. The terminal noise figure also depends
on the terminal design regarding the integration of receiver chip.
For example, an additional LNA (Low Noise Amplifier) might be present before
the receiver chip (Figure 3), depending on terminal requirements on sensitivity,
input dynamics, and adjacent channel interference.
G1F1
Tuner
F2LNA
(…)
Baseband processing
DemodulationDecoding, …
Receiver
Figure 3: Schematic view of a receiver architecture including
an additional LNA in front of the tuner
Using such an architecture, the resulting noise figure is given by:
( ) 1/121 GFFF −+= (in linear scale)
19 In S-band 5 MHz will most likely be used.
Broadcast Mobile Technologies – Link Budgets 02/2009 Page 17 of 36
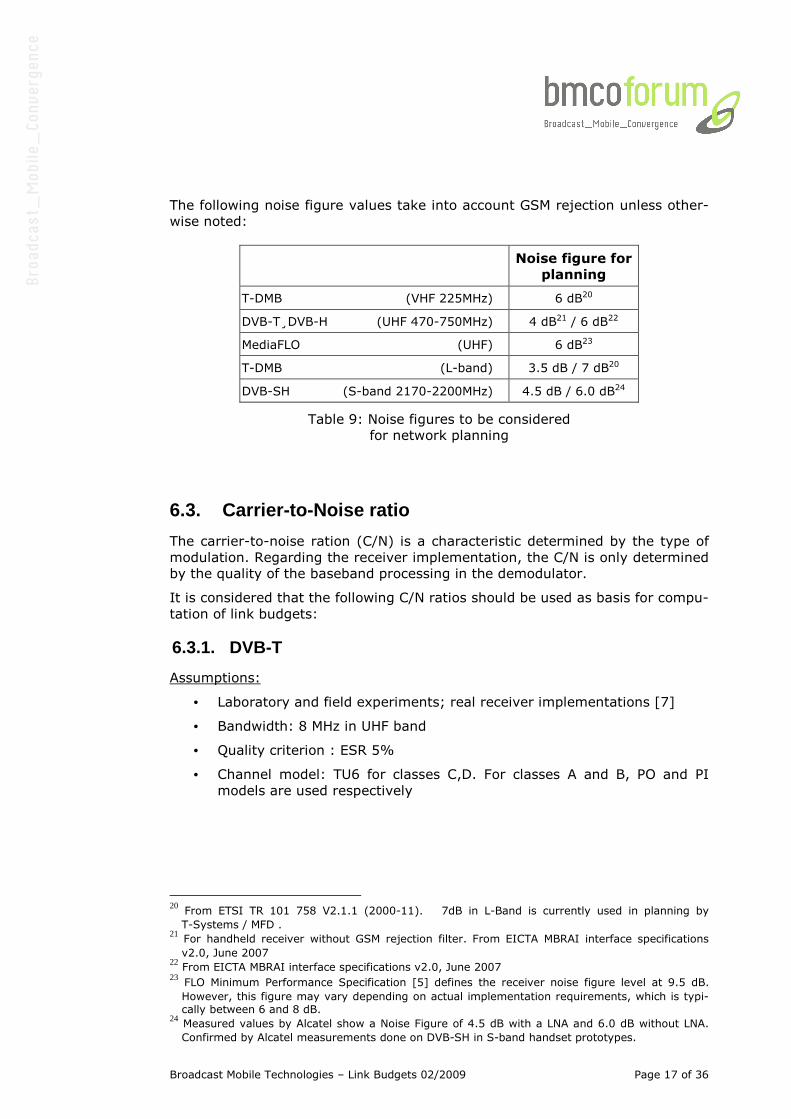
The following noise figure values take into account GSM rejection unless other-
wise noted:
Noise figure for
planning
T-DMB (VHF 225MHz) 6 dB20
DVB-T¸DVB-H (UHF 470-750MHz) 4 dB21 / 6 dB22
MediaFLO (UHF) 6 dB23
T-DMB (L-band) 3.5 dB / 7 dB20
DVB-SH (S-band 2170-2200MHz) 4.5 dB / 6.0 dB24
Table 9: Noise figures to be considered
for network planning
6.3. Carrier-to-Noise ratio
The carrier-to-noise ration (C/N) is a characteristic determined by the type of
modulation. Regarding the receiver implementation, the C/N is only determined
by the quality of the baseband processing in the demodulator.
It is considered that the following C/N ratios should be used as basis for compu-
tation of link budgets:
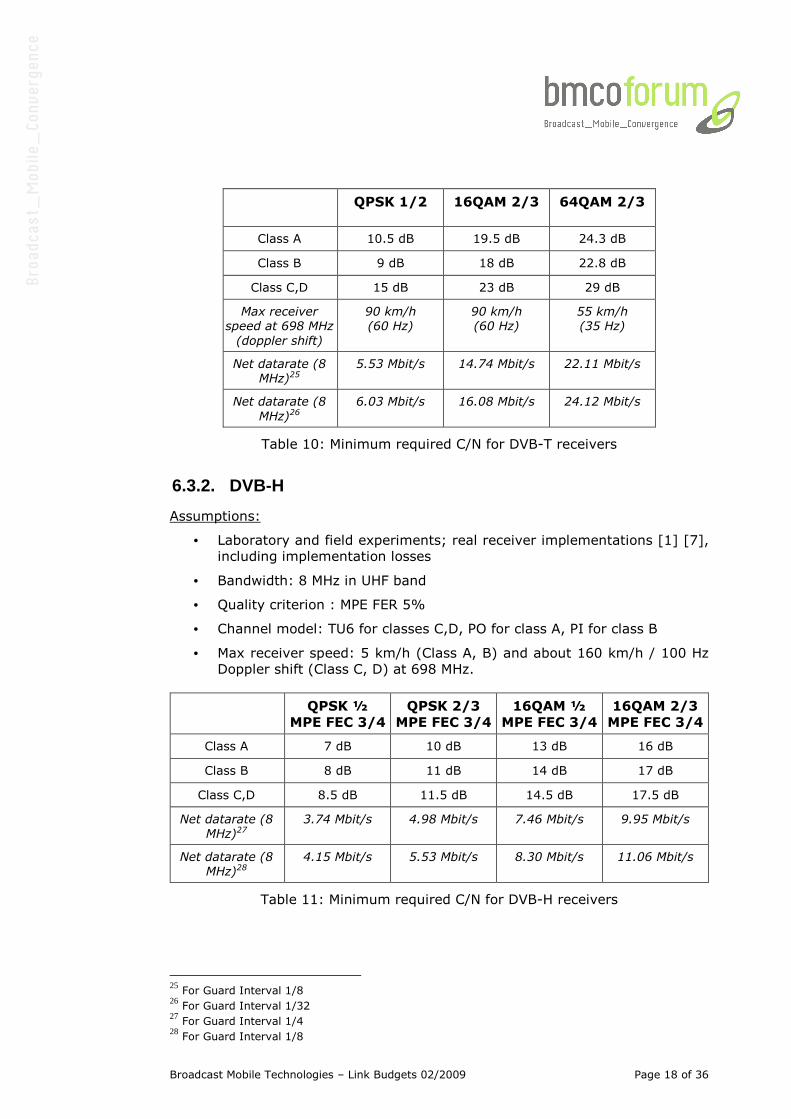
6.3.1. DVB-T
Assumptions:
• Laboratory and field experiments; real receiver implementations [7]
• Bandwidth: 8 MHz in UHF band
• Quality criterion : ESR 5%
• Channel model: TU6 for classes C,D. For classes A and B, PO and PI
models are used respectively
20 From ETSI TR 101 758 V2.1.1 (2000-11). 7dB in L-Band is currently used in planning by
T-Systems / MFD . 21 For handheld receiver without GSM rejection filter. From EICTA MBRAI interface specifications
v2.0, June 2007 22 From EICTA MBRAI interface specifications v2.0, June 2007
23 FLO Minimum Performance Specification [5] defines the receiver noise figure level at 9.5 dB.
However, this figure may vary depending on actual implementation requirements, which is typi-cally between 6 and 8 dB.
24 Measured values by Alcatel show a Noise Figure of 4.5 dB with a LNA and 6.0 dB without LNA.
Confirmed by Alcatel measurements done on DVB-SH in S-band handset prototypes.
Broadcast Mobile Technologies – Link Budgets 02/2009 Page 18 of 36
QPSK 1/2 16QAM 2/3 64QAM 2/3
Class A 10.5 dB 19.5 dB 24.3 dB
Class B 9 dB 18 dB 22.8 dB
Class C,D 15 dB 23 dB 29 dB
Max receiver
speed at 698 MHz
(doppler shift)
90 km/h
(60 Hz)
90 km/h
(60 Hz)
55 km/h
(35 Hz)
Net datarate (8
MHz)25
5.53 Mbit/s 14.74 Mbit/s 22.11 Mbit/s
Net datarate (8
MHz)26
6.03 Mbit/s 16.08 Mbit/s 24.12 Mbit/s
Table 10: Minimum required C/N for DVB-T receivers
6.3.2. DVB-H
Assumptions:
• Laboratory and field experiments; real receiver implementations [1] [7],
including implementation losses
• Bandwidth: 8 MHz in UHF band
• Quality criterion : MPE FER 5%
• Channel model: TU6 for classes C,D, PO for class A, PI for class B
• Max receiver speed: 5 km/h (Class A, B) and about 160 km/h / 100 Hz
Doppler shift (Class C, D) at 698 MHz.
QPSK ½
MPE FEC 3/4
QPSK 2/3
MPE FEC 3/4
16QAM ½
MPE FEC 3/4
16QAM 2/3
MPE FEC 3/4
Class A 7 dB 10 dB 13 dB 16 dB
Class B 8 dB 11 dB 14 dB 17 dB
Class C,D 8.5 dB 11.5 dB 14.5 dB 17.5 dB
Net datarate (8
MHz)27
3.74 Mbit/s 4.98 Mbit/s 7.46 Mbit/s 9.95 Mbit/s
Net datarate (8
MHz)28
4.15 Mbit/s 5.53 Mbit/s 8.30 Mbit/s 11.06 Mbit/s
Table 11: Minimum required C/N for DVB-H receivers
25 For Guard Interval 1/8
26 For Guard Interval 1/32
27 For Guard Interval 1/4
28 For Guard Interval 1/8
Broadcast Mobile Technologies – Link Budgets 02/2009 Page 19 of 36
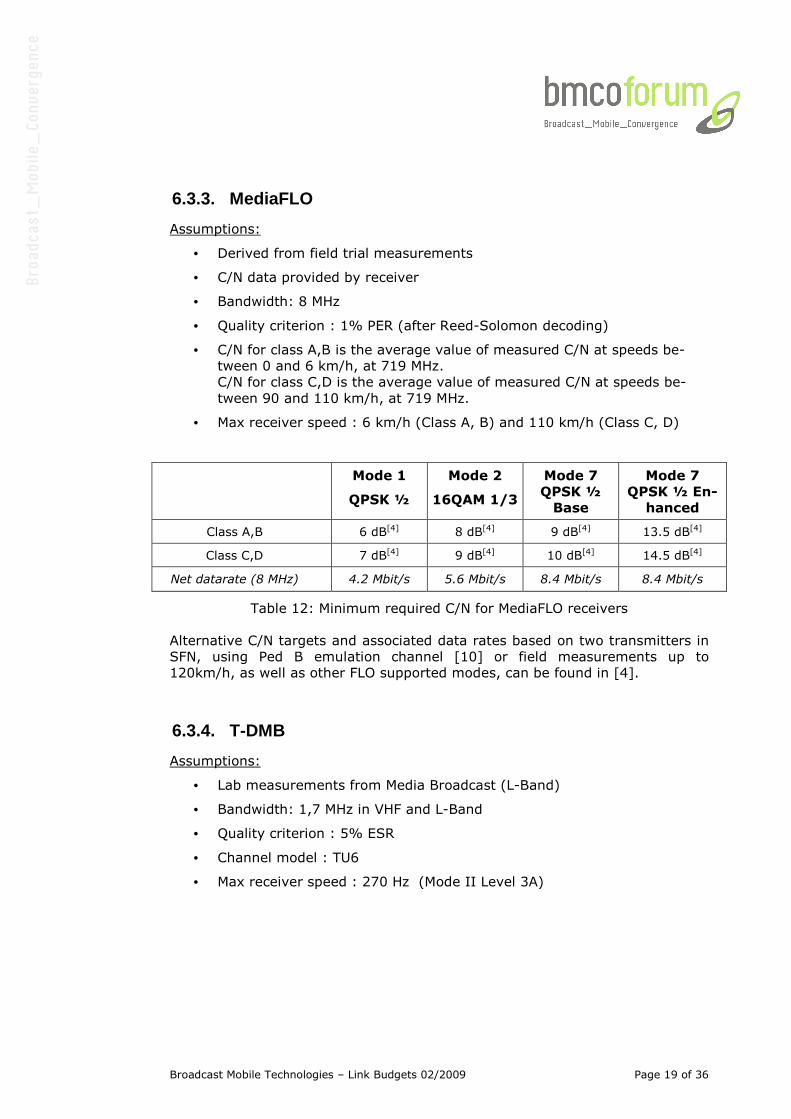
6.3.3. MediaFLO
Assumptions:
• Derived from field trial measurements
• C/N data provided by receiver
• Bandwidth: 8 MHz
• Quality criterion : 1% PER (after Reed-Solomon decoding)
• C/N for class A,B is the average value of measured C/N at speeds be-
tween 0 and 6 km/h, at 719 MHz.
C/N for class C,D is the average value of measured C/N at speeds be-
tween 90 and 110 km/h, at 719 MHz.
• Max receiver speed : 6 km/h (Class A, B) and 110 km/h (Class C, D)
Mode 1
QPSK ½
Mode 2
16QAM 1/3
Mode 7
QPSK ½
Base
Mode 7
QPSK ½ En-
hanced
Class A,B 6 dB[4] 8 dB[4] 9 dB[4] 13.5 dB[4]
Class C,D 7 dB[4] 9 dB[4] 10 dB[4] 14.5 dB[4]
Net datarate (8 MHz) 4.2 Mbit/s 5.6 Mbit/s 8.4 Mbit/s 8.4 Mbit/s
Table 12: Minimum required C/N for MediaFLO receivers
Alternative C/N targets and associated data rates based on two transmitters in
SFN, using Ped B emulation channel [10] or field measurements up to
120km/h, as well as other FLO supported modes, can be found in [4].
6.3.4. T-DMB
Assumptions:
• Lab measurements from Media Broadcast (L-Band)
• Bandwidth: 1,7 MHz in VHF and L-Band
• Quality criterion : 5% ESR
• Channel model : TU6
• Max receiver speed : 270 Hz (Mode II Level 3A)

Broadcast Mobile Technologies – Link Budgets 02/2009 Page 20 of 36
Mode I/II Level
3A
Class A,B 12 dB
Class C,D 13 dB
Net data rate 1.06 Mbit/s
Table 13: Minimum required C/N
for T-DMB receivers
C/N values for other Protection Levels are under study
6.3.5. DVB-SH
Assumptions:
• Lab measurements from CELTIC B21C project [8]
• Includes provisioning implementation margin for the demodulator
• Bandwidth: 5 MHz in S-Band (2170 MHz)
• Short Time Interleaving (i.e. terrestrial applications): 160 to 320 ms
• Quality criterion : FER 5%
• Channel model: TU6 in terrestrial propagation conditions
• Max receiver speed : 5 km/h (Class A, B) and about 160 km/h (Class C,
D)
QPSK 1/3 TC
QPSK 1/2 TC
16QAM 1/3 TC
Class A, B, C, D 29, 30 3.0 dB 6.3 dB 9.1 dB
Net data rate (5 MHz)31 2.22 Mbit/s 3.35 Mbit/s 4.44 Mbit/s
Net data rate (5 MHz)32 2.46 Mbit/s 3.73 Mbit/s 4,93 Mbit/s
Table 14: Minimum required C/N for DVB-SH receivers
29 From CELTIC B21C project measurements.
30 In vehicular usage, the required C/N is about 1 dB lower at a specific speed (90 km/h in the
above configurations)
31 For Guard Interval 1/4
32 For Guard Interval 1/8

Broadcast Mobile Technologies – Link Budgets 02/2009 Page 21 of 36
6.4. Coverage classes
For network planning purposes, five reception categories are defined, consider-
ing that some combinations of usage scenarios and quality of coverage levels
require similar typical field strength at 1.5m.
A BMCO coverage class is defined to cover the requirements of all usage sce-
narios and coverage quality levels that map to this class. For example, The
required median field strength for a BMCO_I class is the highest field strength
of “Acceptable outdoor pedestrian” and “Acceptable mobile roof-top” scenarios.
Table 15 lists BMCO coverage classes by order of increasing difficulty of recep-
tion (e.g. class BMCO_V also covers all other usage scenarios of lower classes).
BMCO_I - Acceptable outdoor pedestrian
- Acceptable mobile roof-top
BMCO_II - Good mobile roof-top
- Good outdoor pedestrian
BMCO_III - Acceptable Light indoor
- Acceptable mobile incar
BMCO_IV
- Good mobile in-car
- Acceptable deep indoor
- Good light indoor
BMCO_V - Good deep indoor
Table 15: BMCO classes of coverage by expected order
of increasing difficulty of reception
These categories map to usage scenarios and quality of coverage as described
in the table below:
Quality of Coverage:
Usage scenario: Good Acceptable
Class A Outdoor pedestrian BMCO_II BMCO_I
Class C Mobile roof-top BMCO_II BMCO_I
Class D Mobile in-car BMCO_IV BMCO_III
Class B1 Light-indoor BMCO_IV BMCO_III
Class B2 Deep-indoor BMCO_V BMCO_IV
Table 16: BMCO classes mapping to usage scenarios

Broadcast Mobile Technologies – Link Budgets 02/2009 Page 22 of 36
7. Reference minimum field strengths for network planning
The minimum median equivalent field strength values are calculated as de-
scribed in section 3 and rounded to the upper dB, for all BMCO coverage classes
previously defined in section 6.4. Terminals with built-in antenna (section
4.4) are assumed except for Mobile car roof-top reception. Network
architecture dependent factors (section 5) are not taken into account.
Note: The following minimum field strength values can be converted to mini-
mum received power values in dBm using equation (2) in section 3, page 8:
7.1. DVB-T
DVB-T QPSK 1/2 16QAM 2/3 64QAM 2/3
C – Mobile roof-top 67 dBµV/m 75 dBµV/m 81 dBµV/m
A – Outdoor 65 dBµV/m 74 dBµV/m 79 dBµV/m
D – Mobile in-car 80 dBµV/m 88 dBµV/m 94 dBµV/m
B1 – Light indoor 78 dBµV/m 87 dBµV/m 92 dBµV/m
B2 – Deep indoor 85 dBµV/m 94 dBµV/m 99 dBµV/m
Table 17: Required median field strength at 1.5m, for a DVB-T service, at
698MHz, 8MHz bandwidth, „good“ quality of coverage
DVB-T QPSK 1/2 16QAM 2/3 64QAM 2/3
C – Mobile roof-top 61 dBµV/m 69 dBµV/m 75 dBµV/m
A – Outdoor 59 dBµV/m 68 dBµV/m 73 dBµV/m
D – Mobile in-car 75 dBµV/m 83 dBµV/m 89 dBµV/m
B1 – Light indoor 69 dBµV/m 78 dBµV/m 83 dBµV/m
B2 – Deep indoor 76 dBµV/m 85 dBµV/m 90 dBµV/m
Table 18: Required median field strength at 1.5m, for a DVB-T service, at
698MHz, 8MHz bandwidth, „acceptable“ quality of coverage

Broadcast Mobile Technologies – Link Budgets 02/2009 Page 23 of 36
DVB-T QPSK 1/2 16QAM 2/3 64QAM 2/3
BMCO_I - Acceptable outdoor pedestrian
- Acceptable mobile roof-top
61 dBµV/m 69 dBµV/m 59 dBµV/m
BMCO_II - Good mobile roof-top
- Good outdoor pedestrian
67 dBµV/m 75 dBµV/m 81 dBµV/m
BMCO_III - Acceptable Light indoor
- Acceptable mobile incar
75 dBµV/m 83 dBµV/m 89 dBµV/m
BMCO_IV
- Good mobile in-car or
- Acceptable deep indoor
- Good light indoor
80 dBµV/m 88 dBµV/m 94 dBµV/m
BMCO_V - Good deep indoor 85 dBµV/m 94 dBµV/m 99 dBµV/m
Table 19: Required median field strength at 1.5m, for a DVB-T service, at
698MHz, 8MHz bandwidth, by class of coverage
7.2. DVB-H
DVB-H QPSK ½
MPE FEC 3/4
QPSK 2/3
MPE FEC 3/4
16QAM ½
MPE FEC 3/4
16QAM 2/3
MPE FEC 3/4
C – Mobile roof-top 61 dBµV/m 64 dBµV/m 67 dBµV/m 70 dBµV/m
A – Outdoor 62 dBµV/m 65 dBµV/m 68 dBµV/m 71 dBµV/m
D – Mobile in-car 74 dBµV/m 77 dBµV/m 80 dBµV/m 83 dBµV/m
B1 – Light indoor 77 dBµV/m 80 dBµV/m 83 dBµV/m 86 dBµV/m
B2 – Deep indoor 84 dBµV/m 87 dBµV/m 90 dBµV/m 93 dBµV/m
Table 20: Required median field strength at 1.5m, for a DVB-H service, at
698MHz, 8MHz bandwidth, „good“ quality of coverage

Broadcast Mobile Technologies – Link Budgets 02/2009 Page 24 of 36
DVB-H QPSK ½
MPE FEC 3/4
QPSK 2/3
MPE FEC 3/4
16QAM ½
MPE FEC 3/4
16QAM 2/3
MPE FEC 3/4
C – Mobile roof-top 55 dBµV/m 58 dBµV/m 61 dBµV/m 64 dBµV/m
A – Outdoor 55 dBµV/m 58 dBµV/m 61 dBµV/m 64 dBµV/m
D – Mobile in-car 68 dBµV/m 71 dBµV/m 74 dBµV/m 77 dBµV/m
B1 – Light indoor 68 dBµV/m 71 dBµV/m 74 dBµV/m 77 dBµV/m
B2 – Deep indoor 75 dBµV/m 78 dBµV/m 81 dBµV/m 84 dBµV/m
Table 21: Required median field strength at 1.5m, for a DVB-H service, at
698MHz, 8MHz bandwidth, „acceptable“ quality of coverage
DVB-H QPSK ½
MPE FEC
3/4
QPSK 2/3
MPE FEC
3/4
16QAM ½
MPE FEC
3/4
16QAM 2/3
MPE FEC
3/4
BMCO_I
- Acceptable outdoor pe-destrian
- Acceptable mobile roof-
top
55 dBµV/m
58 dBµV/m
61 dBµV/m
64 dBµV/m
BMCO_II - Good mobile roof-top
- Good outdoor pedestrian
62
dBµV/m
65
dBµV/m
68
dBµV/m
71
dBµV/m
BMCO_III - Acceptable Light indoor
- Acceptable mobile incar
68 dBµV/m
71 dBµV/m
74 dBµV/m
77 dBµV/m
BMCO_IV
- Good mobile in-car or
- Acceptable deep indoor
- Good light indoor
77
dBµV/m
80
dBµV/m
83
dBµV/m
86
dBµV/m
BMCO_V - Good deep indoor 84
dBµV/m 87
dBµV/m 90
dBµV/m 93
dBµV/m
Table 22: Required median field strength at 1.5m, for a DVB-H service, at
698MHz, 8MHz bandwidth, by class of coverage
Broadcast Mobile Technologies – Link Budgets 02/2009 Page 25 of 36
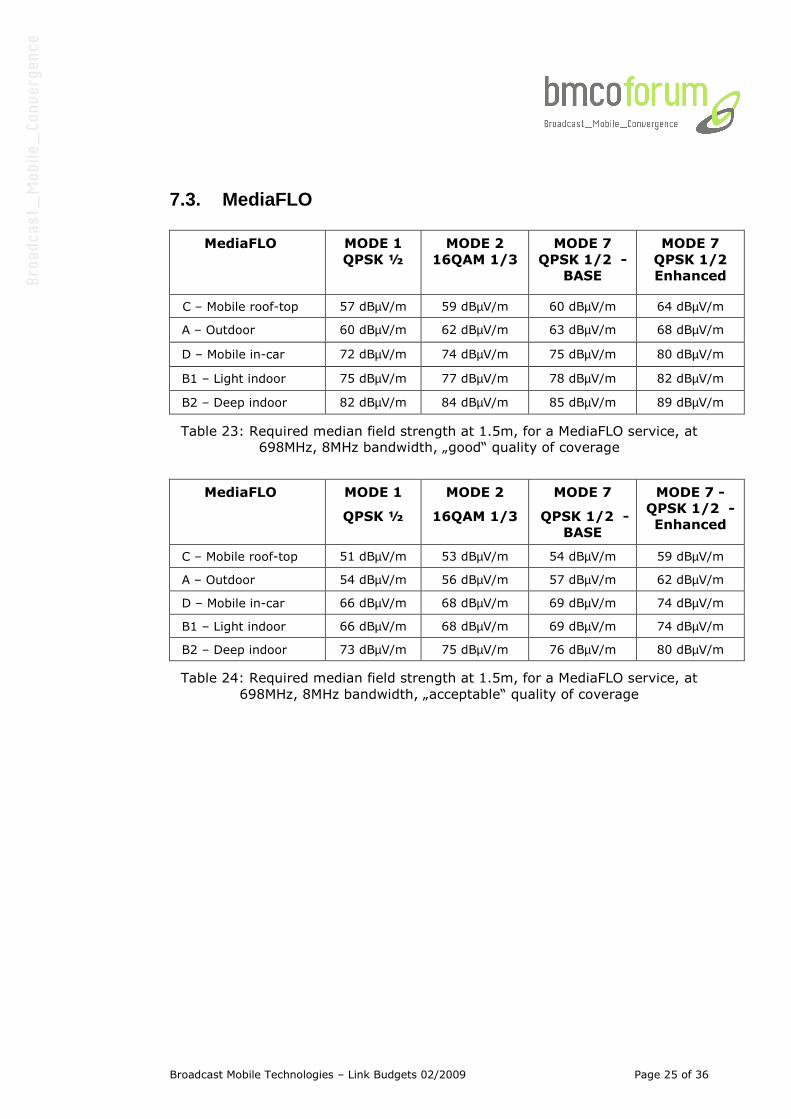
7.3. MediaFLO
MediaFLO MODE 1
QPSK ½
MODE 2
16QAM 1/3
MODE 7
QPSK 1/2 -
BASE
MODE 7
QPSK 1/2
Enhanced
C – Mobile roof-top 57 dBµV/m 59 dBµV/m 60 dBµV/m 64 dBµV/m
A – Outdoor 60 dBµV/m 62 dBµV/m 63 dBµV/m 68 dBµV/m
D – Mobile in-car 72 dBµV/m 74 dBµV/m 75 dBµV/m 80 dBµV/m
B1 – Light indoor 75 dBµV/m 77 dBµV/m 78 dBµV/m 82 dBµV/m
B2 – Deep indoor 82 dBµV/m 84 dBµV/m 85 dBµV/m 89 dBµV/m
Table 23: Required median field strength at 1.5m, for a MediaFLO service, at
698MHz, 8MHz bandwidth, „good“ quality of coverage
MediaFLO MODE 1
QPSK ½
MODE 2
16QAM 1/3
MODE 7
QPSK 1/2 -
BASE
MODE 7 -
QPSK 1/2 -
Enhanced
C – Mobile roof-top 51 dBµV/m 53 dBµV/m 54 dBµV/m 59 dBµV/m
A – Outdoor 54 dBµV/m 56 dBµV/m 57 dBµV/m 62 dBµV/m
D – Mobile in-car 66 dBµV/m 68 dBµV/m 69 dBµV/m 74 dBµV/m
B1 – Light indoor 66 dBµV/m 68 dBµV/m 69 dBµV/m 74 dBµV/m
B2 – Deep indoor 73 dBµV/m 75 dBµV/m 76 dBµV/m 80 dBµV/m
Table 24: Required median field strength at 1.5m, for a MediaFLO service, at
698MHz, 8MHz bandwidth, „acceptable“ quality of coverage

Broadcast Mobile Technologies – Link Budgets 02/2009 Page 26 of 36
MediaFLO MODE 1
QPSK ½
MODE 2
16QAM 1/3
MODE 7
QPSK 1/2
BASE
MODE 7
QPSK 1/2
Enhanced
BMCO_I
- Acceptable outdoor pe-destrian
- Acceptable mobile roof-
top
54 dBµV/m
56 BµV/m
57 dBµV/m
62 dBµV/m
BMCO_II - Good mobile roof-top
- Good outdoor pedestrian
60 dBµV/m
62 dBµV/m
63 dBµV/m
68 dBµV/m
BMCO_III - Acceptable Light indoor
- Acceptable mobile incar
66 dBµV/m
68 dBµV/m
69 dBµV/m
73 dBµV/m
BMCO_IV
- Good mobile in-car or
- Acceptable deep indoor
- Good light indoor
75
dBµV/m
77 dBµV/m
78 dBµV/m
82 dBµV/m
BMCO_V - Good deep indoor 82
dBµV/m 84
dBµV/m 85
dBµV/m 89
dBµV/m
Table 25: Required median field strength at 1.5m, for a MediaFLO service, at
600MHz, 8MHz bandwidth, by class of coverage

Broadcast Mobile Technologies – Link Budgets 02/2009 Page 27 of 36
7.4. T-DMB
Mode I and mode II at protection level 3A are respectively used for VHF and
L-band.
For L-Band, two cases are provided (see section 4.4):
• field strength for future terminals : 0dBi antenna gain and 3.5 dB noise
figure
• field strength for current terminals : -5dBi antenna gain and 7 dB noise
figure
VHF
225 MHz
L-Band
1470 MHz
L-Band
currently
1470 MHz
T-DMB Mode I
PL-3A
Mode II
PL-3A
Mode II
PL-3A
Class C 52 dBµV/m 63 dBµV/m 67 dBµV/m
Class A 61 dBµV/m 58 dBµV/m 67 dBµV/m
Class D 72 dBµV/m 70 dBµV/m 79 dBµV/m
Class B1 72 dBµV/m 74 dBµV/m 83 dBµV/m
Class B2 79 dBµV/m 81 dBµV/m 90 dBµV/m
Table 26: Required median field strength at 1.5m,
for a T-DMB service, „good“ quality of coverage
VHF
225 MHz
L-Band
1470 MHz
L-Band
currently
1470 MHz
T-DMB Mode I
PL-3A
Mode II
PL-3A
Mode II
PL-3A
Class C 47 dBµV/m 57 dBµV/m 61 dBµV/m
Class A 54 dBµV/m 52 dBµV/m 61 dBµV/m
Class D 67 dBµV/m 64 dBµV/m 73 dBµV/m
Class B1 64 dBµV/m 66 dBµV/m 75 dBµV/m
Class B2 70 dBµV/m 72 dBµV/m 81 dBµV/m
Table 27: Required median field strength at 1.5m, for a T-DMB service, „ac-
ceptable“ quality of coverage

Broadcast Mobile Technologies – Link Budgets 02/2009 Page 28 of 36
VHF 225
MHz
L-Band
1470 MHz
L-Band
currently
1470 MHz
T-DMB Mode I PL-
3A
Mode II
PL-3A
Mode II
PL-3°
BMCO_I - Acceptable outdoor pedestrian
- Acceptable mobile roof-top
54
dBµV/m
57
dBµV/m
61
dBµV/m
BMCO_II - Good mobile roof-top
- Good outdoor pedestrian
61
dBµV/m
63
dBµV/m
67
dBµV/m
BMCO_III - Acceptable Light indoor
- Acceptable mobile incar
67
dBµV/m
66
dBµV/m
75
dBµV/m
BMCO_IV
- Good mobile in-car or
- Acceptable deep indoor
- Good light indoor
72
dBµV/m
74
dBµV/m
83
dBµV/m
BMCO_V - Good deep indoor 79
dBµV/m
81
dBµV/m
90
dBµV/m
Table 28: Required median field strength at 1.5m, for a T-DMB service, by class
of coverage
7.5. DVB-SH
The field strengths below assume a terrestrial reception (CGC – Complementary
Ground Component). An antenna gain of -3 dBi in class A,B,D is used for the
calculation below:
DVB-SH QPSK TC 1/3 QPSK 1/2 16QAM 1/3
C – Mobile roof-top 56 dBµV/m 59 dBµV/m 62 dBµV/m
A – outdoor 57 dBµV/m 61 dBµV/m 63 dBµV/m
D – Mobile in-car 68 dBµV/m 71 dBµV/m 74 dBµV/m
B1 – Light indoor 75 dBµV/m 78 dBµV/m 81 dBµV/m
B2 – Deep indoor 81 dBµV/m 84 dBµV/m 87 dBµV/m
Table 29: Required median field strength at 1.5m, for a DVB-SH service, at
2200 MHz, 5MHz bandwidth, „good“ quality of coverage without Rx diversity

Broadcast Mobile Technologies – Link Budgets 02/2009 Page 29 of 36
DVB-SH QPSK TC 1/3 QPSK TC 1/2 16QAM 1/3
C – Mobile roof-top 50 dBµV/m 54 dBµV/m 56 dBµV/m
A – outdoor 51 dBµV/m 55 dBµV/m 57 dBµV/m
D – Mobile in-car 62 dBµV/m 66 dBµV/m 68 dBµV/m
B1 – Light indoor 66 dBµV/m 70 dBµV/m 72 dBµV/m
B2 – Deep indoor 72 dBµV/m 75 dBµV/m 78 dBµV/m
Table 30: Required median field strength at 1.5m, for a DVB-SH service, at
2200 MHz, 5MHz bandwidth, „acceptable “ quality of coverage without Rx diver-
sity
Tentative application of BMCO classes to DVB-SH:
DVB-SH QPSK TC 1/3 QPSK TC 1/2 16QAM 1/3
BMCO_I - Acceptable outdoor pedestrian
- Acceptable mobile roof-top
51
dBµV/m
53
dBµV/m
57
dBµV/m
BMCO_II - Good mobile roof-top
- Good outdoor pedestrian
57 dBµV/m
61 dBµV/m
63 dBµV/m
BMCO_III - Acceptable Light indoor
- Acceptable mobile incar
66
dBµV/m
70
dBµV/m
72
dBµV/m
BMCO_IV
- Good mobile in-car
- Acceptable deep indoor
- Good light indoor
75
dBµV/m
78
dBµV/m
81
dBµV/m
BMCO_V - Good deep indoor 81
dBµV/m
84
dBµV/m
87
dBµV/m
Table 31: Required median field strength at 1.5m, for a DVB-SH service, at
2200MHz, 5MHz bandwidth, by class of coverage without Rx diversity
Note that in the case of DVB-SH using S–band, reception diversity is a feature
available for handset terminals.
As an example, using expected reception diversity (section 5.2), field strength
levels are33
• 2.5 dB lower for in-car reception in BMCO class III (e.g. 63.5 dBµV/m
with QPSK TC 1/3)
• 6 dB lower for BMCO class V (e.g. 75 dBµV/m for BMCO_V with QPSK TC
1/3)
33 Measured with experimental receivers. To be confirmed using the first integrated handheld termi-
nals.
Broadcast Mobile Technologies – Link Budgets 02/2009 Page 30 of 36
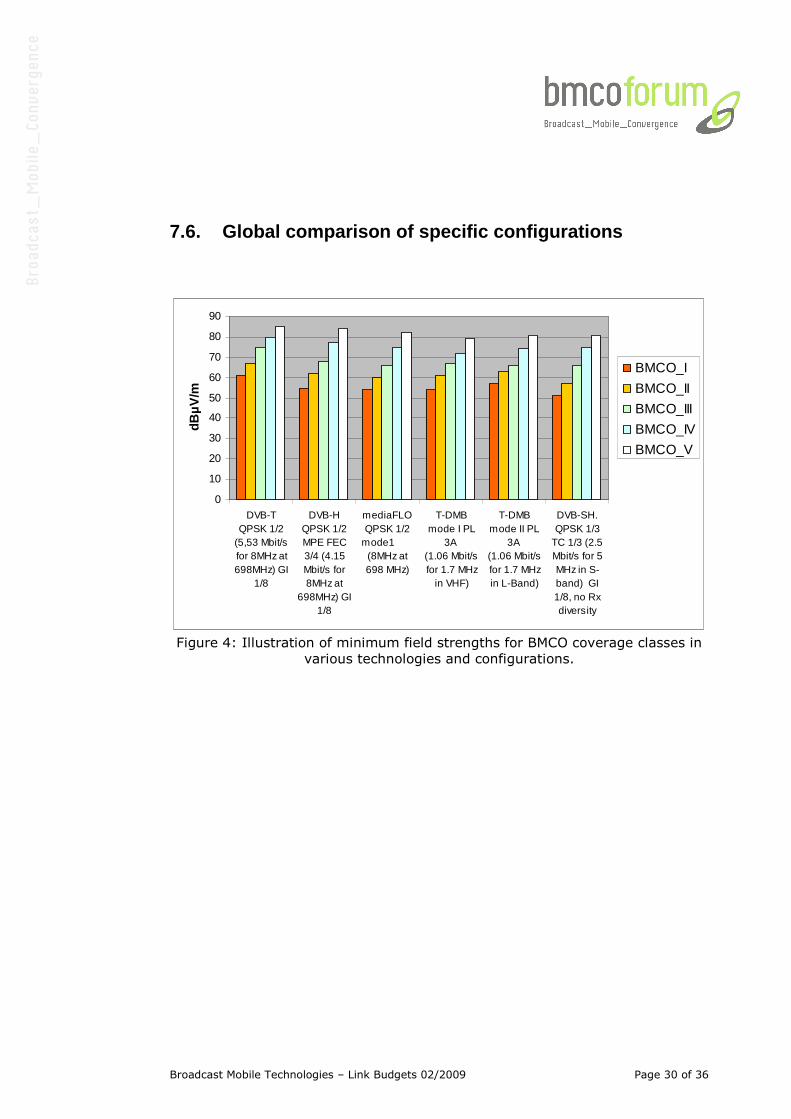
7.6. Global comparison of specific configurations
0
10
20
30
40
50
60
70
80
90
DVB-TQPSK 1/2
(5,53 Mbit/sfor 8MHz at698MHz) GI
1/8
DVB-HQPSK 1/2MPE FEC3/4 (4.15Mbit/s for8MHz at
698MHz) GI1/8
mediaFLOQPSK 1/2
mode1 (8MHz at698 MHz)
T-DMBmode I PL
3A (1.06 Mbit/sfor 1.7 MHz
in VHF)
T-DMBmode II PL
3A (1.06 Mbit/sfor 1.7 MHzin L-Band)
DVB-SH.QPSK 1/3
TC 1/3 (2.5Mbit/s for 5MHz in S-band) GI1/8, no Rxdiversity
dBµV
/m
BMCO_I
BMCO_II
BMCO_III
BMCO_IV
BMCO_V
Figure 4: Illustration of minimum field strengths for BMCO coverage classes in
various technologies and configurations.

Broadcast Mobile Technologies – Link Budgets 02/2009 Page 31 of 36
8. Reference minimum terminal sensitivity This section provides the required terminal sensitivity expressed as the mini-
mum median field strength values required, in laboratory conditions. It consid-
ers terminals with built-in antenna, because for such type of terminals the an-
tenna is the only interface to verify the sensitivity in terms of field strength. For
other types of terminals (Class C – car roof-top antenna) the characteristics of
antenna (Gain), the Noise figure and minimum C/N can be measured separately
to derive the required sensitivity.
The required field strengths given below assume a laboratory environment (at
step 2 of link budget, in section 3): no penetration losses nor combined field
strength variations nor other losses are taken into account. In case of terminals
with an external antenna, the field strengths given below can be decreased by
the difference of antenna gain (section 4.4, Table 5).
8.1. DVB-T Mode QPSK 1/2 16 QAM 2/3 64 QAM 2/3
Ch. Profile PO PI TU6 PO PI TU6 PO PI TU6 474 MHz 53 51 57 62 60 65 67 65 71 698 MHz 53 52 58 62 61 66 67 65 72 858 MHz 53 51 57 62 60 65 67 65 71
Table 32: Required DVB-T terminal sensitivity (dBµV/m)
Notes:
- 8 MHz Bandwidth - the “other losses” given in section 4.5 are not taken into account. - in the case of non connected terminals, the above values should be 2 dB lower
due to better noise figure (section 6.2).
8.2. DVB-H Mode QPSK 1/2 QPSK 2/3 16 QAM 1/2 16 QAM 2/3
Ch. Profile PO PI TU6 PO PI TU6 PO PI TU6 PO PI TU6 474 MHz 49 50 51 52 53 54 55 56 57 58 59 60 698 MHz 50 51 51 53 54 54 56 57 57 59 60 60 858 MHz 49 50 51 52 53 54 55 56 57 58 59 60
Table 33: Required DVB-H terminal sensitivity (dBµV/m)
Notes:
- 8 MHz Bandwidth - the “other losses” given in section 4.5 are not taken into account. - in the case of non connected terminals, the above values should be 2 dB lower
due to better noise figure (section 6.2).
Broadcast Mobile Technologies – Link Budgets 02/2009 Page 32 of 36
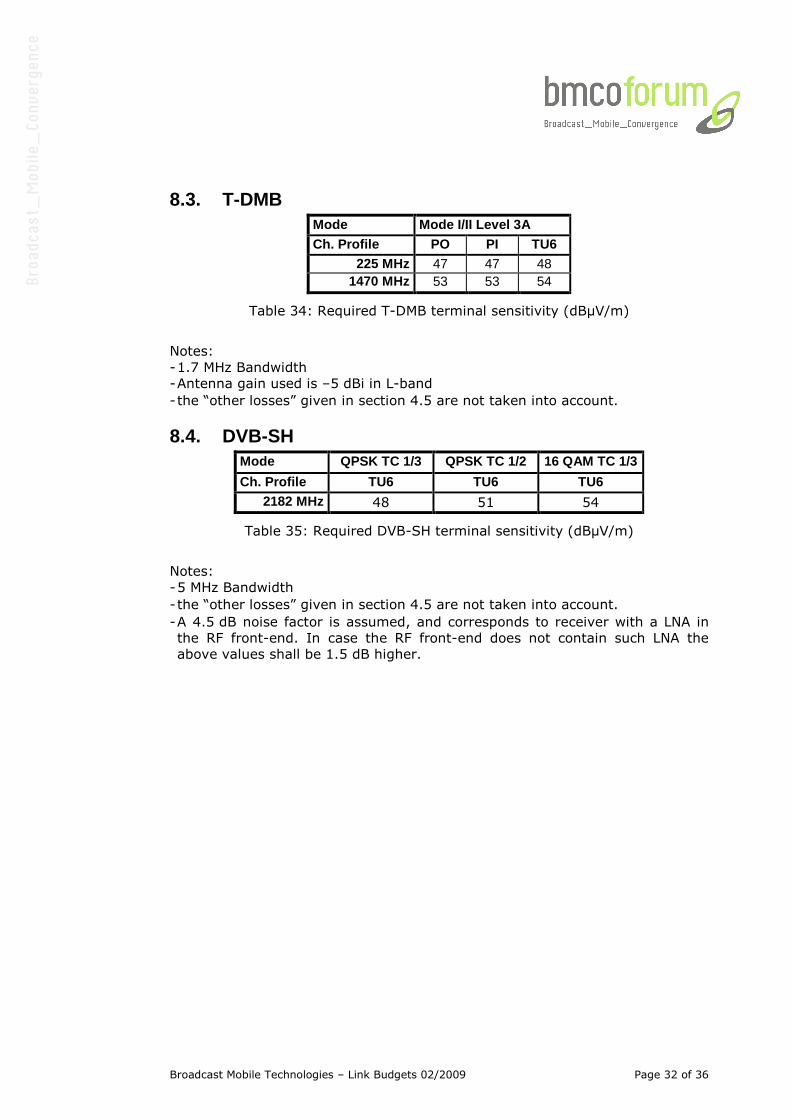
8.3. T-DMB Mode Mode I/II Level 3A Ch. Profile PO PI TU6
225 MHz 47 47 48 1470 MHz 53 53 54
Table 34: Required T-DMB terminal sensitivity (dBµV/m)
Notes:
- 1.7 MHz Bandwidth - Antenna gain used is –5 dBi in L-band - the “other losses” given in section 4.5 are not taken into account.
8.4. DVB-SH Mode QPSK TC 1/3 QPSK TC 1/2 16 QAM TC 1/3
Ch. Profile TU6 TU6 TU6 2182 MHz 48 51 54
Table 35: Required DVB-SH terminal sensitivity (dBµV/m)
Notes:
- 5 MHz Bandwidth - the “other losses” given in section 4.5 are not taken into account. - A 4.5 dB noise factor is assumed, and corresponds to receiver with a LNA in
the RF front-end. In case the RF front-end does not contain such LNA the
above values shall be 1.5 dB higher.

Broadcast Mobile Technologies – Link Budgets 02/2009 Page 33 of 36
9. Conclusion The link budget model for mobile television services presented in this paper is a
common methodology that is applicable to mobile TV technologies which are
available today: DVB-T, DVB-H, MediaFLO, T-DMB, DVB-SH. The key parame-
ters are provided, for each specific technology.
This reference link budget is intended to help broadcasters in their network
planning and network dimensions estimation. Five BMCO coverage classes are
defined, accounting for groups of usage scenarios with similar field strength
levels requirements.
Reference planning values for all usage scenarios (outdoor, indoor, pedestrian
and in-car mobility) are provided. These values are indicative and may be fur-
ther refined depending on the specific characteristics of technologies, coverage
requirements and broadcasters goals.

Broadcast Mobile Technologies – Link Budgets 02/2009 Page 34 of 36
10. References [1] ETSI TR102-377 v1.1.1 - DVB-H implementation guidelines,
2005-02
[2] ITU-R Recommendation R.1546: "Method for point-to-area
predictions for terrestrial services in the frequency range 30
MHz to 3000 MHz".
[3] The Chester 1997 Multilateral Coordination Agreement relating
to Technical Criteria, Coordination Principles and Procedures
for the introduction of Terrestrial Digital Video Broadcasting
(DVB-T), Chester, 25 July 1997
[4] MediaFLO™ Field Test Report, , 80-T1021-1 Rev. F,
Qualcomm, September 30 , 2008
[5] Forward Link Only Minimum Performance Specifications for
Devices and Transmitters, respectively TIA-1102 and TIA-1103
[6] Digital Video Broadcast to handheld via hybrid satel-
lite/terrestrial network, Alcatel Telecommunications Review,
Space applications & technologies, Q2/2006
[7] IEC 62002-1, Ed.2.0, May 2008 : Mobile & Portable DVB-T/H
Radio Access – Part1 : Interface Specification
[8] CELTIC B21C project Deliverable D14, DVB-SH Lab Tests
[9] Measurements of radio performances for UMTS terminals in
speech mode, 3GPP TR 25.914 V7.0.0 (2006-06)
[10] Recommendation ITU-R M.1225, Guidelines for Evaluation of
Radio Transmission Technologies for IMT-2000
Broadcast Mobile Technologies – Link Budgets 02/2009 Page 35 of 36
11. On bmco forum “Broadcast Network Structure and Coverage Expectations” Group
One of the key success factors and at the same time one of most cost sensitive
aspects of mobile broadcast services is mobile indoor reception. In pilots ex-
periences will be gathered by the broadcast network operators on the number
of transmitters and repeaters, the parameter settings, antenna gain of termi-
nals etc.
This “Broadcast Network Structure and Coverage Expectations” work item tar-
gets on
• Analysis of the influence of broadcast network structure and parameters
on coverage expectations
• Exchange of experiences from national trials and other testbeds as well
as from simulations
The following members of the “Broadcast Network Structure and Coverage Ex-
pectations” Group contributed to this study:
• Alcatel-Lucent
• DiBcom
• Institut für Rundfunktechnik
• Media Broadcast
• Nokia
• Qualcomm
• TDF
• Teracom
• Technical University of Braunschweig

Broadcast Mobile Technologies – Link Budgets 02/2009 Page 36 of 36
Annex: Area vs. Edge Coverage Area coverage can map to edge coverage.
Table 25 below gives a mapping example, using a field strength variation of
5.5 dB and a propagation slope of 3.5. Propagation slope characterises attenua-
tion of the environment as an exponent of (1/r), r being the distance to the
transmitter. Propagation slope equals 2 (20dB/dec) in free space and 3.5
(35dB/dec) in a typical urban environment.
area % 84,0% 87,3% 90,3% 92,6% 94,6% 96,0% 97,3% 98,1%
edge % 60,1% 67,4% 73,8% 79,1% 84,1% 88,2% 91,0% 93,6%
area % 98,7% 99,1% 99,5% 99,7% 99,8% 99,9% 99,9%
edge % 95,7% 96,9% 98,2% 99,0% 99,1% 99,7% 99,8%
Table 36: Area vs. Edge coverage
Mobile Broadcast Technologies
Link Budgets
Editors:
Jean-Jacques Delmas (TDF)
Pierre Bretillon (TDF)
bmcoforum e.V.
Attilastr. 61-67
12105 Berlin
Germany
Tel: +49 30 255 680-0
Fax: +49 30 255 680-99
www.bmcoforum.org
Broadcast Mobile Convergence Forum
forum
Update 02/2009


![FM Microwave Radio Link - Elber radio TV broadcast …UserManuals~NBFM_[EN].pdfFM Microwave Radio Link Transmitter T_NBFM-01 ... microwave radio link. It is able to transfer, over](https://img.pdfslide.us/doc/110x75/5ab9bcd47f8b9aa6018e34cf/fm-microwave-radio-link-elber-radio-tv-broadcast-usermanualsnbfmenpdffm.jpg)