Embed Size (px)
DESCRIPTION
mobile computing
Citation preview

0
APPICATION DEVELOPMENT LAB MANUAL -TECH SE SECOND SEMISTER THIS MANUAL COVERS ALL EXPERIMENTS ON DATAMINING USING WEKA AND CASE STUDY OF LMS AND RRS USING RATIONAL ROSE DASARI RAMARAO 10/13/2012

1
Table of Contents Part-I .......................................................................................................................................... 2
Using .......................................................................................................................................... 2
Information Mining Tool ........................................................................................................... 2
(WEKA Tool) ............................................................................................................................ 2
WEKA INTRODUCTION .................................................................................................... 3
1. PREPROCESSING THE DATA ....................................................................................... 6
2. FINDING ASSOCIATIONS .......................................................................................... 11
BUILDING CLASSIFIERS................................................................................................. 14
3. Decision Tree Algorithm ............................................................................................. 14
4. Bayesian Algorithm ......................................................................................................... 18
5. CLUSTERING DATA..................................................................................................... 21
K-means Algorithm ......................................................................................................... 21
SELECT ATTRIBUTES ..................................................................................................... 25
Data Transformation on Weka File ............................................................................ 28
ROC Curve........................................................................................................................... 34
Part-II ....................................................................................................................................... 41
Using UML Tools .................................................................................................................... 41
& .............................................................................................................................................. 41
Rational Rose Tools ................................................................................................................. 41
INTRODUCTION ............................................................................................................... 42
UNIFIED MODELLING LANGUAGE (UML) ............................................................. 43
RATIONAL ROSE SOFTWARE ................................................................................... 45
CONCEPTUAL MODEL OF UML ................................................................................ 48
Case Study ........................................................................................................................... 55
Of ......................................................................................................................................... 55
Library Management System ............................................................................................... 55
Use Case Context diagram ............................................................................................... 59
Class diagram ................................................................................................................... 61
Activity diagram .............................................................................................................. 62
Component diagram ......................................................................................................... 65
RAILWAY RESERVATION AND CANCELLATION SYSTEM.................................... 67
Use Case Diagram for Reservation .................................................................................. 68
Use Case Diagram For Cancellation ................................................................................ 69
Sequence Diagrams .......................................................................................................... 70
Collaboration Diagrams ................................................................................................... 72

2
Application Development Lab
Part-I
Using
Information Mining Tool
(WEKA Tool)

3
WEKA INTRODUCTION
It is a machine learning toolkit
Modules are:
1. The Explorer
2. The Experimenter
3. The Knowledge flow GUI
4. Simple CLI
Weka : The software
1. Machine learning/data mining software written in Java (distributed under the
GNU Public License)
2. Used for research, education, and applications
3. Complements “Data Mining” by Written & Frank
Main features: 1. Comprehensive set of data pre-processing tools, learning algorithms and evaluation
methods
2. Graphical user interfaces (incl. data visualization)
3. Environment for comparing learning algorithms

4
WEKA: versions There are several versions of WEKA:
1. WEKA 3.0: “book version” compatible with description in data mining book
2. WEKA 3.2: “GUI version” adds graphical user interfaces (book version is
command-line only)
3.WEKA 3.3: “development version” with lots of improvements
This talk is based on the latest snapshot of WEKA 3.3 (soon to be WEKA 3.4)
The Explorer
1. Preprocessing
2. Association
3. Classification
4. Clustering
5. Select Attributes
6. Visualization
The Experimenter
Experimenter makes it easy to compare the performance of different learning
schemes
For classification and regression problems
Results can be written into file or database
Evaluation options: cross-validation, learning curve, hold-out
Can also iterate over different parameter settings
Significance-testing built in!
The Knowledge Flow GUI
New graphical user interface for WEKA
Java-Beans-based interface for setting up and running machine learning experiments
Data sources, classifiers, etc. are beans and can be connected graphically
Data “flows” through components:
e.g.,
“data source” -> “filter” -> “classifier” -> “evaluator”
Layouts can be saved and loaded again later
The Simple CLI (command line interface) Enter commands in the text field at the bottom of the window. Use the up and down
arrows to move through previous commands.
Command completion for class names and files is initiated with <tab>. In order to
distinguish between files and class names file names either absolute or start with „.\‟.
<Alt+Backspace> is used for deleting the text in command line in chunks.

5
DATA MINING TECHNIQUES
USING
WEKA(3.6)

6
1. PREPROCESSING THE DATA
1. Data can be imported from a file in various formats: ARFF, CSV, C4.5, binary
2. Data can also be read from a URL or from an SQL database (using JDBC)
3. Pre-processing tools in WEKA are called “filters”
WEKA contains filters for:
Discretization, normalization, resampling, attribute selection, transforming
and combining attributes, …
PROCEDURE:
1. Click on open the File to get the data
2. Select relation from “data” file
3. Select class attributes from the relation
4. Click visualize all button to view the graphs of the attributes
5. Select a particular attribute to discretize
6. Select choose button for different pre processing filters
7. From the filters list select select attribute
8. Select discritize filter
9. Right click and open object editor screen
10. Choose unequal frequency option and change from false to true
11. Click ok
12. Click Apply button
13. Selected attributes screen is appeared
14. Close
SCREENS

7

8

9

10
11
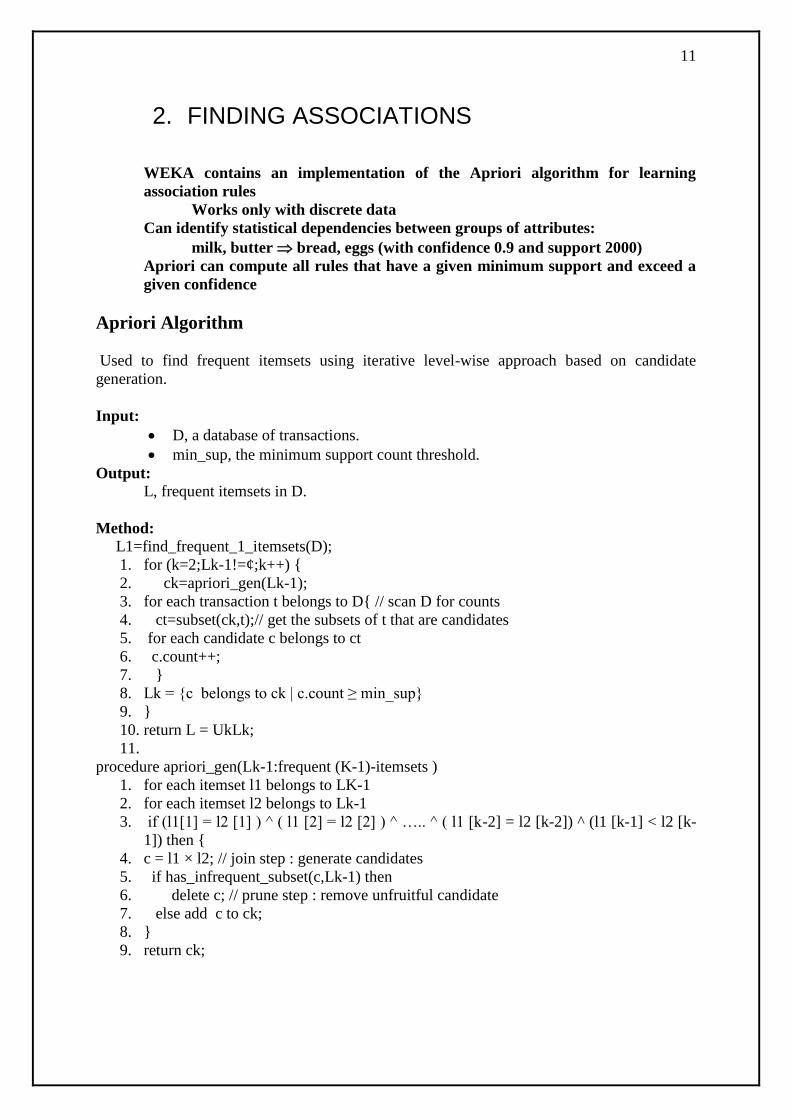
2. FINDING ASSOCIATIONS
WEKA contains an implementation of the Apriori algorithm for learning
association rules
Works only with discrete data
Can identify statistical dependencies between groups of attributes:
milk, butter bread, eggs (with confidence 0.9 and support 2000)
Apriori can compute all rules that have a given minimum support and exceed a
given confidence
Apriori Algorithm
Used to find frequent itemsets using iterative level-wise approach based on candidate
generation.
Input:
D, a database of transactions.
min_sup, the minimum support count threshold.
Output:
L, frequent itemsets in D.
Method:
L1=find_frequent_1_itemsets(D);
1. for (k=2;Lk-1!=¢;k++) {
2. ck=apriori_gen(Lk-1);
3. for each transaction t belongs to D{ // scan D for counts
4. ct=subset(ck,t);// get the subsets of t that are candidates
5. for each candidate c belongs to ct
6. c.count++;
7. }
8. Lk = {c belongs to ck | c.count ≥ min_sup}
9. }
10. return L = UkLk;
11. procedure apriori_gen(Lk-1:frequent (K-1)-itemsets )
1. for each itemset l1 belongs to LK-1
2. for each itemset l2 belongs to Lk-1
3. if (l1[1] = l2 [1] ) ^ ( l1 [2] = l2 [2] ) ^ ….. ^ ( l1 [k-2] = l2 [k-2]) ^ (l1 [k-1] < l2 [k-
1]) then {
4. c = l1 × l2; // join step : generate candidates
5. if has_infrequent_subset(c,Lk-1) then
6. delete c; // prune step : remove unfruitful candidate
7. else add c to ck;
8. }
9. return ck;

12
procedure has_infrequent_subset(c: candidate k-itemsets;
Lk-1 : frequent (k-1)-itemsets); // use prior knowledge
1. for each (k-1)-subset s of c
2. if s does not belongs to Lk-1 then
3. return TRUE;
4. return FALSE;
Screens

13

14
BUILDING CLASSIFIERS
Classifiers in WEKA are models for predicting nominal or numeric quantities
Implemented learning schemes include:
Decision trees and lists, instance-based classifiers, support vector machines,
multi-layer perceptrons, logistic regression, Bayes’ nets, …
“Meta”-classifiers include:
Bagging, boosting, stacking, error-correcting output codes, locally weighted
learning, …
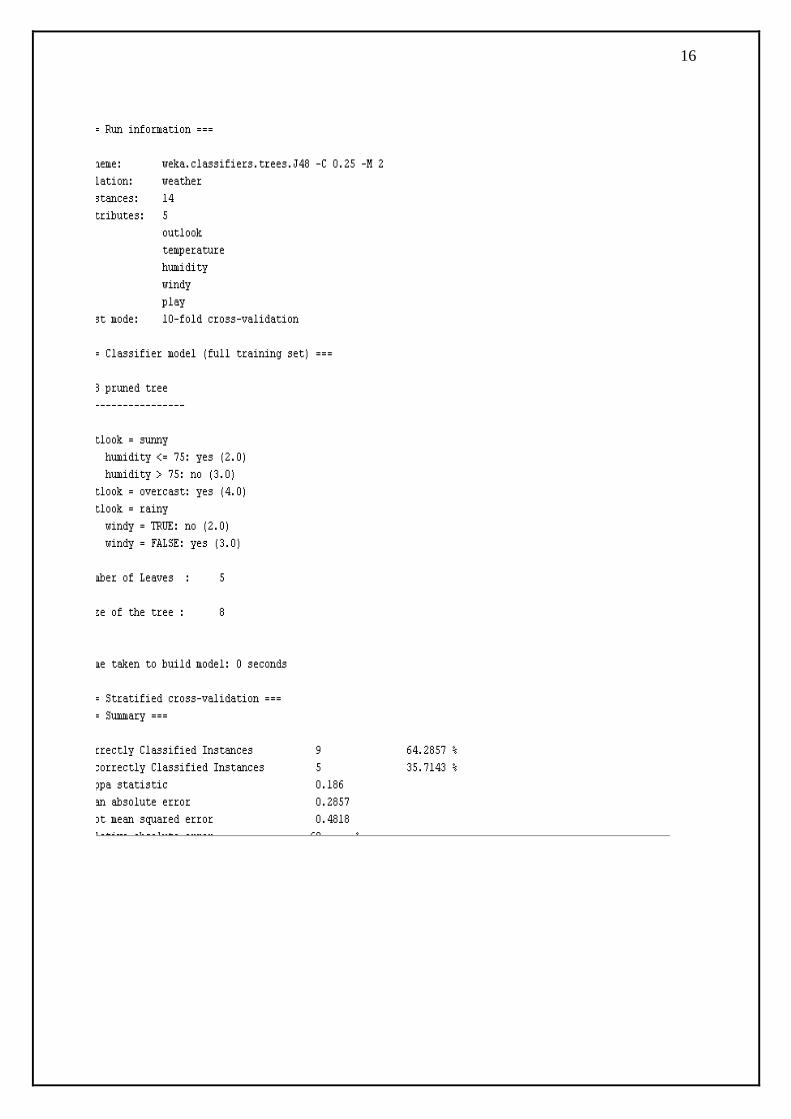
3. Decision Tree Algorithm Generate a decision tree from the training tuples of data partition D.
Input:
Data partition , D , which is a set of training tuples and their associated class labels;
attribute_list , the set of candidate attributes;
Attribute_selection_method , a procedure to determine the splitting criterion that
“best” partitions the data tuples into individual classes. This criterion consists of a
splitting_attribute and , possibly , either a split point or splitting subset.
Output:
A decision tree
Method:
1. create a node N;
2. if tuples in D are all of the same class , C then
3. return N as a leaf node labeled with the class C;
4. if attribute_list is empty then
5. return N as a leaf node labeled with the majority class in D; // majority voting
6. apply Attribute_selection_method (D , attribute_list) to find the “best”
splitting_criterion;
7. label node N with splitting_criterion;
8. if splitting_attribute is discrete-valued and
multiway splits allowed then // not restricted to binary trees
9. attribute_list <--- attribute_list - splitting_attribute;
// remove splitting_attribute
10. for each outcome j of splitting_criterion
// partition the tuples and grow subtrees for each partition
11. let Dj be the set of data tuples in D satisfying outcome j; // a partition
12. if Dj is empty then
13. attach a leaf labeled with the majority class in D to node N;
14.else attach the node returned by Generate_decision_tree(Dj, attribute_list) to node N

15
end for;
15.return N;
Screens
16

17

18
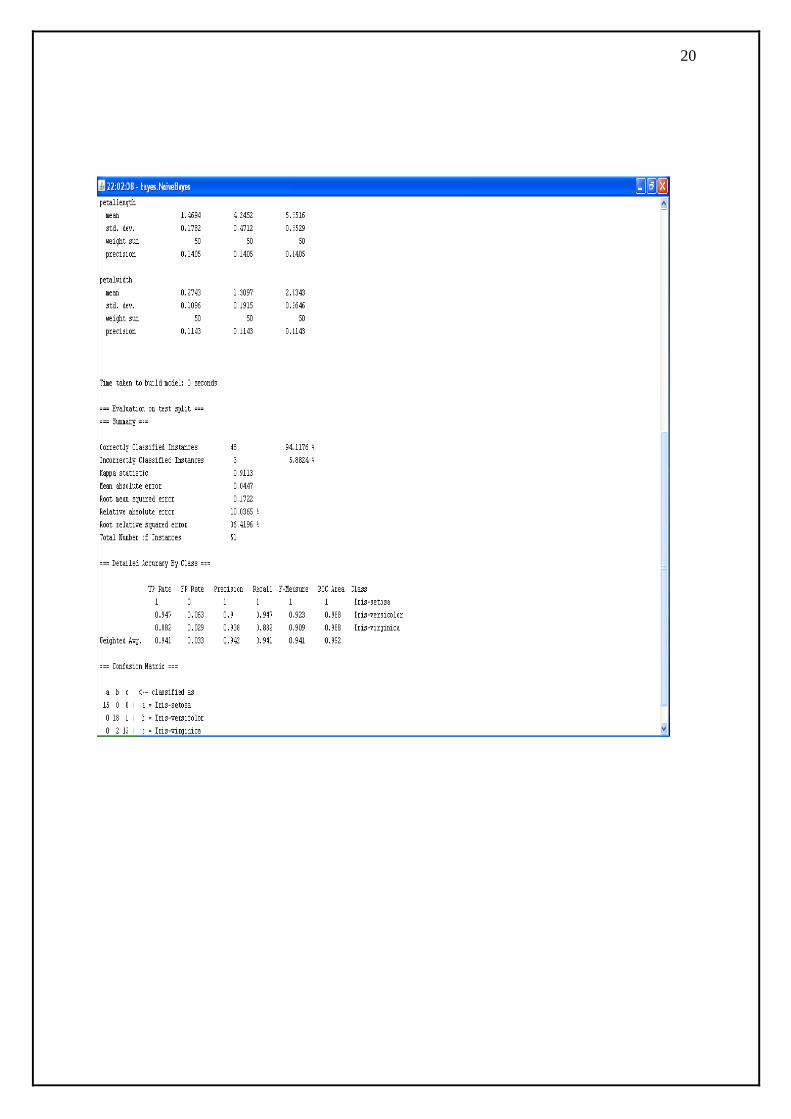
4. Bayesian Algorithm
Step 1:
Each data sample is represented by n dimensional vector.
X=(x1,x2,x3………xn) depicting n measurements made on the
sample form n attributes respectively A1,A2,…….An.
Step 2:
Suppose that there are m classes C1,C2,…..Cm. Given an unknown data sample
X . This algorithm will predict that X belongs to the class having the highest posterior
probability conditioned on X i.e unknown sample X assigns to the class Ci iff
P(Ci / X) > P(Cj / X) for i ≤ j ≤ m , j ≠ i.
We maximize P(Ci / X) as (P(X / Ci).P(Ci)) / P(X).
Step 3:
As P(X) is constant for all classes only P(X / Ci).P(Ci) need to be maximized.
Step 4:
Given data sets having many attributes it is expensive to compute P(X / Ci).
If the attributes are independent to each other, so that the formula for
n
P(X / Ci) = P(Xk / Ci).
K=1
The probabilities P(X1 / Ci) , P(X2 / Ci) , P(X3 / Ci)…..P(Xk / Ci) can be
estimated from the following training samples.
a. If Ak is categorical then P(Xk / Ci) = Sik / S where Sik = number of training samples.
b. If Ak is continuous-valued then we use Gaussian distribution
(Xk-µci)2 / (2σci)2
P(Xk / Ci) = g(Xk,µci, σci)= 1/√2 σci.℮ .
Where µci is mean and σci is standard deviation of class Ci.
Step 5:
In order to classify an unknown sample P(X / Ci).P(Ci) is evaluated for each class
Ci. Sample X is then assigning to the class Ci iff
P(X / Ci).P(Ci) > P(X / Cj).P(Cj) for i ≤ j ≤ m , j ≠ i.

19
Screens
20

21
5. CLUSTERING DATA
WEKA contains “clusterers” for finding groups of similar instances in a dataset
Implemented schemes are:
k-Means, EM, Cobweb, X-means, FarthestFirst
Clusters can be visualized and compared to “true” clusters (if given)
Evaluation based on loglikelihood if clustering scheme produces a probability
distribution
K-means Algorithm
The k-means algorithm for partitioning , where each cluster‟s
center is represented by the mean value of the objects in the cluster.
Input :
K: the number of clusters,
D: a data set containing n objects.
Output:
A set of k clusters.
Method: 1. arbitrarily choose k objects from D as the initial cluster centers;
2. repeat
3. (re) assign each object to the cluster to which the object is the most similar , based
on the mean value of the objects in the cluster;
4. update the cluster means , i.e , calculate the mean value of the objects for each
cluster;
5. until no change;
Screens

22

23

24

25
SELECT ATTRIBUTES
Panel that can be used to investigate which (subsets of) attributes are the most
predictive ones
Attribute selection methods contain two parts:
A search method: best-first, forward selection, random, exhaustive, genetic
algorithm, ranking
An evaluation method: correlation-based, wrapper, information gain, chi-
squared, …
Very flexible: WEKA allows (almost) arbitrary combinations of these two
Information Gain:
Info A (D)=| D1 | Entropy(D1) + | D2 | Entropy(D2) | D | | D |
Entropy:
m
Entropy = -∑ pi log2 ( pi )
i=1
Screens

26

27

28
Data Transformation on Weka File
Step-1: Creat a file in notepad and save with extension .arff @RELATION EMPLOYEE @ATTRIBUTE ID REAL @ATTRIBUTE NAME { RAJESH, NANDA, NARENDRA, SATYA, VAMSI, PHANI } @ATTRIBUTE AGE REAL @ATTRIBUTE SEX { MALE, FEMALE } @ATTRIBUTE POST { CHAIRMAN, DIRECTOR, GM, AM, FM, SM } @ATTRIBUTE SALARY REAL @ATTRIBUTE HOUSE { YES, NO } @DATA 9999 RAJESH 55 MALE CHAIRMAN 50000 YES 8888 NANDA 45 MALE DIRECTOR 30000 YES 7777 NARENDRA 30 MALE GM 20000 YES 6666 SATYA 30 MALE AM 15000 NO 5555 VAMSI 40 MALE FM 18000 YES 4444 PHANI 50 MALE SM 19000 YES Step-2: Open weak 3.5 select knowledge flow from Application Step-3: Bring Arff Loader from data Sources to Knowledge flow layout Step-4: Bring Discretise , Standardise and Normalise To Knowledge flow layout Step-5: Bring Three arff Savers from Data Sinks to Knowledge flow layout Step-6: Configure Arff Loader and three Arff Savers

29
Step-7: Link from arff Loader to Descretise, Standardise and Normalise Step-8: Link from Descretise to arff Saver Step-9: Link from Standardise to arff Saver Step-10: Link from Normalise to arff Saver Step-11: Finally start Loader from arff Loader Knowledge Flow Diagram:

30
Original Data:

31
Descretise Data:

32
Normalize Data:

33
Standardise Data:
34
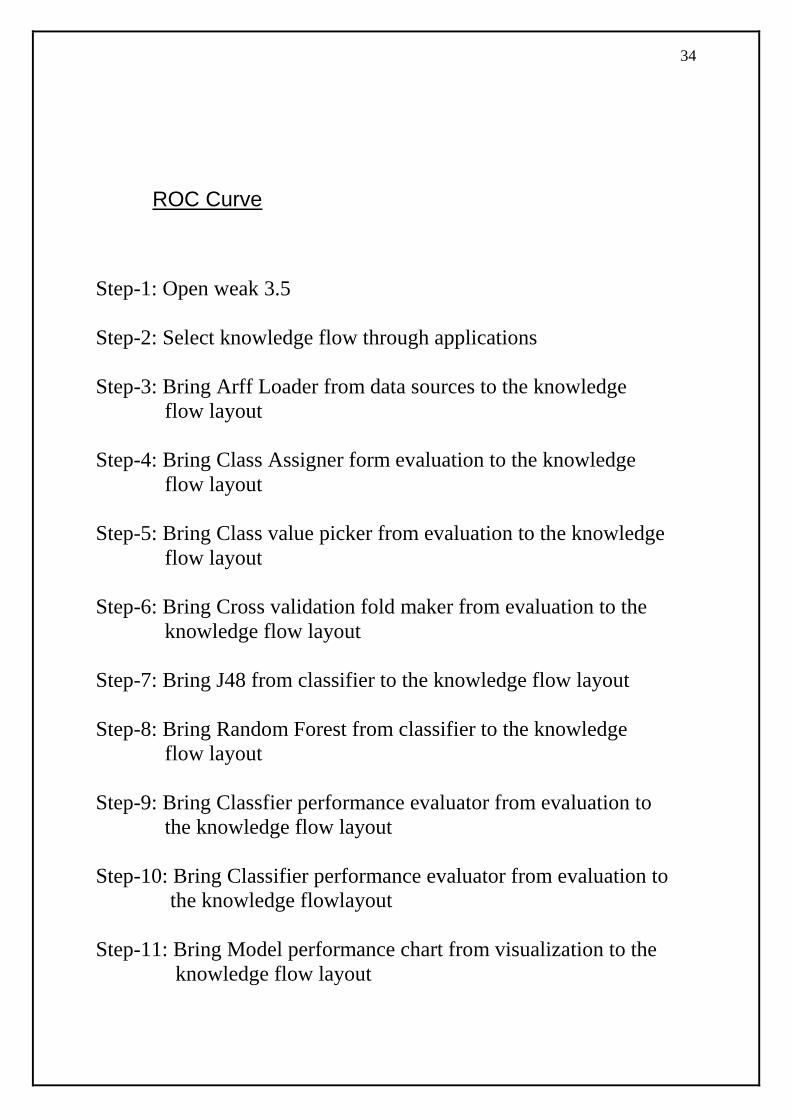
ROC Curve
Step-1: Open weak 3.5
Step-2: Select knowledge flow through applications
Step-3: Bring Arff Loader from data sources to the knowledge
flow layout
Step-4: Bring Class Assigner form evaluation to the knowledge
flow layout
Step-5: Bring Class value picker from evaluation to the knowledge
flow layout
Step-6: Bring Cross validation fold maker from evaluation to the
knowledge flow layout
Step-7: Bring J48 from classifier to the knowledge flow layout
Step-8: Bring Random Forest from classifier to the knowledge
flow layout
Step-9: Bring Classfier performance evaluator from evaluation to
the knowledge flow layout
Step-10: Bring Classifier performance evaluator from evaluation to
the knowledge flowlayout
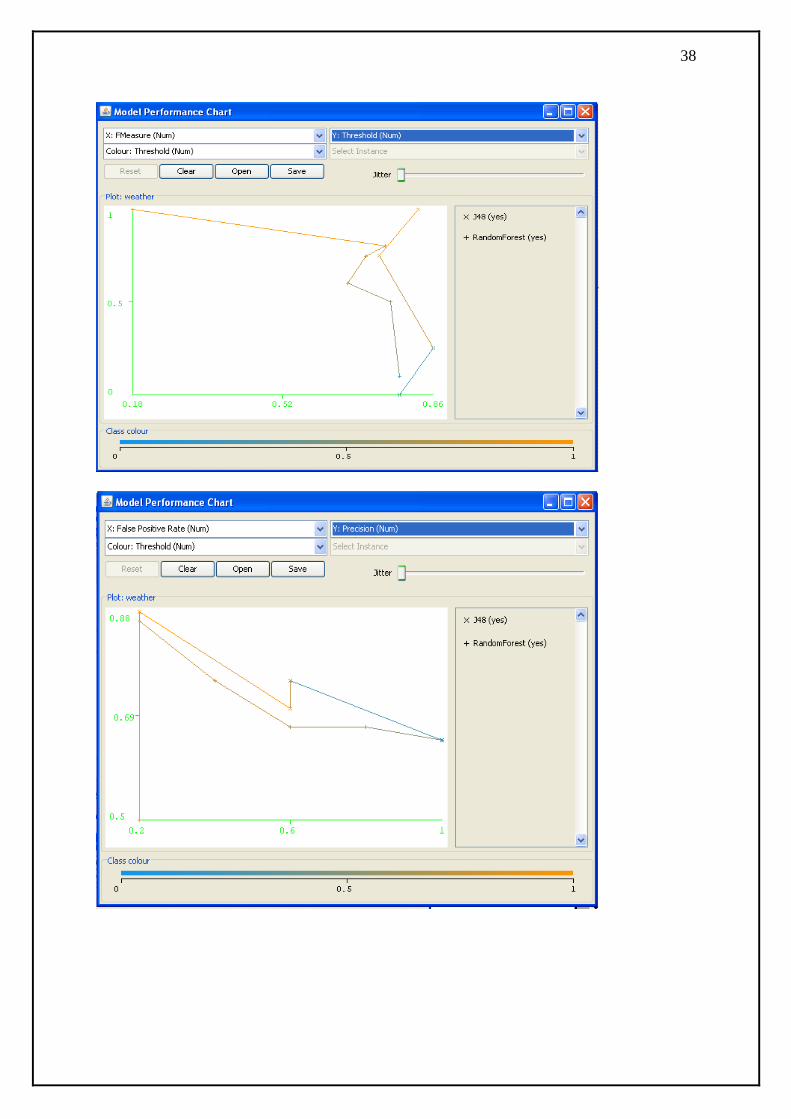
Step-11: Bring Model performance chart from visualization to the
knowledge flow layout

35
Step-12: Configure Arff Loader by selecting the predefined data
from weak
Step-13: Links Arff Loader to Class Assigner through datset
Step-14: Links Class Assigner to Class value picker through
Dataset
Step-15: Links Class Value Picker to Cross Validation Fold maker
through dataset
Step-16: Link Cross Validation Fold maker to J48 through training
set and test set
Step-17: Link Cross Validation Fold maker to Random Forest
through training set and test set
Step-18: Link J48 to classifier performance evaluator through
` batch classifier
Step-19: Link Random Forest to Classifier performance evaluator
through batch classifier
Step-20: Link Classifier performance evaluator to model
performance chart through Threshold data
Step-21: Link Classifier performance evaluator to model
performance chart through Threshold data
Step-22: Finally select Start Loader from Arff Loader

36
Knowledge Flow Layout:

37
Step-23: We can see the curves from model performance chart
through show plot
38

39
-+

40

41
Application Lab
Part-II
Using UML Tools
&
Rational Rose Tools

42
INTRODUCTION
OBJECT ORIENTED ANALYSIS AND DESIGN Object Oriented Analysis and Design
Object oriented analysis and design is a software engineering approach that models
the system as a group of interacting objects. Each object represents some activity of interest
in the system being modeled, and is characterized by its class, its state and its behavior.
Various modules can be created to show the static structure, dynamic behavior and
run time deployment of these collaborating. There are different notations for representing
these models such as Unified Modeling Language (UML).
Object Oriented Analysis
Object oriented analysis (OOA) applies object modeling techniques to analyze five
functional requirements for a system. Object oriented analysis looks at the problem domain,
with the aim of producing a conceptual model of the information that exists in the area being
analyzed. Analysis is done before the design. Object oriented analysis focuses on what the
system does.
Object Oriented Design
Object oriented design(OOD) elaborates the analysis models to produce
implementation specification.OOD transforms the conceptual model produced in object
oriented analysis to take account of the constraints imposed by chosen by architecture and
any non functional technologies or environmental constraints such as transaction throughput ,
response time, runtime platform, development environment or programming language. OOD
focuses on how the system does it.
Object Oriented System
An object oriented system is composed of objects. The behavior of the system results
from the collaboration of the objects. Collaboration of objects involves them send messages
to each other. Sending a message differs from calling a function in that what a target object
receives a message, it itself decides what function to carryout to service that message. The
same message may be implemented by many different functions, the one selected depending
on the state of the target object. The implementation of “message sending” varies depending
on the architecture of the system being modeled, and the location of the objects being
communicated with.

43
UNIFIED MODELLING LANGUAGE (UML) Unified Modeling Language (UML) is a standardized general purpose modeling
language in the field of software engineering. UML includes a set of graphical notation
techniques to create visual models of software intensive systems. The unified modeling
language is used to specify, visualize, modify, construct and document the artifacts of object
oriented software intensive system under development.
UML offers a standard way to visualize a system‟s architectural blueprints, including
elements such as actors, business processes, logical components, activities, programming
language statements, database schemas and reusable software components.
Object oriented languages (modeling) appeared sometime between the mid 1970s and
the late 1980s as methodologists, faced with a new genre of object oriented programming
languages and increasingly complex applications, began to experiment with alternative
approaches to analysis and design.
The team James Rumbaugh (OMT - Object Modeling Techniques) which was better
for object oriented analysis and Grady Booch‟s (Booch method) which was better for object
oriented design. Together Rumbaugh and Booch attempted to reconcile their two approaches
and stated work on a unified method. They are soon assisted in their efforts by Ivar Jacobson,
the creator of the object oriented software engineering (OOSE) method.
Under the technical leadership of the three amigos, an international consortium called
UML partners was organized in1996 to complete the Unified Modeling Language (UML)
specification. Those partners contributing to the UML 1.0 definition including digital
equipment corporation, HP, Ilogix, intellicorp, IBM, Microsoft, Oracle, rational, Texaus
Instruments, and Unisys. This collaboration resulted in the UML 1.0, a modeling language
that was well defined, expressive, powerful and applicable to a wide spectrum of problem
domain. UML 1.0 was offered for standardization to the object management group (OMG) in
January 1997, standardized in November 1997 by OMG.
UML is an international standard language. UML has matured significantly since
UML 1.1 several minor revisions (UML 1.3, 1.4, 1.5) fixed short comings and bugs with the
first version of UML, followed by the UML 2.0 major revision that was adopted by the OMG
in August 2005. The current versions of these standards follow: UML super structure version
2.2, UML infrastructure version 2.2, and UML diagram interchange version 1.0. The UML is
appropriate for modeling systems ranging from enterprise information systems to distributed
web based applications and even to hard real time embedded systems. The UML is a
44
language for visualization, specifying, constructing, and documenting the artifacts of a
software intensive system.
The UML is intended primarily for software intensive systems. It has been used
effectively for such domains as
Enterprise Information system
Banking and financial services
Retail
Telecommunications
Transportation
Defense/aerospace
Medical electronics
Scientific
Distributed web -based services
We create models for the different type of intensive systems by using UML.
Depending on the nature of the system, some models may be more important than others.
They are data intensive systems, GUI intensive systems, hard real time systems and
distributed system (web based applications).

45
RATIONAL ROSE SOFTWARE Rational rose is a powerful tool to aid in the analysis and design of object oriented
software systems. Rational rose provides support for two essentials elements of two modern
software component based development and controlled iterative development. These
concepts are conceptually independent. Their usage is combination in both natural and
beneficial. Rational rose model diagram architecture facilitates use of unified modeling
language, component object based modeling techniques (COM), and object modeling
techniques (OMT).Using semantic information ensures correctness by construction and
maintaining consistency.
Visual Modeling
Visual modeling is the mapping of real world process of a system to a graphical
representation. Models are useful for understanding problems communicating with everyone
involved with project customers, domain system experts, analysts, designers etc, modeling
complex systems, preparing documentation, and designing programs and data bases.
Modeling promotes better understanding of requirements clear designs and more
maintainable systems. As software systems becomes more complex we cannot understand
them in their entirely to effectively build a complex system. The developer begins by looking
at the big picture without getting caught up in the details.
A model in an idle way to portray the abstract of a complex program by filtering non
essential details. The development must abstract different views or blueprints of the system,
build models using precious notations. Verify that the models satisfy the requirements of the
system and gradually add details to transform the models into an implementation.
The models are designed to meet the needs of a specific audience or task there by
making them more understandable and manageable. Visual modeling has one communication
standard. The Unified Modeling Language provides a smooth transition between business
domain and computer domain.
Using the UML all members of a design team can work with a vocabulary,
minimizing the miss communication and increase efficiency. Visual modeling captures
business process by defining the software system requirements from the user‟s perspective.
This stream lines the design and development process.
Visual modeling also defines architecture by providing capabilities to capture the
logical software architecture independent of the software language. This method provides
flexibility to our system design since the logical architecture can always be mapped to a
different software language.

46
Finally with visual modeling we can reuse parts of a system or an application by
creating components of our design. These components can then be shared and reused by
different members of a team allowing changes to be easily incorporated into already existing
development software.
Rational rose is the visual modeling software solution that lets us create, analyze,
design, view, modify and manipulate components. We can graphically depict an overview of
the behavior of our system with the use case diagram. It shows object interactions organized
around objects and their links to one another. The state chart diagrams provide additional
analysis techniques for classes with significant dynamic behavior. A state chart causes a
transition from one state to another and actions the result from a state change. Activity
diagrams provide a way to model a class operation or the work floe of business process.
Rational rose provides the notation needed to specify and document the system architecture.
The logical architecture is captured in the class diagrams that contain the classes and
relationships that represent the key abstractions of the system under development. The
component architecture in component diagrams that focus on the actual software module
organization within the development environment. The development architecture is captured
in the deployment diagrams that maps software to process nodes showing the configuration
of runtime processing elements and then the software process.
Rational rose software Application
Rational rose is a powerful tool to aid the analysis and design of object oriented
software system. Rose is a tool meant to be used by the entire project team. It is a
responsibility of scope and design environment information and each team member can be
used to get the information they need.
Rose will help developers by generating Skelton code. Rose can be reverse engineer
the code and creates a model based on an existing based system. When a change occurs to the
model rose can modify the code to incorporate the change.
Different versions
Rose Modeler It allows us to create a model for a system but will not support code
generation or reverse engineering.
Rose Professional It allows us to generate code in c++, java, visual basic and oracle.
Views of Rational Rose Model
Use case view

47
The use case view includes all of the use cases, actors, and usage diagrams in the system.
The use case view also includes Use case documentation, which explains the flow through
the use case, including error handling. Interaction diagrams which display the objects or
classes involved in one flow through a use case. Packages which are groups or use case or
actors. A package is a UML mechanism that helps us to group similar items together.
Logical view
Logical view provides detailed picture of the pieces of the system and describes how the
pieces interrelated. The logical view also includes Classes which contains the information of
a system attributes. Class diagrams, which are used to view the classes in the system.
Interaction diagram, which are used to display the classes that participate which shows
dynamic behavior of an object. State transition diagrams which shows dynamic behavior of
an object. Packages which are groups of related classes. The flow of logical view is on the
logical structure of the system. In this view we can identify the process of the system,
examine the information and behavior of the system and examine relationship between
pieces.
Component View
A component view contains information about the code libraries, executable files, run
time libraries, and other components in the model. In rational rose components and
component diagrams displayed in the component view. The component view of the
system allows us to see the relationships between models of the code. Component
diagrams show the components and their relationships to each other. Packages which are
groups of related components.
Deployment view
Deployment view concerned with the physical view in concern with physical
deployment of the system, which may differs from the local architecture of the
system. The deployment may be two tired. The interface may be placed on one
machine while the business or database logic are located on another machine. Other
issues such as network band width, fault tolerance, response time and disaster
recovery are handled using deployment view

48
CONCEPTUAL MODEL OF UML UML is a language used for visualizing, specifying, constructing and documenting the
artifacts of a software intensive system.
Conceptual Model
The conceptual model of language UML requires three major elements to understand.
1. The UML basic building blocks.
2. The rules that dictate how these building blocks put together.
3. Some common mechanisms.
Building Blocks of UML
Things
Relationsh
ips
Diagrams
Things in UML
Structural things
i. Classes
ii. Interfaces
iii. Collaborations
iv. Use Cases
v. Active Classes
vi. Components
vii. Nodes Classes
Behavioral things
i. Interactions
ii. State machines
Grouping things
i. Packages
Annotational things
i. Notes
Relationships in UML
Dependency
Association
Generalization
Diagrams in UML
Class Diagram
Object Diagram

49
Use case Diagram
Sequence Diagram
Collaboration Diagram
Statechart Diagram
Activity Diagram
Component Diagram
Deployement Diagram
Things in UML
Structural Things
Structural things are nouns of the UML models. These are mostly static parts of a
model representing elements that are either conceptual or physical.
There are 7 kinds of structural things.
Class
A class is a set of description of set of objects that share the same attributes,
operations, relationships, and semantics. A class implements one or more interfaces.
Graphically a class is rendered as a rectangle usually including its name, attributes and
operations.
Interface
An interface is a collection of operations that specifies a service of a class or a
component. An interface describes the externally visible behavior of that element. An
interface might represent the complete behavior of a class or components or only a part of
that behavior.
An interface defines a set of operations implementations. Graphically an interface is
rendered as a circle together with its name. An interface rarely stand alone, rather it is
typically attached to a class or components.

50
Collaboration
Collaboration defines an interaction with roles and other elements to provide some
behavior. Collaborations will have structural and behavioral aspects. Collaboration will be
represented by an ellipse with dashed lines, usually including its name.
Use Case
A use case is a description of set of sequence of actions that a system performs. A use
case is used to structure the behavioral things on a model .A use case is realized by a
collaboration. Graphically a use case is rendered as an ellipse with solid lines, usually
including its name.
Place Order
Active Class
An active class is a class whose objects own one or more processes or threads. An
active class is just represented like a class with heavy lines with its name, attributes, and
operations.
Component
A component is a physical and replaceable part of a system. Components are artifacts
of the development process. A component typically represents the physical packaging of

51
logical elements such as classes, interfaces, and collaborations, graphically rendered as a
rectangle with tabs usually including only its name.
OrderForm.java
Node
A node is a physical element that exists at runtime and represents a computational
resource. A set of components may reside on abode and migrate from one node to another.
Graphically a node is rendered as a cube usually including only its name.
File Server
Behavioral Things
Behavioral things are dynamic parts of UML models. These are the verbs of a model,
representing behavior overtime and space. There are two primary kinds of behavioral things.
Interaction
An interaction is a behavior that comprises a set of messages among a set of objects
with in a particular context to accomplish to specific purpose. An interaction includes
messages, action sequences and links. Graphically a message is rendered as a direct line,
including its name and operations.
State Machine
A state machine is a behavior that specifies sequence of states of an object or an
interaction goes through during its life time in response to events together with its response to
those events. The behavioral of a individual class or a collaboration of classes may be
specified with a state machine. A state machine involves a number of other elements
including states, transitions, and events, activities. Graphically it is rendered as a rounded
rectangle usually including its name and its sub states.

52
Grouping things:
Grouping things are the organizational parts of the UML model into which a model
can be decomposed. There is one primary key of grouping things namely packages.
Packages
A package is a general purpose mechanism for organizing elements into groups.
Structural things, behavioral things, or even other grouping things may be placed in a
package. Graphically it is rendered as a tabbed folder, usually including its name and its
content.
java.swing.*
Annotational Things:
Annotational things are the explanatory parts of UML models. These are the
comments use to describe, illuminate about any element in a mode.
Note A note is a notational thing which is simply a symbol for rendering constraints, and
comments attached to the element or a collection of elements. Graphically a note is rendered
as a rectangle with a dog eared corner, together with textual or graphical comments.
return copy of self
Relationships
There are four kinds of relationships in the UML.
Dependency
Association
Generalization
Realization
Association

53
Association is a structural relationship that specifies that objects of one class or thing
are connected to objects to the other thing or class association is a structural relationship
between two classes and is modelled by a line connecting the two classes. There are four
adornments that apply to Association relationship. They are
o Name
o Role
o Direction of Name
o Multiplicity
Name
An Association can have a name and use that name to describe the nature of
the relationship. We can also give the direction to the name by providing a direction
triangle those points in the direction we intend to read the name.
Role
When a class participates in an association, it has a specific role that it plays in that
relationship. A role is just the face the class at the end of the association presents to the class
at the other end of the association
Multiplicity
Multiplicity shows the how many objects or roles participating in an Association It
can be written as an expression that evaluates to a range of values or an explicit value as in
below.
o Zero to One 0....1
o Zero to Many 0....*
o Zero to Many 0....*
o Specific Number n
For example An Association with these adornments can be show in below fig.
Aggregation
A plain association between two classes represents a structural relationship between
peers, meaning the both classes are conceptually at the same level no more important than the

54
other. This kind of relationship is called aggregation which represents a “has-a “ relationship
meaning that an object of the whole has objects of the part. It is a special kind of association
and specified by adorning a plain association with open diamond at the whole end.
Aggregations indicate whole part-of relationship.
It is rendered as
Composition
Composition is a strong type of association relationship. This type of
relationship can be placed between the whole and part classes if we delete one class the other
class also get destroyed.
Composition relationship means the class is a member of another class. It can be rendered as
association
Generalization
Generalization is relationship between the general thing (super or parent class) and
more specific kind of that thing (Subclass or Child class). Sometimes it is called as “ is-a-
kind-of” relationship. A child inherits the properties of its parent class especially attributes
and operations. Graphically, Generalization can be rendered as a solid directed line with large
open arrowhead as shown in below

55
Case Study
Of
Library Management System
Requirement Specification
Requirement 1
Description: Add a student record.
Each student should have following attributes:
o Student ID/SSN (unique)
o Name
o Address
o Phone number
Requirement 2
Description: Update/ Delete a student record.
The record would be selected using the student ID
Updates can be made on full. Items only:
o Name
o Address
o Phone number
The record can be deleted if there are no books issued by user.
Requirement 3
Description: Add a book item
Each book shall have following attributes:
o Call Number
o ISBN
o Title
o Author name
The call number format to be adopted would be as follows
o (First 2 alphabets of title) –(first 2 alphabets of author) – sequence number of
book
The ISBN number format to be adopted would be as follows:
o (Numeric code for subject)-(sequence number)
o NNN-NNNNN
o It would be unique for each specific title/author combination
Author name shall support 30 character names

56
Title shall support 100 character names
Requirement 4
Description: Update / Delete a book item
The book item can be retrieved using the call number
The data items which can be updated are:
o ISBN
o Title
o Author name
The book can be deleted only if no user has issued it.
Requirement 5
Description: Query the book database
The product shall let Librarian query books‟ detail information by their ISBN number
or Author or Title.
The search results would produce a list of books, which match the search parameters
with following details:
o Call number
o ISBN number
o Title
o Author
The display would also provide the number of copies which is available for issue
The display shall provide a means to select one or more rows to a user-list
A detailed view of each book should provide information about check-in/check out
status, with the borrower‟s information.
The search display will be restricted to 20 results per page and there would be means
to navigate from sets of search results.
The user can perform multiple searches before finally selecting a set of books for
check in or checkout. These should be stored across searches.
Requirement 6
Description: Check-out a book
Librarians and member of the library can check out a book using its call number.
The checkout can be initiated from a previous search operation where user has
selected a set of books.
The student ID who is issuing the book would be entered.
The issue date would automatically reflect the current system date.

57
The due date would automatically be stamped as 7 days from current date.
Requirement 7
Description: Check-in a book
Librarians and member of the library can check in a book using its call number.
The check-in can be initiated from a previous search operation where user has
selected a set of books.
The return date would automatically reflect the current system date.
Any late fees would be computed as difference between due date and return date at
rate of one dollar a day.
Requirement 8
Description: Display book detail
This view would display details about a selected book from search operation.
The details to be displayed are:
o Call number
o ISBN
o Title
o Author
o Issue status (In library or checked out)
o If book is checked out it would display
o User ID & Name
o Checkout date
o Due date
Requirement 9
Description: View student detail
Librarians can select a user record for detailed view.
The detail view should show:
o User name, ID, Address & Phone number.
o The books issued by user with issue date, due date, call number, title.
o Late fees & Fines summary and total.
Performance Requirements
The check in and checkout system will respond to the user no more than 7 seconds.
The search function will respond to the user no more than 10 seconds.
Security requirements
58
All the account managing operations can be used by only librarian.
The check-in, check-out and recall system can be used by only member of the library.
The book return report and book borrowing report can be generated by only librarian.
Reliability requirements
The system shall generate error messages when the user attempts to enter invalid data.
If the system is down, it shall be recovered within 15 minutes.
The system shall be recovered without interference at user terminal if it is down.
The system shall have 99.9% reliability during library operating hours.
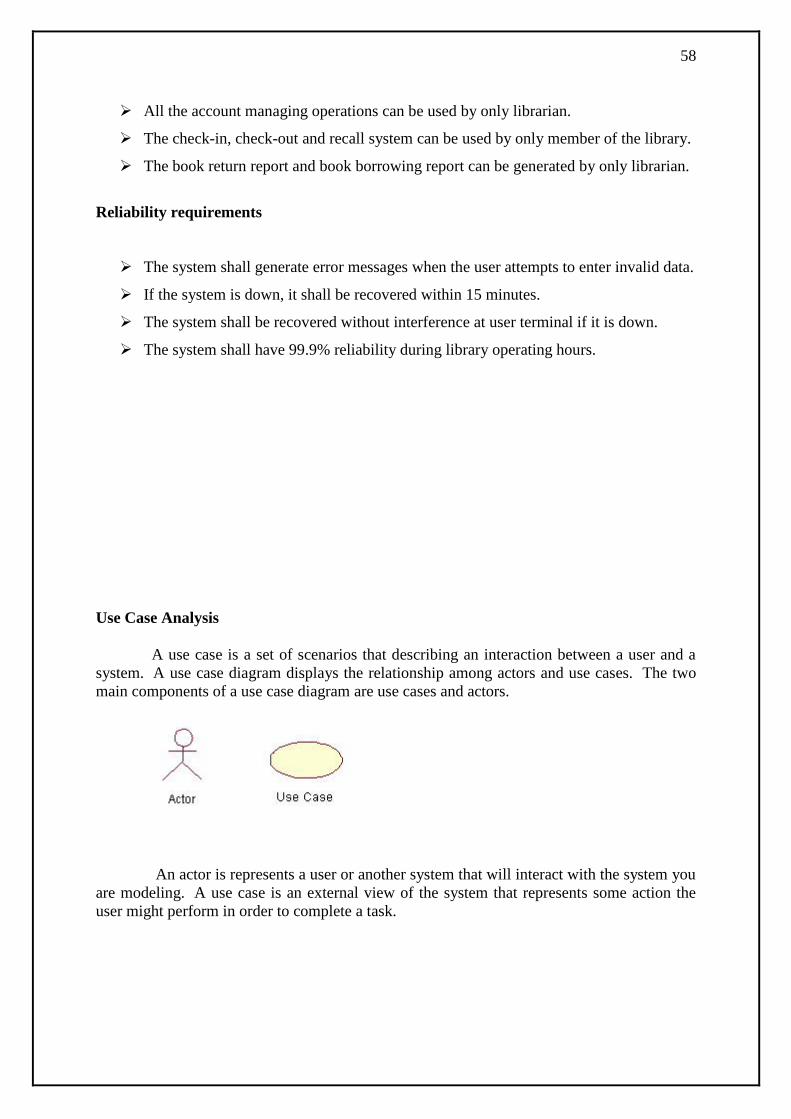
Use Case Analysis
A use case is a set of scenarios that describing an interaction between a user and a
system. A use case diagram displays the relationship among actors and use cases. The two
main components of a use case diagram are use cases and actors.
An actor is represents a user or another system that will interact with the system you
are modeling. A use case is an external view of the system that represents some action the
user might perform in order to complete a task.

59
Use Case Context diagram
Login
Add New Student
Search Book
Check in Book
Check out Book
Pay Fine
Member
Veiw Book Details
Veiw Member DB
Update Books DB
Librarian
Updating Member List
StudentFaculty
Fig : Use case diagram of LMS (Library management system)
The above diagram reveals the high-level functionality of the system.
Here in this system, the primary user of the system is librarian who is responsible for user
creation, book item creation, check-in, checkout and all search operations. The student refers
to an end-user of the system who is a member of the library and a student at the university.
Use case’s description is as shown below
Name: Add/Edit/Delete Student record.
Description: Only librarians are responsible for adding/editing/deleting student record.
Actors: Librarian
Trigger: According to the need of librarian.
Result: The details of the student get updated.
Essential process: Identify user by login process.
Carry out manipulation task according to requirement.
Check student details are updated or not.
Name: Add/Edit/Delete Book item.
Description: Only librarians are responsible for adding/editing/deleting student record.
Actors: Librarian
Trigger: According to the requirement of librarian.
Result: The details of the book get updated.
Essential process: Identify user by login process.
Carry out manipulation task according to requirement.
Check book details are updated or not.

60
Name: Search for book.
Description: Librarians and Student are responsible for search book.
Actors: Librarian, Student
Trigger: Librarian or student searches book according to their need.
Result: Book details should be displayed.
Essential process: Identify Librarian or Student by login process.
Search for required book.
Check availability of book.
Display required book details.
Name: Check-Out Book.
Description: Librarians and Student are responsible for check-out book.
Actors: Librarian, Student
Trigger: Student or librarian requests for check-out book with the help of book call number
and their id.
Result: Check-out confirmed.
Essential process: Identify Librarian or Student by login process.
Check whether check-out is completed or not.
Name: Check-In Book.
Description: Librarians and Student are responsible for check-in book.
Actors: Librarian, Student
Trigger: Student or librarian requests for check-in book with the help of book call number
and their id.
Result: Check-in confirmed.
Essential process: Identify Librarian or Student by login process.
Check whether check-in is completed or not.
Overdue alert
Name: Display book-detail.
Description: When the librarian or student searches book for borrow at that time the system
shows the details of the book.
Actors: Librarian, Student
Trigger: Student or librarian searches book for borrowing.
Result: Specific book-details should be displayed in terms of call number, title, author etc...
Essential process: Identify Librarian or Student by login process.
Search a specific book.
Display book-detail.
Name: View student detail.
Description: Librarian can select a student record for detail view.
Actors: Librarian
Trigger: When the librarian wants to check student record.
Result: Specific student details displayed in terms of student id, phone number, books issued
by that student with the issue date & due date, late fees etc…
Essential process: Identify Librarian or Student by login process.
Search a specific student.
View student detail.

61
Class diagram
Class diagrams are widely used to describe the types of objects in a system and
their relationships. Class diagrams model class structure and contents using design elements
such as classes, packages and objects. Class diagrams describe three different perspectives
when designing a system, conceptual, specification, and implementation. These perspectives
become evident as the diagram is created and help solidify the design.
This Class diagram represents all classes in this Library Management System
with their relationships between them.
Fig: Class Diagram for Library Management System

62
Activity diagram
Activity diagrams describe the workflow behavior of a system. Activity diagrams are
similar to state diagrams because activities are the state of doing something. The diagrams
describe the state of activities by showing the sequence of activities performed. Activity
diagrams can show activities that are conditional or parallel.
Activity states
Activity states mark an action by object. It is represented by
Transition
When an activity states is completed processing moves to another activity state.
Transition used to mark this movement. It is represented by
Initial state
The initial state marks the entry point and the initial activity state. It is represented by
Final state
Final states mark by the bulls‟ eye. It is represented by
Synchronization bar
Activities often can be done in parallel. To spilt processing Synchronization bar is used.
It is represented by
Activity diagram for Login
Fig : Activity diagram of LMS (Library management system)
The above diagram shows activity diagram of the library management system.
In that, first user requests for sign in and system checks user type depending upon the data
entered by user and displayed the results like librarian or student.
Librarian
Student
Sign in
request

63
Activity diagram of Librarian
Fig : Activity diagram of Librarian
The above diagram shows the activity diagram of the librarian which includes
activity performed by librarian. This is the primary user of the system that‟s why he got full
functionality of the system.
1
Add/Edit/Del
ete
Student
Add/Edit/Del
ete
Book
Search
Book
View
Book/stude
nt details
Transaction
related
functions
Check-out
Book
Check-in
Book
Pay late
fees
7
3 4 6 5

64
End of the librarian’s activity
Fig : End of the librarian’s activity
The above diagram shows all individual activities of the librarian will be merging to the end
of the activity which shows by number 8.
Activity diagram of Student
Fig : Activity diagram of Student
The above diagram shows the activity diagram of the student which includes activity
performed by student. This is the end user of the system that‟s why he got less functionality
of the system compare to the librarian.
3 4 5 6 7
8
2
Search Book
Check-out Book
Check-in Book
Pay late
fees
View book details

65
End of the Activity diagram of LMS (Library management system)
Fig : End of the Activity diagram of LMS (Library management system)
The above diagram shows all end activity of the librarian and student will be
merging to the end of the activity of the system which shows by number 10.
Component diagram
The component diagram contains components and dependencies. Components represent the
physical packaging of a module of code. The dependencies between the components show
how changes made to one component may affect the other components in the system.
Dependencies in a component diagram are represented by a dashed line between two or more
components. Component diagrams can also show the interfaces used by the components to
communicate to each other.
8 9
Librarian
Borrowing
System
Fine system
Item manager

66
Fig: Component diagram of LMS (Library management system)
The above diagram shows four components of the library management system. In
that, first component (librarian) is manager for the each student. Second component (fine
system) that manages fines applied to the student who exceed the borrowing period. Third
component (item manager) that manages library items. Fourth component (borrowing
system) that manages all borrowing items.

67
RAILWAY RESERVATION AND
CANCELLATION SYSTEM
Aim
To model the UML diagrams for ATM Card Management System.
Description
This application simulates the Railway Reservation and Cancellation System. Here
passenger searches the database for train and timing details etc. Then he submits the
reservation form and reserves the ticket. Accordingly this will be updated in the database. If
there is any cancellations then check the database. And he can also cancel the reserved
tickets.
Class Diagram
Use Case Diagrams

68
Use Case Diagram for Reservation
Usecase diagram for Railway Reservation
check for availability
taking reservation form
form filling
submitting form
check for the dates
reserving tickets
inform the amount yo pay
paying money
Passengers
taking ticket
Reservation
Officer

69
Use Case Diagram For Cancellation
Usecase diagram for Cancellation
taking cancellation form
form filling
Passengers
submitting form
check for reserved or not
cancelling the ticket
return the money
updating all lists
Reservation
Officer

70
Sequence Diagrams
Sequence Diagram For Reserving Ticket
P:Passenger T:TrainList RO:Reservation
Officer
check for availability
taking form and filling
submitting
check for availability of dates
reserving ticket
inform the amount to pay
paying amount
taking ticket
updating all lists

71
Sequence Diagram For Canceling Ticket
Sequence diagram for Cancellation
P:Passenger RO:Reservation
Officer
taking form and filling
submitting
check for reserved or not
cancelling ticket
return the amount
updating all lists
72
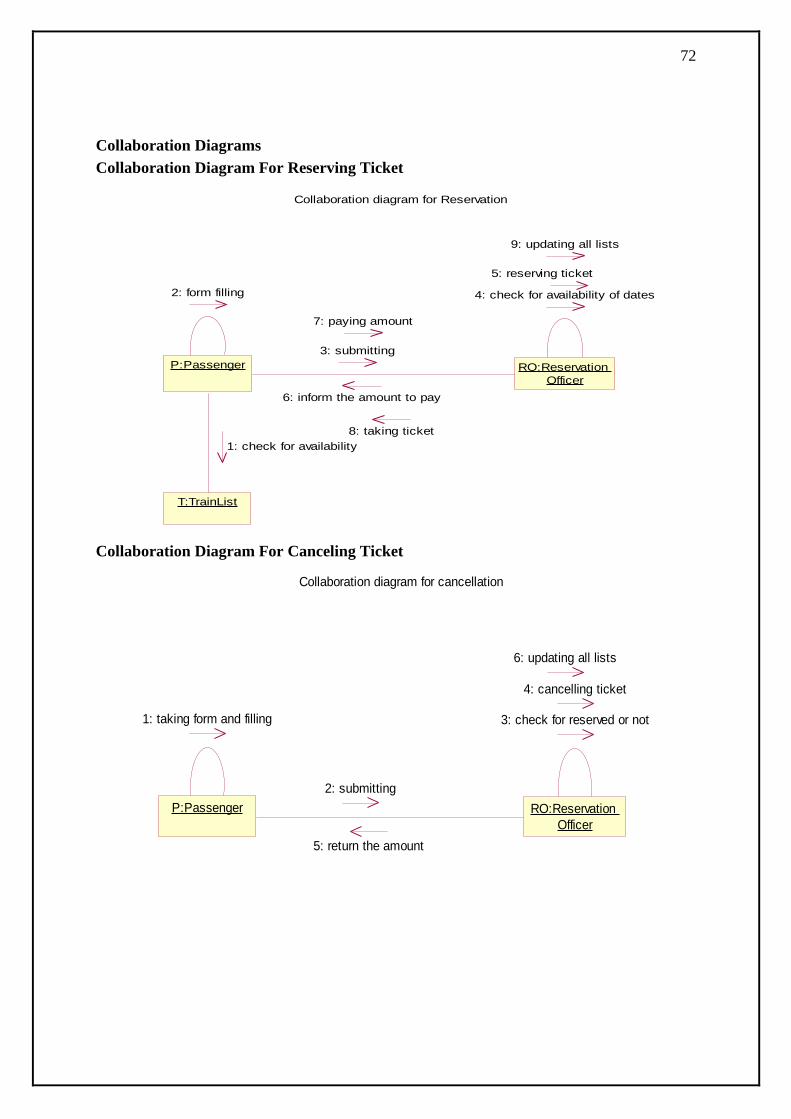
Collaboration Diagrams
Collaboration Diagram For Reserving Ticket
P:Passenger RO:Reservation
Officer
T:TrainList
2: form filling 4: check for availability of dates
5: reserving ticket
9: updating all lists
Collaboration diagram for Reservation
1: check for availability
3: submitting
6: inform the amount to pay
7: paying amount
8: taking ticket
Collaboration Diagram For Canceling Ticket
P:Passenger RO:Reservation
Officer
1: taking form and filling 3: check for reserved or not
4: cancelling ticket
6: updating all lists
Collaboration diagram for cancellation
2: submitting
5: return the amount