Embed Size (px)
Citation preview

PAPER INVITED TO 13TH INTERNATIONAL SYMPOSIUM ON WIRELESS COMMUNICATION SYSTEMS 2016, 20–23 SEPTEMBER 2016, POZNAN, POLAND 1
Mobile and ResidentialINEA Wi-Fi Hotspot Network
Bartosz Musznicki, Karol Kowalik, Piotr Kołodziejski, and Eugeniusz Grzybek
INEA, Poznan, Poland{bartosz.musznicki, karol.kowalik, piotr.kolodziejski, eugeniusz.grzybek}@inea.com.pl
Abstract—Since 2012 INEA has been developing and expand-ing the network of IEEE 802.11 compliant Wi-Fi hotspots (accesspoints) located across the Greater Poland region. This networkconsists of 330 mobile (vehicular) access points carried by publicbuses and trams and over 20,000 fixed residential hotspotsdistributed throughout the homes of INEA customers to provideInternet access via the “community Wi-Fi” service. Therefore,this paper is aimed at sharing the insights gathered by INEAthroughout 4 years of experience in providing hotspot-basedInternet access. The emphasis is put on daily and hourly trendsin order to evaluate user experience, to determine key patterns,and to investigate the influences such as public transportationtrends, user location and mobility, as well as, radio frequencynoise and interference.
I. INTRODUCTION
There are currently about 47 million public Wi-Fihotspots [1] around the globe. This form of Internet access isoften provided by cafés, shops, airports, and railway stationsto let the customers access the web, connect to the favouritesocial networking site, upload photos, read and send e-mailsetc. Such an urban Internet access is also often used bytourists who do not use international data roaming packages,as well as, by teenagers when they have smartphones equippedwith no or limited data packages provided by mobile networkoperators.
INEA is the largest regional fixed-access telecommunica-tions operator in the Greater Poland, which provides advancedmultimedia services to over 220,000 of homes, businesses, andinstitutions through different access mediums and technolo-gies, i.e., Hybrid Fibre-Coaxial (HFC), Gigabit Passive Opti-cal Network (GPON), point-to-point Carrier Ethernet opticalfibres, IEEE 802.16e WiMAX [2], IEEE 802.11 Wi-Fi [3],as well as, twisted pair based xDSL and IEEE 802.3 Ethernet.INEA is also the major shareholder of the Greater PolandBroadband Network (Polish: Wielkopolska Siec Szerokopas-mowa [WSS]) that operates over 4,500 km of optical DWDMinfrastructure with IP/MPLS architecture running on top ofit to support Next Generation Access (NGA) services in 576distribution nodes (points of presence), for the benefit of localcommunities, businesses, and administration.
Alongside the well-established services, INEA subscribersare offered free Wi-Fi hotspot access provided by over 20,000fixed residential hotspots (with over 5,000 new hotspotsplanned in the in the upcoming months) and 330 mobilehotspots carried by public buses and trams [4]. There arehundreds of customers using the service each day, as depicted
in Figure 1, which shows the changes in the number of usersthroughout an average day. Each data point corresponds toa mean value obtained in the period of one month (furtherdiscussed in Section II-D). As in every graph in the paper,confidence intervals (error bars) present the standard deviationof a data point. The graph for mobile network shows highestnumbers of users in the morning and in the afternoon whatcorresponds to the busiest commuting hours. Stationary net-work, though, exhibits the highest usage in the evening whatapparently relates to Internet activities performed at home.
40
60
80
100
0 5 10 15 20Hour
Use
rs
Network type:Mobile Hotspot
Residential Hotspot
Figure 1. Number of INEA hotspot users throughout an average day
The rest of the paper is organized as follows. First, wegive an overview of INEA mobile hotspot network, thenwe introduce the evaluation environment to move to ex-periment methodology and different signal quality relatedmeasurements. Later on, we go through similar steps withthe residential hotspot network to present a range of userexperience related tests and observations. Finally, we sum upwith conclusions.
II. MOBILE HOTSPOTS
The INEA mobile hotspot network consists of 330 mo-bile access points (AP) mounted in public buses and trams,deployed in cooperation with municipal transportation oper-ators of Poznan and Konin, i.e. Miejskie PrzedsiebiorstwoKomunikacyjne (MPK) w Poznaniu [5] and Miejski ZakładKomunikacji (MZK) w Koninie [6], respectively. Each mobileAP device is a RouterBoard RB751U [7] enclosed withina protective enclosure and equipped with an external 2.5 dBiomni-directional antenna. Together with a cellular networkbased uplink (a 4G modem), those mobile access pointsprovide wireless Internet access to the passengers and otherusers in the close proximity of the vehicle.

PAPER INVITED TO 13TH INTERNATIONAL SYMPOSIUM ON WIRELESS COMMUNICATION SYSTEMS 2016, 20–23 SEPTEMBER 2016, POZNAN, POLAND 2
A. User perspective
To use INEA mobile hotspot, one needs to select INEAHotspot from the list of available networks, i.e. the list ofService Set Identifiers (SSID) detected by end user device.Before gaining Internet access, the user is redirected to a localcaptive portal (a landing page) with three options to access theservice, as presented in Figure 2. Upon successful authentica-tion the user is granted Internet access.
B. Architecture and operation
Figure 2 provides an architectural overview of the mobilehotspot system. A centralized Remote Authentication DialIn User Service (RADIUS) database integrated with INEA’scustomer relationship management (CRM) system is used toperform authentication and authorisation. The RADIUS serveralso allows the service provider to obtain detailed informationrequired by the data retention policy, such as, login and logouttimes, physical (MAC) addresses of the devices etc. Eachaccess point is configured with a firewall and traffic controlmechanisms responsible for policing connected devices. Allmobile INEA hotspots share the same SSID, however theydo not support network-coordinated roaming (handover), andhence, roaming has to be triggered by the user device. Shouldit take place, the user must re-authenticate but is not requestedto manually select the access method again since sessioncookies are used to regain proper credentials and access.
The interaction with the system after the customer is pre-sented with the captive portal depends on the selected option:
• free of charge access for INEA customers – the user isredirected to the site that performs authentication againstINEA customers database,
• first 15 minutes free of charge access for visitors – adedicated account is automatically created in RADIUSdatabase to allow free 15 minutes during a 24 hour period,
• paid access for external users who require more than15 minutes Internet access – the user is redirected toa payment website. After a successful payment, a ded-icated RADIUS account is created with time limitationscorresponding to the purchased package. The payment isrealized by means of integration with Przelewy24 systemthat provides wide range of payment methods for thePolish market, i.e. SMS payments, bank transfers etc [8].
Afterwards, when the authorisation phase has succeeded, thecustomer is allowed to access the Internet.
Figure 2. High-level architecture of INEA mobile hotspots authentication andauthorisation system
C. Evaluation environment
After the initial tests, in order to perform a comparativestudy, not only 330 mobile access points have been used, butalso a selected part of INEA’s stationary 5 GHz Wi-Fi network– with similar number of concurrent customers (around 150),and with 10 stationary APs (base stations). Each stationaryaccess point was a RouterBoard RB433 [9] enclosed withina protective enclosure and connected to a 16 dBi or 19 dBiexternal sector antenna.
D. Experiment methodology
Each access point in the experiment has been queriedusing Simple Network Management Protocol (SNMP) every15 minutes from 10 June 2016 till 10 July 2016. In this way,we have collected information about the noise floor perceivedby each AP receiver, the number of connected clients, and theReceived Signal Strength Indicator (RSSI) value for eachconnected client. The customers of these networks were notinformed that the study was being performed, and hence,the collection of all the parameters which could be used totrack customers (such as MAC addresses of customers Wi-Fi cards) was disabled. The 15 minutes interval was usedin order to obtain the data frequently enough to get the fullpicture of changes in the performance throughout a full day,without affecting AP operations and customer experience inthe process.
E. Results
The comparison of mobile hotspots and stationary Wi-Fiaccess points is influenced by the patterns of people movingaround the area and also by the number of active hotspots.Since most of the public buses are turned off for the night(except of night lines), while trams are still on, the number ofactive mobile hotspots drops in the night, as shown in Figure 3.
Around the noon, when there is a slightly lower demandfor public transportation, and thus, some of the buses stay inbus depots, the decrease in the number of active hotspots canbe observed. As a consequence, when analysing results in thefollowing subsections, one should keep these patterns in mind.
160
180
200
220
0 5 10 15 20Hour
Num
ber
of A
ctiv
e A
Ps
Network type:Mobile Hotspot
Figure 3. Number of active mobile INEA hotspots throughout a day

PAPER INVITED TO 13TH INTERNATIONAL SYMPOSIUM ON WIRELESS COMMUNICATION SYSTEMS 2016, 20–23 SEPTEMBER 2016, POZNAN, POLAND 3
−106
−105
−104
0 5 10 15 20Hour
Noi
se F
loor
[dB
m]
Network type:Mobile Hotspot
Stationary WiFi
Figure 4. Average noise floor observed throughout an average day
1) Noise floor: The noise floor is the measure of back-ground noise created by all the noise sources of the Ra-dio Frequency (RF) environment. This ambient noise comesfrom variety of devices (microwave ovens, Bluetooth devices,wireless peripherals, ZigBee-based sensors, etc.), damagedconnectors, radar equipment, as well as, atmospheric andthermal noise. Therefore, we investigate the noise floor valuesin order to verify if mobile hotspots exhibit similarities withstationary Wi-Fi networks.
In Figure 4 the average noise floor observed throughout anaverage day is presented, with the data points showing themean value for a given hour. The data for both networks warecollected in different geographical locations and in differentradio frequency bands (2.4 GHz for mobile hotspots and5 GHz for stationary Wi-Fi) and on various radio channelsspread over the set of available channels. This graph clearlyillustrates the correlation between the noise floor for bothmobile hotspot network and for stationary Wi-Fi network.Thus, it is valid to assume that the phenomenon is caused bysun activity or the processes taking place in the atmosphere.Obviously, the artificially caused influences exist as well,but due to averaging function performed over the whole month,they diminish on the presented diagram. Both curves exhibitsimilar characteristics, and yet, the one for stationary Wi-Fi network is around 2 dB lower than the mobile hotspotcase. The difference is caused by the fact that stationaryaccess points are operating on rooftops and are equippedwith antennas of much higher gain, i.e. 16 dBi or 19 dBi,as compared to 2.5 dBi, and thus, they are exposed to noiseapproaching from wider areas then mobile hotspots. Although,the correlation between the two curves suggests that observednoise occurs due to natural activities and is not caused bymobility or changes in human-related patterns.
Our findings show the risks of drawing conclusions thatnoise floor solely depends on the human and device activities(spontaneous and intended radio transmissions). The resultspresented in Figure 4 imply that noise characteristic may behighly related to sun or atmospheric activities, while human-related activities contribute to the average level of noise.
2) Received Signal Strength Indicator (RSSI): This sectionstudies the strength of the signal, expressed in the form RSSIfrom the client to the access point, and thus, all the reportedmeasurements were gathered from the access points. The
−72
−70
−68
−66
0 5 10 15 20Hour
RS
SI [
dBm
]
Network type:Mobile Hotspot
Stationary WiFi
Figure 5. Average RSSI observed throughout an average day
average RSSI observed throughout the day is presented inFigure 5. The client side hardware, i.e., Customer PremisesEquipment (CPE), used in the stationary Wi-Fi scenario con-sists of an outdoor wireless receiver with a directional antenna.Moreover, most of the CPEs are located within the Line-of-Sight (LoS), so there are no obstacles which could causesignificant variance in the observed RSSI values. Hence, notsurprisingly, the average RSSI curve for stationary Wi-Fi isalmost flat with a typical value around -65 dBm, which isconsidered a recommended value for the system.
The average RSSI for mobile hotspot network, on thecontrary, changes significantly throughout the day. The highvalues during the night are most probably related to the tramswhich park at tram depots and provide Wi-Fi connectivity forthe employees and the residents of the neighbouring areas.We assume that those users try to maximize signal strengthstaying nearby (in the optimum range), and thus, during thenight the RSSI exhibits highest values. Similar situation occursaround 1 PM when some of the vehicles and drivers go backto bus depots, and again high RSSI values can be observed.
Figure 6 presents RSSI percentage histogram, which showsthe percentage of samples collected for both types of networksfor given RSSI value. The diagram is not cumulative thusthe bars for mobile hotspot network cover (are presented infront of) the bars for stationary network. It demonstrates thatstationary Wi-Fi is often actively used, and thus, we were ableto collect much more samples than for the mobile hotspotnetwork. Moreover, Figure 6 confirms that the stationary Wi-
0%
1%
2%
3%
4%
5%
−100 −80 −60 −40RSSI [dBm]
Per
cent
of u
sers
Network type:Mobile Hotspot
Stationary WiFi
Figure 6. Distribution of mobile hotspots and stationary Wi-Fi RSSI

PAPER INVITED TO 13TH INTERNATIONAL SYMPOSIUM ON WIRELESS COMMUNICATION SYSTEMS 2016, 20–23 SEPTEMBER 2016, POZNAN, POLAND 4
Fi network is designed and deployed with care. Therefore,most often observed RSSI values are around -65 dBm. On theother hand the mobile hotspot network attracts various types ofusers, which sometimes try to get and stay connected despitevery low signal, as when on the fringes of the radio coveragerange. Hence, the range of RSSI values for mobile network ismuch wider and typically around 10 dB below the stationarynetwork. For this reason, the bitrates experienced by clientsare often low, what as a consequence may occasionally leadto reduced overall capacity.
III. RESIDENTIAL HOTSPOTS
INEA operates the network of over 20,000 residentialhotspots that follow the idea commonly known as “commu-nity Wi-Fi” and provide Internet access to the members ofthe community. Hence, according to INEA’s policy for theData Over Cable Service Interface Specification (DOCSIS)access network, every Cisco EPC3925 cable modem (a CPE),equipped with an integrated IEEE 802.11n 2x2 MIMO 2.4GHz Wi-Fi module [10] by default operates not only asa personal (home) Wi-Fi router, but also as a virtualizedcommunity access point. Each customer is allowed to opt outof this complimentary service, but as a result will no longer beallowed to access the distributed residential hotspot system [4].This decision has no effect on other services the customer issubscribed to in a monthly fee model and still can enjoy homeInternet access available in packages up to 250 Mbit/s.
A. User perspective
To access the Internet via community Wi-Fi,INEA customers have to connect to the SSID calledINEA_HotSpot_WiFi and login with the credentials theyuse to access INEA customer care portal. When the firstauthentication is successful, in most cases, depending onthe configuration of end user device, the credentials inputby the user are stored in the (mobile) device for furtheruse. Therefore, the next time the customer turns on theWi-Fi while being in the radio range of INEA residentialhotspot system, the customer will be automatically loggedin to the network without the need to repeat the process byhand. Moreover, Protected Extensible Authentication Protocol(PEAP) [11] based approach allows INEA to provide seamlessauthentication for customers that are moving between accesspoints. For example, let us consider a customer who uses hisor hers home Wi-Fi provided by INEA on a daily basis. Whenvisiting a friend or a relative who is also a member of INEAWi-Fi community (or lives nearby a community member),the user will be able to access the Internet through the localCPE. Therefore, regardless if the device is a smartphone, atablet, or a notebook, it can connect to the network withoutthe user being aware of the automated processes taking placein the background.
B. Architecture and operation
Each INEA community Wi-Fi access point is in fact an addi-tional service provided by a single 2.4 GHz IEEE 802.11n [12]
Figure 7. High-level architecture of residential INEA hotspot network
compliant radio module incorporated in the CPE. When boot-ing, the wireless channel the AP will operate on is automati-cally selected from those that are the least used by other Wi-Fidevices in the radio range. Service differentiation and separa-tion from the home Wi-Fi router is achieved by broadcastingan additional Basic Service Set Identifier (BSSID) with net-work name, i.e. SSID, set to INEA_HotSpot_WiFi. Thenthe logical interface associated with that BSSID is internallylinked (within the CPE) to a dedicated DOCSIS 3.0 serviceflow [13], i.e. a MAC layer transport tunnel that logicallyseparates hotspot traffic from home user’s traffic in the lastmile section between CPE and Cable Modem Termination Sys-tem (CMTS). The data traffic related to the hotspot is limitedto 2 Mbit/s (downlink) and 1 Mbit/s (uplink) according tothe applied Quality of Service (QoS) policy. Therefore, thecommon Hybrid Fibre-Coaxial access medium in the last-mile of the DOCSIS-based network can be efficiently usedto provide both high speed Internet access to the local (home)subscriber, as well as, to provide the community Wi-Fi forvisitors.
Following the guidelines of RFC 6598 [14], a DHCP serverassigns an IPv4 address which belongs to the 100.64.0.0/10prefix for every end user device connected to the residentialhotspot network and the data is further transmitted via CMTSin a Layer 2 Over Generic Routing Encapsulation (L2oGRE)tunnel to an aggregation router, as presented in Figure 7. Thenthe traffic undergoes the process of Network Address Transla-tion (NAT) performed by INEA’s Carrier-Grade NAT (CGN)system. To ensure uninterrupted and transparent services, thetunnel aggregation and CGN systems are built in a stricthigh availability architecture. Security measures applied toINEA_HotSpot_WiFi are separated from the mechanismsused by the home router Wi-Fi service. The authenticationis based on IEEE 802.1X standard [15] and uses PEAPand RADIUS together with a centralized user database.
C. Experiment environment
To tackle the assessment of user experience in the commu-nity Wi-Fi network, an approach opposite to the one appliedin Section II has been used. Therefore, an empirical studyinvolving end user devices has been performed to evaluate theactual usefulness and quality of the service. The methodologywas twofold: first to investigate the experience of a smartphoneuser who moves through the test area, secondly to evaluate theservice when a user keeps a fixed position inside an apartment.

PAPER INVITED TO 13TH INTERNATIONAL SYMPOSIUM ON WIRELESS COMMUNICATION SYSTEMS 2016, 20–23 SEPTEMBER 2016, POZNAN, POLAND 5
Figure 8. Heroes of the Second World War Subdivision (foreground) andNational Army Subdivision (background) in Poznan, Poland
As a representative region of operation, two subdivisionsof the Rataje residential area in Poznan, Poland have beenselected – Osiedle Armii Krajowej (English: National ArmySubdivision) and Osiedle Bohaterów II Wojny Swiatowej(English: Heroes of the Second World War Subdivision).Both subdivisions have been built in the 1970s from pre-fabricated concrete blocks to meet the increasing demandcaused by rapid population growth. Most of the constructionsare four-story residential blocks (90 to 135 flats each) witha few buildings reaching 10 or 16 storeys, please see Figure 8.According to the 2012 census, the population density in Ratajewas 7755,38 person per km2, and hence, the selected subdivi-sions give a valid overview of the community Wi-Fi conceptin one of the largest Polish cities. The results are presentedand analysed in the following subsections.
D. Mobile access evaluation
1) Experiment methodology: Mobile access experience hasbeen evaluated with the use of Nexus 5X smartphone (run-ning Android 6.0.1 Marshmallow) that features an IEEE802.11a/b/g/n/ac (2x2 MIMO) module, as well as, a GPS andGLONASS receiver [16]. During the test the user has beenmoving on the pavement between the buildings holding thephone in the hand in front of the user. The objective was torecord the maximum RSSI (dBm) of every BSSID spottedwhile traversing the area, together with other parameters ofinterest, i.e. SSID, AP capabilities, GPS/GLONASS basedgeographical coordinates, radio frequency, and Wi-Fi channel.Therefore, a free Android application called WiFi Tracker(version 1.2.20) developed by Ian Hawkins [17] has been usedto record the data gathered by scanning the radio environmentin one second intervals during the whole test. Then the mea-surements have been exported to a comma-separated values(CSV) file to perform desired analyses.
2) Results: In the mobile access test performed on 2 July2016 around 3 PM, the user has been moving on the pavementbetween the buildings following the path depicted in Figure 9.Green circles correspond to the geographical coordinates ofthe location where the maximum RSSI of a BSSID has
Figure 9. Path of the mobile user in residential hotspot access test
been recorded. The location discrepancies were caused by thelimited GPS/GLONASS visibility between the buildings whathas affected the accuracy (a circle on a building or in themiddle of a street). The total number of SSIDs and BSSIDs,as well as, the frequencies they were operating on have beenpresented in Table I, along with the capabilities advertised byevery access point.
In the group of 1375 unique SSIDs, 313 distinctINEA_HotSpot_WiFi access points have been spotted.In the area of interest, only 8.83% of BSSIDs have beenbroadcasted at 5 GHz, i.e. 152 out of 1874, with the remainingoperating at 2.4 GHz. Most of the BSSIDs (96.48%) advertisedthat the use of Wi-Fi Protected Access (WPA) and/or Wi-FiProtected Access II (WPA2) protocol is required to connect.Some of the BSSIDs, i.e. 306 (16.33%), supported Wi-FiProtected Setup (WPS) security measures. The three mostpopular 2.4 GHz channels were 1 (34,67%), 11 (28,05%),and 6 (23,40%), as presented in Fig. 10.
The distribution of the maximum RSSI observed for 313residential INEA_HotSpot_WiFi access points has beenpresented in Figure 11. The maximum signal from 103 APshave been received at the level no weaker than -70 dBm.This value of reference has a practical significance becauseit is officially used by Apple iOS 8 and later as a thresholdfor initiating a scan to roam to a different BSSID for the same
Table ITHE GENERAL STATISTICS OF RESIDENTIAL HOTSPOTS MOBILE ACCESS
EVALUATION
INEA_HotSpot_WiFi BSSIDs 313
all SSIDs 1375
all BSSIDs 1874
2.4 GHz BSSIDs 1722
5 GHz BSSIDs 152
WPA/WPA2 protected BSSIDs 1808
WPS capable BSSIDs 306
WEP protected BSSIDs 31
PAPER INVITED TO 13TH INTERNATIONAL SYMPOSIUM ON WIRELESS COMMUNICATION SYSTEMS 2016, 20–23 SEPTEMBER 2016, POZNAN, POLAND 6
0
200
400
600
1 2 3 4 5 6 7 8 9 10 112.4 GHz channel number
Num
ber
of B
SS
IDs
Figure 10. Distribution of 2.4 GHz Wi-Fi channels usage
SSID if its signal is at least 8 dB higher (active communica-tion) or 12 dB higher (connection in idle state) [18].
Signal level not lower than -70 dBm can be considered as avalue allowing users to enjoy the most popular service types,including voice and video calls. Therefore, because another81 APs fell into a range between -71 dBm and -75 dBm,empirical tests of a Voice over IP (VoIP) call quality havebeen performed for those conditions. The calls have beenconducted between a user of Nexus 5X and a user of afixed-line VoIP phone via INEA’s commercial VoIP exchange(proxy), with CSipSimple (version 1.02.03 r2457), a popu-lar free VoIP client for Android [19]. The ITU-T G.711Arecommendation [20] compliant codec has been used andyielded satisfactory quality with only minor glitches that didnot sacrifice the overall experience. As long as the user stayedconnected to the BSSID, the call could be continued withoutinterruptions. During the pavement walking test, most of thetime the user has been in the radio range of at least one hotspotwhich could be reached with a required RSSI level. Withoutthe use of dedicated roaming mechanisms, when the usermoved out of the radio range and the Wi-Fi connection waslost, the phone started to scan for another BSSID to connectto. Together with the process of 802.1X-based authentication,it can take up to several seconds to re-establish the voiceconnection and continue the conversation. Therefore, 59%of INEA residential hotspots (184 out of 313) can be usedoutdoors in the urban environment for VoIP calls, providedthat the user stays within the optimum radio range of a singleaccess point (usually a few meters from the nearest building).For the levels lower than -75 dBm, call quality gets worse assignal quality drops, and yet, a user can still benefit from basicweb browsing, e-mail and instant messaging (243 communityhotspots, i.e. 78% of the total count). The phone starts tokeep losing connection to the AP when the RSSI drops to-80 dBm (70 APs have been discovered with RSSI at -80 dBmor worse).
Another real-world test scenario involved a parent engagedin a web browsing session while sitting on a bench bychildren’s playground. In those conditions the quality of expe-rience is rather of best effort type because it heavily dependson the RSSI, and hence, the proximity to the nearest accesspoint. Therefore, according to the experiments, the user willoften have to find an optimal spot to seat oneself. Then the
0
20
40
60
80
−90 −80 −70 −60 −50RSSI [dBm]
Num
ber
of A
Ps
Figure 11. Maximum RSSI distribution of residentialINEA_HotSpot_WiFi access points
user can count on decent quality, what has been additionallyproven with a test performed on 21 July 2016 at 10 AM withSpeedtest.net application installed on Samsung Galaxy S3 Neo(running Android 4.4.2 KitKat) with the results of 1.94 Mbit/sdownload, 0.72 Mbit/s upload and 8 ms RTT [21]. Althoughthe test succeeded, in some outdoor conditions, a sufficientlink quality will not be possible due to long distance to thenearest AP or difficult radio propagation conditions.
E. Stationary access evaluation
1) Experiment methodology: The evaluation of stationaryaccess has been performed by measuring the RSSI and theRound Trip Time (RTT) to the IP default gateway, i.e. the ag-gregation router, as observed by the user wirelessly connectedto INEA_HotSpot_WiFi access point located in differentapartment in the same building. A laptop running Windows7 equipped with an IEEE 802.11n card has been chosen as atest platform. The sampling has been conducted in the periodof one week during the average busy-hour of the Internetaccess services in INEA in the summer, i.e. between 9:30 PMand 10:30 PM. This part of the day has been selected basedon the assumption that it will provide the most challengingRF conditions (noise, interference, medium congestion etc.)for the residential Wi-Fi usage. RSSI has been recordedevery 2 seconds with Homedale (version 1.61) [22], a freeWi-Fi scanner. The ICMP-based RTT has been measuredevery 1 second with hrPing (version 5.06) [23], a feature-richfreeware ping utility.
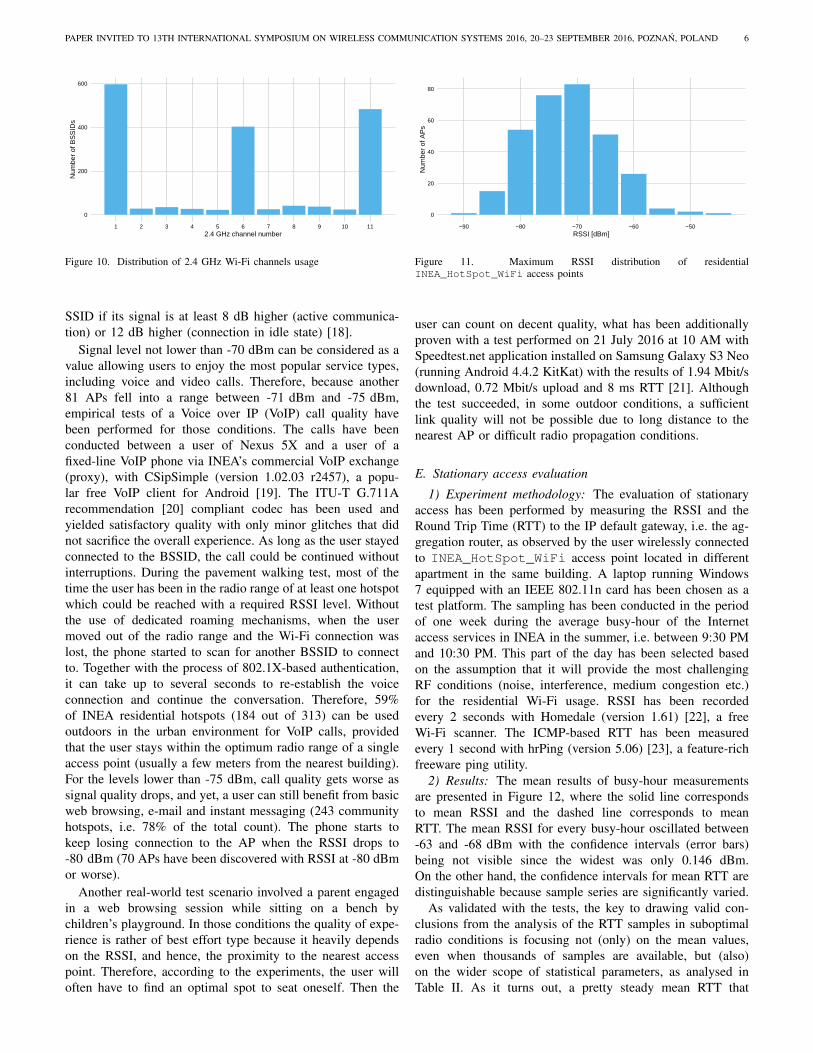
2) Results: The mean results of busy-hour measurementsare presented in Figure 12, where the solid line correspondsto mean RSSI and the dashed line corresponds to meanRTT. The mean RSSI for every busy-hour oscillated between-63 and -68 dBm with the confidence intervals (error bars)being not visible since the widest was only 0.146 dBm.On the other hand, the confidence intervals for mean RTT aredistinguishable because sample series are significantly varied.
As validated with the tests, the key to drawing valid con-clusions from the analysis of the RTT samples in suboptimalradio conditions is focusing not (only) on the mean values,even when thousands of samples are available, but (also)on the wider scope of statistical parameters, as analysed inTable II. As it turns out, a pretty steady mean RTT that
PAPER INVITED TO 13TH INTERNATIONAL SYMPOSIUM ON WIRELESS COMMUNICATION SYSTEMS 2016, 20–23 SEPTEMBER 2016, POZNAN, POLAND 7
Table IIROUND TRIP TIME (RTT) RELATED STATISTICS OF RESIDENTIAL INEA_HOTSPOT_WIFI ACCESS POINT STATIONARY TEST (IN MILISECONDS)
day 1 2 3 4 5 6 7
mean RTT 22.381 22.606 26.408 28.573 20.508 24.469 22.722
confidence interval 1.121 1.123 1.448 1.425 1.116 1.512 1.082
standard deviation 26.092 26.132 33.643 33.159 25.960 35.154 25.190
minimum 5.422 5.509 5.535 5.549 5.618 5.741 5.711
maximum 310.987 318.919 525.134 731.002 614.059 992.670 197.314
mean one way jitter 10.492 10.450 13.133 13.702 9.211 11.830 10.339
second quartile (median) 3.043 2.983 5.340 7.081 1.851 3.232 3.007
third quartile 19.127 18.215 22.916 23.075 14.875 20.445 19.233
maximum 144.459 154.386 253.140 346.468 303.031 467.485 94.988
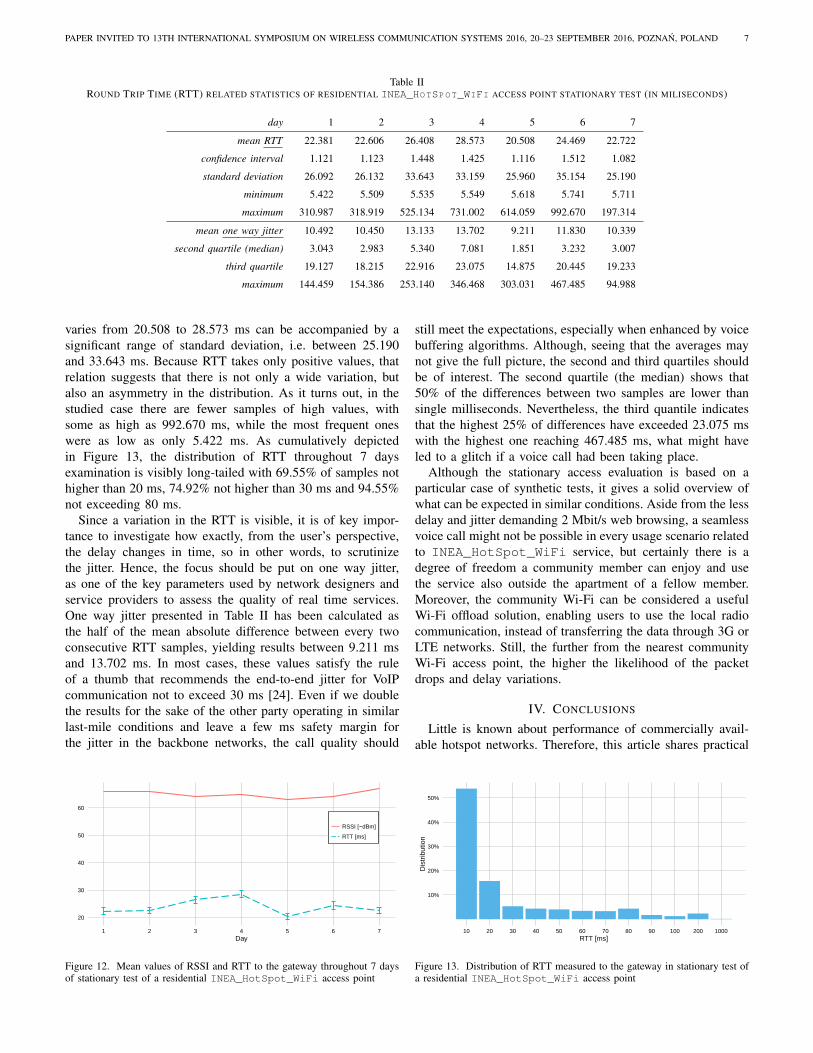
varies from 20.508 to 28.573 ms can be accompanied by asignificant range of standard deviation, i.e. between 25.190and 33.643 ms. Because RTT takes only positive values, thatrelation suggests that there is not only a wide variation, butalso an asymmetry in the distribution. As it turns out, in thestudied case there are fewer samples of high values, withsome as high as 992.670 ms, while the most frequent oneswere as low as only 5.422 ms. As cumulatively depictedin Figure 13, the distribution of RTT throughout 7 daysexamination is visibly long-tailed with 69.55% of samples nothigher than 20 ms, 74.92% not higher than 30 ms and 94.55%not exceeding 80 ms.
Since a variation in the RTT is visible, it is of key impor-tance to investigate how exactly, from the user’s perspective,the delay changes in time, so in other words, to scrutinizethe jitter. Hence, the focus should be put on one way jitter,as one of the key parameters used by network designers andservice providers to assess the quality of real time services.One way jitter presented in Table II has been calculated asthe half of the mean absolute difference between every twoconsecutive RTT samples, yielding results between 9.211 msand 13.702 ms. In most cases, these values satisfy the ruleof a thumb that recommends the end-to-end jitter for VoIPcommunication not to exceed 30 ms [24]. Even if we doublethe results for the sake of the other party operating in similarlast-mile conditions and leave a few ms safety margin forthe jitter in the backbone networks, the call quality should
20
30
40
50
60
1 2 3 4 5 6 7Day
RSSI [−dBm]
RTT [ms]
Figure 12. Mean values of RSSI and RTT to the gateway throughout 7 daysof stationary test of a residential INEA_HotSpot_WiFi access point
still meet the expectations, especially when enhanced by voicebuffering algorithms. Although, seeing that the averages maynot give the full picture, the second and third quartiles shouldbe of interest. The second quartile (the median) shows that50% of the differences between two samples are lower thansingle milliseconds. Nevertheless, the third quantile indicatesthat the highest 25% of differences have exceeded 23.075 mswith the highest one reaching 467.485 ms, what might haveled to a glitch if a voice call had been taking place.
Although the stationary access evaluation is based on aparticular case of synthetic tests, it gives a solid overview ofwhat can be expected in similar conditions. Aside from the lessdelay and jitter demanding 2 Mbit/s web browsing, a seamlessvoice call might not be possible in every usage scenario relatedto INEA_HotSpot_WiFi service, but certainly there is adegree of freedom a community member can enjoy and usethe service also outside the apartment of a fellow member.Moreover, the community Wi-Fi can be considered a usefulWi-Fi offload solution, enabling users to use the local radiocommunication, instead of transferring the data through 3G orLTE networks. Still, the further from the nearest communityWi-Fi access point, the higher the likelihood of the packetdrops and delay variations.
IV. CONCLUSIONS
Little is known about performance of commercially avail-able hotspot networks. Therefore, this article shares practical
10%
20%
30%
40%
50%
10 20 30 40 50 60 70 80 90 100 200 1000RTT [ms]
Dis
trib
utio
n
Figure 13. Distribution of RTT measured to the gateway in stationary test ofa residential INEA_HotSpot_WiFi access point
PAPER INVITED TO 13TH INTERNATIONAL SYMPOSIUM ON WIRELESS COMMUNICATION SYSTEMS 2016, 20–23 SEPTEMBER 2016, POZNAN, POLAND 8
observations of a versatile service provider and presents theanalyses performed in mobile and residential INEA Wi-Fihotspot network in comparison with INEA stationary 5 GHzWi-Fi access network. The paper reports results of experimentsperformed over the period of one month. Some trends areclearly visible, such as, the peaks in user number in therush hours (mobile hotspots) and in the afternoon (residen-tial hotspots), or the general characteristics of noise floordistribution, regardless of the type or location of an accesspoint. Moreover, a survey of 2.4 GHz channels usage hasbeen presented with the statistics of Wi-Fi security measuresdeployed in urban environment. Community Wi-Fi user expe-rience evaluation has been conducted and discussed, provingthat the service fulfils the requirements of VoIP transmissionand web browsing. The synergy achieved by the combinationof two types of hotspot network provides coverage not onlyin the city centre but also in more remote urban areas reachedby INEA cable network.
REFERENCES
[1] Wi-Fi Alliance, “Wi-Fi Alliance R© publishes 6 for ’16 Wi-Fi R© predictions.” http://www.wi-fi.org/news-events/newsroom/wi-fi-alliance-publishes-6-for-16-wi-fi-predictions, 7 January 2016.
[2] K. Kowalik, D. Dudek, M. Kołodziejski, B. Musznicki, E. Grzybek,and J. Jarzina, “Lessons Learned from WiMAX Deployment at INEA,”Journal of Telecommunications and Information Technology, pp. 34–41,September 2014. http://www.itl.waw.pl/czasopisma/JTIT/2014/3/34.pdf
[3] P. Walkowiak, R. Szalski, B. Musznicki, D. Dudek, K. Kowalik,and P. Zwierzykowski, “Evaluation of CARMNET System in INEAHOTSPOT Network,” in Proceedings of 2014 IEICE ICTF, Informationand Communication Technology Forum, (Poznan, Poland), 28–30 May2014. http://i-scover.ieice.org/proceedings/ICTF/2014/pdf/ALIEN-4.pdf
[4] “HotSpot – darmowy internet poza domem.” https://www.inea.pl/superdodatki/dla-ciebie/hotspot
[5] “MPK Poznan – About us.” http://www.mpk.poznan.pl/about-mpk/about-us
[6] “Miejski Zakład Komunikacji w Koninie.” http://www.mzk-konin.com.pl
[7] “RouterBOARD 751 series.” http://i.mt.lv/routerboard/files/rb751U-2HnD-ug.pdf, 2012. User’s Manual.
[8] “Przelewy24 – Payments, transactions, transfers, credit cards.” http://www.przelewy24.pl/eng/
[9] “RouterBOARD RB433.” http://i.mt.lv/routerboard/files/rb433-151007115417.pdf, 2015. Brochure.
[10] “Cisco Model EPC3925 8x4 EuroDOCSIS 3.0 WirelessResidential Gateway with Embedded Digital Voice Adapter.”http://www.cisco.com/c/dam/en/us/products/collateral/video/cable-modems-digital-voice-emta-edva/7018345_C.pdf, 2011. DataSheet.
[11] Protected EAP Protocol (PEAP) Version 2, 2004. IETF EAP WorkingGroup Internet-Draft.
[12] IEEE Standard for Information technology, Part 11: Wireless LANMedium Access Control (MAC) and Physical Layer (PHY) Specifica-tions, Amendment 5: Enhancements for Higher Throughput, 2010. IEEEStd 802.11nTM-2009.
[13] Data-Over-Cable Service Interface Specifications DOCSIS R© 3.0 –MAC and Upper Layer Protocols Interface Specification, 2015. CableTelevision Laboratories, Inc. CM-SP-MULPIv3.0-I29-151210.
[14] IANA-Reserved IPv4 Prefix for Shared Address Space, 2012. IETFRequest for Comments: 6598.
[15] IEEE Standard for Local and metropolitan area networks — Port-BasedNetwork Access Control, 2010. IEEE Std 802.1XTM-2010.
[16] “Nexus tech specs.” https://support.google.com/nexus/answer/6102470[17] “WiFi Tracker.” https://play.google.com/store/apps/details?id=org.prowl.
wifiscanner[18] “iPhone 6 Roaming Behavior and Optimization.” http:
//www.cisco.com/c/en/us/td/docs/wireless/controller/technotes/8-0/iPhone_roam/b_iPhone-roaming.html
[19] “CSipSimple.” https://play.google.com/store/apps/details?id=com.csipsimple
[20] Pulse Code Modulation (PCM) of Voice Frequencies, 1990. ITU-TRecommendation G.711.
[21] “Speedtest.net by Ookla.” http://www.speedtest.net/my-result/a/2078856611, 21 July 2016.
[22] “Homedale – Wi-Fi / WLAN Monitor.” http://www.the-sz.com/products/homedale/
[23] “hrPing.” https://www.cfos.de/en/ping/ping.htm[24] V. Joseph and B. Chapman, Deploying QoS for Cisco IP and Next Gen-
eration Networks: The Definitive Guide. Morgan Kaufmann PublishersInc., 2009.* All websites accessed on 20 July 2016, if not stated otherwise.