Embed Size (px)
Citation preview

Mn/DOT Flexible Pavement Design
Mechanistic-Empirical Method
Pavement Design Systems and Pavement Performance ModelsMarch 22-23, 2007 - Reykjavik, Iceland
Bruce ChadbournAssistant Pavement Design Engineer
Minnesota Department of Transportationwww.mrr.dot.state.mn.us

Acknowledgements
•
Icelandic Road Administration •
Haraldur Sigursteinsson
•
Nordic Road Association•
NordFoU Project

Pavement Design at Mn/DOT•
Current procedure–
Subgrade soil R-value, traffic, rule-of-thumb materials properties
–
Relates to ride•
MnPAVE procedure–
Modulus of all layers, base strength, repeated load damage in HMA and subgrade
–
Relates to structural distresses – cracking, rutting

Background
WESLEA•
Layered Elastic Analysis (5 Layers)
•
Developed at U.S. Army Engineer Waterways Experiment Station (Van Cauwelaert et al, 1986)

ROADENTROADENT
University of Minnesota (1996-1999)
Dr. David Timm –
Auburn University
Dr. David Newcomb –
NAPA
Dr. Bjorn Birgisson –
University of Florida


MnPAVE Pavement Design
•
Climate model•
More material types and default properties
•
Lab and field test results•
Updated performance models


ClimateClimate

MnROAD Cell 21
1
10
100
1,000
10,000
0 50 100 150 200 250 300 350Day of Year
Mod
ulus
(ksi
)
AsphaltBaseSoil
Seasons
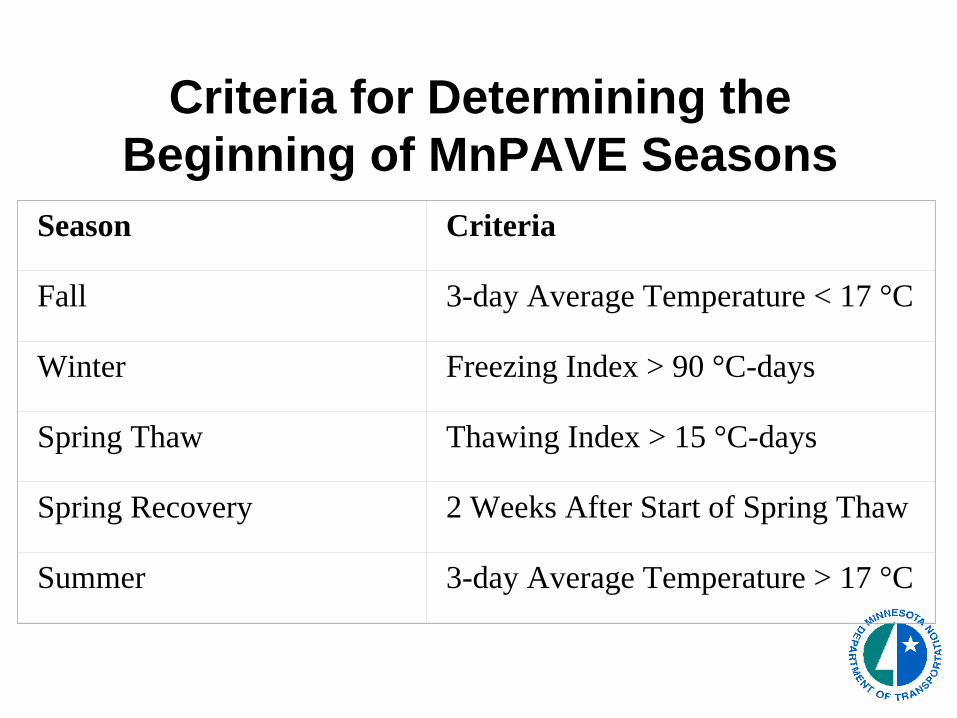
Criteria for Determining the Beginning of MnPAVE Seasons
Season Criteria
Fall 3-day Average Temperature < 17 °C
Winter Freezing Index > 90 °C-days
Spring Thaw Thawing Index > 15 °C-days
Spring Recovery 2 Weeks After Start of Spring Thaw
Summer 3-day Average Temperature > 17 °C

Temperature Model
“Whiplash” Equation

∑
∑
=
== n
i i
n
i i
i
D
DT
T
12
12
1

5 Seasons vs. 52 Weeks•
Number of times the asphalt modulus (stiffness) is calculated.
•
Affects the calculation time.•
Wide range of pavements were simulated.
•
Design thickness differed by no more than 0.1 in.
•
Default MnPAVE procedure has 5 seasons.

StructureStructure


Material Properties• New Asphalt• Existing Asphalt (overlay design)• Aggregate Base/Subbase• Soils

Witczak Equation( )
( )( )ηlog2log
4/3102
8/398/38476
54432
200220010
1312111
log
afaa
abeff
beffa
epapapapaa
VVVaVapapapaaE
+++++++
+
++++++=
Where:
E = 10-5
x Dynamic Modulus (psi)
η = 10-8
x Dynamic Viscosity (cP)
Pb = binder content (% by wt. of mix)
Va = Air voids (% by volume)
Pba = Absorption (% by wt. of aggregate)
Gb = specific gravity of binder
Gsb = Bulk specific gravity of aggregate
f = Load frequency (Hz)
Vbeff = Effective binder content (% by vol.)
p3/4
= Cumulative % retained on 3/4” sieve
p3/8
= Cumulative % retained on 3/8” sieve
p4
= Cumulative % retained on No. 4 sieve
p200
= Percent passing No. 200 sieve

Thompson (ILLI-PAVE) Equation
⎟⎟⎠
⎞⎜⎜⎝
⎛+⎟⎟⎠
⎞⎜⎜⎝
⎛−=
ACAC T
AREAD
AREAE 26.0log76.148.1log0
1010
⎟⎟⎠
⎞⎜⎜⎝
⎛+++=
0
3
0
2
0
1 2216DD
DD
DDAREA
EAC = Modulus of the HMA layer (ksi)TAC = Temperature of the HMA layer (°F)D0
= Deflection at center of load (mils)D1
= Deflection at 12 in. (305 mm) from center of loadD2
= Deflection at 24 in. (610 mm) from center of loadD3
= Deflection at 36 in. (914 mm) from center of load
Where:

Cell 20 Modulus Comparison 1994-2003Witczak and Thompson Equations
10
100
1,000
10,000
20 30 40 50 60 70 80 90 100 110 120HMA Temperature (°F)
HM
A M
odul
us (k
si)
1994 1995 19961997 1998 19992000 2001 20022003 Witczak
7.8” 120/150 Pen. (PG 58-28)

Modulus Reduction Factor–
Modulus Ratio (R )
•
R= E*(near crack)/E* (between cracks)
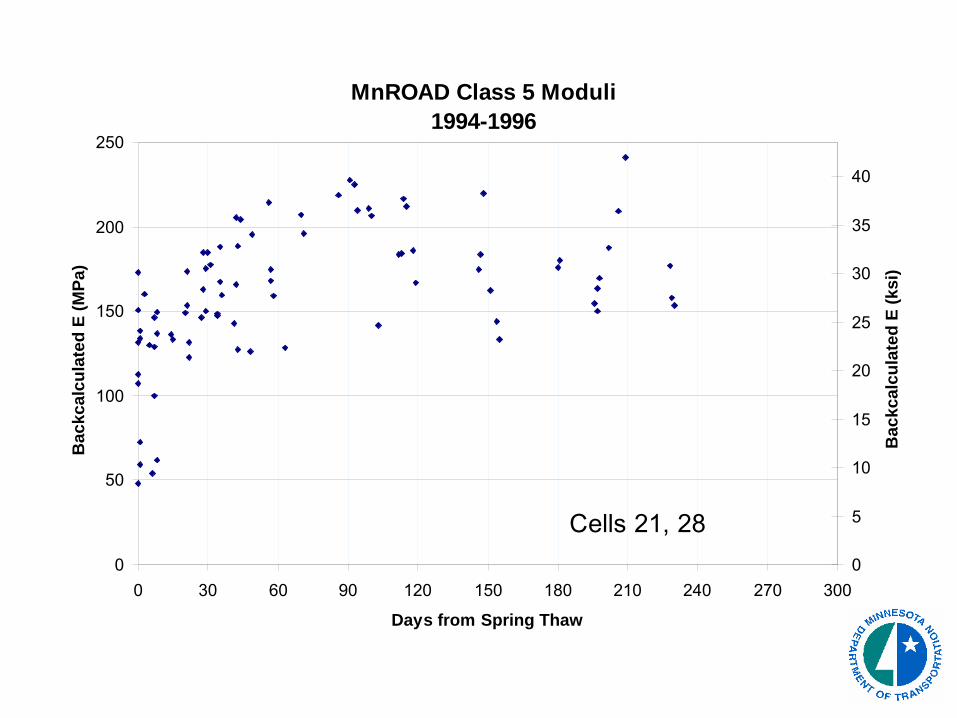
MnROAD Class 5 Moduli1994-1996
0
50
100
150
200
250
0 30 60 90 120 150 180 210 240 270 300
Days from Spring Thaw
Bac
kcal
cula
ted
E (M
Pa)
0
5
10
15
20
25
30
35
40
Bac
kcal
cula
ted
E (k
si)
Cells 21, 28
0%
10%
20%
30%
40%
50%
60%
70%
80%
90%
100%
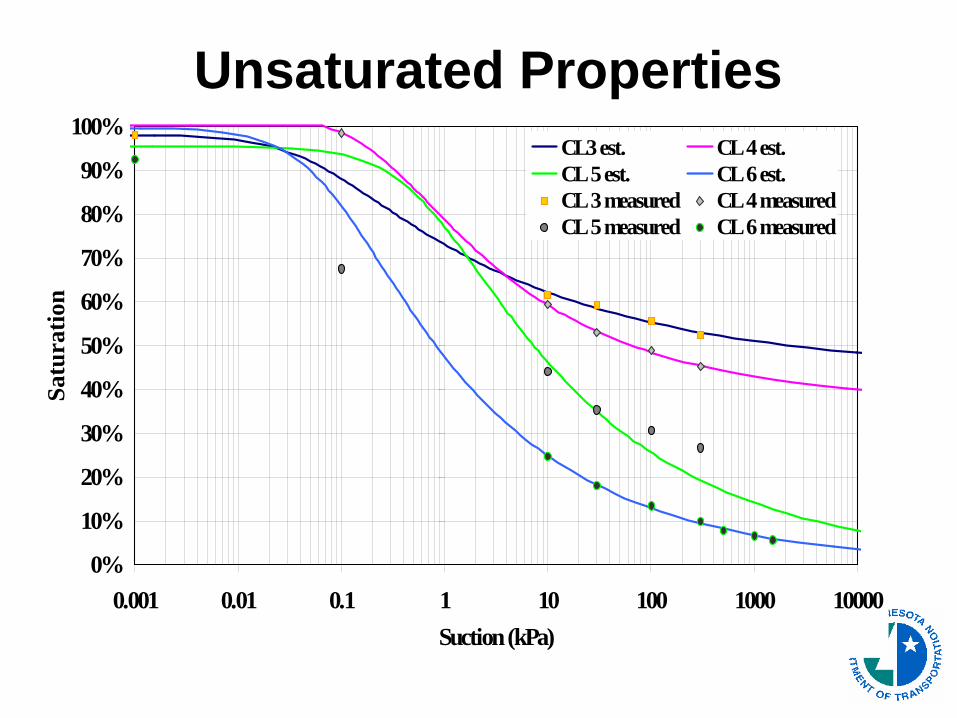
0.001 0.01 0.1 1 10 100 1000 10000Suction (kPa)
Satu
ratio
n
CL3 est. CL 4 est.CL 5 est. CL 6 est.CL 3 measured CL 4 measuredCL 5 measured CL 6 measured
Unsaturated Properties

Statewide HMA DeflectionsStatewide HMA Deflections 1994 1994 -- 20052005

Subgrade Modulus Subgrade Modulus Superimposed on Soil MapSuperimposed on Soil Map

Subgrade Modulus Predictions
0
50
100
150
200
250
SiltyClay
SiltyClayLoam
Clay ClayLoam
Silt SiltLoam
Loam SandyClayLoam
SandyClay
SandyLoam
LoamySand
Sand
E sub
grad
e, M
Pa
0
5
10
15
20
25
30
35
E sub
grad
e, ks
i
Hogg (FWD)Predicted85th %15th %MEPDG HighMEPDG LowMnPAVE 5.2 COV = 34%
μ = -7.74(CLAY2SILT2) + 0.694(e-CLAYe-SILT) + 3.86
σbest fit = 0.34 (range: 0.11 to 0.47)
2σμpredicted
2
eE +=
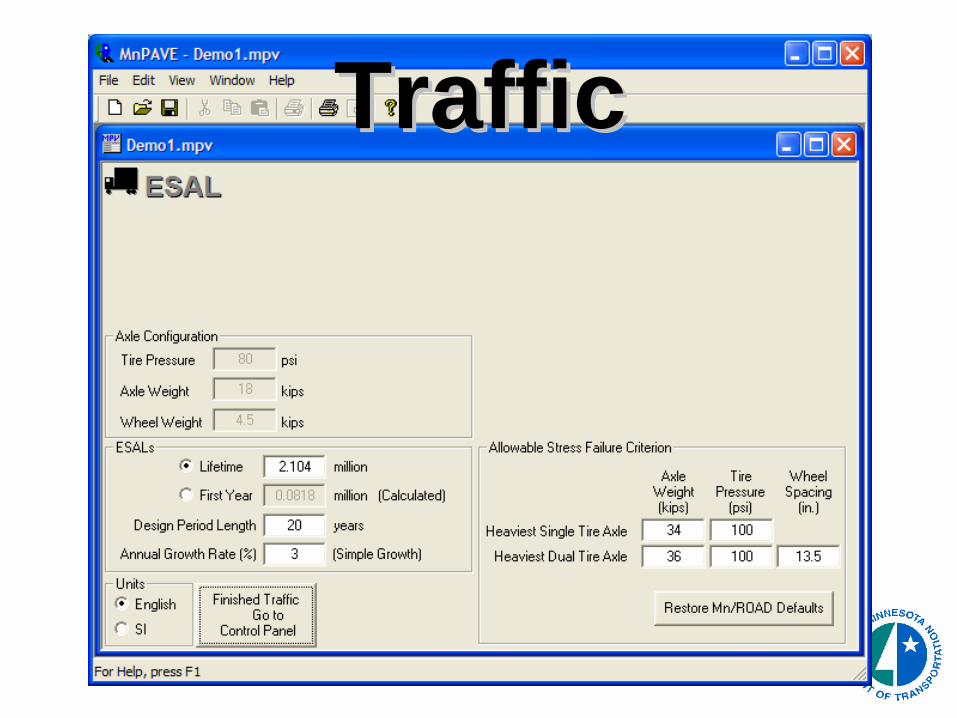
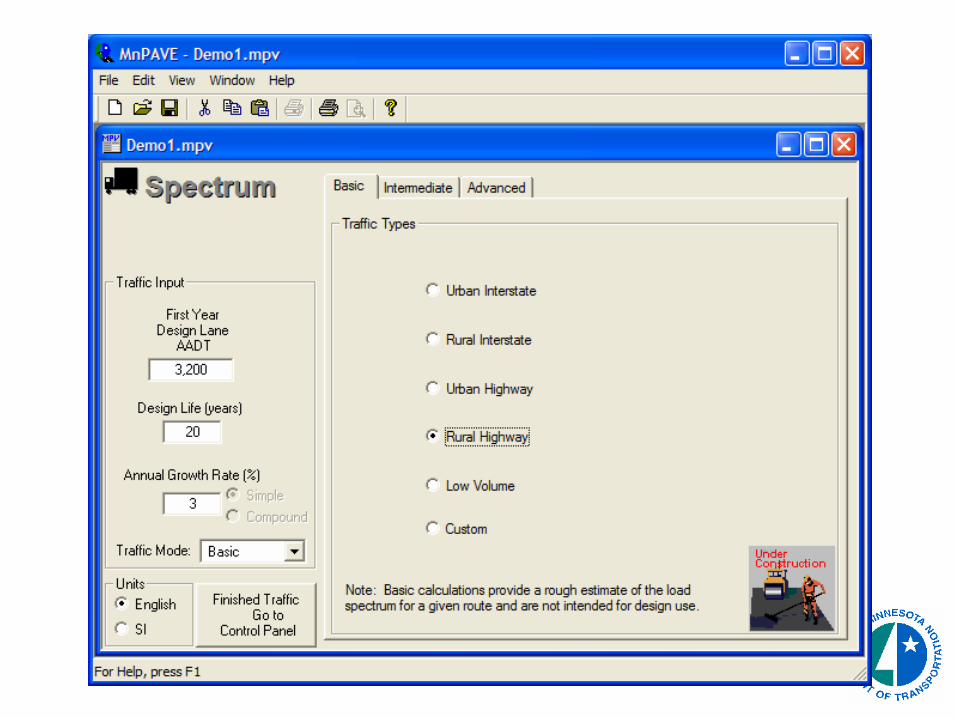
TrafficTraffic

Simplified Load Spectrum Input
•
Analysis of WIM data•
Mn/DOT and FHWA vehicle types
•
Axle distributions by truck type•
Assumptions about truck distributions
•
Route types

MnROAD 2001 WIM Data
0 10,000 20,000 30,000 40,000Axle Weight (lbs)
Rep
etiti
ons
SteerTandemSingleTridem

Vehicle Type 8
0 10,000 20,000 30,000 40,000Axle Weight (lbs)
Rep
etiti
ons
SteerSingleTandemTridem

Burnsville I-35E (Feb. 1 - Mar. 1 1992)
0 10,000 20,000 30,000 40,000 50,000
Axle Weight (lbs)
Rep
etiti
ons
SingleTandemTridemSteer
WIM
MnPAVE
10,924 AADT


OutputOutput

Questions
www.mrr.dot.state.mn.us