Embed Size (px)
Citation preview

Mn/DOT Flexible Pavement Design
Mechanistic-Empirical Method
Pavement Design Systems and Pavement Performance ModelsMarch 22-23, 2007 - Reykjavik, Iceland
Bruce TanquistAssistant Pavement Design Engineer
Minnesota Department of Transportationwww.dot.state.mn.us

Acknowledgements
• Icelandic Road Administration • Haraldur Sigursteinsson• Nordic Road Association• NordFoU Project

Pavement Design at Mn/DOT• Current procedure
– Subgrade soil R-value, traffic, rule-of-thumb materials properties
– Relates to ride• MnPAVE procedure
– Modulus of all layers, base strength, repeated load damage in HMA and subgrade
– Relates to structural distresses –cracking, rutting
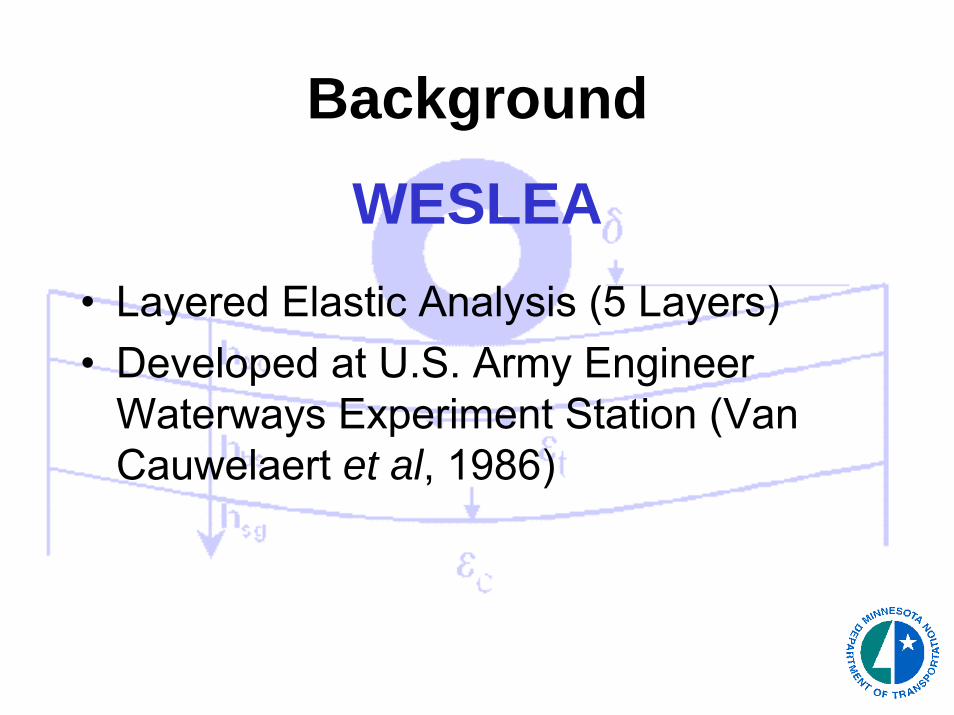
Background
WESLEA• Layered Elastic Analysis (5 Layers)• Developed at U.S. Army Engineer
Waterways Experiment Station (Van Cauwelaert et al, 1986)

ROADENTROADENT
University of Minnesota (1996-1999)
Dr. David Timm – Auburn University
Dr. David Newcomb – NAPA
Dr. Bjorn Birgisson – University of Florida


MnPAVE Pavement Design
• Climate model• More material types and default
properties• Lab and field test results• Updated performance models


ClimateClimate

MnROAD Cell 21
1
10
100
1,000
10,000
0 50 100 150 200 250 300 350Day of Year
Mod
ulus
(ksi
)
AsphaltBaseSoil
Seasons

Criteria for Determining the Beginning of MnPAVE Seasons
Season Criteria
Fall 3-day Average Temperature < 17 °C
Winter Freezing Index > 90 °C-days
Spring Thaw Thawing Index > 15 °C-days
Spring Recovery 2 Weeks After Start of Spring Thaw
Summer 3-day Average Temperature > 17 °C

Temperature Model
“Whiplash” Equation

∑
∑
=
== n
i i
n
i i
i
D
DT
T
12
12
1

5 Seasons vs. 52 Weeks• Number of times the asphalt modulus
(stiffness) is calculated.• Affects the calculation time.• Wide range of pavements were simulated.• Design thickness differed by no more than 0.1
in.• Default MnPAVE procedure has 5 seasons.
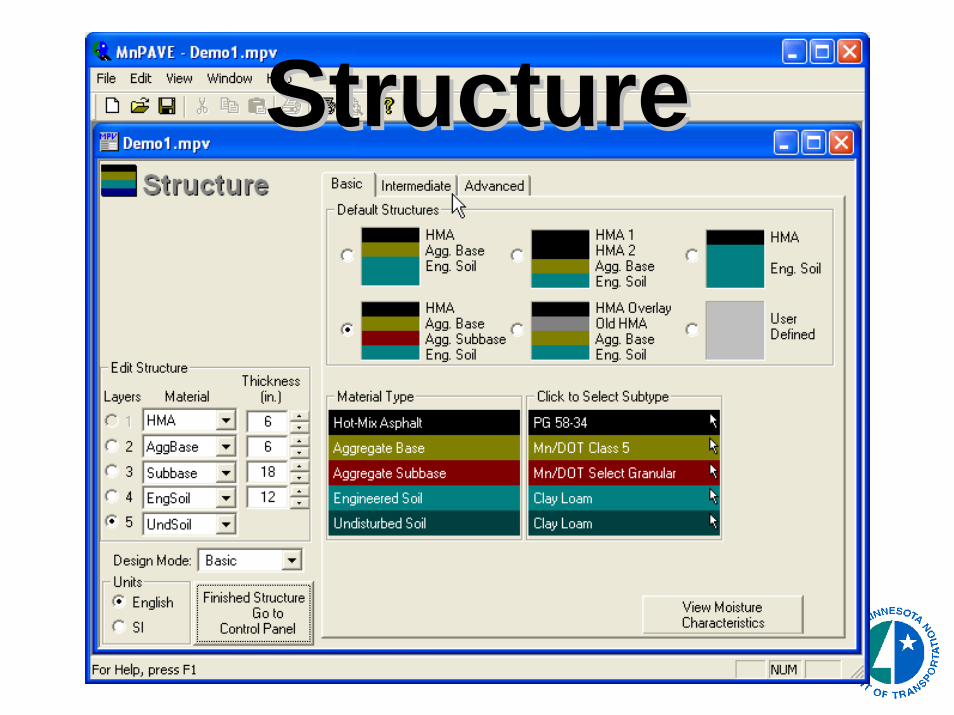
StructureStructure


Material Properties• New Asphalt• Existing Asphalt
(overlay design)• Aggregate Base/Subbase• Soils

Witczak Equation( )
( )( )ηlog2log
4/3102
8/398/38476
54432
200220010
1312111
log
afaa
abeff
beffa
epapapapaa
VVVaVapapapaaE
+++++++
+
++++++=
Where:
E = 10-5 x Dynamic Modulus (psi)
η = 10-8 x Dynamic Viscosity (cP)
Pb = binder content (% by wt. of mix)
Va = Air voids (% by volume)
Pba = Absorption (% by wt. of aggregate)
Gb = specific gravity of binder
Gsb = Bulk specific gravity of aggregate
f = Load frequency (Hz)
Vbeff = Effective binder content (% by vol.)
p3/4 = Cumulative % retained on 3/4” sieve
p3/8 = Cumulative % retained on 3/8” sieve
p4 = Cumulative % retained on No. 4 sieve
p200 = Percent passing No. 200 sieve

Thompson (ILLI-PAVE) Equation
⎟⎟⎠
⎞⎜⎜⎝
⎛+⎟⎟⎠
⎞⎜⎜⎝
⎛−=
ACAC T
AREAD
AREAE 26.0log76.148.1log0
1010
⎟⎟⎠
⎞⎜⎜⎝
⎛+++=
0
3
0
2
0
1 2216DD
DD
DDAREAWhere:
EAC = Modulus of the HMA layer (ksi)TAC = Temperature of the HMA layer (°F)D0 = Deflection at center of load (mils)D1 = Deflection at 12 in. (305 mm) from center of loadD2 = Deflection at 24 in. (610 mm) from center of loadD3 = Deflection at 36 in. (914 mm) from center of load

Cell 20 Modulus Comparison 1994-2003Witczak and Thompson Equations
10
100
1,000
10,000
20 30 40 50 60 70 80 90 100 110 120HMA Temperature (°F)
HM
A M
odul
us (k
si)
1994 1995 19961997 1998 19992000 2001 20022003 Witczak
7.8” 120/150 Pen. (PG 58-28)

Modulus Reduction Factor– Modulus Ratio (R )
• R= E*(near crack)/E* (between cracks)

MnROAD Class 5 Moduli1994-1996
0
50
100
150
200
250
0 30 60 90 120 150 180 210 240 270 300
Days from Spring Thaw
Bac
kcal
cula
ted
E (M
Pa)
0
5
10
15
20
25
30
35
40
Bac
kcal
cula
ted
E (k
si)
Cells 21, 28

0%
10%
20%
30%
40%
50%
60%
70%
80%
90%
100%
0.001 0.01 0.1 1 10 100 1000 10000Suction (kPa)
Satu
ratio
n
CL3 est. CL 4 est.CL 5 est. CL 6 est.CL 3 measured CL 4 measuredCL 5 measured CL 6 measured
Unsaturated Properties

Statewide HMA DeflectionsStatewide HMA Deflections1994 1994 -- 20052005

Subgrade Modulus Subgrade Modulus Superimposed on Soil MapSuperimposed on Soil Map

Subgrade Modulus Predictions
0
50
100
150
200
250
SiltyClay
SiltyClayLoam
Clay ClayLoam
Silt SiltLoam
Loam SandyClayLoam
SandyClay
SandyLoam
LoamySand
Sand
E sub
grad
e, M
Pa
0
5
10
15
20
25
30
35
E sub
grad
e, ks
i
Hogg (FWD)Predicted85th %15th %MEPDG HighMEPDG LowMnPAVE 5.2 COV = 34%
µ = -7.74(CLAY2SILT2) + 0.694(e-CLAYe-SILT) + 3.86
σbest fit = 0.34 (range: 0.11 to 0.47)
2σµpredicted
2
eE +=

TrafficTraffic

Simplified Load Spectrum Input
• Analysis of WIM data• Mn/DOT and FHWA vehicle types• Axle distributions by truck type• Assumptions about truck distributions• Route types

MnROAD 2001 WIM Data
0 10,000 20,000 30,000 40,000Axle Weight (lbs)
Rep
etiti
ons
SteerTandemSingleTridem
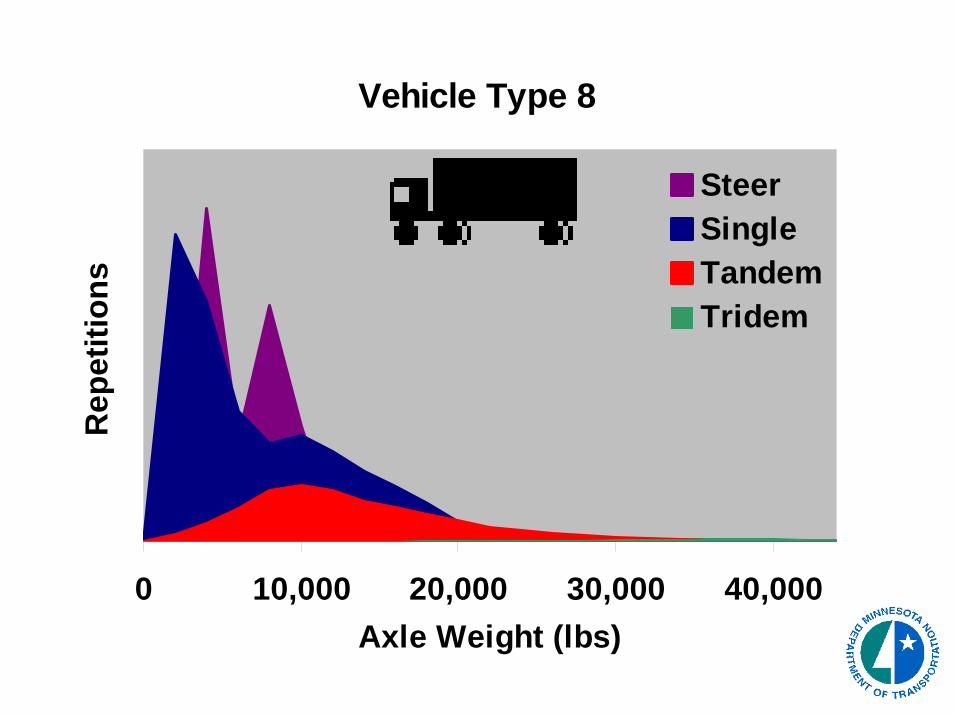
Vehicle Type 8
0 10,000 20,000 30,000 40,000Axle Weight (lbs)
Rep
etiti
ons
SteerSingleTandemTridem

Burnsville I-35E (Feb. 1 - Mar. 1 1992)
0 10,000 20,000 30,000 40,000 50,000
Axle Weight (lbs)
Rep
etiti
ons
SingleTandemTridemSteer
WIM
MnPAVE
10,924 AADT


OutputOutput

Questions
www.dot.state.mn.us