Embed Size (px)
Citation preview

MMC Corporation Berhad
November, 2018
Financial Results Ended 30 September 2018
(9M2018)
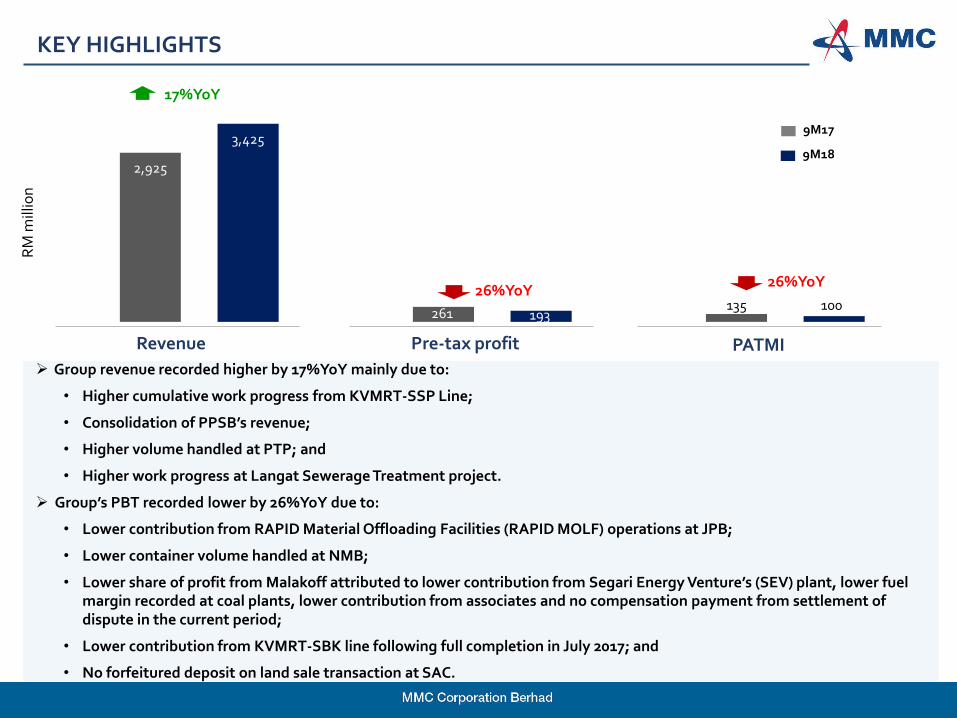
➢ Group revenue recorded higher by 17%YoY mainly due to:
• Higher cumulative work progress from KVMRT-SSP Line;
• Consolidation of PPSB’s revenue;
• Higher volume handled at PTP; and
• Higher work progress at Langat Sewerage Treatment project.
➢ Group’s PBT recorded lower by 26%YoY due to:
• Lower contribution from RAPID Material Offloading Facilities (RAPID MOLF) operations at JPB;
• Lower container volume handled at NMB;
• Lower share of profit from Malakoff attributed to lower contribution from Segari Energy Venture’s (SEV) plant, lower fuel margin recorded at coal plants, lower contribution from associates and no compensation payment from settlement of dispute in the current period;
• Lower contribution from KVMRT-SBK line following full completion in July 2017; and
• No forfeitured deposit on land sale transaction at SAC.
2,925
3,425
261 193 135 100
RM
mill
ion
2
KEY HIGHLIGHTS
Revenue Pre-tax profit PATMI
9M17
9M18
RM
mill
ion
26%YoY26%YoY
17%YoY
3
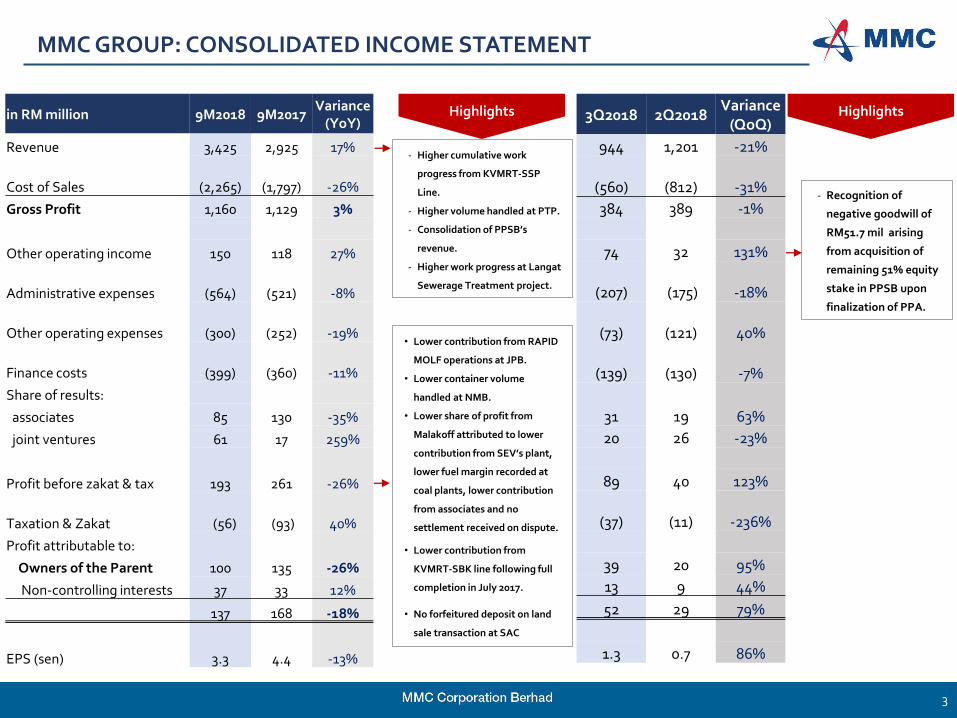
MMC GROUP: CONSOLIDATED INCOME STATEMENT
- Higher cumulative work
progress from KVMRT-SSP
Line.
- Higher volume handled at PTP.
- Consolidation of PPSB’s
revenue.
- Higher work progress at Langat
Sewerage Treatment project.
• Lower contribution from RAPID
MOLF operations at JPB.
• Lower container volume
handled at NMB.
• Lower share of profit from
Malakoff attributed to lower
contribution from SEV’s plant,
lower fuel margin recorded at
coal plants, lower contribution
from associates and no
settlement received on dispute.
• Lower contribution from
KVMRT-SBK line following full
completion in July 2017.
• No forfeitured deposit on land
sale transaction at SAC
Highlights Highlights
- Recognition of
negative goodwill of
RM51.7 mil arising
from acquisition of
remaining 51% equity
stake in PPSB upon
finalization of PPA.
in RM million 9M2018 9M2017Variance
(YoY)
Revenue 3,425 2,925 17%
Cost of Sales (2,265) (1,797) -26%
Gross Profit 1,160 1,129 3%
Other operating income 150 118 27%
Administrative expenses (564) (521) -8%
Other operating expenses (300) (252) -19%
Finance costs (399) (360) -11%
Share of results:
associates 85 130 -35%
joint ventures 61 17 259%
Profit before zakat & tax 193 261 -26%
Taxation & Zakat (56) (93) 40%
Profit attributable to:
Owners of the Parent 100 135 -26%
Non-controlling interests 37 33 12%
137 168 -18%
EPS (sen) 3.3 4.4 -13%
3Q2018 2Q2018Variance
(QoQ)
944 1,201 -21%
(560) (812) -31%
384 389 -1%
74 32 131%
(207) (175) -18%
(73) (121) 40%
(139) (130) -7%
31 19 63%
20 26 -23%
89 40 123%
(37) (11) -236%
39 20 95%
13 9 44%
52 29 79%
1.3 0.7 86%
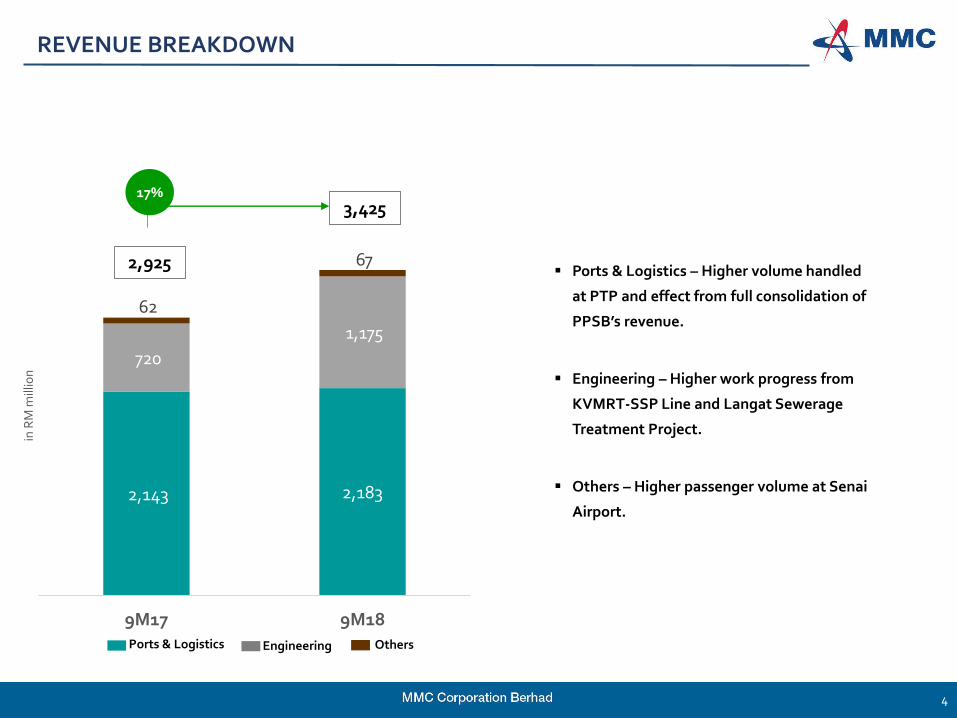
2,143 2,183
720
1,175
62
67
9M17 9M18
in R
M m
illio
n
4
REVENUE BREAKDOWN
▪ Ports & Logistics – Higher volume handled
at PTP and effect from full consolidation of
PPSB’s revenue.
▪ Engineering – Higher work progress from
KVMRT-SSP Line and Langat Sewerage
Treatment Project.
▪ Others – Higher passenger volume at Senai
Airport.
Engineering Ports & Logistics Others
2,925
3,42517%
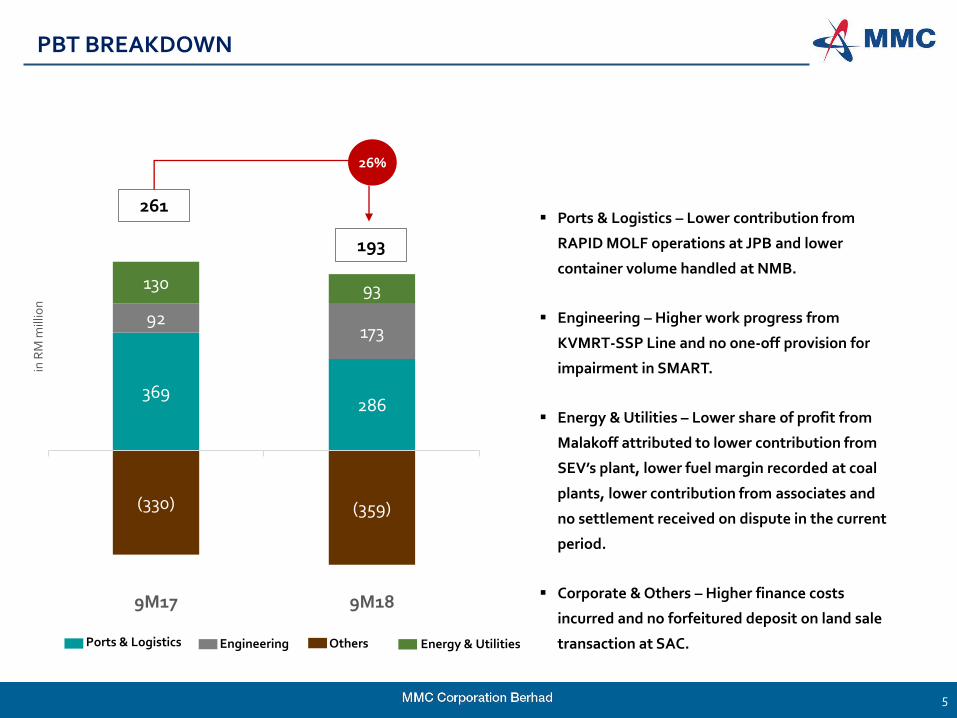
369286
92173
(330) (359)
130 93
9M17 9M18
in R
M m
illio
n
5
PBT BREAKDOWN
261
193
▪ Ports & Logistics – Lower contribution from
RAPID MOLF operations at JPB and lower
container volume handled at NMB.
▪ Engineering – Higher work progress from
KVMRT-SSP Line and no one-off provision for
impairment in SMART.
▪ Energy & Utilities – Lower share of profit from
Malakoff attributed to lower contribution from
SEV’s plant, lower fuel margin recorded at coal
plants, lower contribution from associates and
no settlement received on dispute in the current
period.
▪ Corporate & Others – Higher finance costs
incurred and no forfeitured deposit on land sale
transaction at SAC.
26%
EngineeringPorts & Logistics Others Energy & Utilities

- Lower contribution from
KVMRT-SSP Line.
Higher work progress
from KVMRT-SSP Line
and Langat Sewerage
Treatment project.
6
QUARTERLY SEGMENTAL BREAKDOWN
Highlights Highlights
- Higher work progress
from KVMRT-SSP Line.
- No one-off provision for
impairment in SMART.
- Higher volume handled
at PTP.
- Consolidation of PPSB’s
results post additional
51% acquisition in May
2018.
- Higher finance cost.
- No forfeitured deposit
on land sale transaction
at SAC.
Quarterly Segmental breakdown
9M2018 9M2017Variance
(YoY)
Revenue:
Ports & Logistics 2,183 2,143 2%
Engineering 1,175 720 63%
Corporate & Others 67 62 8%
Total revenue 3,425 2,925 17%
Profit before Tax:
Ports & Logistics 286 369 -22%
Energy & Utilities 93 130 -28%
Engineering 173 92 88%
Corporate & Others (359) (330) -9%
Total PBT 193 261 -26%
3Q2018 2Q2018Variance
(QoQ)
789 740 7%
131 439 -70%
24 22 9%
944 1,201 -21%
137 70 96%
29 26 12%
21 78 -73%
(98) (134) 27%
89 40 123%
• Lower contribution
from RAPID MOLF
operations at JPB.
• Lower container volume
handled at NMB.
- Lower work progress
from KVMRT-SSP Line.
- Recognition of negative
goodwill of RM51.7 mil
arising from acquisition
of remaining 51% equity
stake in PPSB upon
finalization of PPA.

9M17 9M18
RM
mill
ion
132155
147
25
74
22
6
-1
10
823
9M17 9M18
RM
mill
ion
912 959
562419
669
597
19810
9M17 9M18
RM
mill
iion
PORTS & LOGISTICS
7
Revenue Pre-tax profit
369
286
Operational Statistics
Port of Tanjung Pelepas
Johor Port Berhad
Northport (M) Bhd
Penang Port Sdn Bhd
Throughput (in mil. FWT) 9M18 Growth (YoY)
Liquid 3.3 0%
Dry bulk 3.4 13%
Break bulk 1.1 16%
Total Conventional 7.8 7%
Container (in mil. TEU) 1.1 1%
PTP JPB NCB RSGT PPSB TBP
Tanjung Bruas Port
Volume (‘000 FWT) 9M18 Growth (YoY)
Total Conventional 479 -27%
22%
Volume 9M18 Growth (YoY)
Container (mil. TEUs) 6.6 5%
Throughput (in mil. FWT) 9M18 Growth (YoY)
Liquid bulk 10.5 15%
Dry bulk 3.1 -9%
Break bulk 0.6 23%
Total Conventional 14.2 10%
Container (in mil. TEUs) 0.7 6%
Throughput (in mil. FWT) 9M18 Growth (YoY)
Liquid bulk 1.8 17%
Dry bulk 2.1 7%
Break bulk 1.9 4%
RORO 0.4 -2%
Total Conventional 6.3 8%
Container (in mil. TEUs) 2.1 -8%
[TBP]
[RSGT]
2,143
2,1832%
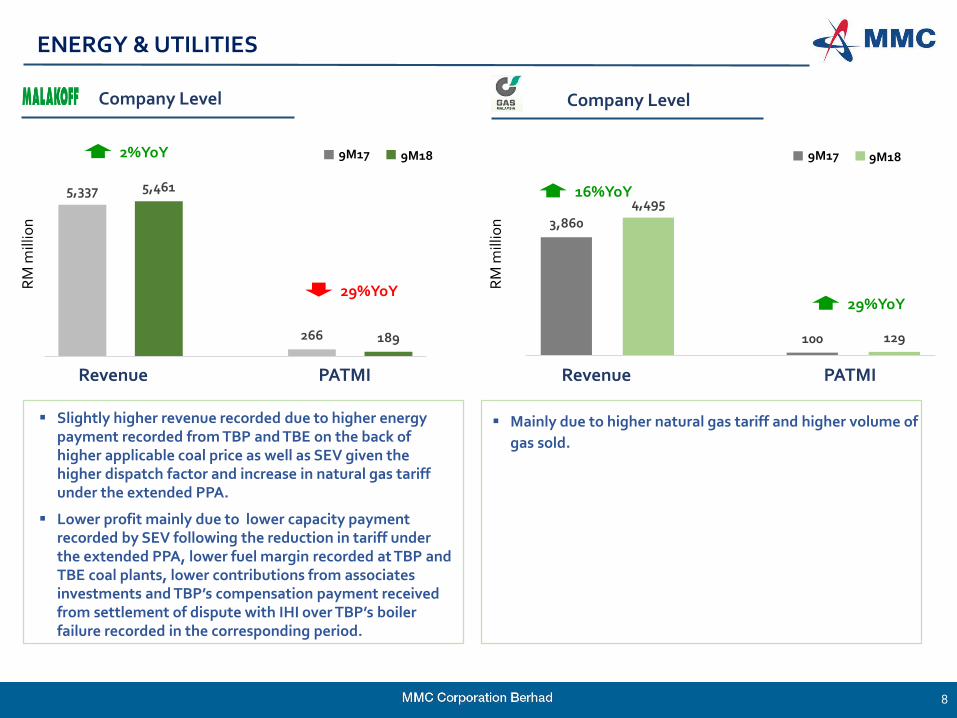
3,860
4,495
100 129
5,337 5,461
266 189
8
Company Level
ENERGY & UTILITIESR
M m
illio
n
Company Level
Revenue PATMI Revenue PATMI
9M17 9M18
16%YoY
▪ Slightly higher revenue recorded due to higher energy payment recorded from TBP and TBE on the back of higher applicable coal price as well as SEV given the higher dispatch factor and increase in natural gas tariff under the extended PPA.
▪ Lower profit mainly due to lower capacity payment recorded by SEV following the reduction in tariff under the extended PPA, lower fuel margin recorded at TBP and TBE coal plants, lower contributions from associates investments and TBP’s compensation payment received from settlement of dispute with IHI over TBP’s boiler failure recorded in the corresponding period.
▪ Mainly due to higher natural gas tariff and higher volume of
gas sold.
9M17 9M18
RM
mill
ion
29%YoY29%YoY
2%YoY
9M17 9M18
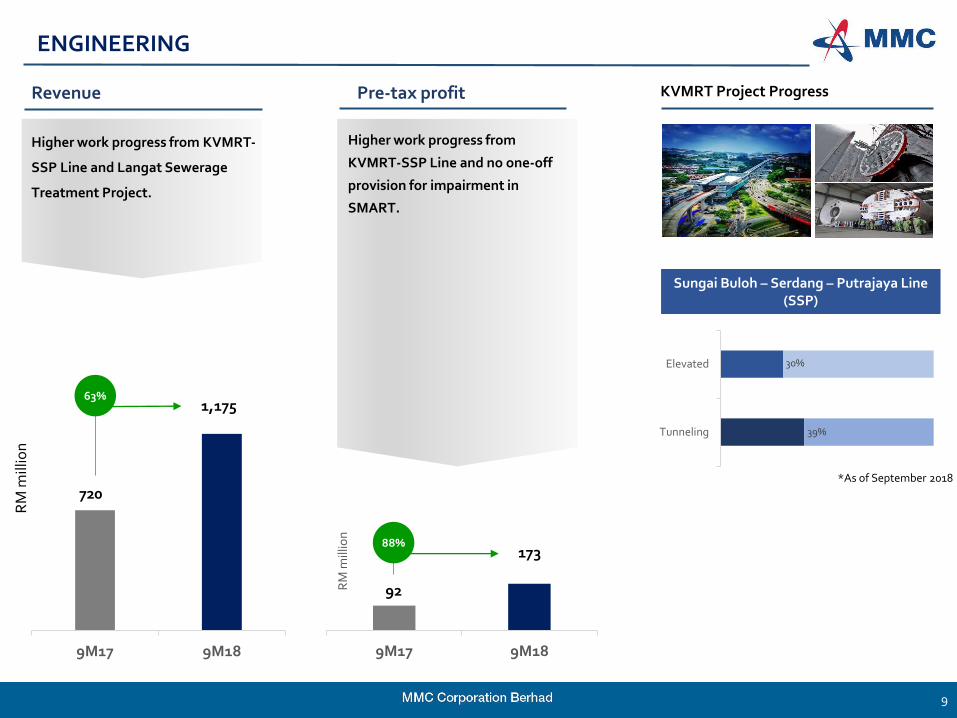
Higher work progress from
KVMRT-SSP Line and no one-off
provision for impairment in
SMART.
9
RM
mill
ion
Revenue Pre-tax profit KVMRT Project Progress
ENGINEERING
Higher work progress from KVMRT-
SSP Line and Langat Sewerage
Treatment Project.
Sungai Buloh – Serdang – Putrajaya Line (SSP)
720
1,175
92
173
63%
88%
*As of September 2018
9M17 9M18
RM
mill
ion
39%
30%
Tunneling
Elevated

1.17 1.22 1.32 1.331.8
2.07 2.23 2.352.62
0.14 0.02 0.02 0.05
0.190.25
0.360.48
0.44
2009 2010 2011 2012 2013 2014 2015 2016 2017
Mill
ion
pas
sen
ger
International Domestic
10
SENAI AIRPORT TERMINAL
Senai Airport Terminal
Operational Statistics
Passengers handled (2009 – 2017)
1.311.24
1.34 1.38
1.992.32
2.592.83
Operational Data 9M18Growth (YoY)
Passengers Traffic ('000)
Domestic 2,045 6%
International 493 33%
Total 2,538 10%
Cargo (tonnage) 6,823 30%
3.13

▪ Positive contribution from its two associates.
▪ Continuous strategic initiatives from Malakoff to secure growth opportunities in the power sector as well as to broaden its earnings base in complementary business sectors for the future.
▪ Higher gas volume sales at Gas Malaysia.
11
Note 18: Current Prospects
Ports & Logistics
▪ Improve operational performance due to operational and cost synergies as well as to achieve improvements in efficiency and productivity across the division.
▪ Completion of acquisition of the balance 51% interest in Penang Port Sdn Bhd is expected to contribute positively to the Group’s earnings.
Energy & Utilities
Engineering
▪ Substantial existing order-book anchored by KVMRT-SSP Line.
▪ Other on-going project:
a. Langat 2 Water Treatment Plant
b. Langat Centralized Sewerage Project
c. PDP role for Pan Borneo Sabah Highway

12
DISCLAIMER
This presentation is not intended to form the basis of any investment decision with respect to MMC Corporation Berhad(MMC). Neither this presentation nor anything contained herein shall form the basis of, or be relied upon in connectionwith, any contract or commitment whatsoever. This Presentation is solely based upon Information of MMC. Norepresentation or warranty, express or implied, is or will be made by MMC in relation to, and no responsibility or liability isor will be accepted by MMC as to the accuracy and completeness of, the Information made available, and any liabilitytherefore is expressly disclaimed.
This Presentation contains “forward-looking statements”. Forward-looking statements by their nature involve known andunknown risks, uncertainties and other factors that are in many cases beyond MMC’s control. Although MMC believes thatthe expectations of its management as reflected by such forward-looking statements are reasonable based on informationcurrently available to it, no assurances can be given that such expectations will prove to have been correct. Accordingly, youare cautioned not to place undue reliance on such forward-looking statements. In any event, these statements speak only asof their dates, and MMC undertakes no obligation to update or revise any of them., whether as a result of new information,future events or otherwise.
This presentation and its contents are strictly confidential and must not be copied, reproduced, distributed, summarized,disclosed referred or passed on to others at any time without the prior written consent of MMC.
Investor Relations | www.mmc.com.my

13
Thank You
Group Strategy | Investor RelationsMMC Corporation Berhad
+603 2071 1122 [email protected]