Embed Size (px)
Citation preview

Mitsubishi Research Institute, Inc
Analyses on Distribution of Malicious Packets and Threats over the Internet
August 27-31, 2007APAN Network Research Workshop
Masaki Ishiguro*1) Shigeki Goto *2)
Hironobu Suzuki*2) Ichiro Murase*1)
*1) Mitsubishi Research Institute, Inc *2) Waseda University

Mitsubishi Research Institute, Inc
OutlineOutline
1. Introduction– Goal and Motivations– Background history– System overview
2. A Threat evaluation method– Evaluation approach– Calculation method
3. Experiment Results– MS SQL Incident– Windows File share Incident
4. Conclusion and Future work

Mitsubishi Research Institute, Inc
Our Goal and MotivationsOur Goal and Motivations
• Several internet monitoring systems are deployed.• Find “newnew” threats without human resources• Threats occur anytime, System never sleeps,
running 24 hours/7 days• Find threats from huge amount of data• Access the report in anytime from anywhere
http://www.wclscan.org

Mitsubishi Research Institute, Inc
Background HistoryBackground History
• 1999 CLSCAN – “pretty print” tool for syslog of my router
• 2001, 2 WCLSCAN concept appeared – In a paper “Internet security analysis using packet filter log , SEA soft
ware symposium 2001” – Before The Internet Storm Center (2001,3)
• 2002 WCLSCAN project was started – Wide area version of clscan
• 2003 The early version of WCLSCAN– “threat calculation using Bayesian estimation” unit was added to WCL
SCAN
• 2004,4 Alert and Information providing with 4 sensor boxes • 2005,9 Official site WWW.WCLSCAN.ORG• 2007, A Threat Evaluation Methods (Today’s Topic)

Mitsubishi Research Institute, Inc
Our Internet Monitoring SystemOur Internet Monitoring System
Sensor
Sensor
Sensor
Sensor
・・
・
WCLSCANData Server
Malicious P
ackets
SQL
The Internet
Encrypted data
Log DB
Time-SeriesAccess Frequency
Graph Analysis
Threat Evaluation
Threat Levels Graphs
mn128,may,13,05:40:11,111/tcpmn128,may,13,10:12:55,111/tcpmn128,may,13,10:13:04,111/tcpmn128,may,13,12:35:05,111/tcpmn128,may,13,12:35:05,111/tcp,mn128,may,13,20:25:27,111/tcp,mn128,may,13,20:25:27,111/tcp,mn128,may,13,20:25:30,111/tcp,

Mitsubishi Research Institute, Inc
Monitored DataMonitored Data
0
50
100
150
200
250
300
350
400
450
port21(ftp)port112(auth)port111(sunrpc)port53(dns)port3128(squid)
CA- 2001- 33(ftp)2001/ 11/ 29
IN- 2001- 11(MS- DNS)2001/ 8/ 31
ftp
dns
Date/Time of Packet (Year, Month, Day,Time)
Protocol Type
( TCP, UDP, ICMP)Source IP Address
Source Port
Destination IP Address
Destination Port

Mitsubishi Research Institute, Inc
Related WorkRelated Work
Macro-Analysis(Population-based)
Micro-Analysis(Behavior-based)
Temporal FeaturesAnalysis
Spatial FeaturesAnalysis
Bayesian Estimation [1]
Wavelet AnalysisFrequency deviation score
Auto-Correlation AnalysisPort Correlations
Graph Analysis
Frequent Port and IP Extraction
Destination port sequence mining
Destination Entropy
Source Entropy2] Infection Rate Estimation by Kalman Filter[3]
Anomaly Component analysis

Mitsubishi Research Institute, Inc
Evolution of Threat Evaluation ApproachEvolution of Threat Evaluation Approach• Statistical analysis of Malicious Packet Counts
• Unique Source IP Address (Infected hosts)
• Analysis of Graph Structure– Consideration of vulnerability of destination
ports as well as increase of unique source addresses
- 4
-2
0
2
4
6
8
10
12
2006
/7/2
6
2006
/8/2
2006
/8/9
2006
/8/1
6
2006
/8/2
3
2006
/8/3
0
2006
/9/6
2006
/9/1
3
2006
/9/2
0
2006
/9/2
7
2006
/10/
4
2006
/10/
11
2006
/10/
18
2006
/10/
25
445/ tcp139/ tcp
MS06-040公開 MS06-040改訂
3σ (99%水準)
Mitsubishi Research Institute, Inc
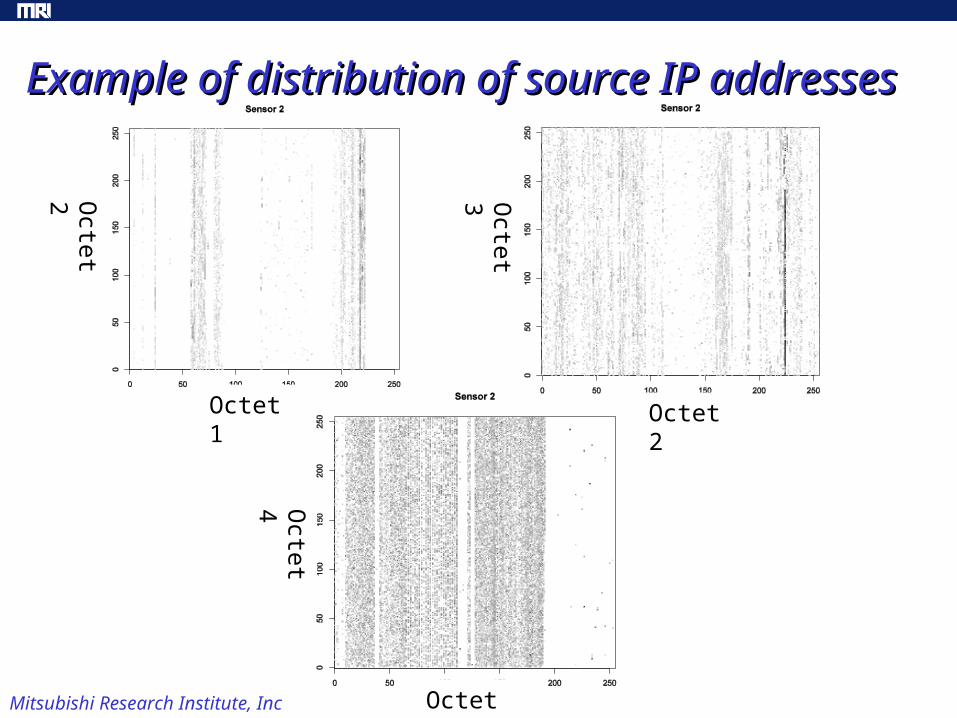
Example of distribution of source IP addressesExample of distribution of source IP addresses
Octet 1 Octet 2
Octet 3
Octet 2
Octet 3
Octet 4

Mitsubishi Research Institute, Inc
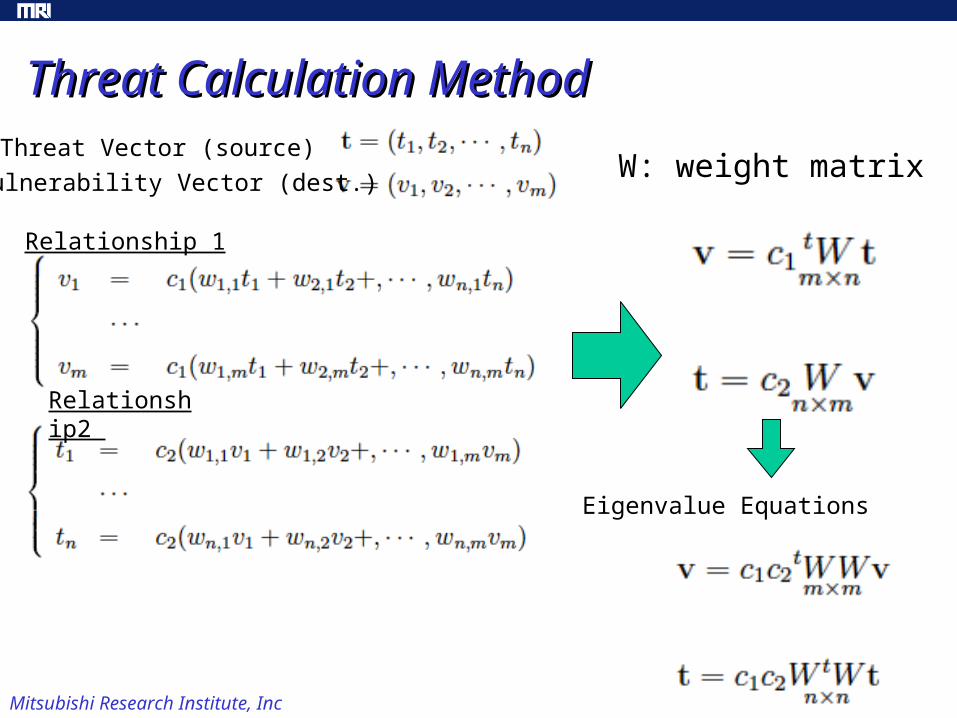
Relationship 1 Vulnerability of a destination port is higher if it receive packets from many different source addresses with higher threat level.
Relationship2Threat level of a source address is high if it sends more packets to vulnerable destination ports.
Relation between Threats and VulnerabilityRelation between Threats and Vulnerability
Source IP AddressDestination Ports ( IP’s×ports )
Sensor IP Addresses: xxx.xxx.xxx.220
Sensor IP Addresses: xxx.xxx.xxx.225
Threats Vulnerability
Mitsubishi Research Institute, Inc
Threat Calculation MethodThreat Calculation MethodThreat Vector (source)
Vulnerability Vector (dest.)
Relationship 1
Relationship2
Eigenvalue Equations
W: weight matrix

Mitsubishi Research Institute, Inc
Experiment1: Port1433 Incident (MS SQL)Experiment1: Port1433 Incident (MS SQL)
• 2005/7
Mitsubishi Research Institute, Inc
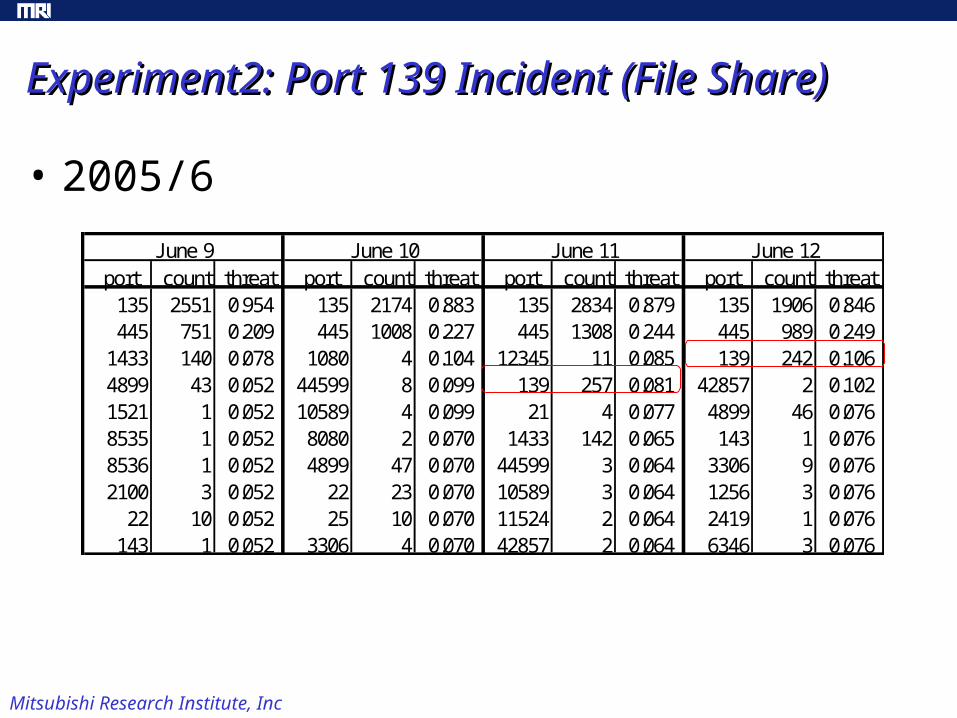
Experiment2: Port 139 Incident (File Share)Experiment2: Port 139 Incident (File Share)
• 2005/6
port count threat port count threat port count threat port count threat135 2551 0.954 135 2174 0.883 135 2834 0.879 135 1906 0.846445 751 0.209 445 1008 0.227 445 1308 0.244 445 989 0.249
1433 140 0.078 1080 4 0.104 12345 11 0.085 139 242 0.1064899 43 0.052 44599 8 0.099 139 257 0.081 42857 2 0.1021521 1 0.052 10589 4 0.099 21 4 0.077 4899 46 0.0768535 1 0.052 8080 2 0.070 1433 142 0.065 143 1 0.0768536 1 0.052 4899 47 0.070 44599 3 0.064 3306 9 0.0762100 3 0.052 22 23 0.070 10589 3 0.064 1256 3 0.076
22 10 0.052 25 10 0.070 11524 2 0.064 2419 1 0.076143 1 0.052 3306 4 0.070 42857 2 0.064 6346 3 0.076
J une 9 J une 10 J une 11 J une 12

Mitsubishi Research Institute, Inc
Conclusion and Future WorksConclusion and Future Works
1. We proposed a new threat evaluation method based on structure of access graph which are quite different from traditional methods based on the number of malicious packets.
2. We demonstrated examples that our method responds better than the number of malicious packets
Future Works:1. Optimization of edge weights of access graph2. Optimization of Unit time of our graph analysis3. Evaluation of Strength and weakness of our method
depending on the types of incidents

Mitsubishi Research Institute, Inc
WCLSCAN OFFICIAL SITE
WWW.WCLSCAN.ORG