Embed Size (px)
Citation preview
RESEARCH Open Access
Mitochondrial genomic variation associated withhigher mitochondrial copy number: the CacheCounty Study on Memory Health and AgingPerry G Ridge1,2, Taylor J Maxwell3, Spencer J Foutz1, Matthew H Bailey1, Christopher D Corcoran4,5,JoAnn T Tschanz5,6, Maria C Norton5,6,7, Ronald G Munger5,8, Elizabeth O’Brien9, Richard A Kerber9,Richard M Cawthon10, John SK Kauwe1*
From The 10th Annual Biotechnology and Bioinformatics Symposium (BIOT 2013)Provo, UT, USA. 5-6 December 2013
Abstract
Background: The mitochondria are essential organelles and are the location of cellular respiration, which isresponsible for the majority of ATP production. Each cell contains multiple mitochondria, and each mitochondrioncontains multiple copies of its own circular genome. The ratio of mitochondrial genomes to nuclear genomes isreferred to as mitochondrial copy number. Decreases in mitochondrial copy number are known to occur in manytissues as people age, and in certain diseases. The regulation of mitochondrial copy number by nuclear genes hasbeen studied extensively. While mitochondrial variation has been associated with longevity and some of thediseases known to have reduced mitochondrial copy number, the role that the mitochondrial genome itself has inregulating mitochondrial copy number remains poorly understood.
Results: We analyzed the complete mitochondrial genomes from 1007 individuals randomly selected from theCache County Study on Memory Health and Aging utilizing the inferred evolutionary history of the mitochondrialhaplotypes present in our dataset to identify sequence variation and mitochondrial haplotypes associated withchanges in mitochondrial copy number. Three variants belonging to mitochondrial haplogroups U5A1 and T2 weresignificantly associated with higher mitochondrial copy number in our dataset.
Conclusions: We identified three variants associated with higher mitochondrial copy number and suggest severalhypotheses for how these variants influence mitochondrial copy number by interacting with known regulators ofmitochondrial copy number. Our results are the first to report sequence variation in the mitochondrial genomethat causes changes in mitochondrial copy number. The identification of these variants that increase mtDNA copynumber has important implications in understanding the pathological processes that underlie these phenotypes.
BackgroundMitochondria are the location of the citric acid or KrebsCycle, which produces the majority of ATP for cellularwork. Each cell has multiple mitochondria and eachmitochondrion contains one or more copies of its owncircular genome (mtDNA), which is 16569 bases inlength and encodes 37 genes. Mitochondria are neces-sary for survival and malfunctioning mitochondria are
the cause of a variety of diseases [1-11]. Mitochondrialdiseases tend to affect the CNS or muscle tissue becauseof the high energy needs of these tissues [12]. Mito-chondrial diseases have been well studied and can bethe result of genetic variation in the mitochondrial and/or nuclear genomes. Pathogenic nuclear mutations areinherited in a typical Mendelian pattern and can presentwith a dominant, recessive, or X-linked dominant orrecessive inheritance pattern. Examples of mitochondrialdiseases caused by mutations in the nuclear genome1Department of Biology, Brigham Young University, Provo, UT, USA
Full list of author information is available at the end of the article
Ridge et al. BMC Bioinformatics 2014, 15(Suppl 7):S6http://www.biomedcentral.com/1471-2105/15/S7/S6
© 2014 Ridge et al.; licensee BioMed Central Ltd. This is an open access article distributed under the terms of the Creative CommonsAttribution License (http://creativecommons.org/licenses/by/2.0), which permits unrestricted use, distribution, and reproduction inany medium, provided the original work is properly cited.
include Friedrich’s ataxia [13], Wilson’s disease [14], andBarth syndrome [15].In contrast, mitochondrial diseases caused by variation
in the mtDNA are not as straightforward. Mitochondriaare maternally inherited, so mitochondrial disease causedby these variants will display maternal inheritance. How-ever, in most cases both normal and pathogenic mtDNAare inherited together and the mix can vary from predomi-nantly wild type to predominantly pathogenic. Dependingon the severity of the mutation, proportion of wild typeversus affected mitochondria, and the specific tissue, theremay or may not be a disease phenotype. Over the courseof life the proportion of diseased mitochondria canchange, possibly reaching a critical threshold at which thedisease phenotype is expressed. Alternatively, a constantproportion of diseased mitochondria might contribute todisease only when present in combination with one ormore additional factors (e.g. stresses of various kinds, and/or aging). In addition to inherited mtDNA variation,mtDNA is prone to somatic mutations [16], and if affectedmtDNA are propagated they can eventually reach athreshold at which mitochondrial function is insufficientto support normal cellular functions and disease appears.Some examples of disorders caused by mtDNA mutationsare Kearns-Sayre syndrome [8], diabetes mellitus and deaf-ness [7], Leber’s hereditary optic neuropathy [9], LeighSyndrome [11], and Myoclonic Epilepsy with Ragged RedFibers (a.k.a. MERRF syndrome) [10].Additionally, mitochondria have a role in aging. The
free-radical theory of aging, or mitochondrial free radicaltheory of aging, hypothesizes that aging occurs as damagefrom reactive oxygen species (ROS) accumulates. ROSare produced in the electron transport chain [17] andreadily oxidize DNA and RNA, amino acids, and fattyacids [18-20]. Damage from ROS can accumulate withtime resulting in cellular dysfunction, and death [21].MtDNA copy number, or the cellular ratio of mito-
chondrial genomes to nuclear genomes, decreases withage in some, but not all, tissues [22-25] and mtDNAcopy number variation has been associated with numer-ous phenotypes [26-38]. MtDNA copy number is tissuedependent [39] and varies with age and the energyneeds of the cell [24,25,40].Several nuclear genes regulate mtDNA copy number.
First, there is substantial evidence that mitochondrialtranscription factor A (TFAM) regulates mtDNA copynumber [41-44]. The Mec1/Rad53 (yeast) pathway hasbeen implicated in controlling mtDNA copy number,and mtDNA levels can be controlled by any of severalgenes responsible for regulating the pathway [45]. p53deficient cells or mutated p53 leads to decreased levels ofmtDNA [46]. Two common nuclear SNPs in signal trans-ducer and activator of transcription 3 (STAT3) were sig-nificantly associated with mtDNA levels in leukocytes
[47]. Both the Ras pathway and p66Shc likely have roles inregulating mtDNA copy number [48]. MnSOD preventsdecreases in mtDNA levels by preventing a decrease inmtDNA replication proteins [49]. And finally, overexpres-sion of Twinkle increases mtDNA copy number [50].The direct role for the mitochondrial genome regulat-
ing levels of mtDNA has not been studied extensively.Here we conduct a genetic association study of fullmitochondrial genome data and mtDNA copy numberin individuals from the Cache County Study on MemoryHealth and Aging. Our results identify associationbetween mitochondrial haplogroups U5A1 and T2 andincreased mtDNA copy numbers.
MethodsEthics statementAs described in [51], all study procedures were approvedby the Institutional Review Boards of Brigham Young Uni-versity, Utah State University, Duke University, and JohnsHopkins University. Written consent was obtained foreach individual. To verify a subject’s capacity to consent,subjects attempted the Modified Mini-Mental State Exam(3MS). If there was an indication of poor cognitive abilityas determined by poor performance on the entire test(scoring below a designated total of 60 points), poor per-formance on temporal or spatial orientation, or clear diffi-culty in understanding the nature of the interview, thevisit was discontinued and informed consent was obtainedfrom a responsible caregiver- often the next-of-kin.We re-consented subjects/caregivers at each study visitand procedure.
Sample acquisition and sequencingSamples for this study were selected from the CacheCounty Study on Memory Health and Aging [52]. Thisstudy was initiated in 1994 to investigate associations ofgenetic and environmental factors with cognitive function.In 1994, the 5,092 individuals enrolled in the study fromCache County, Utah, represented 90% of all CacheCounty, Utah, residents who were 65 or older. The cohortwas followed for 12 years and data (medical histories,demographics, and a multistage dementia assessment)were collected in four triennial waves. The Utah popula-tion is similar to other U.S. populations of northern Eur-opean ancestry characterized by very little inbreeding. Thefounding group of Utah’s population was unrelated andmigrated from various locations in Europe [53-55].The Utah Population database (UPDB) has complete
pedigree information going back 14 generations to the ori-ginal Utah Founders. Using this information we identifiedindividuals from the Cache County Study with the samematernal line of inheritance (matrilineage). We randomlyselected one individual from each matrilineage, selectingindividuals from the largest matrilineages first to maximize
Ridge et al. BMC Bioinformatics 2014, 15(Suppl 7):S6http://www.biomedcentral.com/1471-2105/15/S7/S6
Page 2 of 14
our ability to infer mitochondrial genomic information.Given our resources, we were able to sequence a represen-tative sample from 274 of the 3151 matrilineages that existin the Cache County Study samples. The sequenced mito-chondrial genomes represent many different major mito-chondrial haplogroups (Table 1). 287 samples were sent toFamily Tree DNA (http://www.familytreedna.com) forSanger sequencing of the mitochondrial genomes. Twosamples failed quality control at Family Tree DNA. Basedon maternal inheritance of the mtDNA we inferred thatindividuals who share matrilineal relationships have thesame mtDNA. Using this we inferred the status of fullmitochondrial genome sequence for 722 additional indivi-duals for a total of 1007 individuals, not accounting for denovo mutation. The extensive pedigree data in the UPDBallows identification of shared maternal lineages for verydistant relationships. As this was a population-based studyit is one generation in depth, but there are extended famil-ial relationships, even very distant cousins. Ridge et al [51]contains additional details about the sequencing and infer-ence of the mtDNA status in this dataset.
Measurement of mtDNA copy numberRelative quantitation of the ratio of the copy number ofthe mitochondrial genome to the copy number of thenuclear single copy gene beta-globin, as compared to thatratio in a reference DNA sample, was determined bymonochrome multiplex quantitative polymerase chainreaction (QPCR). Buccal sample cell lysates were dilutedin water (containing yeast total RNA as carrier, at 2.5 ngper microliter) to a final total cellular DNA concentrationof approximately 1 ng per 10 microliters. QPCR wascarried out in 25 microliter reactions, containing 10
microliters of the diluted buccal lysate and 15 microlitersof QPCR reagent mix with primers.The QPCR reagent mix, without primers, was exactly as
described by Cawthon [56]. The primers for mtDNAamplification were mt3257u, 5’- GCAGAGCCCGG-TAATCGCA-3’, and mt3272d, 5’-TAAGAAGAGGAATTGAACCTCTGACTGTAA-3’. The mt3272d primer haspreviously been shown to be specific to mtDNA andunable to amplify any nuclear-embedded mtDNA-likesequences (numts) from rho 0 cell line DNA [57] (Rho 0cell lines are mtDNA-free). The primers for the beta-glo-bin gene were hbgugc2, 5’-CGGCGGCGGGCGGCGCGGGCTGGGCGGCTTCATCCACGTTCACCTTG-3’,and hbgdgc2, 5’-GCCCGGCCCGCCGCGCCCGTCCCGCCGGAGGAGAAGTCTGCCGTT-3’. Both beta-globin pri-mers contained 5’ GC-clamp (non-templated) sequencesthat confer a high melting temperature on their amplicon.Each of the four primers was present at a final concentra-tion of 900 nM.The thermal profile for QPCR began with 95 degrees C
for 15 minutes to activate the hot-start polymerase andfully denature the DNA; followed by 35 cycles of: 94degrees for 15 sec, 62 degrees for 20 sec, 72 degrees for15 sec with signal acquisition (to read the mtDNA amplifi-cation signal), 84 degrees for 10 sec, and 88 degrees for15 sec (to read the beta-globin signal). In this mono-chrome multiplex QPCR (MMQPCR) strategy, firstdescribed by Cawthon [56], the higher copy number target(in this case mtDNA) has its amplification signal collectedover a cycle range in which the lower copy number target’s(in this case the beta-globin genes) amplification signal isstill at baseline, and the lower copy number target’s ampli-ficaton signal is collected in later cycles, at a temperaturethat is sufficiently high to completely melt the amplicon ofthe higher copy number target, driving its signal to base-line so that the signal from the high melting amplicon canbe cleanly read. All QPCR runs were done on Bio-RadMyiQ real-time machines, using the manufacturer’saccompanying software. The Standard Curve method forrelative quantitation was used, with 36 ng of a referenceDNA sample as the high end, and four additional standardconcentrations obtained via 3-fold serial dilutions fromthe high end. Each subject’s buccal lysate was assayed intriplicate. The average of the three measurements for eachsample was used in this study (Additional File 1). DNAis not available from other tissue for the majority of thesesamples.
Sequence and statistical analysesWe used ClustalW [58] to align the mitochondrial gen-omes and inferred a haplotype network using TCS [59]and the 285 sequenced mitochondrial genomes. In a hap-lotype network, segments of branches correspond to asingle sequence feature (single nucleotide variant, indel,
Table 1 Distribution of major mtDNA haplogroups/clusters.
Major Haplogroup Number Ethnicities[94,95]
H 424 European
U 147 European
T 121 European
J 99 European
K 95 European
V 34 European
I 21 European
W 20 European
HV 18 European
X 8 European
C 5 Asian
L 4 African
Missing1 11
Here we report the number of individuals belonging to each of the majorhaplogroups represented in our dataset along with case-control status. ThisTable first appeared in [51]. 1Missing major haplogroup
Ridge et al. BMC Bioinformatics 2014, 15(Suppl 7):S6http://www.biomedcentral.com/1471-2105/15/S7/S6
Page 3 of 14
etc.), and nodes in the network correspond to haplotypes.Branches, comprised of one or more segments, connectobserved nodes, while clades are comprised of one ormore observed nodes, and are defined by a branch.Genotype-phenotype associations were evaluated using
an evolution-based method known as TreeScanning[60,61] that makes use of haplotype networks. Haplotypenetworks provide a framework from which to select evo-lutionarily related haplotypes to pool together for com-parison. Additional details about the application ofTreeScanning to this dataset can be found in Ridge et al[51]. The null hypothesis of TreeScanning is that thephenotype does not differ in distribution across the gen-otypes derived from allelic classes defined by thebranches of the haplotype network. Each branch parti-tions the haplotypes into bi-allelic pools from whichgenotypes are constructed and treated as a separate test.Because we have multiple tests that are correlated weobtained multiple-test corrected p-values by a permuta-tion analog of the sequential step-down Bonferroni [62]with 10,000 permutations. If significant branches arefound in the first round of TreeScanning, a secondround of TreeScanning is performed that can detectphenotypic heterogeneity within the allelic classes of thesignificant branch. This is accomplished by creating athree-allele system and using conditional permutationsthat hold one of the alleles constant while subdividingthe other class into two alleles [60]. Significant branchesdefine clades.For these analyses we tested for association with mito-
chondrial copy number after adjusting for gender, age,and familial relationships. Familial adjustment scores,which quantify the variance in mtDNA copy numberthat is due to familial relationships between individualsin the dataset, were computed using the method devel-oped by Kerber (modified for a continuous trait) [63].For each individual we summed the products of themtDNA copy number and the pairwise kinship coeffi-cient (a pairwise measure of relatedness) with each ofthe other individuals in the sample. This sum is thendivided by the total number of samples in the dataset.Finally, we divide by the mtDNA copy number of theindividual, yielding a value, which represents the rela-tionship between mtDNA copy number and relatednessto other individuals in the dataset. We calculated famil-ial adjustment scores for each individual in the datasetusing the following equation:
familial adjustment score =
∑Nj=1 copy number j ∗ f (individual, j)
Nindividual copy number
Where N is the number of individuals in the cohortand f(individual, j) is the kinship coefficient between theindividual for whom we are calculating a familial
adjustment score (labeled as ‘individual’ in the formula)and individual j (representing each of the other indivi-duals in the dataset one at a time). Inclusion of thisscore as a covariate in our analyses removes variance inmtDNA copy number that is due to relatedness betweenindividuals, making it possible to test for associationindependently of pedigree relationships in the data. Thisadjustment addresses both maternal and paternal rela-tionships in the data, thus correcting for possiblenuclear genomic confounds as well. Each analysis wasperformed with 10,000 permutations. Only tests with atleast two relevant genotypic classes, each containing fiveor more individuals, were tested. Significance wasinferred if the multiple-test-corrected p-value was lessthan 0.05.
Bioinformatic analyses of variantsIn order to determine the functional impact of variants ofinterest we applied in silico functional prediction algo-rithms, analyzed pathways, examined protein sequenceconservation, and identified conserved domains. Weobtained protein sequences from NCBI using blast [64],aligned and analyzed them using the CLCViewer (http://clcbio.com/), identified conserved domains using theNCBI conserved domain database [65], identified pathwaysusing Ingenuity (http://Ingenuity.com/), and obtainedfunctional predictions from polyphen-2 [66] and SIFT[67,68] webservers. In each case we used default settings.
ResultsHaplotype network and mtDNA variationWe sequenced 285 complete mitochondrial genomesfrom individuals in the Cache County Study on MemoryHealth and Aging and imputed 722 additional full mito-chondrial genomes using maternal lineages for a fulldataset of 1007 full mitochondrial genomes. We built ournetwork using the 285 genotyped individuals (AdditionalFiles 2, 3). Our network contained 249 different haplo-types and the majority of haplotypes (152 of 249) wereobserved in three or fewer individuals with the two mostfrequently observed haplotypes observed in 39 and 32individuals, respectively. Our network contained oneunresolved loop and the ambiguity was factored into sub-sequent analyses.We identified 899 single nucleotide variants (SNVs),
26 insertions, and 20 deletions in our dataset. The mostfrequently observed SNVs occurred in 281 genomes(m.263A>G, m.8860A>G, and m.15326A>G), and threemore SNVs were observed in 280 genomes (m.750A>G,m.1438A>G, and m.4769A>G). Compared to the referencesequence (NC_012920), each person had an average of25.3 variants (52 variants were the most identified in a sin-gle individual and 2 variants the fewest, each extremeobserved in one person).
Ridge et al. BMC Bioinformatics 2014, 15(Suppl 7):S6http://www.biomedcentral.com/1471-2105/15/S7/S6
Page 4 of 14
The distribution of major mitochondrial haplogroupswithin our dataset is reported in Table 1 (major mitochon-drial haplogroups/clusters) and Additional File 4 (majormitochondrial haplogroups and sub-haplogroups). Ourdataset contained individuals from 102 major mitochon-drial haplogroups/clusters (or sub-haplogroups) in ourdataset. As expected, the majority (987 of 1007) of indivi-duals in our dataset belonged to European-based majormitochondrial haplogroups. We identified three differentbranches, corresponding to two different clades, signifi-cantly associated with mtDNA copy number.
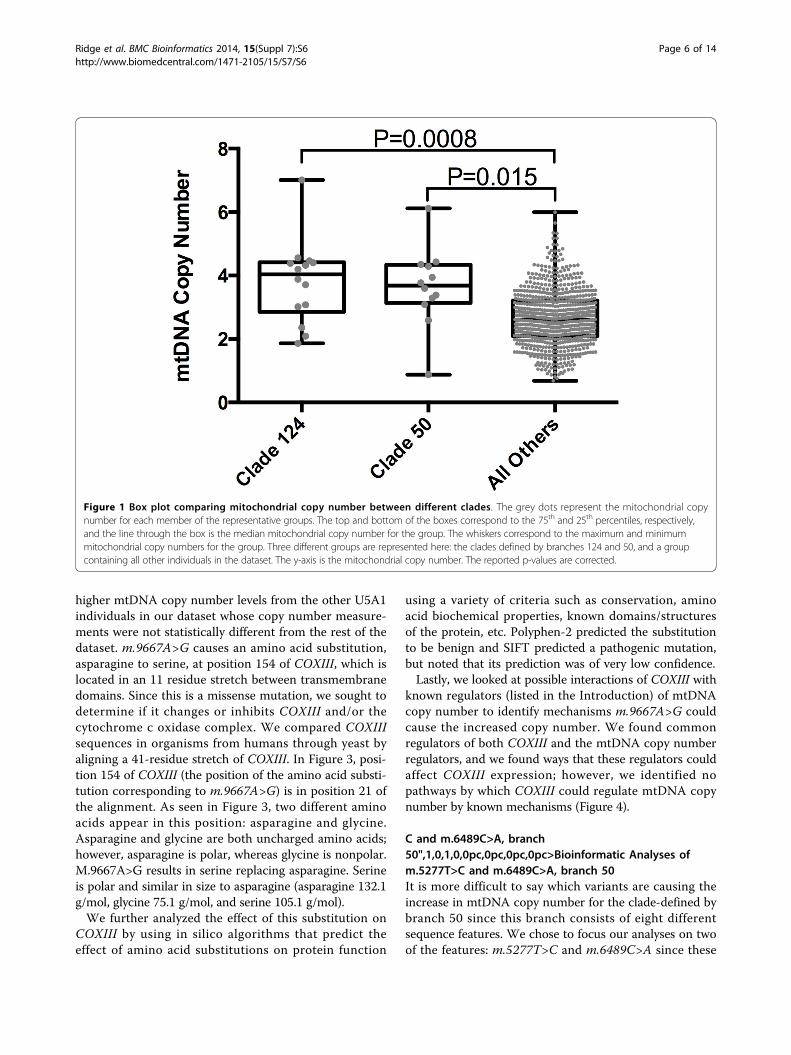
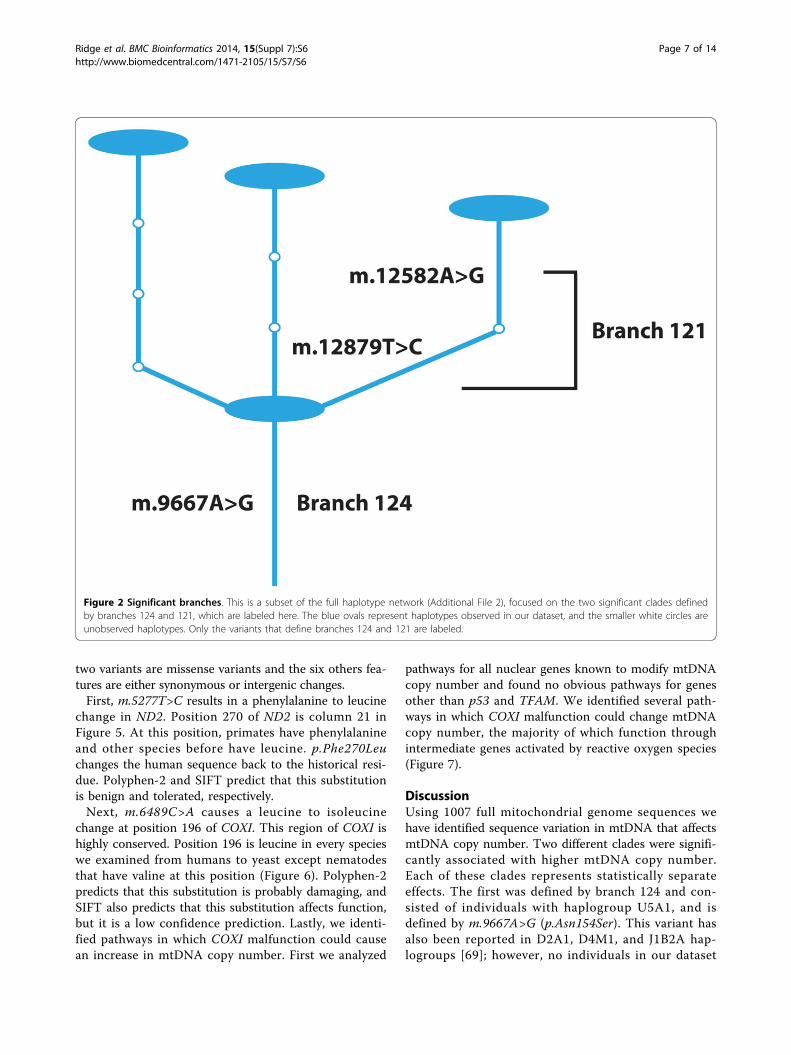
Branches 124 and 121 are associated with mtDNA copynumberFirst, branches 124 and 121, p-values of 8.0e-4 and 0.0043(multi-test corrected p-values), respectively (Table 2,Figure 1), were associated with higher mtDNA copy num-ber. The clade defined by branch 121 is wholly containedwithin branch 124 (Figure 2); therefore, these twobranches are highly correlated and represent the sameeffect. Branch 124 is defined by a single variant (Table 3),m.9667A>G. This is a missense variant, p.Asn154Ser,located in cytochrome C oxidase 3 (COXIII). Branch 121is defined by two variants (Table 3), m.12582A>G andm.12879T>C, both synonymous variants in NADH dehy-drogenase 5 (ND5).Since these two branches correspond to a single effect
and branch 121 is wholly contained within branch 124, weconsider only the clade defined by branch 124 from thispoint forward. This clade contains 14 individuals for whomwe have mtDNA copy number measurements. Pairwisekinship coefficients are reported for these individuals inAdditional File 5. Individuals in this clade have a mtDNAcopy number nearly 50% higher (3.81 compared to 2.69,p-value 8.0e-4) than individuals in the rest of the dataset.All of the individuals in the clade defined by branch
124 belong to major mitochondrial haplogroup U5A1,and have one of four different haplotypes (represented bynodes in Figure 2). Nine other individuals (five differenthaplotypes) in the dataset also belong to U5A1. Theseindividuals are located in adjacent clades to the onedefined by branch 124 and have significantly lower
mitochondrial copy numbers than the other U5A1 indivi-duals (p-value 0.0082). The contrast of all U5A1 indivi-duals against the rest of the dataset was nominallysignificant (p-value 0.0019). While no d-loop variantsdefine branch 124, m.16399A>G, a d-loop variant, is onlyfound in the U5A1 individuals in our dataset and in gen-eral appears to be found in all U5A1 individuals [69].
Branch 50 is associated with mtDNA copy numberBranch 50 is the third branch significantly associatedhigher mtDNA copy number (p-value 0.015, multi-testcorrected p-value, Table 2 Figure 1). This represents a sta-tistically separate effect as we controlled for the effect ofbranch 124 in our analyses (just as we controlled forbranch 50 in our analyses of branch 124). Eight sequencefeatures define branch 50: seven single nucleotide variantsand one nine base pair deletion (Table 3). Six of the eightfeatures are intergenic or synonymous, but the other twoare both missense variants. m.5277T>C (p.Phe270Leu) is amissense variant in NADH dehydrogenase 2 (ND2) andm.6489C>A (p.Leu196Ile) is a missense variant in cyto-chrome C oxidase 1 (COXI).In the clade defined by branch 50 there are 12 indivi-
duals with mtDNA copy number measurements. Pairwisekinship coefficients are reported for these individuals inAdditional File 6. The average mtDNA copy number forindividuals in this clade is 3.64 and is significantly higherthan the average for the rest of the dataset (2.69, p-value0.015). Individuals in this clade belong to major mito-chondrial haplogroup T2 and all have the exact samehaplotype. There were no other T2 individuals in the restof our dataset; however, there were T2A, T2B, T2C, andT2E individuals. The contrast between T2 and all T2sub-haplogroups (T2A, T2B, T2C, and T2E) and the restof the data was nominally significant, p-value 0.019, andthe contrast of T2B individuals alone against the rest ofthe dataset was nominally significant, p-value 0.0062.
G, branch 124",1,0,1,0,0pc,0pc,0pc,0pc>BioinformaticAnalyses of m.9667A>G, branch 124m.9667A>G is the defining sequence change between theU5A1 individuals in our dataset who had significantly
Table 2 Demographic information for significant contrasts.
Individuals/Missing p-value1 p-value2 Age Male/Female Mean copy #
Nominal Corrected Nominal Corrected
Whole network 1007/193 N/A N/A N/A N/A 75.6 442/565 2.69
Branch 124 17/3 0 6.0e-4 0 8.0e-4 75.2 9/8 3.81
Branch 121 10/1 0 0.002 1.0e-4 0.0043 76.3 4/6 4.01
Branch 50 15/3 2.0e-4 0.017 2.0e-4 0.015 78.4 7/8 3.64
Here we report demographic information for each of the significant contrasts and for all the individuals in the dataset. The clade represented by Branch 121 iswholly contained within Branch 124, so these two contrasts represent a single effect. Branches 124 and 50 represent separate effects. Missing refers to thenumber of individuals for whom we have no mtDNA copy number measurement.1p-values were calculated controlling only for the other significant branches2p-values were calculated using age, gender, mtDNA copy number family risk score, and the other significant effects as covariates
Ridge et al. BMC Bioinformatics 2014, 15(Suppl 7):S6http://www.biomedcentral.com/1471-2105/15/S7/S6
Page 5 of 14
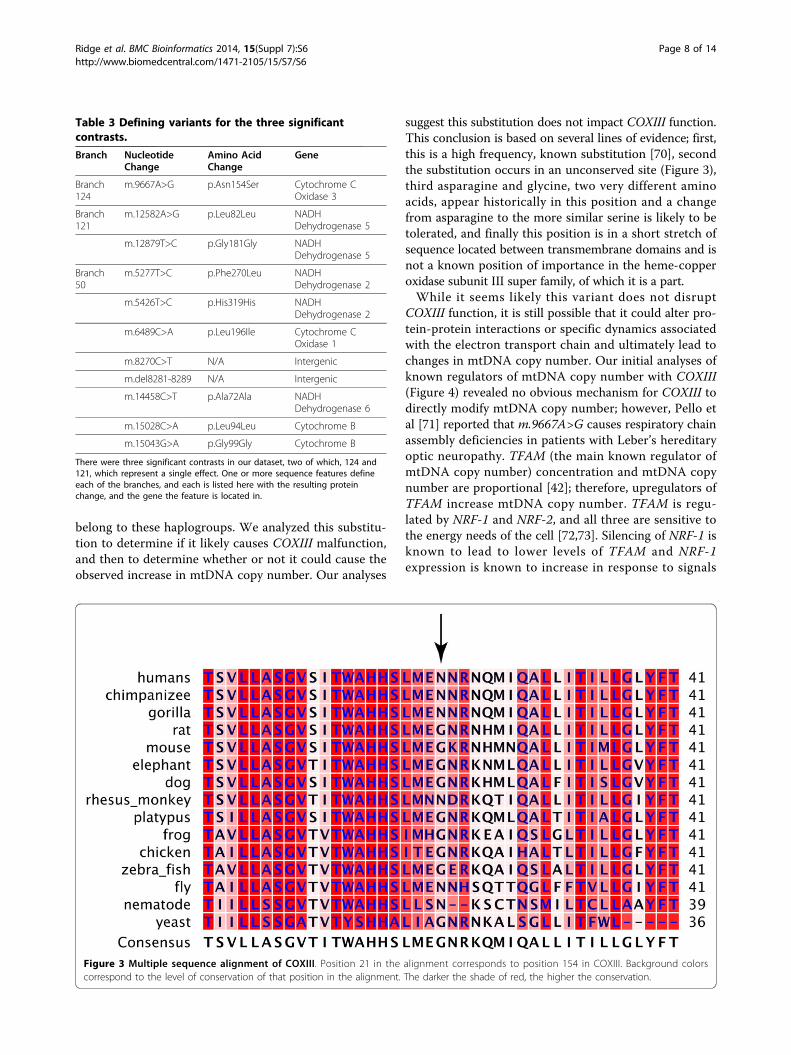
higher mtDNA copy number levels from the other U5A1individuals in our dataset whose copy number measure-ments were not statistically different from the rest of thedataset. m.9667A>G causes an amino acid substitution,asparagine to serine, at position 154 of COXIII, which islocated in an 11 residue stretch between transmembranedomains. Since this is a missense mutation, we sought todetermine if it changes or inhibits COXIII and/or thecytochrome c oxidase complex. We compared COXIIIsequences in organisms from humans through yeast byaligning a 41-residue stretch of COXIII. In Figure 3, posi-tion 154 of COXIII (the position of the amino acid substi-tution corresponding to m.9667A>G) is in position 21 ofthe alignment. As seen in Figure 3, two different aminoacids appear in this position: asparagine and glycine.Asparagine and glycine are both uncharged amino acids;however, asparagine is polar, whereas glycine is nonpolar.M.9667A>G results in serine replacing asparagine. Serineis polar and similar in size to asparagine (asparagine 132.1g/mol, glycine 75.1 g/mol, and serine 105.1 g/mol).We further analyzed the effect of this substitution on
COXIII by using in silico algorithms that predict theeffect of amino acid substitutions on protein function
using a variety of criteria such as conservation, aminoacid biochemical properties, known domains/structuresof the protein, etc. Polyphen-2 predicted the substitutionto be benign and SIFT predicted a pathogenic mutation,but noted that its prediction was of very low confidence.Lastly, we looked at possible interactions of COXIII with
known regulators (listed in the Introduction) of mtDNAcopy number to identify mechanisms m.9667A>G couldcause the increased copy number. We found commonregulators of both COXIII and the mtDNA copy numberregulators, and we found ways that these regulators couldaffect COXIII expression; however, we identified nopathways by which COXIII could regulate mtDNA copynumber by known mechanisms (Figure 4).
C and m.6489C>A, branch50",1,0,1,0,0pc,0pc,0pc,0pc>Bioinformatic Analyses ofm.5277T>C and m.6489C>A, branch 50It is more difficult to say which variants are causing theincrease in mtDNA copy number for the clade-defined bybranch 50 since this branch consists of eight differentsequence features. We chose to focus our analyses on twoof the features: m.5277T>C and m.6489C>A since these
Figure 1 Box plot comparing mitochondrial copy number between different clades. The grey dots represent the mitochondrial copynumber for each member of the representative groups. The top and bottom of the boxes correspond to the 75th and 25th percentiles, respectively,and the line through the box is the median mitochondrial copy number for the group. The whiskers correspond to the maximum and minimummitochondrial copy numbers for the group. Three different groups are represented here: the clades defined by branches 124 and 50, and a groupcontaining all other individuals in the dataset. The y-axis is the mitochondrial copy number. The reported p-values are corrected.
Ridge et al. BMC Bioinformatics 2014, 15(Suppl 7):S6http://www.biomedcentral.com/1471-2105/15/S7/S6
Page 6 of 14
two variants are missense variants and the six others fea-tures are either synonymous or intergenic changes.First, m.5277T>C results in a phenylalanine to leucine
change in ND2. Position 270 of ND2 is column 21 inFigure 5. At this position, primates have phenylalanineand other species before have leucine. p.Phe270Leuchanges the human sequence back to the historical resi-due. Polyphen-2 and SIFT predict that this substitutionis benign and tolerated, respectively.Next, m.6489C>A causes a leucine to isoleucine
change at position 196 of COXI. This region of COXI ishighly conserved. Position 196 is leucine in every specieswe examined from humans to yeast except nematodesthat have valine at this position (Figure 6). Polyphen-2predicts that this substitution is probably damaging, andSIFT also predicts that this substitution affects function,but it is a low confidence prediction. Lastly, we identi-fied pathways in which COXI malfunction could causean increase in mtDNA copy number. First we analyzed
pathways for all nuclear genes known to modify mtDNAcopy number and found no obvious pathways for genesother than p53 and TFAM. We identified several path-ways in which COXI malfunction could change mtDNAcopy number, the majority of which function throughintermediate genes activated by reactive oxygen species(Figure 7).
DiscussionUsing 1007 full mitochondrial genome sequences wehave identified sequence variation in mtDNA that affectsmtDNA copy number. Two different clades were signifi-cantly associated with higher mtDNA copy number.Each of these clades represents statistically separateeffects. The first was defined by branch 124 and con-sisted of individuals with haplogroup U5A1, and isdefined by m.9667A>G (p.Asn154Ser). This variant hasalso been reported in D2A1, D4M1, and J1B2A hap-logroups [69]; however, no individuals in our dataset
Figure 2 Significant branches. This is a subset of the full haplotype network (Additional File 2), focused on the two significant clades definedby branches 124 and 121, which are labeled here. The blue ovals represent haplotypes observed in our dataset, and the smaller white circles areunobserved haplotypes. Only the variants that define branches 124 and 121 are labeled.
Ridge et al. BMC Bioinformatics 2014, 15(Suppl 7):S6http://www.biomedcentral.com/1471-2105/15/S7/S6
Page 7 of 14
belong to these haplogroups. We analyzed this substitu-tion to determine if it likely causes COXIII malfunction,and then to determine whether or not it could cause theobserved increase in mtDNA copy number. Our analyses
suggest this substitution does not impact COXIII function.This conclusion is based on several lines of evidence; first,this is a high frequency, known substitution [70], secondthe substitution occurs in an unconserved site (Figure 3),third asparagine and glycine, two very different aminoacids, appear historically in this position and a changefrom asparagine to the more similar serine is likely to betolerated, and finally this position is in a short stretch ofsequence located between transmembrane domains and isnot a known position of importance in the heme-copperoxidase subunit III super family, of which it is a part.While it seems likely this variant does not disrupt
COXIII function, it is still possible that it could alter pro-tein-protein interactions or specific dynamics associatedwith the electron transport chain and ultimately lead tochanges in mtDNA copy number. Our initial analyses ofknown regulators of mtDNA copy number with COXIII(Figure 4) revealed no obvious mechanism for COXIII todirectly modify mtDNA copy number; however, Pello etal [71] reported that m.9667A>G causes respiratory chainassembly deficiencies in patients with Leber’s hereditaryoptic neuropathy. TFAM (the main known regulator ofmtDNA copy number) concentration and mtDNA copynumber are proportional [42]; therefore, upregulators ofTFAM increase mtDNA copy number. TFAM is regu-lated by NRF-1 and NRF-2, and all three are sensitive tothe energy needs of the cell [72,73]. Silencing of NRF-1 isknown to lead to lower levels of TFAM and NRF-1expression is known to increase in response to signals
Table 3 Defining variants for the three significantcontrasts.
Branch NucleotideChange
Amino AcidChange
Gene
Branch124
m.9667A>G p.Asn154Ser Cytochrome COxidase 3
Branch121
m.12582A>G p.Leu82Leu NADHDehydrogenase 5
m.12879T>C p.Gly181Gly NADHDehydrogenase 5
Branch50
m.5277T>C p.Phe270Leu NADHDehydrogenase 2
m.5426T>C p.His319His NADHDehydrogenase 2
m.6489C>A p.Leu196Ile Cytochrome COxidase 1
m.8270C>T N/A Intergenic
m.del8281-8289 N/A Intergenic
m.14458C>T p.Ala72Ala NADHDehydrogenase 6
m.15028C>A p.Leu94Leu Cytochrome B
m.15043G>A p.Gly99Gly Cytochrome B
There were three significant contrasts in our dataset, two of which, 124 and121, which represent a single effect. One or more sequence features defineeach of the branches, and each is listed here with the resulting proteinchange, and the gene the feature is located in.
Figure 3 Multiple sequence alignment of COXIII. Position 21 in the alignment corresponds to position 154 in COXIII. Background colorscorrespond to the level of conservation of that position in the alignment. The darker the shade of red, the higher the conservation.
Ridge et al. BMC Bioinformatics 2014, 15(Suppl 7):S6http://www.biomedcentral.com/1471-2105/15/S7/S6
Page 8 of 14
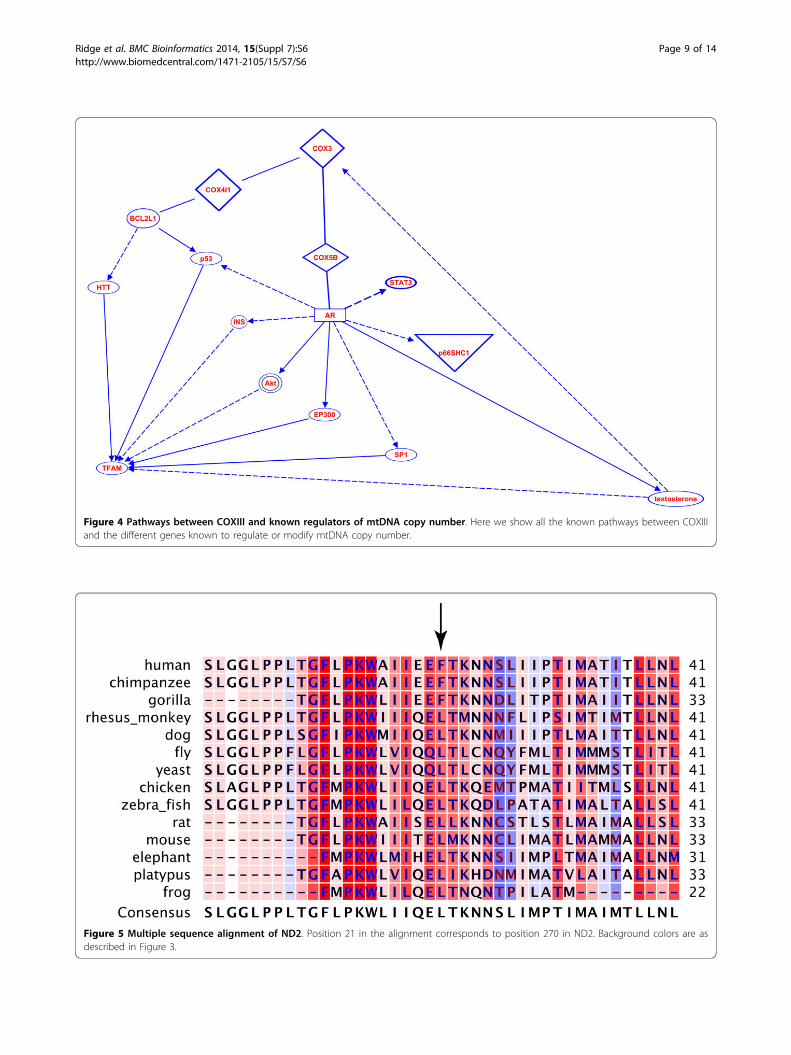
Figure 4 Pathways between COXIII and known regulators of mtDNA copy number. Here we show all the known pathways between COXIIIand the different genes known to regulate or modify mtDNA copy number.
Figure 5 Multiple sequence alignment of ND2. Position 21 in the alignment corresponds to position 270 in ND2. Background colors are asdescribed in Figure 3.
Ridge et al. BMC Bioinformatics 2014, 15(Suppl 7):S6http://www.biomedcentral.com/1471-2105/15/S7/S6
Page 9 of 14
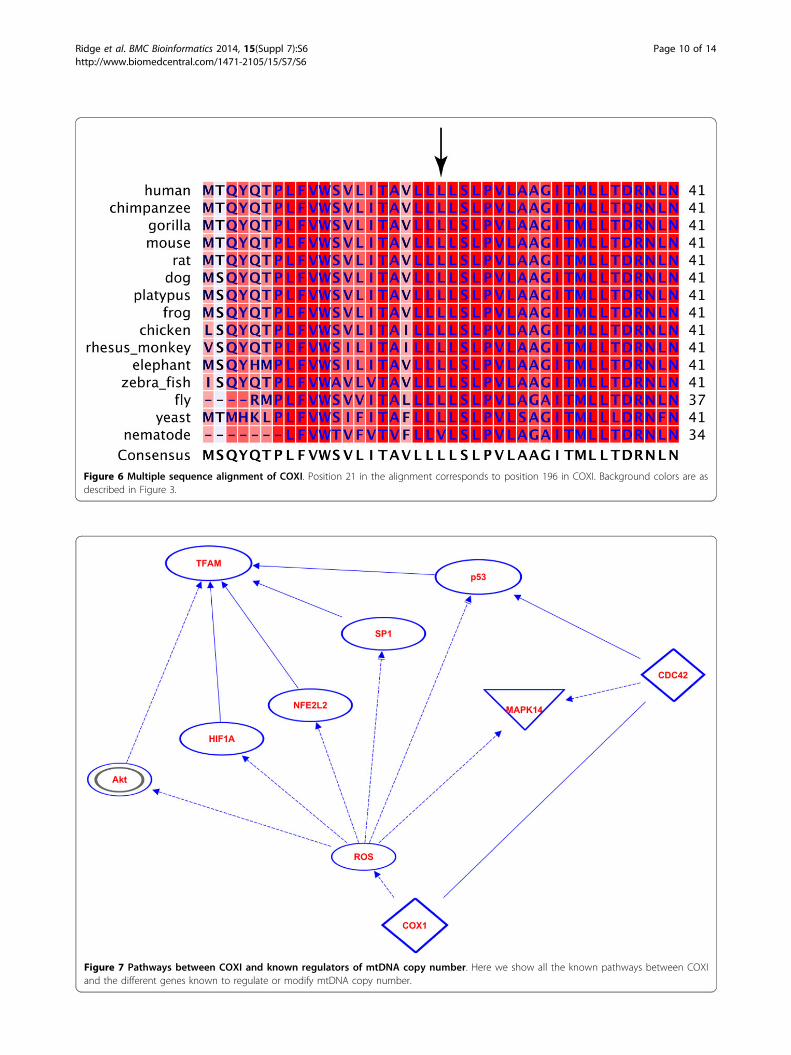
Figure 6 Multiple sequence alignment of COXI. Position 21 in the alignment corresponds to position 196 in COXI. Background colors are asdescribed in Figure 3.
Figure 7 Pathways between COXI and known regulators of mtDNA copy number. Here we show all the known pathways between COXIand the different genes known to regulate or modify mtDNA copy number.
Ridge et al. BMC Bioinformatics 2014, 15(Suppl 7):S6http://www.biomedcentral.com/1471-2105/15/S7/S6
Page 10 of 14
meant to increase energy production [73]. We proposethe following model for m.9667A>G to increase mtDNAcopy number. First, m.9667A>G can decrease the effi-ciency of complex assembly and decrease overall energyproduction of the mitochondria, in response, NRF-1expression increases, which in turn increases TFAMexpression, and TFAM expression increases mtDNAcopy number.The second clade significantly associated with higher
mtDNA copy number is defined by branch 50. Branch50 consists of eight sequence features, six of which aresynonymous changes or located in intergenic regions.We focused our functional analyses on the two missensevariants. The first is m.5277T>C (p.Phe270Leu) in ND2.Besides T2, this variant has also been reported inL1C1A1B individuals [69] and there are no L1C1A1Bindividuals in our dataset. This variant is in an uncon-served region immediately adjacent to a low complexityregion, predicted to not affect protein function, and isnot novel [74,75]. These data suggest this variant is notfunctionally deleterious.In contrast, there is evidence that the second of the two
variants that define this clade, m.6489C>A (p.Leu196Ile),is functionally deleterious and can explain changes inmtDNA copy number. m.6489C>A is specific to T2 [69].This variant in COXI occurs in a highly conserved regionin both COXI and the heme-copper subunit I domain it isin, and is predicted to affect function. COXI and COXIIform the catalytic center of cytochrome c oxidase (COX),or complex IV, in the respiratory complex. m.6489C>A isnot a novel mutation and has been reported to lead toCOX deficiency and a destabilization of complex IV [76].It does appear, however, that a high threshold of mutantmtDNA is required before a phenotype appears [76,77].The variant has only been observed in mitochondrial hap-logroups T2F1 [69] and in our T2 individuals here.COXI is involved in several pathways that include
known regulators of mtDNA copy number (Figure 7).Mutations in mtDNA in general, and cytochrome c oxi-dase malfunction specifically, lead to an increase in reac-tive oxygen species (ROS) [78]. ROS increase expressionand/or activate protein kinase B (Akt) [79,80], HIF-1Alpha (HIF1A) [81,82], nuclear factor (erythroid-derived2)-like 2 (NFE2L2) [83], SP1 transcription factor [84], andp53 [85,86]. p53 could also be potentially activated byCOXI binding CDC42 [87,88]. Of these genes, two sup-press TFAM (Akt and HIF1A) [89,90], and three increaseTFAM expression (NFE2L2, SP1, and p53) [91-93].
ConclusionsAs we outlined previously, mtDNA copy number isrelated to several important human health phenotypesincluding several age-related disorders. The identificationof these variants that increase mtDNA copy number has
important implications in understanding the pathologicalprocesses that underlie these phenotypes. We have usedbioinformatics analyses to generate hypotheses for themechanisms by which these variants influence mtDNAcopy number, successfully generating several hypotheses.Future work to characterize these mechanisms will pro-vide important insights into the effects of mitochondrialgenomic variation on mtDNA copy number and broaderhuman phenotypes.
Additional material
Additional file 1: (docx) Mitochondrial copy number measurements.List of mitochondrial copy number measurements, age, and gender forall individuals used in our analyses.
Additional file 2: (pdf) Haplotype network. Our haplotype networkwas constructed using TCS and 285 full mitochondrial genomes. Thearrows point to each of the three branches representing the significantcontrasts. The blue arrow points to branch 124, the red to branch 121,and the green to branch 50.
Additional file 3: (tiff) Haplotype network. We collapsed ourhaplotype network (Additional File 2) into nodes corresponding to themajor mitochondrial haplogroups present in our network.
Additional file 4: (xlsx) Mitochondrial haplogroups. We have listed allthe major mitochondrial haplogroups as well as sub-haplogroups in ourdataset. The numbers in parenthesis represent the number of individualsin our dataset that belong to the haplogroup. There were 1007 totalindividuals in our dataset.
Additional file 5: (docx) Kinship coefficients for the clade definedby branch 124. We have listed the pairwise kinship coefficients for allthe individuals in this clade. The IDs (row and column titles) correspondto the same IDs used in Additional File 1.
Additional file 6: (docx) Kinship coefficients for the clade definedby branch 50. We have listed the pairwise kinship coefficients for all theindividuals in this clade. The IDs (row and column titles) correspond tothe same IDs used in Additional File 1.
List of abbreviationsmtDNA, mitochondrial genome; CNS, central nervous system, AD,Alzheimer’s disease; ROS, reactive oxygen species; ETC, electron transportchain; SNV, single nucleotide variant; TFAM, mitochondrial transcriptionfactor A; STAT3, signal transducer and activator of transcription 3; D-loop,displacement loop; COX, cytochrome C oxidase; COXI, cytochrome C oxidase1; COXIII, cytochrome C oxidase 3; ND2, NADH dehydrogenase 2; ND5,NADH dehydrogenase 5; Akt, activate protein kinase B; HIF1A, HIF-1 Alpha;NFE2L2, nuclear factor (erythroid-derived 2)-like 2; CEPH, Centre d’Etude duPolymorphisme.
Competing interestsThe authors declare that they have no competing interests.
Authors’ contributionsPGR, TYM, RMC, and JSKK designed analyses; PGR2, TJM, and RAK performedthe analyses; CDC, JTT, MCN, RGM, EO, and RAK collected the data; RMCmeasured mitochondrial copy number; PGR2 and SJF wrote the paper; allauthors contributed to revisions and approved of the final draft.
AcknowledgementsThe authors thank the participants and staff of the Dementia ProgressionStudy, the Utah Population Database, and the Cache County Study onMemory Health and Aging for their important contributions to this work.Additionally, the authors acknowledge the assistance of Drs. David Ward andNed Weinshenker. The funders had no role in study design, data collectionand analysis, decision to publish, or preparation of the manuscript.
Ridge et al. BMC Bioinformatics 2014, 15(Suppl 7):S6http://www.biomedcentral.com/1471-2105/15/S7/S6
Page 11 of 14
DeclarationsThis work was supported by grants from NIH (R01AG11380, R01AG21136,R01AG31272, R01AG042611), the Alzheimer’s Association (MNIRG-11-205368)and the Utah Science, Technology, and Research initiative (USTAR), and theBrigham Young University Gerontology Program (JSKK).This article has been published as part of BMC Bioinformatics Volume 15Supplement 7, 2014: Selected articles from the 10th Annual Biotechnologyand Bioinformatics Symposium (BIOT 2013). The full contents of thesupplement are available online at http://www.biomedcentral.com/bmcbioinformatics/supplements/15/S7
Authors’ details1Department of Biology, Brigham Young University, Provo, UT, USA. 2ARUPInstitute for Clinical and Experimental Pathology, Salt Lake City, UT, USA.3Human Genetics Center, University of Texas School of Public Health,Houston, TX, USA. 4Department of Mathematics and Statistics, Utah StateUniversity, Logan, UT, USA. 5Center for Epidemiologic Studies, Utah StateUniversity, Logan, UT, USA. 6Department of Psychology, Utah StateUniversity, Logan, UT, USA. 7Department of Family Consumer and HumanDevelopment, Utah State University, Logan, UT, USA. 8Department ofNutrition, Dietetics, and Food Sciences, Utah State University, Logan, UT,USA. 9Department of Epidemiology and Population Health, University ofLouisville, Louisville, KY, USA. 10Department of Human Genetics, University ofUtah, Salt Lake City, UT, USA.
Published: 28 May 2014
References1. Sequeira A, Martin MV, Rollins B, Moon EA, Bunney WE, Macciardi F,
Lupoli S, Smith EN, Kelsoe J, Magnan CN, et al: Mitochondrial mutationsand polymorphisms in psychiatric disorders. Frontiers in genetics 2012,3:103.
2. Konradi C, Eaton M, MacDonald ML, Walsh J, Benes FM, Heckers S:Molecular evidence for mitochondrial dysfunction in bipolar disorder.Archives of general psychiatry 2004, 61(3):300-308.
3. Vilming ST, Dietrichson P, Isachsen MM, Lovvik L, Heiberg A: Late-onsethereditary myopathy with abnormal mitochondria and progressivedementia. Acta neurologica Scandinavica 1986, 73(5):502-506.
4. Swerdlow RH, Burns JM, Khan SM: The Alzheimer’s disease mitochondrialcascade hypothesis. J Alzheimers Dis 2010, , 20 Suppl 2: S265-279.
5. Swerdlow RH, Khan SM: A “mitochondrial cascade hypothesis” forsporadic Alzheimer’s disease. Med Hypotheses 2004, 63(1):8-20.
6. Swerdlow RH, Khan SM: The Alzheimer’s disease mitochondrial cascadehypothesis: an update. Exp Neurol 2009, 218(2):308-315.
7. Ballinger SW, Shoffner JM, Gebhart S, Koontz DA, Wallace DC:Mitochondrial diabetes revisited. Nature genetics 1994, 7(4):458-459.
8. Bianchi M, Rizza T, Verrigni D, Martinelli D, Tozzi G, Torraco A, Piemonte F,Dionisi-Vici C, Nobili V, Francalanci P, et al: Novel large-rangemitochondrial DNA deletions and fatal multisystemic disorder withprominent hepatopathy. Biochemical and biophysical researchcommunications 2011, 415(2):300-304.
9. Jun AS, Brown MD, Wallace DC: A mitochondrial DNA mutation atnucleotide pair 14459 of the NADH dehydrogenase subunit 6 geneassociated with maternally inherited Leber hereditary optic neuropathyand dystonia. Proceedings of the National Academy of Sciences of the UnitedStates of America 1994, 91(13):6206-6210.
10. Shoffner JM, Lott MT, Lezza AM, Seibel P, Ballinger SW, Wallace DC:Myoclonic epilepsy and ragged-red fiber disease (MERRF) is associatedwith a mitochondrial DNA tRNA(Lys) mutation. Cell 1990, 61(6):931-937.
11. Taylor RW, Morris AA, Hutchinson M, Turnbull DM: Leigh diseaseassociated with a novel mitochondrial DNA ND5 mutation. Europeanjournal of human genetics : EJHG 2002, 10(2):141-144.
12. Finsterer J: Hematological manifestations of primary mitochondrialdisorders. Acta haematologica 2007, 118(2):88-98.
13. Koutnikova H, Campuzano V, Foury F, Dolle P, Cazzalini O, Koenig M:Studies of human, mouse and yeast homologues indicate amitochondrial function for frataxin. Nature genetics 1997, 16(4):345-351.
14. Gu M, Cooper JM, Butler P, Walker AP, Mistry PK, Dooley JS, Schapira AH:Oxidative-phosphorylation defects in liver of patients with Wilson’sdisease. Lancet 2000, 356(9228):469-474.
15. Schlame M, Towbin JA, Heerdt PM, Jehle R, DiMauro S, Blanck TJ:Deficiency of tetralinoleoyl-cardiolipin in Barth syndrome. Annals ofneurology 2002, 51(5):634-637.
16. Larsson NG: Somatic mitochondrial DNA mutations in mammalian aging.Annual review of biochemistry 2010, 79:683-706.
17. Adam-Vizi V: Production of reactive oxygen species in brainmitochondria: contribution by electron transport chain and non-electrontransport chain sources. Antioxid Redox Signal 2005, 7(9-10):1140-1149.
18. Cooke MS, Evans MD, Dizdaroglu M, Lunec J: Oxidative DNA damage:mechanisms, mutation, and disease. FASEB J 2003, 17(10):1195-1214.
19. Li Z, Wu J, Deleo CJ: RNA damage and surveillance under oxidativestress. IUBMB Life 2006, 58(10):581-588.
20. Stadtman ER, Levine RL: Free radical-mediated oxidation of free amino acidsand amino acid residues in proteins. Amino Acids 2003, 25(3-4):207-218.
21. Vendelbo MH, Nair KS: Mitochondrial longevity pathways. Biochim BiophysActa 2011, 1813(4):634-644.
22. Hartmann N, Reichwald K, Wittig I, Drose S, Schmeisser S, Luck C, Hahn C,Graf M, Gausmann U, Terzibasi E, et al: Mitochondrial DNA copy numberand function decrease with age in the short-lived fish Nothobranchiusfurzeri. Aging cell 2011, 10(5):824-831.
23. Cree LM, Patel SK, Pyle A, Lynn S, Turnbull DM, Chinnery PF, Walker M: Age-related decline in mitochondrial DNA copy number in isolated humanpancreatic islets. Diabetologia 2008, 51(8):1440-1443.
24. Barazzoni R, Short KR, Nair KS: Effects of aging on mitochondrial DNAcopy number and cytochrome c oxidase gene expression in rat skeletalmuscle, liver, and heart. The Journal of biological chemistry 2000,275(5):3343-3347.
25. Miller FJ, Rosenfeldt FL, Zhang C, Linnane AW, Nagley P: Precisedetermination of mitochondrial DNA copy number in human skeletaland cardiac muscle by a PCR-based assay: lack of change of copynumber with age. Nucleic acids research 2003, 31(11):e61.
26. Lee JE, Park H, Ju YS, Kwak M, Kim JI, Oh HY, Seo JS: Higher mitochondrialDNA copy number is associated with lower prevalence ofmicroalbuminuria. Experimental & molecular medicine 2009, 41(4):253-258.
27. Hirai K, Aliev G, Nunomura A, Fujioka H, Russell RL, Atwood CS, Johnson AB,Kress Y, Vinters HV, Tabaton M, et al: Mitochondrial abnormalities inAlzheimer’s disease. The Journal of neuroscience : the official journal of theSociety for Neuroscience 2001, 21(9):3017-3023.
28. Santos RX, Correia SC, Wang X, Perry G, Smith MA, Moreira PI, Zhu X:Alzheimer’s disease: diverse aspects of mitochondrial malfunctioning.International journal of clinical and experimental pathology 2010,3(6):570-581.
29. Lynch SM, Weinstein SJ, Virtamo J, Lan Q, Liu CS, Cheng WL, Rothman N,Albanes D, Stolzenberg-Solomon RZ: Mitochondrial DNA copy numberand pancreatic cancer in the alpha-tocopherol beta-carotene cancerprevention study. Cancer prevention research 2011, 4(11):1912-1919.
30. Yu M, Zhou Y, Shi Y, Ning L, Yang Y, Wei X, Zhang N, Hao X, Niu R:Reduced mitochondrial DNA copy number is correlated with tumorprogression and prognosis in Chinese breast cancer patients. IUBMB life2007, 59(7):450-457.
31. Thyagarajan B, Wang R, Barcelo H, Koh WP, Yuan JM: Mitochondrial copynumber is associated with colorectal cancer risk. Cancer epidemiology,biomarkers & prevention : a publication of the American Association for CancerResearch, cosponsored by the American Society of Preventive Oncology 2012.
32. Yu M, Wan Y, Zou Q: Decreased copy number of mitochondrial DNA inEwing’s sarcoma. Clinica chimica acta; international journal of clinicalchemistry 2010, 411(9-10):679-683.
33. Lamson DW, Plaza SM: Mitochondrial factors in the pathogenesis ofdiabetes: a hypothesis for treatment. Alternative medicine review : a journalof clinical therapeutic 2002, 7(2):94-111.
34. Blokhin A, Vyshkina T, Komoly S, Kalman B: Variations in mitochondrialDNA copy numbers in MS brains. Journal of molecular neuroscience : MN2008, 35(3):283-287.
35. Coskun P, Wyrembak J, Schriner SE, Chen HW, Marciniack C, Laferla F,Wallace DC: A mitochondrial etiology of Alzheimer and Parkinsondisease. Biochimica et biophysica acta 2012, 1820(5):553-564.
36. Lee JW, Park KD, Im JA, Kim MY, Lee DC: Mitochondrial DNA copy numberin peripheral blood is associated with cognitive function in apparentlyhealthy elderly women. Clinica chimica acta; international journal of clinicalchemistry 2010, 411(7-8):592-596.
Ridge et al. BMC Bioinformatics 2014, 15(Suppl 7):S6http://www.biomedcentral.com/1471-2105/15/S7/S6
Page 12 of 14
37. Suomalainen A, Isohanni P: Mitochondrial DNA depletion syndromes–many genes, common mechanisms. Neuromuscular disorders : NMD 2010,20(7):429-437.
38. Lebedeva MA, Shadel GS: Cell cycle- and ribonucleotide reductase-drivenchanges in mtDNA copy number influence mtDNA Inheritance withoutcompromising mitochondrial gene expression. Cell cycle 2007,6(16):2048-2057.
39. Clay Montier LL, Deng JJ, Bai Y: Number matters: control of mammalianmitochondrial DNA copy number. Journal of genetics and genomics = Yichuan xue bao 2009, 36(3):125-131.
40. Hassanin A, Ropiquet A, Couloux A, Cruaud C: Evolution of themitochondrial genome in mammals living at high altitude: new insightsfrom a study of the tribe Caprini (Bovidae, Antilopinae). Journal ofmolecular evolution 2009, 68(4):293-310.
41. Carling PJ, Cree LM, Chinnery PF: The implications of mitochondrial DNAcopy number regulation during embryogenesis. Mitochondrion 2011,11(5):686-692.
42. Ekstrand MI, Falkenberg M, Rantanen A, Park CB, Gaspari M, Hultenby K,Rustin P, Gustafsson CM, Larsson NG: Mitochondrial transcription factor Aregulates mtDNA copy number in mammals. Human molecular genetics2004, 13(9):935-944.
43. Matsushima Y, Goto Y, Kaguni LS: Mitochondrial Lon protease regulatesmitochondrial DNA copy number and transcription by selectivedegradation of mitochondrial transcription factor A (TFAM). Proceedingsof the National Academy of Sciences of the United States of America 2010,107(43):18410-18415.
44. Guo J, Zheng L, Liu W, Wang X, Wang Z, French AJ, Kang D, Chen L,Thibodeau SN: Frequent truncating mutation of TFAM inducesmitochondrial DNA depletion and apoptotic resistance in microsatellite-unstable colorectal cancer. Cancer research 2011, 71(8):2978-2987.
45. Taylor SD, Zhang H, Eaton JS, Rodeheffer MS, Lebedeva MA, O’Rourke T W,Siede W, Shadel GS: The conserved Mec1/Rad53 nuclear checkpointpathway regulates mitochondrial DNA copy number in Saccharomycescerevisiae. Molecular biology of the cell 2005, 16(6):3010-3018.
46. Kulawiec M, Ayyasamy V, Singh KK: p53 regulates mtDNA copy numberand mitocheckpoint pathway. Journal of carcinogenesis 2009, 8:8.
47. Gianotti TF, Castano G, Gemma C, Burgueno AL, Rosselli MS, Pirola CJ,Sookoian S: Mitochondrial DNA copy number is modulated by geneticvariation in the signal transducer and activator of transcription 3(STAT3). Metabolism: clinical and experimental 2011, 60(8):1142-1149.
48. Trinei M, Berniakovich I, Pelicci PG, Giorgio M: Mitochondrial DNA copynumber is regulated by cellular proliferation: a role for Ras and p66(Shc). Biochimica et biophysica acta 2006, 1757(5-6):624-630.
49. Tewari S, Santos JM, Kowluru RA: Damaged mitochondrial DNA replicationsystem and the development of diabetic retinopathy. Antioxidants &redox signaling 2012, 17(3):492-504.
50. Ylikallio E, Tyynismaa H, Tsutsui H, Ide T, Suomalainen A: Highmitochondrial DNA copy number has detrimental effects in mice.Human molecular genetics 2010, 19(13):2695-2705.
51. Ridge PG, Maxwell T, Corcoran C, Norton M, Tschanz J, O’Brien E, Kerber R,Cawthon R, Munger R, JSK. K: Mitochondrial genomic analysis of late onsetAlzheimer’s disease reveals protective haplogroups H6A1A/H6A1B: theCache County Study on Memory in Aging. PLoS One 2012, 7(9):e45134.
52. Breitner JC, Wyse BW, Anthony JC, Welsh-Bohmer KA, Steffens DC,Norton MC, Tschanz JT, Plassman BL, Meyer MR, Skoog I, et al: APOE-epsilon4 count predicts age when prevalence of AD increases, thendeclines: the Cache County Study. Neurology 1999, 53(2):321-331.
53. Jorde LB: The genetic structure of the Utah Mormons: migration analysis.Hum Biol 1982, 54(3):583-597.
54. Jorde LB, Morgan K: Genetic structure of the Utah Mormons: isonymyanalysis. Am J Phys Anthropol 1987, 72(3):403-412.
55. O’Brien E, Rogers AR, Beesley J, Jorde LB: Genetic structure of the UtahMormons: comparison of results based on RFLPs, blood groups,migration matrices, isonymy, and pedigrees. Hum Biol 1994,66(5):743-759.
56. Cawthon RM: Telomere length measurement by a novel monochromemultiplex quantitative PCR method. Nucleic acids research 2009, 37(3):e21.
57. Parfait B, Rustin P, Munnich A, Rotig A: Co-amplification of nuclearpseudogenes and assessment of heteroplasmy of mitochondrial DNAmutations. Biochemical and biophysical research communications 1998,247(1):57-59.
58. Thompson JD, Gibson TJ, Higgins DG: Multiple sequence alignment usingClustalW and ClustalX. Curr Protoc Bioinformatics 2002, Chapter 2(Unit 2 3).
59. Clement M, Posada D, Crandall KA: TCS: a computer program to estimategene genealogies. Mol Ecol 2000, 9(10):1657-1659.
60. Templeton AR, Maxwell T, Posada D, Stengard JH, Boerwinkle E, Sing CF:Tree scanning: a method for using haplotype trees in phenotype/genotype association studies. Genetics 2005, 169(1):441-453.
61. Posada D, Maxwell TJ, Templeton AR: TreeScan: a bioinformaticapplication to search for genotype/phenotype associations usinghaplotype trees. Bioinformatics 2005, 21(9):2130-2132.
62. Westfall P, Young SS: Resampling-Based Multiple Testing: Examples andMethods for p-Value Adjustments. New York City, NY: Wiley-Interscience; 1993.
63. Kerber RA: Method for calculating risk associated with family history of adisease. Genet Epidemiol 1995, 12(3):291-301.
64. Altschul SF, Gish W, Miller W, Myers EW, Lipman DJ: Basic local alignmentsearch tool. Journal of molecular biology 1990, 215(3):403-410.
65. Marchler-Bauer A, Lu S, Anderson JB, Chitsaz F, Derbyshire MK, DeWeese-Scott C, Fong JH, Geer LY, Geer RC, Gonzales NR, et al: CDD: a ConservedDomain Database for the functional annotation of proteins. Nucleic acidsresearch 2011, 39(Database):D225-229.
66. Adzhubei IA, Schmidt S, Peshkin L, Ramensky VE, Gerasimova A, Bork P,Kondrashov AS, Sunyaev SR: A method and server for predictingdamaging missense mutations. Nature methods 2010, 7(4):248-249.
67. Kumar P, Henikoff S, Ng PC: Predicting the effects of coding non-synonymous variants on protein function using the SIFT algorithm.Nature protocols 2009, 4(7):1073-1081.
68. Kumar P, Henikoff S, Ng PC: Predicting the effects of coding non-synonymous variants on protein function using the SIFT algorithm.Nature protocols 2009, 4(7):1073-1081.
69. van Oven M, Kayser M: Updated comprehensive phylogenetic tree ofglobal human mitochondrial DNA variation. Human mutation 2009, 30(2):E386-394.
70. Saxena R, de Bakker PI, Singer K, Mootha V, Burtt N, Hirschhorn JN,Gaudet D, Isomaa B, Daly MJ, Groop L, et al: Comprehensive associationtesting of common mitochondrial DNA variation in metabolic disease.American journal of human genetics 2006, 79(1):54-61.
71. Pello R, Martin MA, Carelli V, Nijtmans LG, Achilli A, Pala M, Torroni A,Gomez-Duran A, Ruiz-Pesini E, Martinuzzi A, et al: Mitochondrial DNAbackground modulates the assembly kinetics of OXPHOS complexes ina cellular model of mitochondrial disease. Human molecular genetics 2008,17(24):4001-4011.
72. Piantadosi CA, Suliman HB: Mitochondrial transcription factor A inductionby redox activation of nuclear respiratory factor 1. The Journal ofbiological chemistry 2006, 281(1):324-333.
73. Hock MB, Kralli A: Transcriptional control of mitochondrial biogenesis andfunction. Annual review of physiology 2009, 71:177-203.
74. Finnila S, Lehtonen MS, Majamaa K: Phylogenetic network for EuropeanmtDNA. American journal of human genetics 2001, 68(6):1475-1484.
75. Herrnstadt C, Elson JL, Fahy E, Preston G, Turnbull DM, Anderson C,Ghosh SS, Olefsky JM, Beal MF, Davis RE, et al: Reduced-median-networkanalysis of complete mitochondrial DNA coding-region sequences forthe major African, Asian, and European haplogroups. American journal ofhuman genetics 2002, 70(5):1152-1171.
76. Varlamov DA, Kudin AP, Vielhaber S, Schroder R, Sassen R, Becker A, Kunz D,Haug K, Rebstock J, Heils A, et al: Metabolic consequences of a novelmissense mutation of the mtDNA CO I gene. Human molecular genetics2002, 11(16):1797-1805.
77. Kleefstra T, Wortmann SB, Rodenburg RJ, Bongers EM, Hadzsiev K,Noordam C, van den Heuvel LP, Nillesen WM, Hollody K, Gillessen-Kaesbach G, et al: Mitochondrial dysfunction and organic aciduria in fivepatients carrying mutations in the Ras-MAPK pathway. European journalof human genetics : EJHG 2011, 19(2):138-144.
78. Murphy MP: How mitochondria produce reactive oxygen species. TheBiochemical journal 2009, 417(1):1-13.
79. Zou T, Yang W, Hou Z, Yang J: Homocysteine enhances cell proliferationin vascular smooth muscle cells: role of p38 MAPK and p47phox. Actabiochimica et biophysica Sinica 2010, 42(12):908-915.
80. Lu Y, Azad N, Wang L, Iyer AK, Castranova V, Jiang BH, Rojanasakul Y:Phosphatidylinositol-3-kinase/akt regulates bleomycin-induced fibroblastproliferation and collagen production. American journal of respiratory celland molecular biology 2010, 42(4):432-441.
Ridge et al. BMC Bioinformatics 2014, 15(Suppl 7):S6http://www.biomedcentral.com/1471-2105/15/S7/S6
Page 13 of 14
81. Sitkovsky MV, Lukashev D, Apasov S, Kojima H, Koshiba M, Caldwell C,Ohta A, Thiel M: Physiological control of immune response andinflammatory tissue damage by hypoxia-inducible factors and adenosineA2A receptors. Annual review of immunology 2004, 22:657-682.
82. Gao N, Jiang BH, Leonard SS, Corum L, Zhang Z, Roberts JR, Antonini J,Zheng JZ, Flynn DC, Castranova V, et al: p38 Signaling-mediated hypoxia-inducible factor 1alpha and vascular endothelial growth factor inductionby Cr(VI) in DU145 human prostate carcinoma cells. The Journal ofbiological chemistry 2002, 277(47):45041-45048.
83. Nathan C, Ding A: Nonresolving inflammation. Cell 2010, 140(6):871-882.84. Carnesecchi S, Carpentier JL, Foti M, Szanto I: Insulin-induced vascular
endothelial growth factor expression is mediated by the NADPH oxidaseNOX3. Experimental cell research 2006, 312(17):3413-3424.
85. Lee JJ, Lee JH, Ko YG, Hong SI, Lee JS: Prevention of prematuresenescence requires JNK regulation of Bcl-2 and reactive oxygenspecies. Oncogene 2010, 29(4):561-575.
86. Li M, Fang X, Baker DJ, Guo L, Gao X, Wei Z, Han S, van Deursen JM,Zhang P: The ATM-p53 pathway suppresses aneuploidy-inducedtumorigenesis. Proceedings of the National Academy of Sciences of theUnited States of America 2010, 107(32):14188-14193.
87. Bandyopadhyay S, Chiang CY, Srivastava J, Gersten M, White S, Bell R,Kurschner C, Martin CH, Smoot M, Sahasrabudhe S, et al: A human MAPkinase interactome. Nature methods 2010, 7(10):801-805.
88. Lassus P, Roux P, Zugasti O, Philips A, Fort P, Hibner U: Extinction of rac1and Cdc42Hs signalling defines a novel p53-dependent apoptoticpathway. Oncogene 2000, 19(20):2377-2385.
89. Liu HY, Yehuda-Shnaidman E, Hong T, Han J, Pi J, Liu Z, Cao W: Prolongedexposure to insulin suppresses mitochondrial production in primaryhepatocytes. The Journal of biological chemistry 2009, 284(21):14087-14095.
90. Krishnan J, Danzer C, Simka T, Ukropec J, Walter KM, Kumpf S, Mirtschink P,Ukropcova B, Gasperikova D, Pedrazzini T, et al: Dietary obesity-associatedHif1alpha activation in adipocytes restricts fatty acid oxidation andenergy expenditure via suppression of the Sirt2-NAD+ system. Genes &development 2012, 26(3):259-270.
91. McGill JK, Beal MF: PGC-1alpha, a new therapeutic target in Huntington’sdisease? Cell 2006, 127(3):465-468.
92. Zaid A, Li R, Luciakova K, Barath P, Nery S, Nelson BD: On the role of thegeneral transcription factor Sp1 in the activation and repression ofdiverse mammalian oxidative phosphorylation genes. Journal ofbioenergetics and biomembranes 1999, 31(2):129-135.
93. Park JY, Wang PY, Matsumoto T, Sung HJ, Ma W, Choi JW, Anderson SA,Leary SC, Balaban RS, Kang JG, et al: p53 improves aerobic exercisecapacity and augments skeletal muscle mitochondrial DNA content.Circulation research 2009, 105(7):705-712, 711 p following 712.
94. Herrnstadt C, Elson JL, Fahy E, Preston G, Turnbull DM, Anderson C,Ghosh SS, Olefsky JM, Beal MF, Davis RE, et al: Reduced-median-networkanalysis of complete mitochondrial DNA coding-region sequences forthe major African, Asian, and European haplogroups. Am J Hum Genet2002, 70(5):1152-1171.
95. Ruiz-Pesini E, Lott MT, Procaccio V, Poole JC, Brandon MC, Mishmar D, Yi C,Kreuziger J, Baldi P, Wallace DC: An enhanced MITOMAP with a globalmtDNA mutational phylogeny. Nucleic acids research 2007, 35(Database):D823-828.
doi:10.1186/1471-2105-15-S7-S6Cite this article as: Ridge et al.: Mitochondrial genomic variationassociated with higher mitochondrial copy number: the Cache CountyStudy on Memory Health and Aging. BMC Bioinformatics 201415(Suppl 7):S6. Submit your next manuscript to BioMed Central
and take full advantage of:
• Convenient online submission
• Thorough peer review
• No space constraints or color figure charges
• Immediate publication on acceptance
• Inclusion in PubMed, CAS, Scopus and Google Scholar
• Research which is freely available for redistribution
Submit your manuscript at www.biomedcentral.com/submit
Ridge et al. BMC Bioinformatics 2014, 15(Suppl 7):S6http://www.biomedcentral.com/1471-2105/15/S7/S6
Page 14 of 14