Embed Size (px)
Citation preview

Mito-ID® Membrane Potential Detection Kit for fluorescence microscopy and flow cytometry Instruction Manual Cat. No. ENZ-51018-K100 100 assays
For research use only.
Rev. 1.1.1 March 2011
Enabling Discovery in Life Science®

Notice to Purchaser The Mito-ID® Membrane Potential Detection Kit is a member of the CELLestial® product line, reagents and assay kits comprising fluorescent molecular probes that have been extensively benchmarked for live cell analysis applications. CELLestial® reagents and kits are optimal for use in demanding cell analysis applications involving confocal microscopy, flow cytometry, microplate readers and HCS/HTS, where consistency and reproducibility are required. This product is manufactured and sold by ENZO LIFE SCIENCES, INC. for research use only by the end-user in the research market and is not intended for diagnostic or therapeutic use. Purchase does not include any right or license to use, develop or otherwise exploit this product commercially. Any commercial use, development or exploitation of this product or development using this product without the express prior written authorization of ENZO LIFE SCIENCES, INC. is strictly prohibited.
Limited Warranty These products are offered under a limited warranty. The products are guaranteed to meet appropriate specifications described in the package insert at the time of shipment. Enzo Life Sciences’ sole obligation is to replace the product to the extent of the purchase price. All claims must be made to Enzo Life Sciences, Inc. within five (5) days of receipt of order.
Trademarks and Patents Enzo, CELLestial and Miot-ID are trademarks of Enzo Life Sciences, Inc. Several of Enzo’s products and product applications are covered by US and foreign patents and patents pending.

Contents
I. Introduction ............................................................... 1
II. Reagents Provided and Storage.............................. 2
III. Additional Materials Required ................................. 2
IV. Safety Warnings and Precautions ........................... 3
V. Methods and Procedures ......................................... 3
A. CELL PREPARATION.......................................................... 3
B. REAGENT PREPARATION ................................................... 3
C. LIVE CELL ANALYSIS BY FLUORESCENCE MICROSCOPY (SUSPENSION CELLS) ....................................................... 4
D. LIVE CELL ANALYSIS BY FLUORESCENCE MICROSCOPY (ADHERENT CELLS) .......................................................... 5
E. LIVE CELL ANALYSIS BY FLOW CYTOMETRY ...................... 6
VI. Appendices ............................................................... 7 A. FILTER SET SELECTION ................................................... 7
B. EXAMPLE OF FLOW CYTOMETRY COMPENSATION .............. 7 C. RESULTS ......................................................................... 9
VII. References .............................................................. 10
VIII. Troubleshooting Guide ......................................... 11
I. Introduction Cell-based assays for evaluating the functional status of mitochondria are emerging as useful tools for elucidating the role of mitochondrial activity in drug-induced toxicity, the apoptosis cascade and other cellular and biochemical processes. The loss of the mitochondrial membrane potential (MMP) is often associated with the early stages of apoptosis. The collapse of MMP coincides with the opening of the mitochondrial permeability transi-tion pores, leading to the release of cytochrome C into the cytosol, which in turn triggers other downstream events in the apoptotic cascade. Enzo Life Sciences’ Mito-ID® Membrane Potential Detection Kit provides an improved approach for measuring changes in MMP, as demonstrated by a shift in the fluorescence emission maximum of a dual-emission MMP-sensitive dye from orange to green. Concomitantly, the kit monitors cell death as loss of plasma membrane integrity, as highlighted by the ability of a red-emitting, membrane-impermeable DNA intercalating dye to penetrate into the cell nucleus. The Mito-ID® Membrane Potential Detection Kit has been optimized for measurement of MMP and cell viability by conventional fluorescence microscopy and flow cytometry. A related kit, Mito-ID® Membrane Potential Cytotoxicity Assay Kit (Cat. No. ENZ-51019-KP002) has been optimized for use in fluorescence microplate-based assays. The Mito-ID® MP Detection Reagent is a cationic carbocyanine dye that fluoresces either green or or-ange, depending upon MMP status. In energized cells, the Mito-ID® Mem-brane Potential dye exists as a green-fluorescent monomer in the cytosol, but more importantly also accumulates as orange-fluorescent aggregates in the mitochondria. However, in apoptotic and necrotic cells, this dye exits mitochondria and exists primarily as green-fluorescent monomers in the cytosol. A cell-impermeant DNA intercalator, the Necrosis Detection Re-agent, similar to the red-emitting dye propidium iodide, is used to monitor late-stage apoptosis and necrotic cell death. Compared with the commonly used cationic carbocyanine dye JC-1,1-3 the emission spectrum of the Mito-ID® Membrane Potential dye is slightly blue-shifted and thus more readily distinguishable from the Necrosis Detection Reagent, allowing easier com-pensation of spectral overlap. Additionally, the dye is more soluble, more photostable and approximately 10-25-fold more sensitive to MMP changes than the conventional JC-1 dye. A control perturbation agent, CCCP, is provided as a positive control for monitoring loss in MMP. Potential applications for using the Mito-ID® Mem-brane Potential Detection Kit as a live-cell assay are for monitoring cellular events leading to MMP changes and/or apoptosis, as well as monitoring certain cell treatment conditions that lead to MMP change without eliciting apoptosis or alternatively lead to apoptosis without leading to MMP changes. Other cellular events that may alter MMP include drug-induced toxicity relating to perturbations in lipid metabolism, mitochondrial respira-tory chain breakdown or reduced mitochondrial DNA content arising from anti-viral therapy. Simultaneously monitoring MMP and plasma membrane integrity can potentially provide useful mechanistic information for drug safety evaluation of novel compounds. For example, the assay can poten-tially be used to differentiate among compounds and rank their order of potency.
1

II. Reagents Provided and Storage All reagents are shipped on dry ice. Upon receipt, the kit should be stored at -20°C, protected from light. When stored properly, these reagents are stable for six months from date of receipt. Avoid repeated freezing and thawing.
Reagents provided in the kit are sufficient for 100 assays using either live, adherent cells or cells in suspension.
2
III. Additional Materials Required Standard fluorescence microscope or a flow cytometer that is equipped
with a 488 nm laser for fluorescent dye excitation
Phosphate buffered saline (PBS)
5 mL tubes appropriate for holding cells during induction of apoptosis and necrosis
Calibrated, adjustable precision pipets, preferably with disposable plas-tic tips
Adjustable speed centrifuge with swinging buckets (for suspension cul-tures)
Glass microscope slides (for microscope analysis only)
Glass cover slips (for microscope analysis only)
Deionized water
Growth medium (e.g. Dulbecco’s modified Eagle medium, D-MEM)
Reagent Quantity
Mito-ID® MP Detection Reagent 500 µL
Necrosis Detection Reagent 600 µL
CCCP Control (2 mM) 100 µL
10X Assay Buffer 1 25 mL
50X Assay Buffer 2 5 mL

IV. Safety Warnings and Precautions This product is for research use only and is not intended for diagnostic
purposes.
Some components of this kit may contain hazardous substances. They can be harmful if ingested or absorbed through the skin and may cause irritation to the eyes. The reagents of the kit should be treated as possible mutagens and should be handled with care and disposed of properly.
Observe good laboratory practices. Gloves, lab coat, and protective eyewear should always be worn. Never pipet by mouth. Do not eat, drink or smoke in the laboratory areas. All blood components and biological materials should be treated as potentially hazardous and handled as such. They should be disposed of in accordance with established safety procedures.
To avoid photobleaching, perform all manipulations in low light environments or protected from light by other means.
V. Methods and Procedures
NOTE: PLEASE READ THE ENTIRE PROCEDURE BEFORE STARTING. Allow all reagents to be used to warm to room temperature before proceeding. Upon thawing of solutions, gently hand-mix or vortex the reagents prior to use to ensure a homogenous solution.
A. CELL PREPARATION Cells should be maintained via standard tissue culture practices. A positive control for MMP status can be performed using the CCCP Control provided in the kit. It is recommended that treatment with the agent be performed using 2-10 µM final concentration in order to ob-serve changes in MMP and that the final percent DMSO in the assay not exceed 0.2%. Treated cells should be harvested and diluted to a working concentration of 5.0 x 10⁵ - 1x 10⁶ per mL in media. Negative control cells should be treated with vehicle (DMSO, media or other solvent used to reconstitute or dilute an inducer or inhibitor) for an equal length of time under similar conditions.
B. REAGENT PREPARATION
1. Positive Control
CCCP (carbonyl cyanide 3-chlorophenylhydrazone) is a proton ionophore and uncoupler of oxidative phosphorylation in mitochondria. As such, it is useful for depolarizing mitochondria. Addition of CCCP should cause a dose-dependent reduction in mitochondrial orange fluorescence. Prepare this perturbation agent as a positive control for mitochondrial membrane potential loss. Before beginning the experiment, ensure that the vial of
3

CCCP has equilibrated to room temperature. CCCP is supplied as a 2 mM stock solution in DMSO.
2. 1X Assay Solution
Allow the 10X Assay Buffer 1 and the 50X Assay Buffer 2 to warm to room temperature. Make sure that the reagents are free of any crystallization before use. Prepare enough 1X Assay Solution for the number of samples to be assayed. For each 10 mL preparation of 1X Assay Solution, add 1 mL 10X Assay Buffer, and 0.2 mL 50X Assay Buffer 2 into 8.8 mL deionized water. Mix well.
3. Dual Detection Reagent
NOTE: The Mito-ID® MP Detection Reagent is light sensitive. Avoid direct exposure of the reagent to intense light. Aliquot and store unsused reagent at –20°C, protected from light. Avoid repeated freeze/thaw cycles. Immediately prior to use, prepare sufficient amount of Dual Detec-tion Reagent for the number of samples to be assayed as follows: To every 1 mL of 1X Assay Solution (from step 2), add 10 µL of Mito-ID® MP Detection Reagent and 4 µL of Necrosis Detection Reagent. Mix well.
C. LIVE CELL ANALYSIS BY FLUORESCENCE MICROSCOPY (SUSPENSION CELLS) 1. Cells should be cultured to a density not to exceed 1 x 10⁶ cells/
mL. Make sure that cells are in the log phase of growth before starting an experiment.
2. Treat the cells with the compound of interest and the negative control cells with vehicle. Each cell line should be evaluated on an individual basis to determine the optimal cell density for monitoring MMP changes.
3. Transfer 0.5 mL of cell suspension into a sterile centrifuge tube and centrifuge for 5 minutes at room temperature at 400 x g.
4. Remove the supernatant and carefully resuspend and wash the cells with 4 mL of 1X Assay Solution (see section B-2 for prepara-tion).
5. Carefully remove the supernatant and suspend the cells in 500 µL of the Dual Detection Reagent (prepared as per section B-3, page 4).
6. Protect the samples from light and incubate the cells at 37°C in a 5% CO2 incubator for 15 min.
4
7. Observe the cells immediately following staining by fluorescence microscopy. The orange fluorescence emission associated with energized mitochondria with high MMP can be detected using a rhodamine filter set (excitation = 540 nm, emission = 570 nm). The green fluorescence emission associated with depolarized mitochondria with low MMP can be detected using a fluorescein (FITC) filter set (excitation = 485 nm, emission = 530 nm). The red fluorescence associated with nuclear staining of cells with compromised plasma membrane integrity can be detected using a 7-AAD or propidium iodide filter (excitation = 546 nm, emission = 674 nm).
8. Positive Control Samples: It is recommended that a set of control samples be pretreated with CCCP at a final concentration of 2 μM in medium or buffer of choice for 30 mins. Once again, concentra-tion of this inducer and duration of exposure may require adjust-ment, depending upon the cell line being evaluated.
9. Follow steps 2-7 for post-treatment.
D. LIVE CELL ANALYSIS BY FLUORESCENCE MICROSCOPY (ADHERENT CELLS) 1. Grow the cells directly onto glass slides or polystyrene tissue
culture plates until ~80% confluent.
2. Treat the cells with the compound of interest and negative control cells with vehicle.
3. Carefully wash the cells twice with 1X Assay Solution (see section B-2, page 4, for preparation) in a volume sufficient for covering the cell monolayer.
4. Carefully remove the supernatant and dispense the Dual Detection Reagent (prepared as per section B-3, page 4) in a volume sufficient for covering the cell monolayer.
5. Protect the samples from light and incubate for 15 minutes at room temperature.
6. Flick the staining solution onto a paper towel and if necessary add a few drops of 1X Assay Solution to prevent the cells from drying out.
7. Cover the cells and observe under a fluorescence/confocal microscope. The orange fluorescence emission associated with energized mitochondria with high MMP can be detected using a rhodamine filter set (excitation = 540 nm, emission = 570 nm). The green fluorescence emission associated with depolarized mitochondria with low MMP can be detected using a fluorescein (FITC) filter set (excitation = 485 nm, emission = 530 nm). The red fluorescence associated with nuclear staining of cells with compromised plasma membrane integrity can be detected using a 7-AAD or propidium iodide filter (excitation = 546 nm, emission = 674 nm).
5

8. Positive Control Samples: It is recommended that a set of control samples be pretreated with CCCP at a final concentration of 2 μM in medium or buffer of choice for 30 mins. Once again concentra-tion of this inducer and duration of exposure may require adjust-ment, depending upon the cell line being evaluated.
9. Follow steps 3-7 for post-treatment.
E. LIVE CELL ANALYSIS BY FLOW CYTOMETRY The protocol described in this manual assumes that the user is famil-iar with the basic principles and practices of flow cytometry and is able to run samples according to the operator’s manual pertaining to the instrument being used.
1. Cells should be cultured to a density not to exceed 1 x 10⁶ cells/mL during staining and analysis.
2. Treat the cells with the compound of interest and negative control cells with vehicle, per desired protocol. At the end of the treatment, trypsinize (adherent cells), or collect cells (suspension cells).
3. Centrifuge the cells for 5 min. at 400 x g at room temperature.
4. Carefully remove the supernatant by aspiration and gently resuspend and wash the pellet in 4 mL 1X Assay Solution.
5. Centrifuge the cells for 5 min. at 400 x g at room temperature.
6. Carefully remove the supernatant and gently resuspend the pellet in 500 μL Dual Detection Reagent (prepared as per section B-3, page 4).
7. Protect the samples from light and incubate for 15 min. at room temperature.
8. Samples should be analyzed via flow cytometry using a 488 nm laser with the FL 1 channel for the green fluorescent monomeric signal of the Mito-ID® Membrane Potential dye, the FL 2 channel for the orange fluorescent aggregated signal from the Mito-ID® Membrane Potential dye and the FL 3 channel for red fluorescent signal of the Necrosis Detection Reagent. It is recommended that compensation corrections be performed using single stained induced cells to avoid any overlap between the Mito-ID® MP Detection Reagent and Necrosis Detection Reagent fluorescent signals.
9. Positive Control Samples: It is recommended that a set of control samples be pretreated with CCCP at a final concentration of 2 μM for 30 mins. Once again, the concentration of this inducer and duration of exposure may require adjustment, depending upon the cell line being evaluated.
10. Follow steps 2-8 for post-treatment.
6
Suggested Compensation Controls for Flow Cytometry (see Appendix B):
a. Unstained cells
b. Cells stained with Mito-ID® MP Detection Reagent (without Necrosis Detection Reagent)
c. Cells Stained with Necrosis Detection Reagent (without Mito-ID® MP Detection Reagent)
Note: Samples and controls should be kept on ice before the assay is run and analyzed via flow cytometry within one hour of staining.
VI. Appendices
A. FILTER SET SELECTION The selection of optimal filter sets for fluorescence microscopy applications requires matching the optical filter specifications to the spectral characteristics of the dyes employed in the analysis. Please consult your instrument or filter set manufacturer for assistance in selecting optimal filter sets.
Filter sets suitable for Texas Red or tetramethylrhodamine (TRITC) are recommended for imaging the orange fluorescent signal of the Mito-ID® MP Detection Reagent, representing energized mitochon-dria. Filter sets suitable for fluorescein (FITC) are recommended for imaging the green fluorescent signal of the Mito-ID® MP Detection Reagent, representing de-energized mitochondria. Filter sets suitable for 7-AAD or propidium iodide (PI) are recommended for imaging the red fluorescent signal of the Necrosis Detection Reagent, represent-ing compromised plasma membrane integrity.
B. EXAMPLE OF FLOW CYTOMETRY COMPENSATION
Suggested controls for flow cytometry:
Unstained cells (negative population)
Untreated cells stained with the Mito-ID® MP Detection Reagent only (highest orange and green signal)
CCCP-treated cells, stained with the Mito-ID® MP Detection Reagent only (lowest orange signal)
CCCP-treated cells, stained with Necrosis Detection Reagent only (highest red signal)
7

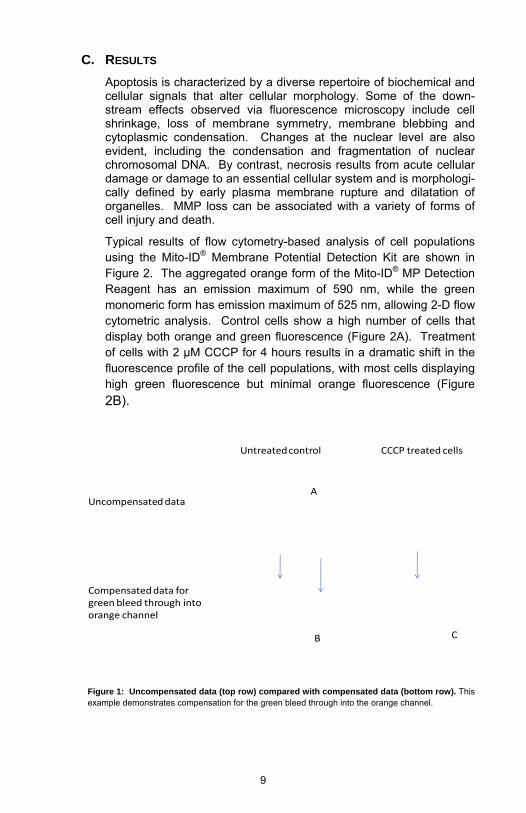
1. Generate a log FL1 (X-axis) versus log FL2 (Y-axis) dot plot. Run untreated cells stained with the Mito-ID® reagent only (compensation control 2). Set PMT for FL1 and FL2 channels so both green and orange signals will fall between the second and the third log decade scale of FL1 and FL2. Set up quadrant gate to register a dual positive cell population in the upper right quadrant (see Figure 1)
2. Adjust compensation values for the Mito-ID® MP Detection Reagent and Necrosis Detection Reagents using the same untreated Mito-ID® stained control (compensation control 2) and PMT settings established as described above.
The green Mito-ID® Membrane Potential dye signal fluo-resces mostly in the FL1 channel, but bleeds over into the FL2 channel. This needs to be compensated (as shown in Figure 1) .
To compensate, subtract the FL1 bleed from FL2. The equa-tion to use is FL2 –…%FL1 (The window “Compensation” in the Cells Quest or DiVa).
As the % compensation is increased, the green population is subtracted from the FL2 channel (double positive top right quadrant, A) and placed solely in single positive quadrant B.
Run Compensation control 3 to make sure that the overlap of the green signal into the orange channel is eliminated (see Figure 1).
Do not overcompensate – background of this sample, in terms of FL2 intensity, should be the same as that of a negative population (Figure 1-C)
If necessary, compensate for any bleed through from the orange channel into the green channel (FL1-…%FL2).
3. Repeat the compensation adjustment for the Necrosis Detection Reagent using the single stained control (controls 3 and 4).
To compensate for red bleed through into orange use FL2-…%FL3 and orange into red use FL3-FL2% (controls 3 and 4).
4. Once compensation is complete do not change the voltages. Any further voltage changes will unbalance the compensations and the process will have to be repeated. The PMT settings for this assay may be quite low due to the strong fluorescence signals.
5. Verify compensation values for each new experiment, or at least for each new cellular system tested.
8
C. RESULTS Apoptosis is characterized by a diverse repertoire of biochemical and cellular signals that alter cellular morphology. Some of the down-stream effects observed via fluorescence microscopy include cell shrinkage, loss of membrane symmetry, membrane blebbing and cytoplasmic condensation. Changes at the nuclear level are also evident, including the condensation and fragmentation of nuclear chromosomal DNA. By contrast, necrosis results from acute cellular damage or damage to an essential cellular system and is morphologi-cally defined by early plasma membrane rupture and dilatation of organelles. MMP loss can be associated with a variety of forms of cell injury and death.
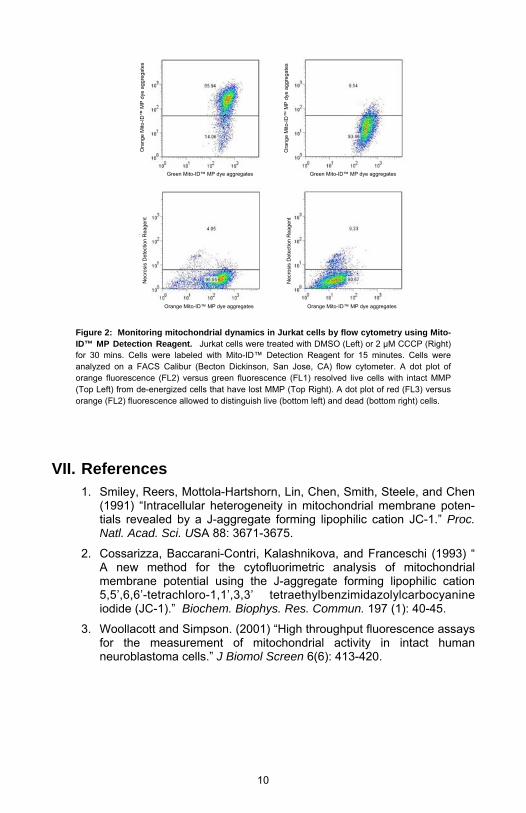
Typical results of flow cytometry-based analysis of cell populations using the Mito-ID® Membrane Potential Detection Kit are shown in Figure 2. The aggregated orange form of the Mito-ID® MP Detection Reagent has an emission maximum of 590 nm, while the green monomeric form has emission maximum of 525 nm, allowing 2-D flow cytometric analysis. Control cells show a high number of cells that display both orange and green fluorescence (Figure 2A). Treatment of cells with 2 μM CCCP for 4 hours results in a dramatic shift in the fluorescence profile of the cell populations, with most cells displaying high green fluorescence but minimal orange fluorescence (Figure 2B).
9
Uncompensated data
Compensated data for green bleed through into orange channel
Untreated control CCCP treated cells
A
B C
Figure 1: Uncompensated data (top row) compared with compensated data (bottom row). This example demonstrates compensation for the green bleed through into the orange channel.
VII. References 1. Smiley, Reers, Mottola-Hartshorn, Lin, Chen, Smith, Steele, and Chen
(1991) “Intracellular heterogeneity in mitochondrial membrane poten-tials revealed by a J-aggregate forming lipophilic cation JC-1.” Proc. Natl. Acad. Sci. USA 88: 3671-3675.
2. Cossarizza, Baccarani-Contri, Kalashnikova, and Franceschi (1993) “ A new method for the cytofluorimetric analysis of mitochondrial membrane potential using the J-aggregate forming lipophilic cation 5,5’,6,6’-tetrachloro-1,1’,3,3’ tetraethylbenzimidazolylcarbocyanine iodide (JC-1).” Biochem. Biophys. Res. Commun. 197 (1): 40-45.
3. Woollacott and Simpson. (2001) “High throughput fluorescence assays for the measurement of mitochondrial activity in intact human neuroblastoma cells.” J Biomol Screen 6(6): 413-420.
10
Figure 2: Monitoring mitochondrial dynamics in Jurkat cells by flow cytometry using Mito-ID™ MP Detection Reagent. Jurkat cells were treated with DMSO (Left) or 2 μM CCCP (Right) for 30 mins. Cells were labeled with Mito-ID™ Detection Reagent for 15 minutes. Cells were analyzed on a FACS Calibur (Becton Dickinson, San Jose, CA) flow cytometer. A dot plot of orange fluorescence (FL2) versus green fluorescence (FL1) resolved live cells with intact MMP (Top Left) from de-energized cells that have lost MMP (Top Right). A dot plot of red (FL3) versus orange (FL2) fluorescence allowed to distinguish live (bottom left) and dead (bottom right) cells.
Green Mito-ID™ MP dye aggregates Green Mito-ID™ MP dye aggregates
Orange Mito-ID™ MP dye aggregates Orange Mito-ID™ MP dye aggregates
Ora
nge
Mito
-ID™
MP
dye
aggr
egat
es
Ora
nge
Mito
-ID™
MP
dye
aggr
egat
es
Nec
rosi
s D
etec
tion
Rea
gent
Nec
rosi
s D
etec
tion
Rea
gent
11
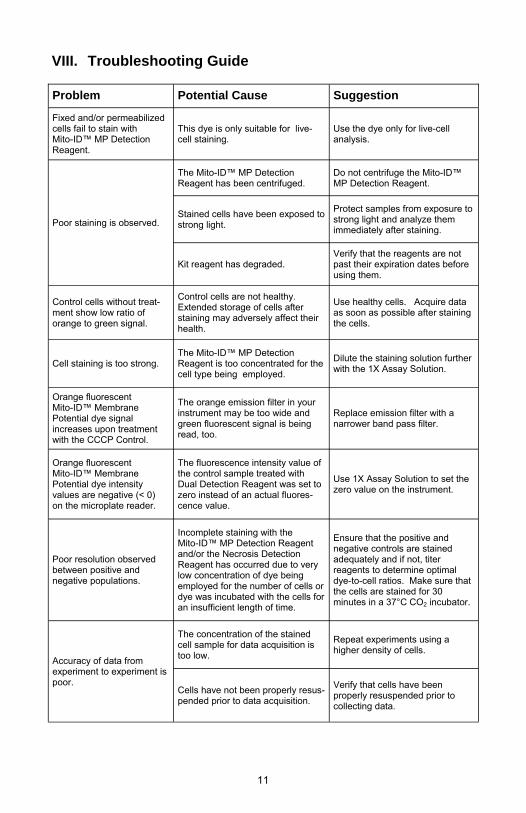
Problem Potential Cause Suggestion
Fixed and/or permeabilized cells fail to stain with Mito-ID™ MP Detection Reagent.
This dye is only suitable for live-cell staining.
Use the dye only for live-cell analysis.
Poor staining is observed.
The Mito-ID™ MP Detection Reagent has been centrifuged.
Do not centrifuge the Mito-ID™ MP Detection Reagent.
Stained cells have been exposed to strong light.
Protect samples from exposure to strong light and analyze them immediately after staining.
Kit reagent has degraded. Verify that the reagents are not past their expiration dates before using them.
Control cells without treat-ment show low ratio of orange to green signal.
Control cells are not healthy. Extended storage of cells after staining may adversely affect their health.
Use healthy cells. Acquire data as soon as possible after staining the cells.
Cell staining is too strong. The Mito-ID™ MP Detection Reagent is too concentrated for the cell type being employed.
Dilute the staining solution further with the 1X Assay Solution.
Orange fluorescent Mito-ID™ Membrane Potential dye signal increases upon treatment with the CCCP Control.
The orange emission filter in your instrument may be too wide and green fluorescent signal is being read, too.
Replace emission filter with a narrower band pass filter.
Orange fluorescent Mito-ID™ Membrane Potential dye intensity values are negative (< 0) on the microplate reader.
The fluorescence intensity value of the control sample treated with Dual Detection Reagent was set to zero instead of an actual fluores-cence value.
Use 1X Assay Solution to set the zero value on the instrument.
Poor resolution observed between positive and negative populations.
Incomplete staining with the Mito-ID™ MP Detection Reagent and/or the Necrosis Detection Reagent has occurred due to very low concentration of dye being employed for the number of cells or dye was incubated with the cells for an insufficient length of time.
Ensure that the positive and negative controls are stained adequately and if not, titer reagents to determine optimal dye-to-cell ratios. Make sure that the cells are stained for 30 minutes in a 37°C CO2 incubator.
The concentration of the stained cell sample for data acquisition is too low.
Repeat experiments using a higher density of cells.
Cells have not been properly resus-pended prior to data acquisition.
Verify that cells have been properly resuspended prior to collecting data.
Accuracy of data from experiment to experiment is poor.
VIII. Troubleshooting Guide


www.enzolifesciences.com
NORTH/SOUTH AMERICA ENZO LIFE SCIENCES INTERNATIONAL, INC. 5120 Butler Pike Plymouth Meeting, PA 19462-1202 USA T 1-800-942-0430/(610) 941-0430 F (610) 941-9252 E [email protected]
GERMANY ENZO LIFE SCIENCES GMBH Marie-Curie-Strasse 8 DE-79539 Lörrach Germany T +49/0 7621 5500 526 Toll Free 0800 664 9518 F +49/0 7621 5500 527 E [email protected] www.enzolifesciences.com
UK & IRELAND ENZO LIFE SCIENCES (UK) LTD. Palatine House Matford Court Exeter EX2 8NL UK T 0845 601 1488 (UK customers) T +44/0 1392 825900 (from overseas) F +44/0 1392 825910 E [email protected] www.enzolifesciences.com www.enzolifesciences.com
SWITZERLAND & REST OF EUROPE ENZO LIFE SCIENCES AG Industriestrasse 17, Postfach CH-4415 Lausen Switzerland T +41/0 61 926 89 89 F +41/0 61 926 89 79 E [email protected] www.enzolifesciences.com
BENELUX ENZO LIFE SCIENCES BVBA Melkerijweg 3 BE-2240 Zandhoven Belgium T +32/0 3 466 04 20 F +32/0 3 466 04 29 E [email protected] www.enzolifesciences.com
FRANCE ENZO LIFE SCIENCES c/o Covalab s.a.s. 13, Avenue Albert Einstein FR -69100 Villeurbanne France T +33 472 440 655 F +33 437 484 239 E [email protected] www.enzolifesciences.com
Enabling Discovery in Life Science®