Embed Size (px)
Citation preview

Mitigation of Disinfection By-Product Formation through Development
of a Multiple Regression Equation and a Bayesian Network
by
Brett Harper
A Thesis
presented to
The University of Guelph
In partial fulfillment of requirements
for the degree of
Master of Science
in
Engineering
Guelph, Ontario, Canada
© Brett Harper, May, 2012
ABSTRACT
MITIGATION OF DISINFECTION BY-PRODUCT FORMATION
THROUGH DEVELOPMENT OF A MULTIPLE REGRESSION EQUATION
AND A BAYESIAN NETWORK
Brett Harper Advisor:
University of Guelph, 2012 Professor Ed McBean
Disinfection By-Product (DBP) formation due to chlorination in drinking water is a
common issue encountered by WTP operators. Efforts to minimize DBP formation
are complicated by the presence of zebra mussels, which may inhabit the raw water
intake of WTPs.
Multivariate models for Total Trihalomethane (TTHM) and Haloacetic Acid (HAA)
subspecies are employed to show that in some instances pre-chlorination can be
reduced to lower DBP formation, while post-chlorination can be increased.
A second regression model for TTHM which includes bromide, a variable which was
previously unused, is described and demonstrates that DBP levels can be reduced by
lowering pre-chlorination levels.
Finally, a Bayesian network is developed using the Webweavr-IV Toolkit, utilizing
causal relationships between raw water quality parameters in the form of conditional
probabilities.
The results show that the average cancer risk can be decreased by while still
maintaining zebra mussel control and simultaneously decreasing the incremental
cancer risk.

iii
Acknowledgements
The author wishes to thank Ed McBean, Professor of Engineering at the University of
Guelph and Canada Research Chair in Water Supply Security, for his guidance,
support and ruthless editing throughout this study. The author is also grateful to Erica
Hamilton of the Ontario Ministry of the Environment (MOE), who provided useful
data for the project. The author is also thankful for the comprehensive database
supplied by the Drinking Water Surveillance Program (DWSP), which supplied the
majority of the data for the project.
The author would also like to thank Yang Xiang, who supplied the Bayesian Network
Software, Webweavr IV, and finally Zoe Zhu, my co-advisor and Adjunct Professor
at the University of Guelph, for her kind guidance, support, and technical help.

iv
Table of Contents
Chapter 1 .............................................................................................................................. 1
Introduction .......................................................................................................................... 1
1.1 Occurrence of Disinfection By-Products (DBPs) in Drinking Water ........................... 1
1.2 Health Effects of Human Exposure to DBPs ............................................................. 3
1.3 Zebra Mussels ........................................................................................................ 4
1.4 Multiple Regression Models for DBPs ..................................................................... 5
1.5 The Bromide Ion ..................................................................................................... 6
1.6 Bayesian Network Models for TTHMs ..................................................................... 6
1.7 Purpose of this Study .............................................................................................. 7
Chapter 2 .............................................................................................................................. 9
Paper #1: Attaining Zebra Mussel Control and Mitigating Disinfection By-Product Formation
in Drinking Water Treatment ................................................................................................. 9
Chapter 3 ............................................................................................................................ 38
Paper #2: Mitigation of Disinfection By-Product Formation by the Development of a
Regression Equation with the Bromide Ion .......................................................................... 38
Chapter 4 ............................................................................................................................ 61
Paper #3: Modelling and Mitigation of Disinfection By-Product Formation through the
Development of a Bayesian Network ................................................................................... 61
Chapter 5 ............................................................................................................................ 83
Conclusions ........................................................................................................................ 83
5.1 Summary ............................................................................................................. 83
5.2 Recommendations ............................................................................................... 85
References .......................................................................................................................... 87
List of Tables
Table 1: The health effects related to the major DBPs (modified from US EPA 1999a) .......... 3
Table 2: Current WHO Guidelines for DBPs in Drinking Water ............................................ 4
Paper #1: Attaining Zebra Mussel Control and Mitigating Disinfection By-Product Formation
in Drinking Water Treatment
Table 1: The health effects related to the major DBPs (modified from US EPA 1999).......... 12
Table 2: Average Concentrations of TTHMs in DWSP – Monitored Surface Water Systems in
Ontario ................................................................................................................................ 15

v
Table 3: The significance of multivariate regression ............................................................ 17
Table 4: Datasets from Kenora water treatment plant before treatment strategies applied ..... 21
Table 5: Datasets from Kenora water treatment plant after treatment strategies applied ........ 22
Table 6: Slope factor for each subspecies and average slope factor for TTHM ..................... 23
Table 7: Cancer risk level of surface water drinking sources of TTHMs in Ontario WTPs.... 26
Table 8: Average Carcinogenic Risks from HAA and TTHM subspecies ............................. 30
Table 9: Average Carcinogenic Risks from TTHM and Sum of Trihalomethane Subspecies 31
Table 10: Reduction of TTHM Cancer Risk, Relative to Current Scenario ........................... 32
Paper #2: Mitigation of Disinfection By-Product Formation by the Development of a
Regression Equation with the Bromide Ion
Table 1: The health effects related to the major DBPs (modified from USEPA 1998) .......... 40
Table 2: Slope factor for each TTHM subspecies ................................................................. 42
Table 3: Non Compliance for TTHM at various specified levels in all WTPs which report
TTHM ................................................................................................................................ 46
Table 4: The significance of multivariate regression for Equation 2 ..................................... 49
Paper #3: Modelling and Mitigation of Disinfection By-Product Formation through the
Development of a Bayesian Network
Table 1: The health effects related to the major DBPs (modified from USEPA 1999) .......... 63
Table 2: Raw Water Quality Parameter Assigned Ranges .................................................... 69
Table 3: Bayesian Network Results ..................................................................................... 73
Table 4: Comparison of Current, Average Conditions with the Four Scenarios .................... 74
List of Figures
Paper #1: Attaining Zebra Mussel Control and Mitigating Disinfection By-Product Formation
in Drinking Water Treatment
Figure 1: Measured TTHM vs. Predicted TTHM for Calibration Dataset ............................. 18
Figure 2: Measured TTHM vs. Predicted TTHM for 2004 ................................................... 18
Figure 3: Seasonality of TTHM formation ........................................................................... 20
Paper #2: Mitigation of Disinfection By-Product Formation by the Development of a
Regression Equation with the Bromide Ion
Figure 1: Sum of Trihalomethane Subspecies in Ontario WTPs ........................................... 56

vi
Figure 2: Subspecies formation based on bromide ion concentration (From Health Canada,
1995) .................................................................................................................................. 57
Figure 3: Percent speciation of TTHM subspecies given bromide concentrations in raw
drinking water ..................................................................................................................... 57
Figure 4: Cancer Risk for TTHM Concentration of 20µg/L Given Bromide Concentration in
Raw Water .......................................................................................................................... 58
Figure 5: TTHM Concentration when Bromide Concentration in Raw Water is Known ....... 58
Figure 6: Measured TTHM vs. Predicted TTHM from Equation 2 ....................................... 59
Figure 7: Measured TTHM vs. Predicted TTHM for Equations 1 and 2 ............................... 59
Figure 8: TTHM Cancer Risk with Altered Pre-Chlorination Dosage ................................... 60
Paper #3: Modelling and Mitigation of Disinfection By-Product Formation through the
Development of a Bayesian Network
Figure 1: Bayesian Network to Determine TTHM levels and Resulting Cancer Risk ............ 82

1
Chapter 1
Introduction
1.1 Occurrence of Disinfection By-Products (DBPs) in Drinking
Water
Utilization of chlorine at the beginning of the 20th century was likely the most
important beneficial action to safeguard human health. Prior to chlorination,
waterborne diseases were widely prevalent (e.g. the cholera outbreak in Chicago in
the 1800‟s) and were a major cause of death. Chlorine and its compounds continue as
the most commonly used disinfectant for water treatment facilities. The popularity of
chlorine is not only due to its low cost, but also to its high oxidizing potential, which
provides a chlorine residual throughout the distribution system and protects against
microbial recontamination (Sadiq and Rodriguez 2003). However in the 1970s, it was
discovered that chlorine used during water treatment reacts with organic matter, such
as humic and fulvic acids, and produces disinfection by-products (DBPs).
DBPs, unlike pathogens such as E.coli, do not display immediate health effects on
those that are exposed to them. DBPs, some of which are carcinogens, cause illness in
people over a lifetime, which makes it harder to quantify the risk they present to the
public, and more difficult to stress to governing bodies the need to regulate these
contaminants.
Haloacetic acids and trihalomethanes are the two major groups of chlorinated
disinfection by-products found in drinking water and generally, are at the highest
levels. Together, these two groups can be used as indicators for the presence of all

2
chlorinated disinfection by-products in drinking water supplies, and their control is
expected to reduce the levels of all chlorinated disinfection by-products and the
corresponding risks to health. This thesis will largely focus on THMs, but will address
HAAs as well.
Total Trihalomethanes (TTHMs) are by-products created when the chlorine used in
the water treatment plant (WTP) disinfection process reacts with naturally occurring
organics (e.g. organics formed by the decay of algae and vegetation) in raw water. In
addition to chlorination, TTHMs are known to also be influenced by temperature,
bromide, and the concentration of the dissolved organic carbon in the water (Health
Canada, 2006). The most common forms of trihalomethanes created are chloroform,
bromodichloromethane (BDCM), chlorodibromomethane (CDBM) and Bromoform
(Harper et al., 2012). Some trihalomethanes are volatile, though inhalation of
trihalomethanes due to volatilization is negligible when compared to consumption
rates through drinking water (WHO, 2011). While not all trihalomethanes can be
absorbed, chloroform can be absorbed through the skin, and contributes a significant
amount of the THM exposure that swimmers experience (New Hampshire DES,
2006).
Haloacetic Acids are by-products that are also created when chlorine used in water
treatment plant (WTP) disinfection processes react with naturally occurring organics.
In treated surface waters, Haloacetic acid concentrations are typically higher than
those found in treated ground water; which is due to the higher levels of organic
matter in surface waters. In general, HAA concentrations will also be higher in
warmer months because of higher concentrations of organic matter and, more

3
importantly, because DBP formation rates increase at higher temperatures. Due to the
fact that HAAs are not volatile, and cannot be absorbed by the skin, exposure through
routes other than consumption is considered negligible.
Currently, attempts to reduce exposure to THMs and HAAs are generally focused on
reducing their formation. Disinfection By-Product concentrations in drinking water
can be reduced at WTPs by removing the organic matter from the water before
chlorine is added, by optimizing the disinfection process, by using alternative
disinfection methods or by using a different water source. However, it is very
important that the method used to mitigate DBP formation does not interfere with the
effectiveness of the disinfection. This thesis will address the mitigation of DBP
formation by optimizing the disinfection process.
1.2 Health Effects of Human Exposure to DBPs
Through considerable efforts within epidemiological and toxicological studies, it has
been reported that there are potential adverse effects from exposure to some of the
DBPs. Table 1 summarizes the harmful effects of some of the important DBPs.
Table 1: The health effects related to the major DBPs (modified from US EPA 1999a)
Class of DBPs Compound Potential Health Effects
Total
Trihalomethanes
Chloroform Cancer, liver, kidney and
reproductive effects
Dibromochloromethane Nervous system, liver, kidney and
reproductive effects
Bromodichloromethane Cancer, liver, kidney and
reproductive effects
Bromoform Cancer, nervous system, liver and
kidney effects
Haloacetic acids Dichloracetic acid Cancer, reproductive, developmental
effects
Trichloracetic acid Liver, kidney, spleen, developmental
effects

4
These health risks have prompted several countries to establish maximum acceptable
concentration levels of DBPs, in particular Trihalomethanes (THMs) and Haloacetic
acids (HAAs) in treated drinking waters. In 2011, the World Health Organization
published drinking water quality guidelines for several DBPs including THMs and
HAAs, which establish a foundation for the countries around the world to promulgate
their regulations on these chemicals. Table 2 summarizes standards/guidelines related
to DBPs that are currently endorsed by the WHO. It is noted that these guidelines are
for all nations and that it is recommended that DBP levels in drinking water be kept as
low as practicable. Developed nations typically impose more stringent guidelines on
DBPs.
Table 2: Current WHO Guidelines for DBPs in Drinking Water
Class of DBPs Compound WHO Guideline (µg/L)
Total Trihalomethanes Chloroform 300
Dibromochloromethane 100
Bromodichloromethane 60
Bromoform 100
Haloacetic acids Dichloracetic acid 50
Trichloracetic acid 200
The current standards for TTHMs and HAAs set by Health Canada are 100µg/L and
80µg/L, respectively (Health Canada 2006). By comparison, the US EPA has set their
standards at 80µg/L and 60µg/L for TTHMs and HAAs respectively (US EPA, 1999).
1.3 Zebra Mussels
Zebra mussels (Dreissena polymorpha) are a class of mollusc similar to oysters,
clams, and scallops, which originated in the Black and Caspian seas and have been
inadvertently transported into the Great Lakes water by cargo ships. The mussels
grow to 1 inch in length and produce 35,000 eggs per season per female (Dermott et
al. 1993). The proliferation of zebra mussels is causing serious problems by clogging

5
raw-water intakes and discharge lines, increasing pipe corrosion, and producing
massive bio-fouling. As a result, zebra mussels are a recent problem for surface water
treatment facilities in parts of the US and Canada, particularly along the western
shores of Lake Erie. In response, most of these water treatment facilities chlorinate
their source water to control zebra mussels in the intake. As a consideration, options
which would involve timed dosages to control zebra mussels, and not pre-chlorinating
when not needed, would have favourable benefits in terms of reducing the formation
of disinfection by-products. This thesis evaluates several strategies to accomplish
lesser formation rates of the disinfection by-products while still controlling zebra
mussels.
1.4 Multiple Regression Models for DBPs
Of interest is to use multivariate regression analyses to develop predictive models for
DBP formation by relating DBP concentrations to various combinations of
explanatory variables, which include: chlorine, dissolved organic matter, pH,
temperature and bromide. When a validated model is derived, it can be used to
identify the significance of diverse operational and water quality parameters which
control or reduce DBP formation. For example, treatment plant operators can lower
DBP formation by reducing unnecessary chlorine dosages, while maintaining enough
residues to fight microbes.
McBean et al. (2008) and Harper et al. (2012) have developed regression equations to
model formation of TTHM concentrations in drinking water. However, these papers
did not include bromide in the regression equation because bromide data over a four
year period (2005-2008) have only recently been released by the DWSP.

6
1.5 The Bromide Ion
Health Canada has listed the bromide ion as one of the contributing factors in the
formation of TTHM (Health Canada, 1995). Until recently, however, only very
limited bromide data have been available; of interest is the structure of regression
models in response to the addition of the bromide ion.
Brominated subspecies have been shown to have significantly higher health effects
compared to non-brominated subspecies. A number of researchers (Morrow, 1987;
Chang, 2001; Kampioti, 2002; Uyak, 2007; Wang, 2007; and Sun, 2009) have
reported that speciation shifted to the bromine-substituted THMs as a function of
bromide concentration when all other parameters were held constant. Under
conditions of high natural organic matter (NOM) and low bromide concentrations,
chlorine-substituted by-products predominated, especially during longer reaction
times. In the presence of chlorine and organic material, as much as 50% of the
bromide ion may become incorporated into the brominated trihalomethane subspecies
(Chang et al., 2001); this efficiency of bromide incorporation implies that 100 µg/L of
bromide may result in up to 50 µg/L of THM-bound bromine (THM-Br). A reduction
in bromide concentration will have a significant impact on the concentration and
speciation of formed TTHM.
1.6 Bayesian Network Models for TTHMs
Chapter 4 employs a Bayesian network to predict TTHM concentration level by
utilizing causal relationships between raw water quality parameters and TTHMs, and
causal relationships between the water quality parameters.

7
Bayesian networks are a type of intelligent system that represents domain knowledge
with a graphical structure that uses nodes to represent variables and arcs between the
nodes to represent dependencies between variables. A Bayesian network quantifies
this knowledge structure with probabilistic expressions of the interaction among
variables. Since probabilities are logical ways to quantify the unknown, Bayesian
networks are ideal intelligent systems. Bayesian networks also possess the unique
ability to incorporate expert estimates, as well as observed evidence, which allows
them to unite different kinds of uncertainty in a single theoretical environment (Olson
et al, 1990; van der Gaag, 1996).
The WebWeavr IV Toolkit will be employed to model a Bayesian network that
utilizes the concentration levels of raw water parameters to predict concentration
levels of TTHM.
1.7 Purpose of this Study
The following primary study objectives are addressed in this thesis:
1) A regression equation is developed to model the formation of two known
DBPs: Total Trihalomethanes (TTHMs) and Haloacetic Acids (HAAs), in
treated Ontario drinking waters.
2) Zebra mussels are identified as an obstacle to optimizing the disinfection
process. The weaknesses of Zebra mussels are examined and exploited in
Chapter 2.

8
3) The seasonality of TTHM formation is examined to determine the most
effective times to combat zebra mussels with pre-chlorination.
4) Bromide is identified as a contributor to TTHM levels, and bromide data are
used along with other raw water quality parameters in the development of a
regression equation model to characterize the formation of TTHMs.
5) The contribution of bromide to the subspecies of total trihalomethanes
(TTHM) is examined. Bromide compounds have been demonstrated to
contribute to a large percentage of TTHM as bromide concentrations increase.
This is problematic since cancer slope factors for bromide compounds are ten-
fold higher than chloroform, meaning the potential cancer rates when bromide
is present, are greatly increased.
6) Current cancer risks from Trihalomethanes in treated Ontario drinking waters
are calculated and compared to current allowable Trihalomethane levels as
well as the „de minimus‟ risk.
7) A Bayesian network is developed using the Webweavr-IV Toolkit, utilizing
causal relationships between raw water quality parameters in the form of
conditional probabilities to predict TTHM levels and cancer risk.

9
Chapter 2
Paper #1: Attaining Zebra Mussel Control and Mitigating
Disinfection By-Product Formation in Drinking Water
Treatment Brett Harper, E. McBean and Zoe J. Y. Zhu

10
Abstract
A complicating factor to reduce disinfection by-product (DBP) formation arising from
chlorination for drinking water treatment systems using surface water as a supply
source, may be the presence of large populations of zebra mussels. Many treatment
facilities control zebra mussels via chlorination of the water to elevated levels at the
intake. The chlorine acts as an anti-foulant, but this approach increases the DBP
formation.
Methods for reducing DBPs are explored, including adjusting the location for chlorine
additions in the treatment sequence. Multivariate models for Total Trihalomethane
(TTHM) and Haloacetic Acid (HAA) subspecies are employed to show that pre-
chlorination can be reduced, and post-chlorination increases. Regression models (R2
of 0.75) predict that DBP levels can be lowered by post-chlorination rather than
chlorinating raw water for portions of the year except during the combatable life stage
for zebra mussel control. The current TTHM incremental cancer risks in Ontario are
demonstrated as higher than „de minimus‟ risk, and range from 1 in 50,000 to
100,000. The results show that the current incremental excess lifetime cancer risk can
be decreased by approximately 24 percent while still maintaining zebra mussel
control and simultaneously decreasing the incremental cancer risk.
Keywords: disinfection by-products (DBPs), Trihalomethanes (TTHM), Haloacetic
acids (HAA), Organic matter, Chlorine, Multivariate regression

11
1.0 Introduction
1.1 An Overview of Disinfection By-Products in Drinking Water and the
Zebra Mussel Problem
Utilization of chlorine at the beginning of the 20th century was likely the most
important beneficial action ever undertaken to safeguard human health. Prior to
chlorination, waterborne diseases were widely prevalent (e.g. the cholera outbreak in
Chicago in the 1800‟s) and were a major cause of death. Chlorine and its compounds
are the most commonly used disinfectants by water treatment facilities. The
popularity of chlorine is due to the combination of low cost, high oxidizing potential,
and the chlorine residual which exists throughout the distribution system and protects
against microbial recontamination (Sadiq and Rodriguez 2003). However in the
1970s, it was discovered that chlorine used during water treatment reacts with organic
matter, such as humic and fulvic acids, and produces carcinogenic by-products. Given
this, there is merit in reducing the formation of these by-products, as feasible, which
may include post-chlorination of treated water as opposed to pre-chlorination of raw
water, since organic matter levels are much lower in treated water. Nevertheless, there
may exist additional issues which counter the potential to post-chlorinate rather than
pre-chlorinate. One of these issues is zebra mussels (Dreissena polymorpha), a class
of mollusc similar to oysters, clams, and scallops, which originated in the Black and
Caspian seas and have been inadvertently transported into the Great Lakes water by
cargo ships. The mussels grow to 1 inch in length and produce 35,000 eggs per season
per female (Dermott et al. 1993). The proliferation of zebra mussels is causing serious
problems by clogging raw-water intakes and discharge lines, increasing pipe
corrosion, and producing massive bio-fouling. As a result, zebra mussels are a recent

12
problem for surface water treatment facilities in parts of the US and Canada,
particularly along the western shores of Lake Erie. In response, most of these water
treatment facilities chlorinate their source water to control zebra mussels in the intake.
As a consideration, options which would involve timed dosages to control zebra
mussels, and not pre-chlorinating when not needed, would have favourable benefits in
terms of reducing the formation of disinfection by-products. This paper evaluates
several strategies to accomplish lesser formation rates of the disinfection by-products
while still controlling zebra mussels.
2.0 Literature Review and Background
2.1 Known Health Effects of DBPs
Table 1 below outlines the known health effects associated with different classes of
DBPs.
Table 1: The health effects related to the major DBPs (modified from US EPA 1999)
Class of DBPs Compound Potential Health Effects
Total Trihalomethanes Chloroform Cancer, liver, kidney and reproductive effects
Dibromochloromethane Nervous system, liver, kidney and reproductive effects
Bromodichloromethane Cancer, liver, kidney and reproductive effects
Bromoform Cancer, nervous system, liver and kidney effects
Haloacetic acids Dichloracetic acid Cancer, reproductive, developmental effects
Trichloracetic acid Liver, kidney, spleen, developmental effects
Inorganic compounds Bromate Cancer
Chlorite Developmental and reproductive effects

13
The current standards for Total Trihalomethanes (TTHMs) and Haloacetic acids
(HAAs) set by Health Canada are 100µg/L and 80µg/L, respectively (Health Canada
2006). By comparison, the US Environmental Protection Agency (USEPA) has set
their standards at 80µg/L and 60µg/L for TTHMs and HAAs respectively (USEPA,
1999).
2.2 Research on chlorination and zebra mussels control
Verween et al. (2009) have shown that chlorination is an effective tool for eliminating
zebra mussels. One strategy to control zebra mussels is “Continuous Treatment”,
where chlorine is applied consistently to the water at concentrations around 2 mg/L at
the intake. This is very effective at killing all biological life in the water. It does,
however, produce the greatest levels of DBPs. It is likely that if Ontario WTPs
employ zebra mussel control, that this is the method that is most commonly used; and
is used year-round.
Alternatively, zebra mussels can be controlled by killing the adult mussels by either
intermittent treatment, or periodic control chlorination (Klerks et al. 1993).
“Intermittent Treatment” includes killing the larvae before they settle and change into
their more-resilient juvenile forms. Sprecher et al. (2000) demonstrate that
chlorinating for 30 minutes every 12 hours is effective in controlling veliger (zebra
mussel larvae) populations and preventing new zebra mussels from settling; however,
this approach is not effective at killing established adult zebra mussels. By
chlorinating heavily for 2-3 weeks in late spring/early summer, the established adults
can be killed. At this point, intermittent treatment can be used to kill the young zebra
mussels looking to “settle”.

14
It has been demonstrated that chlorination rates can be altered by incorporating
knowledge of the changing seasonal tolerances of zebra mussels (Costa et al., 2008).
A promising alternative to continuous treatment is “Periodic Treatment”, which
involves chlorinating “on” and “off” during the year. This treatment usually consists
of three treatment applications spread across the months of April to October. Each
treatment gives a dose of chlorine between 0.5 and 2 mg/L and lasts for 2-4 weeks.
Costa et al. showed that in one experiment, a dose of 0.3 mg/L was applied in 3 sets
of 2-3 week periods, resulting in a 95% mortality rate for zebra mussels.
3.0 Study Area and Approach
3.1 Multivariate Regression
Predictive multivariate regression models for DBPs were developed based on field-
data obtained from across Ontario, from 2000 to 2003. The data are from 25 water
treatment plants (WTPs), and include both raw water and treated water measurements
from these facilities. The models are validated using data from 2004 in the same area
to assess their predictive ability of DBP formation. With a validated model, the
significance of diverse operational and water quality parameters which control or
reduce DBP formation can be identified. For example, treatment plant operators can
lower DBP formation by reducing chlorine dosages, while maintaining sufficient
residuals for disinfection.
3.2 Ontario Drinking Water Surveillance Program (DWSP)

15
The DWSP is a scientifically-based water monitoring program which examines
drinking water quality with a focus on non-regulated drinking water quality
parameters, and possible new contaminants.
3.3 Current TTHM Lifetime Carcinogenic Risk
Over a four year period (2004-2007), 130 WTPs that participated in the DWSP were
analyzed for total THMs as well as four total THM subspecies: Bromoform,
Chlorodibromomethane (CDBM), Bromodichloromethane (BDCM), and Chloroform.
Data from 2004-2007 were taken in lieu of data from 2000-2003 because chlorine
dosage data (which is not readily available after 2004) was not required for this
particular analysis. Only data from surface water sources were employed herein
because zebra mussels are only present in surface source waters. The censored data
present in the dataset which was at, and below, the detection limits, (~15%) was
removed from the dataset, entirely. It is noted that censored data was not removed
from bromoform as it was highly censored (~97%). Shown in Table 2 are the average
concentrations calculated for the THM subspecies and total THMs from the datasets.
Table 2: Average Concentrations of TTHMs in DWSP – Monitored Surface Water Systems in
Ontario
Measured Concentration (µg/L)
Contaminant Surface Water Sources
Bromoform 0.7
Chloroform 25.8
BDCM 4.0
CDBM 2.6

16
TTHMs 33.1
As per Table 2, TTHM levels for surface water treatment plants fall well under the
guideline of 80µg/L, on average. However, about 20% of TTHMs are over 50 µg/L
and about 5% are over 80µg/L. Table 2 shows that chloroform represents the majority
(78%) of the total THMs for surface drinking water sources.
3.4 Derivation of the predictive equation and validation thereof
Using the multivariate regression method, datasets for 2000–2003 were used to derive
the predictive equation. In order to improve the quality of the dataset, data that were
outliers in the dataset were removed; the residual (є) between measured values versus
predicted values was restricted such that TTHMs were set as the predictive variable
and many potential dependant variables were analyzed using multivariate regression.
Through trial-and-error, a number of statistically significant dependent variables were
identified. These variables proved to be: pre-chlorination dose (PreCl2), post-
chlorination dose (PostCl2), treated temperature (Treated Temp), dissolved organic
carbon in raw water (DOCR) and dissolved organic carbon in treated water (DOCT).
A statistically significant non-linear model relating these variables was obtained and
is shown in Equation 1 below.
TTHM = 100.825
*(PreCl2)0.238
*(PostCl2)-0.099
*(TreatedTemp)0.225
*(DOCR)0.362
*(DOCT)0.585
(1)

17
Where n=206 and R2 = 0.60
The negative power value for PostCl2 suggests that post chlorination will lower the
DBPs; however, it is noted that this negative power is derived from a dataset with a
total chlorination such that pre- and post- total attain acceptable levels (approximately
3 mg/L).
Table 3 lists the „p‟ values that indicate the statistical significance of the
corresponding variables. Any variable that exhibited a p value of 0.05 or less was
deemed statistically significant, which indicates that all the noted constituents,
dissolved organic carbon in raw (DOCR) and treated water (DOCT), pre-chlorine
dose (PreCl2), post-chlorine dose (PostCl2), and temperature (Temp) are statistically
significant in this application.
Table 3: The significance of multivariate regression
Figure 1 shows how the predicted TTHM values for the calibration dataset compare
favourably with the measured TTHM values.
Coefficients Standard
Error
t Stat P-value Lower95% Upper
95%
Intercept 0.824 0.0512 16.1 5.31E-38 0.724 0.925
PreCl2 0.238 0.0283 8.41 7.68E-15 0.182 0.294
PostCl2 9.89E-02 0.0319 -3.10 2.21E-03 -0.162 -3.60E-02
Temperature 0.225 0.0235 9.57 4.29E-18 0.179 0.271
DOC (Raw) 0.362 0.0496 7.29 7.16E-12 0.264 0.460
DOC(Treated) 0.585 0.0755 7.75 4.67E-13 0.436 0.733

18
Figure 1: Measured TTHM vs. Predicted TTHM for Calibration Dataset
The dataset from 2004 was used to validate the predictive equation. Figure 2 shows
how the predicted TTHM values for 2004 compare favourably with the measured
TTHM values.
Figure 2: Measured TTHM vs. Predicted TTHM for 2004
y = 1.0542x R² = 0.6078
0.00
20.00
40.00
60.00
80.00
100.00
120.00
140.00
0.00 20.00 40.00 60.00 80.00 100.00
Mea
sure
d T
THM
µg/L
Predicted TTHM µg/L
Measured TTHM vs. Predicted TTHM for Calibration Dataset
y = 1.0189x R² = 0.7507
0
10
20
30
40
50
60
70
80
90
100
0 20 40 60 80 100
Mea
sure
d T
THM
µg/L
Predicted TTHM µg/L
Measured TTHM vs. Predicted TTHM for 2004

19
From Figure 2, the predicted TTHM values for 2004 using Equation 1 were graphed
against the measured TTHM values, and the R-Squared value was calculated from the
line of best fit, 75%, validating the regression model.
3.5 The seasonal impact on zebra mussel control
To effectively control zebra mussels using chlorination, the seasonal variation of
zebra mussel susceptibility to chlorination patterns must be considered. According to
experiments by Bryant et al. (1985), Heinonen (2001), Rajagopal et al. (2002a), and
Costa et al. (2008), the high susceptibility of zebra mussels to chlorine is observed in
the U.S. to some extent in June and peaks in July and August, after reproduction
because of their low body weight, high filtration activity and the high water
temperatures. However, given Ontario‟s very long, cold winters and short summers,
the peaks of susceptibility move to between August and September as evident in
Figure 3 which shows the yearly profile of TTHMs and subspecies, where it is evident
that TTHMs peak between August and September. Hence, when zebra mussels are
most susceptible to chlorine, and thus August and September represent the optimal
period to pre-chlorinate to reduce zebra mussel levels.
As demonstrated by the regression equation, as well as historical records, TTHM
concentrations fluctuate as temperature changes. In other portions of the year,
however, zebra mussels are not as susceptible to chlorine and pre-chlorination may be
lowered as a means of reducing TTHM formation.

20
Figure 3: Seasonality of TTHM formation
As seen in Figure 3, there is a strong correlation between increasing temperature and
increasing chloroform and TTHM concentrations; the correlation is not as strong
between the other trihalomethane subspecies and temperature. Temperature has an
effect on TTHM formation, because it increases the reaction kinetics. As well, it is
noted that the raw DOC levels remain relatively constant indicating that raw DOC is
not responsible for peaks in TTHMs.
0
4
8
12
16
20
0
5
10
15
20
25
30
35
40
Jan Feb Mar Apr May Jun Jul Aug Sep Oct Nov Dec
Tem
pe
ratu
re (°
C)
Co
nce
ntr
atio
n (µ
g/L)
Month
Seasonality of TTHM Formation for All Sites 2004-2007
Bromodichloromethane Chlorodibromomethane
TTHM Chloroform
Raw DOC Temperature

21
Given the above evidence, consideration of both zebra mussel control and treatment
strategies is feasible.
Consider as an example, Kenora‟s water treatment facility which currently operates
with one or two pre-chlorine applications in the fall (August and September), when
the temperature is high (above 20oC). However, this causes DBP formation due to the
high level of resulting mussel fouling increasing the organic matter in the raw water.
Table 4 shows some selected water quality parameters before the control and
treatment strategies were applied to Kenora‟s water treatment plant. As seen in Table
4, both HAAs and TTHM levels are over the MCL, 80µg/L, and 100µg/L respectively
for individual months at Kenora. Consequently, placing an emphasis on pre-
chlorination during the spawning season, and shifting the emphasis to post-
chlorination when not in the spawning season represents an opportunity to reduce
DBP formation. Table 5 shows the same selected water quality parameters after the
control and treatment strategies have been undertaken.
Table 4: Datasets from Kenora water treatment plant before treatment strategies applied
Date Flow Pre
Cl2(mg/L)
Post Cl2
(mg/L)
TEMP.
(oC)
HAAs
(µg/L)
TTHM
(µg/L)
Feb-2000 11.5 1.75 1.16 2.9 87.8 57.50
May-2000 11 4.46 1.25 10.3 - 99
Aug-2000 11.2 3.26 2.18 22.5 78.9 126
Nov-2000 8.8 3.61 1.55 5 112 79.5
Feb-2001 11 2.34 1.53 1.9 79.9 57.5
Jun-2001 9.9 4.63 1.8 13.1 - 112
Sept-2001 11.8 4.7 2.21 21.2 94.5 138
Dec-2001 9.2 3.4 2.57 2 198 84.5

22
May-2002 10 2.85 2.64 5.8 - 96
Jun-2002 10.5 3.54 2.62 10.7 - 104
Sept-2002 11.2 5.29 2.97 20.8 163 135
Table 5: Datasets from Kenora water treatment plant after treatment strategies applied
Date Flow Pre
Cl2(mg/L)
Post Cl2
(mg/L)
TEMP.
(oC)
HAAs
(µg/L)
TTHM
(µg/L)
Feb-2006 1.35 2.25 0.9 - 43.5
Jul-2006 2 2.9 24.2 48.1 78
Oct-2006 1.8 2.6 6.3 34 49
Feb-2007 1.3 2.2 2.7 32.2 38.5
May-2007 1.7 2.2 15 - 47
Jul-2007 2.1 2.6 23.2 25.1 75
Oct-2007 2 2.4 10 44.9 59
May-2008 1.5 2.1 5.4 23.1 44.5
Aug-2008 1.6 2.6 21.6 41.7 56
Nov-2008 1.6 2.2 10.3 40.9 49.5
The Brockville water treatment plant and the Toronto R.C. Harris water treatment
plant in Ontario rely on an alternative process to Kenora‟s, for eliminating zebra
mussels. As soon as the temperature exceeds 10oC, pre-chlorination is initiated at a
concentration of 0.5mg/L to 0.8mg/L. This usually starts in the spring and ends in the
fall when the water temperature drops below 10oC. Based on practical experience, this
has been an effective method of eliminating zebra mussels (Richards, 2010).
4.0 Integrated Analysis

23
4.1 Integrated Risk Information System (IRIS)
The USEPA has created the Integrated Risk Information System (IRIS), which is
designed to assess the risks of different chemicals to human health. For carcinogenic
compounds they have established a cancer slope value, which has units of
(mg/kg/day)-1
. They have identified cancer slope values for four trihalomethane
subspecies. The TTHMs identified are BDCM, CDBM, Chloroform and Bromoform,
as listed in Table 5. The cancer slope factors for each subspecies were normalized
using the percentage of total subspecies that each individual subspecies forms on
average, and then these values were summed to calculate their weighted average.
Table 6: Slope factor for each subspecies and average slope factor for TTHM
(1)Cancer Slope Factors taken from IRIS Database
In this research, statistically significant multivariate regression models for the
carcinogenic HAAs and total THMs subspecies were also developed, and are shown
in Equations 2 through 5, below. Other HAA and THM subspecies were not added
due to current lack of measured data.
Compound
Average
Concentration
(µg/L)
% Slope Factor
(1)(mg/kg/day)-1
Weighted Slope
Factor
(mg/kg/day)-1
Average Slope
Factor for
TTHM
(mg/kg/day)-1
Bromodichloromethane 4.0 12 0.062 0.0074
Chlorodibromomethane 2.6 8 0.084 0.0067
Chloroform 25.8 78 0.006 0.0047
Bromoform 0.7 2 0.079 0.0016
Sum 33.1 0.0204

24
HAA
Dichloroacetic acid (DCAA) (HAA):
DCAA = 102.34
* (PreCl2)0.09
*(Raw pH)-2.18
*(DOCR)0.79
*(DOCT)0.46
(2)
N = 329 R2 = 0.61
THM Subspecies
Bromodichloromethane (BDCM):
BDCM = 100.36
*(Treated Temp)0.21
*(DOCR)-0.59
*(DOCT)0.78
(3)
N = 323, R2 = 0.14
Chlorodibromomethane (CDBM):
CDBM = 100.35
*(Treated Temp)0.15
*(DOCR)-0.91
(4)
N = 237 R2 = 0.38
Chloroform:
Chloroform = 101.88
* (PreCl2)0.20
*(PostCl2)0.10
*(Raw pH)-1.88
*
(Treated Temp)0.22
*(DOCR)0.89
*(DOCT)0.70
(5)
N= 326 R2 = 0.76
Where,
PreCl2 = Pre-Chlorine Dose,
PostCl2= Post-Chlorine Dose,

25
Raw pH = pH of Raw Water,
DOCR = Dissolved Organic Carbon in Raw Water,
DOCT = Dissolved Organic Carbon in Treated Water and,
Treated Temp = Temperature of Treated Water.
Once the concentrations of the subspecies were determined by averaging each
subspecies‟ mean monthly concentrations, the cancer risk was calculated using the
cancer slope factor.
Exposure to the compounds, given by the Lifetime Average Daily Dose (LADD) is
defined as:
LADD = (Cw x IR x EFx ED)/(BW x AT)
Where,
Cw = Contaminant Concentration,
IR = Intake Rate,
EF = Exposure Frequency,
ED = Exposure Duration,
BW = Body Weight and,
AT = Averaging Time.

26
Assuming a body weight of 70kg, an intake rate of 2L of water a day (Gleick 1996)
for 365 days per year, a lifespan of 70 years (ED), and an average lifetime of 25,550
days; the consumption of water per mass per day (L/(kg*day)) is:
LADD = Cw x consumption of water per mass per day.
The consumption of water per mass per day is:
0.029L/(kg*day).
The corresponding incremental excess lifetime cancer risk, IECLR, for the
trihalomethane subspecies concentrations listed in Table 2 as shown in Table 7 (Note
there is no cancer slope factor available for TTHMs, and hence the IECLR of TTHMs
is calculated from the sum of the major trihalomethanes).
Table 7: Cancer risk level of surface water drinking sources of TTHMs in Ontario WTPs
Current Situation for Chlorination
Contaminant Excess Cancer Risk (10-6
)
Bromoform 1.6
Chloroform 4.5
BDCM 7.2
CDBM 6.3
Sum of Subspecies 19.6
Table 7 demonstrates that all subspecies and TTHMs currently exist in concentrations
that result in cancer risk levels greater than de minimus risk (one in a million). This is

27
problematic because although the predicted TTHM levels are under current
guidelines, they still yield cancer risks higher than one in a million. To estimate an
approximate TTHM level that would yield a cancer risk less than de minimus risk, a
cancer slope of 0.029 (see Table 2) for TTHMs and for a water consumption of 2L per
day, a TTHM concentration of 1.7µg/L is determined. This finding indicates that
TTHM concentrations would have to be reduced to this level to attain a cancer risk at
de minimus risk.
4.2 Comparison of varying pre- and post-chlorination levels versus the status
quo
Consider six scenarios with varying levels of pre- and post-chlorination in an effort to
mimic alternative approaches to chlorination while also incorporating mussel control.
The results are compared to control values as shown in Table 9. The control value for
predicted TTHMs was found by calculating the average value for each variable in
Equation 1, for each month of the year. The variables being examined were: pre-
chlorination, post-chlorination, raw pH, treated water temperature, raw DOC, and
treated DOC. Using the regression equations, namely Equations 1 to 5, values of
Dichloroacetic acid (DCAA), Bromodichloromethane, Chlorodibromomethane,
Chloroform and TTHM were calculated. The cancer risk was then calculated for each
species for each month of the year. A mean value for each species was also found for
the whole year. The six scenarios are as follows:

28
Scenario 1: pre-chlorination was regular (the same as the control) but post-
chlorination was set to be 0.001mg/L (0.001mg/L had to be used to preserve the
integrity of the model).
Scenario 2: During the months of May, July and September, pre-chlorination was set
to 0.5mg/L and the rest of the year it was set to 0.001mg/L, and post chlorination was
set to 3mg/L throughout the year. This test follows “Intermittent Treatment”
(Sprecher, 2000), where there are three treatments a year of pre-chlorination.
Scenario 3: This was very similar to scenario 2 but adopted a more aggressive
approach to pre-chlorination. Scenario 3 assumed pre-chlorination at a concentration
of 0.75mg/L during the months of April, June, August and October, and during the
rest of the year the pre-chlorination was set to 0.001mg/L. Post-chlorination was set to
3mg/L.
Scenario 4: This test was similar to scenarios 2 and 3, but instead utilized a process
known as “End-of-season treatment” (after Sprecher, 2000). Pre-chlorination was
assumed at a concentration of 0.75mg/L during the months of May and July, and at a
concentration of 3.0mg/L in September. The purpose of the higher dose in September
was to flush out any remaining adult zebra mussels prior to the next season beginning.
Again, the post-chlorination was 3mg/L.

29
Scenario 5: This scenario is quite different from the preceding scenarios. In this
scenario, “Continuous Treatment” was used during the months where the water
temperature exceeded 12oC. During the months of May to November the dose of pre-
chlorine was set to 3mg/L, and set to 0.001mg/L for the remainder of the year. During
the months of May to November the dose of post-chlorine was set to 0.3mg/L, and set
to 3.3mg/L for the remainder of the year. This scenario was designed to be the most
secure test in terms of microbial disinfection and zebra mussel control.
Scenario 6: This test was set up to replicate operation of the City of Brockville‟s
water treatment plant similar to scenario 5 but with lower concentrations of chlorine.
During the months of May to November the pre-chlorination was set to 0.5mg/L, and
set to 0.001mg/L for the remainder of the year. Throughout the year the post-
chlorination was set to 1.25mg/L. This approach has proven to be effective in
Brockville.
Below are three tables which summarize the results of the six chlorination
approaches. Table 8 summarizes the DCAA and THM subspecies concentrations
calculated from Equations 2 through 5, and the corresponding IECLRs for each of the
scenarios.

30
Table 8: Average Carcinogenic Risks from HAA and TTHM subspecies
Dichloroacetic Acid (DCAA)
Bromodichloromethane
(BDCM)
Chlorodibromomethane
(CDBM) Chloroform
Concentration
(µg/L) IECLR
Concentration
(µg/L) IECLR
Concentration
(µg/L) IECLR
Concentration
(µg/L) IECLR
Original 12 5.22E-06 4 7.19E-06 1 2.44E-06 23 4.00E-06
Scenario 1 12 5.22E-06 4 7.19E-06 1 2.44E-06 10 1.74E-06
Scenario 2 8 3.48E-06 4 7.19E-06 1 2.44E-06 8 1.39E-06
Scenario 3 8 3.48E-06 4 7.19E-06 1 2.44E-06 10 1.74E-06
Scenario 4 8 3.48E-06 4 7.19E-06 1 2.44E-06 9 1.57E-06
Scenario 5 10 4.35E-06 4 7.19E-06 1 2.44E-06 12 2.09E-06
Scenario 6 9 3.92E-06 4 7.19E-06 1 2.44E-06 10 1.74E-06
As seen in Table 8, scenarios 2 and 4 are most effective at reducing the subspecies
concentrations as well as the associated cancer risk. It is noteworthy that BDCM and
CDBM are not affected by chlorination dosages. Table 9 displays the known,
measured concentrations of TTHMs for each scenario, and compares these values to
TTHM concentrations calculated from Equation 1, as well as the sum of subspecies
calculated from summing the THM subspecies concentrations from Table 8. The
corresponding IECLR has also been calculated for each concentration value.

31
Table 9: Average Carcinogenic Risks from TTHM and Sum of Trihalomethane Subspecies
Measured
TTHM (µg/L) IECLR
Eq. 1 Predicted TTHM
(µg/L) IECLR
Sum of THM Subspecies
Excluding Bromoform
(Table 7) (µg/L)
IECLR
Original 32 1.89E-05 34 2.01E-05 28 1.36E-05
Scenario 1 32 1.89E-05 75 4.44E-05 15 1.14E-05
Scenario 2 13 7.69E-06 10 5.92E-06 13 1.10E-05
Scenario 3 15 8.87E-06 13 7.69E-05 15 1.14E-05
Scenario 4 15 8.87E-06 12 7.10E-06 14 1.12E-05
Scenario 5 23 1.36E-05 26 1.54E-05 17 1.17E-05
Scenario 6 19 1.12E-05 34 2.01E-05 15 1.14E-05
As seen in Table 9, Scenarios 2 and 4 once again yield the lowest TTHM levels as
well as the lowest corresponding cancer risks. Table 10 displays the percentage
reduction in TTHM concentrations for the TTHM concentrations predicted using
Equation 1, and for the sum of TTHM subspecies calculated from Table 8. The
relative cancer risk for each scenario is also displayed, and has been calculated by
dividing IECLR of each scenario by the IECLR from the original control values.

32
Table 10: Reduction of TTHM Cancer Risk, Relative to Current Scenario
Scenario
Relative Cancer Risk for
Predicted TTHM
Relative Cancer Risk for TTHM
(Sum of Subspecies)
Reduction(2)
% for
Predicted TTHM
Reduction % for TTHM
(Sum of Subspecies)
Original 1 1 0% 0%
Scenario 1 2.21 0.84 -121% 46%
Scenario 2 0.29 0.81 71% 54%
Scenario 3 0.38 0.84 62% 46%
Scenario 4 0.35 0.82 65% 50%
Scenario 5 0.76 0.86 24% 39%
Scenario 6 1 0.84 0% 46%
(2) Relative to Current Water Treatment Scenario
According to the results summarized in Table 10, scenario 2 would cause the greatest
improvement in TTHM formation (71% using Equation 1, and 54% from sum of
subspecies, see line 4 of Table 10). There is concern that although Test 2 is the most
effective in reducing TTHM levels, it may be too lenient in terms of chlorination and
could possibly allow zebra mussel infestation. Stricter, more thorough scenarios such
as 5 and 6 might be more appropriate for zebra mussel removal, while still resulting in
lower levels of TTHMs than current methods.
5.0 Conclusions
1) Regression models for the formation of TTHMs and its subspecies as determined
from 2000 to 2003 data were validated using data from 2004, and shown to be

33
robust. TTHM models can also be used to estimate how TTHM levels could be
reduced, while still continue to provide adequate zebra mussel removal.
2) The regression equation that was developed to predict TTHM concentrations
results in the pre-chlorination variable having a higher exponent than the post-
chlorination variable, indicating that TTHM concentrations are more heavily
influenced by pre-chlorination dosages which indicate reducing the pre-
chlorination dose when feasible, and making up for this reduction by increasing
the post-chlorination dose has merit. This can be accomplished in winter months
as zebra mussels are considerably less active during this time.
3) Cancer risks from TTHMs and its subspecies with current disinfection practices
exceed one in a million. The incremental cancer risk ranged from 1 in 50,000 to
100,000. However, lowering the incremental cancer risk from to 1 in 1,000,000,
would require the average concentration of TTHMs to be 1.7µg/L to reach 1 in
1,000,000.
4) There is a strong correlation between increasing temperature and increasing
chloroform and TTHM concentrations. There is not as strong a correlation
between the other TTHM subspecies and temperature.
5) A strategy for effectively controlling zebra mussels is to use pre-chlorination at
3mg/L when the temperature exceeds 12oC, and a year-round post-chlorination.
This scenario results in a reduction of TTHM formation of 24% and reduces

34
cancer risk by 24%, while maintaining effective disinfection and zebra mussel
removal.
6.0 Acknowledgements
The authors would like to thank the DWSP of Ontario for their contributions in the
data collection phase. This research was funded by the Canada Research Chair
Program.
7.0 References
Berthouex, P. Mac. Statistics for environmental engineers. Boca Raton: Lewis, 1994.
Print.
Costa, A., Aldridge, D. C., Moggridge, G, D. “Seasonal variation of zebra mussel
susceptibility to molluscicidalagnets”, Journal of Applied Ecology, 2008, 45,
1712-1721.
Dermott, R., and Munawar, M., "Invasion of Lake Erie Offshore Sediments by
Dreissena, and Its Ecological Implications." Department of Fisheries and
Oceans, Canada 50(1993): pp 2298-2304.
"Drinking Water Surveillance Program Data Report 2003 and 2004." 21 October
2008. DWSP. 6 Aug 2009
<http://www.ene.gov.on.ca/envision/water/dwsp/0304/>.
Fisher, S. W., Dabrowska, H., Waller, D. L., Babcock-Jackson, L., and Zhang, X.
(1994). “Sensitivity of Zebra Mussel (DreissenaPolymorpha) Life Stages to

35
Candidate Molluscides”. Journal of Shellfish Research, Vol. 13, No. 2, 373-
377.
Fisher, S. W., Dabrowska, H., Waller, D. L., Babcock-Jackson, L., and Zhang, X.
"Sensitivity of Zebra Mussel (DreissenaPolymorpha) Life Stages to Candidate
Molluscicides." Department of Entomology. 13(1994): pp 373-377.
Gleick, P.H., Basic Water Requirements for Human Activities: Meeting Basic Needs.
International, 1996. 21: p. 83-92.
"Guidelines for Canadian Drinking Water Quality - Summary Table." 30 May 2008.
Health Canada. 6 Aug 2009 <http://www.hc-sc.gc.ca/ewh-semt/pubs/water-
eau/sum_guide-res_recom/index-eng.php>.
"Guidelines for Canadian Drinking Water Quality: Guideline Technical Document:
Trihalomethanes." 01 May 2006. Health Canada. 6 Aug 2009 <http://www.hc-
sc.gc.ca/ewh-semt/pubs/water-eau/trihalomethanes/index-eng.php>.
Hamilton, D. J., Ankney, C. D., and Bailey, R. C. 1994. “Predation of Zebra Mussels
by Diving Ducks: An Exclosure Study”. The Ecological Society of America.
Pp 521-531.
Kilgour, B.W., and Mackie., G. L., Colonization of Different Construction Materials
by the Zebra Mussel. Lewis Publishers, 1993.
McBean, E., Zhu, Z., and Zeng, W., "Systems Analysis Models for Disinfection By-
Product Formation in Chlorinated Drinking Water in Ontario." Civil
Engineering and Environmental Systems 25(2008): pp 127-138.
Metcalf, Eddy. Wastewater Engineering. New York: McGraw-Hill College, 2002.
Print.

36
"National Primary Drinking Water Regulations:" 16 December 1998. US EPA. 6 Aug
2009 <http://www.epa.gov/OGWDW/mdbp/dbpfr.html>.
"National Survey of Chlorinated Disinfection By-Products in Canadian Drinking
Water." 12 September 2008. Health Canada. 7 Aug 2009 <http://www.hc-
sc.gc.ca/ewh-semt/pubs/water-eau/byproducts-sousproduits/index-eng.php>.
On, Conference. Water chlorination environmental impact and health effects:
proceedings of the Conference on the Environmental Impact of Water
Chlorination, Oak Ridge National Laboratory, Oak Ridge, Tennessee, October
22-24, 1975. Ann Arbor, Mich: Ann Arbor Science, 1978. Print.
Rajogopal, S., Van der Velde, G., Van der Gaag, M., Jenner, H. A., “How Effective is
Intermittent Chlorination to Control Adult Mussel Fouling in Cooling Water
Systems?”. Water Res.(2003) 37, 329-338.
Ram, J. L., Fong, P. P and Garton, D. W., "Physiological Aspects of Zebra Mussel
Preproduction: Maturation, Spawning, and Fertilization." American Zoologist
36(1996): pp 326-338.
Richards, D. Chief Operator, Brockville Water Treatment. Phone: (613) 342-7819
Sprecher, S., and Getsinger, K. D., "Zebra Mussel Chemical Control Guide." US
Army Corps of Engineers - Environmental Laboratory (2000): 1-116.
Verween ., , Vincx , M., Degraer, S., “Comparative toxicity of chlorine and peracetic
acid in the biofouling control of Mytilopsisleucophaeata and
Dreissenapolymorpha embryos (Mollusca, Bivalvia)”, International
Biodeterioration& Biodegradation, 63 (2009) 523–528.

37
Wang, G-S, Deng, and Lin. "Risk Assessment from Trihalomethanes in Drinking
Water." Science of the Total Environment 387(2007): 86-95.

38
Chapter 3
Paper #2: Mitigation of Disinfection By-Product Formation by
the Development of a Regression Equation with the Bromide Ion Brett Harper, Zoe J. Y. Zhu and E. McBean
Abstract
The contribution of bromide to the subspecies of total trihalomethanes (TTHM)
demonstrates that bromide compounds approach fifty percent of TTHM as bromide
reaches 10 µg/L. This is problematic since cancer slope factors for bromide
compounds are ten-fold higher than chloroform, meaning the potential cancer rates
when bromide is present, are greatly increased.
A multivariate regression model for TTHM (R2 = 0.91) which includes bromide, is
described and demonstrates that water temperature, dissolved organic carbon, pH,
pre-chlorination and raw water bromide levels are statistically significant variables for
prediction of TTHM levels.
Keywords: Disinfection By-Products (DBPs), Trihalomethanes (THMs), Bromide,
Organic matter, Chlorine, Multivariate regression
39
1.0 Introduction
1.1 An Overview of Disinfection By-Products in Drinking Water
Total Trihalomethanes (TTHM) are by-products created when the chlorine used in the
disinfection process reacts with naturally occurring organics (e.g. organics formed by
the decay of algae and vegetation) in raw water. The most common forms of
trihalomethanes created are chloroform, bromodichloromethane (BDCM),
chlorodibromomethane (CDBM) and bromoform and hence the bromide ion is
obviously a contributing factor to the formation of TTHM. While chlorine is added
for water disinfection, the chlorine also causes the formation of TTHM and these by-
products are carcinogens. To decrease the health risk, the Ontario government (and
many others) is considering lowering its guideline from a maximum acceptable
concentration of 100 µg/L to a maximum acceptable concentration of 80 µg/L. Of
interest is the degree to which the bromide ion affects the speciation of the TTHM.
1.2 Related Literature on TTHM formation
McBean et al. (2008) and Harper et al. (2012) have developed regression equations to
model TTHM concentrations in drinking water. However, these papers did not
include bromide in the regression equation because bromide data over a four year
period (2005-2008) have only recently been released by the Ontario-based Drinking
Water Surveillance Program (DWSP). The DWSP is a scientifically-based water
monitoring program which examines drinking water quality with a focus on non-
regulated drinking water quality parameters, and possible new contaminants.

40
2.0 Literature Review and Background
2.1 Known Health Effects of DBPs
Table 1 outlines the known health effects associated with different classes of DBPs.
Table 1: The health effects related to the major DBPs (modified from USEPA 1998)
Class of DBPs Compound Potential Health Effects
Total Trihalomethanes Chloroform Cancer, liver, kidney and reproductive effects
Dibromochloromethane Nervous system, liver, kidney and
reproductive effects
Bromodichloromethane Cancer, liver, kidney and reproductive
effects
Bromoform Cancer, nervous system, liver and kidney
effects
The current standard for TTHM set by Health Canada is 100 µg/L (Health Canada,
2006). By comparison, the US Environmental Protection Agency (USEPA) has set
their standards at 80 µg/L for TTHM (USEPA, 1998).
2.2 Trihalomethane Subspecies vs. TTHM
The DWSP reports TTHM as the sum of trihalomethane subspecies (bromoform,
bromodichloromethane, chlorodibromomethane, and chloroform). Figure 1
demonstrates the average composition of the TTHM subspecies concentrations from
2004-2007. These results were obtained by averaging over all WTP data records for
which bromide data were available, as well as all THM subspecies (119 records
include bromide in raw water, and 123 records include bromide concentrations in
treated water), and calculating the average concentration of each of the THMs.

41
2.3 Bromide Ion
Health Canada has listed the bromide ion as one of the contributing factors in the
formation of TTHM (Health Canada, 1995). Until recently, however, only very
limited bromide data have been available; of interest is the structure of regression
models in response to the addition of the bromide ion.
The TTHM regression model reported in Harper et al. without bromide data, for water
as released to the distribution system.
TTHM =100.825
* (PreCl2)0.238
* (PostCl2)-0.099
* (Temp)0.225
* (DOCR)0.362
*
(DOCT)0.585
(1)
Where n=206 R2 = 0.75
The negative power value for PostCl2 suggests that post chlorination will lower the
DBPs; however, it is noted that this negative power was derived from a dataset with a
total chlorination such that pre- and post- total attain specified levels (approximately 3
mg/L).
Figure 2 illustrates how alternative disinfection by-product subspecies vary in percent
speciation given different bromide concentrations. The data used by Health Canada
was taken from 52 drinking water treatment facilities across Canada, on two
occasions in 1993. Looking specifically at TTHM, when the Bromide ion is < 0.01

42
mg/L, the chloroform concentration is nearly 100% of the TTHM formed (see Figure
2). Chloroform has the lowest cancer slope (0.0061(mg/kg/day)-1
) of the TTHM
subspecies (USEPA, 1998). When the bromide ion reaches 0.5 mg/L the subspecies
form in the following percentages: chloroform 20%, bromodichloromethane 20%,
chlorodibromomethane 25%, bromoform 35%. Considering how the three bromo-
subspecies have cancer slopes that are at least 10-fold greater than chloroform, the
implication is a significant increase in the overall cancer risk when bromide
concentrations are high. Table 2 indicates the cancer slope factor of each THM
subspecies (from USEPA, 1998).
Table 2: Slope factor for each TTHM subspecies
Data from all Ontario WTPs (which recorded bromide data at any point from 2004 –
2007), given bromide concentrations in raw drinking water, are used to illustrate how
TTHM speciation favours chloroform as bromide levels decrease, and are shown in
Figure 3. Concentration data were used for Ontario WTPs (21 surface, 4 ground, 2
mixed) for the years of 2004 – 2007 for bromide, as well as all TTHM subspecies.
The TTHM subspecies concentrations were summed, and the percent speciation of
each TTHM subspecies was calculated by dividing each individual subspecies by the
Compound
Slope Factor
(mg/kg/day)-1
Chloroform 0.006
Chlorodibromomethane 0.084
Bromoform 0.079
Bromodichloromethane 0.062

43
sum. The percent speciation was then graphed against the corresponding bromide
concentration. As seen in Figure 3, when bromide levels are at <5µg/L, chloroform
concentrations exceed 70% of TTHM formed, whereas when bromide levels double to
>10µg/L, the percentage of chloroform drops to approximately 50%. Figure 3
demonstrates that as bromide levels increase, the brominated THM subspecies
(CDBM, BDCM and bromoform) all increase in percent speciation. These findings
differ from those of Health Canada because in the Health Canada study the TTHM
subspecies concentrations were taken from the distribution system, as opposed to the
treated water.
Figure 4 demonstrates how cancer risk is affected when raw water bromide
concentrations increase. For TTHM concentration of 20µg/L, for purposes of
estimation in Figure 4, the percent speciation of TTHM is multiplied by this
concentration to obtain an estimated concentration for each THM subspecies. From
these concentrations, the exposure to each of these compounds, given by the Lifetime
Average Daily Dose (LADD), can be calculated as:
LADD = (Cw x IR x EFx ED)/(BW x AT)
Where,
Cw = Contaminant Concentration,
IR = Intake Rate,
EF = Exposure Frequency,

44
ED = Exposure Duration,
BW = Body Weight and,
AT = Averaging Time.
Assuming a body weight of 70kg, an intake rate of 2L of water a day (Gleick, 1996)
for 365 days per year, a lifespan of 70 years (ED), and an average lifetime of 25,550
days; the consumption of water per mass per day (L/(kg*day)) is:
LADD = Cw x consumption of water per mass per day.
The consumption of water per mass per day is:
0.029L/(kg*day).
The corresponding incremental excess lifetime cancer risk, IECLR, for the
trihalomethane subspecies concentrations is calculated by multiplying the LADD by
the corresponding CSF of each trihalomethane subspecies given in Table 2. The
resulting cancer risks for all trihalomethane subspecies, as well as TTHM, are shown
in Figure 4. As Figure 4 demonstrates, cancer risk roughly doubles when raw water
bromide concentrations are greater than 10µg/L, and increases by 35% when treated
water bromide concentrations are greater than 10µg/L.
When bromine is low, chloroform predominates TTHM, but when bromine is high,
there is both higher bromine-related TTHM and higher TTHM, as demonstrated in

45
Figure 5. This indicates that bromine acts as an additive effect. In addition, the
brominated subspecies have been shown to have significantly higher health effects
compared to non-brominated subspecies. A number of researchers (Morrow, 1987;
Chang, 2001; Kampioti, 2002; Uyak, 2007; Wang, 2007; and Sun, 2009) have
reported that speciation shifted to the bromine-substituted THMs as a function of
bromide concentration when all other parameters were held constant. Under
conditions of high natural organic matter (NOM) and low bromide concentrations,
chlorine-substituted by-products predominated, especially during longer reaction
times. In the presence of chlorine and organic material, as much as 50% of the
bromide ion may become incorporated into the brominated trihalomethane subspecies
(Chang et al., 2001); this efficiency of bromide incorporation implies that 100 µg/L of
bromide may result in up to 50 µg/L of THM-bound bromine (THM-Br). A reduction
in bromide concentration will have a significant impact on the concentration and
speciation of formed TTHM.
3.0 Study Area and Approach
3.1 Water Treatment Plant MCL Compliance
Over a four year period (2005-2008), 130 WTPs that participated in the DWSP were
analyzed to identify frequency for various levels of TTHM. Shown in Table 3 are the
number of records and WTPs that exceeded various levels on any one instance for
monitoring. Four different specified levels were used for this comparison: 100µg/L,
80µg/L, 60µg/L and 1.2µg/L. Regarding 1.2µg/L, Harper et al. (2012) refer to the
concentration level that TTHM would have to attain for the cancer risk to be at „de
minimus‟ (one in a million) cancer risk.

46
Table 3: Non Compliance for TTHM at various specified levels in all WTPs which report TTHM
TTHM 2005 % Pass 2006 % Pass 2007 % Pass 2008 % Pass
Number of Data Records 369
338
339
321
Number of Records Failing Specified Level of 100 µg/L 3 99.19% 2 99.41% 1 99.71% 1 99.69%
Number of Records Failing Specified Level of 80 µg/L 10 97.29% 10 97.04% 9 97.35% 8 97.51%
Number of Records Failing Specified Level of 60 µg/L 40 89.16% 27 92.01% 30 91.15% 26 91.90%
Number of Records Failing Specified Level of 1.2 µg/L 352 4.61% 318 5.92% 316 6.78% 293 8.72%
Number of Plants Reporting TTHM 122
119
116
107
Number of Plants Failing Specified Level of 100ug/L 2 98.36% 2 98.32% 1 99.14% 1 99.07%
Number of Plants Failing Specified Level of 80ug/L 7 94.26% 8 93.28% 9 92.24% 7 93.46%
Number of Plants Failing Specified Level of 60ug/L 21 82.79% 19 84.03% 17 85.34% 16 85.05%
Number of Plants Failing Specified Level of 1.2ug/L 121 0.82% 117 1.68% 115 0.86% 102 4.67%
As apparent in Table 3, TTHM for water treatment plants fall under the specified
level of 100µg/L in nearly every instance. The same holds true for a specified level of
80µg/L. However, if the guideline were to be lowered to 60µg/L about 10% of
records would violate the specified level, and roughly 15% of all WTPs fall into non-
compliance. This number is worsened when a specified level of 1.2µg/L is used. This
demonstrates that lowering the specified level for TTHM from 100µg/L to 80µg/L
would not create large issues, as well as demonstrating that further reducing the MCL
to 60µg/L would not appear likely to cause huge increases exceedance frequency.

47
Notably, there exists a WTP with very high average TTHM (104µg/L, corresponding
cancer risk of 6.15 x 10⁻⁵
). WTPs with very high average TTHM will likely see the
greatest TTHM mitigation, and thus the greatest reduction in cancer risk.
3.2 Multiple Regression Analysis
A multiple regression model was developed to estimate the various disinfection by-
product concentrations in chlorinated drinking waters, using data from six WTPs (five
from surface water sources, one from mixed surface water and groundwater sources)
in Ontario during 2005 to 2008. Only for six treatment plants were all chlorination
dosage data and bromide data available and hence used in the regression analysis.
3.3 Derivation of the predictive equation and validation thereof
Using the multivariate regression method, 2005 – 2008 data were used to derive a
predictive equation for TTHM released to the distribution system. The backward
elimination multivariate regression method (for log-transformed variables) was
employed as follows:
1. Run Microsoft Excel‟s regression analysis, testing all potential variables in the
equation.
2. Check to see if all variable p-values are below 0.05, and if not, remove the
variable with the highest p-value.

48
3. Re-run the regression analysis with all remaining variables.
4. Continue this procedure, removing the variable with the highest p-value and
re-running the regression model, until all remaining variables have a p-value
less than 0.05, at which point, all remaining variables are statistically
significant.
Through trial and error, a number of statistically significant independent variables
were identified. These variables were: dissolved organic carbon in raw water in mg/L
(DOCR), pre-chlorine dosage in mg/L (PreCl2), bromide in raw water in µg/L
(RawBr), temperature of raw water in °C (Raw Temp), and pH of treated water being
released to the distribution system (Treated pH). A statistically significant non-linear
model relating these variables was obtained as per Equation 2.
TTHM = 101.62
* (DOCR)0.663
x (PreCl2)0.653
x (RawBr)0.282
x (Raw Temp)0.173
x
(Treated pH)-1.40
Where n = 26 (2)
Table 4 lists the „p values‟ that indicate the statistical significance of the
corresponding variables. This indicates that all the constituents, intercept, dissolved
organic carbon in raw water (DOCR), pre-chlorine dosage (PreCl2), bromide in raw
water (RawBr), temperature of raw water (Raw Temp), and pH of treated water prior
to being released to the distribution system (Treated pH) are statistically significant in
this application. It should be noted that when the acceptable significance was

49
increased from 0.05 to 0.1, that no new variables entered the equation. Post-
chlorination was tested for statistical significance in place of pre-chlorination and was
determined not to be statistically significant (p=0.88). This implies that if pre-
chlorination were lowered to decrease TTHM, and post-chlorination would thus have
to be increased, the increase in post-chlorination should not affect TTHM levels.
Table 4: The significance of multivariate regression for Equation 2
With a validated model, the significance of alternate operational and water quality
parameters which control or reduce DBP formation can be identified. For example,
treatment plant operators can lower DBP formation by reducing pre-chlorination
dosages, while maintaining sufficient residual for adequate disinfection.
From Figure 6, the predicted TTHM values using Equation 2 were graphed against the
measured TTHM values, and the R-Squared value was calculated from the line of best
fit, 91%, validating the regression model. Figure 7 demonstrates how the predictive
capabilities of Equation 1 and Equation 2 compare to each other. As apparent from
Figure 7, Equation 2 demonstrates improved accuracy over Equation 1. To
demonstrate how altering water quality parameters may affect cancer risk, Figure 8
shows how altering pre-chlorination levels can reduce cancer risk. A reduction of
10% can lower cancer risk by roughly 6.5%, a reduction of 20% lowers cancer risk by
Coefficients Standard
Error
t Stat P-value Lower95% Upper
95%
Intercept 1.62 0.635221 2.549665 0.01909 0.294553 2.944649
DOC Raw 0.663 0.078765 8.411051 5.33E-08 0.498198 0.826802
Pre
Chlorine
0.653 0.224138 2.911509 0.008629 0.185036 1.120125
Raw Bromide
0.282 0.104202 2.708164 0.013534 0.064835 0.499558
Raw Temp 0.173 0.041359 4.181989 0.00046 0.08669 0.259239
Treated pH -1.40 0.579789 -2.41619 0.025368 -2.6103 -0.19146

50
13.5%, and a reduction up to 30% can lower cancer risk by 20.8%. Through a
monthly bromide level analysis, it was determined that bromide levels do not
significantly vary within the year. This implies that it would not be feasible to alter
pre-chlorination levels during periods of low bromide, as these periods do not occur.
While bromide does not vary within the year, it is important to note that several
individual WTPs have noticeably higher bromide concentrations than others, and thus
have higher TTHM levels.
4.0 Conclusions
1) When bromide is at low concentrations, chloroform concentrations are nearly
100% of the TTHM formed, but when bromide is at higher concentrations
(approximately 0.5 mg/L), all trihalomethane subspecies are typically at
approximately equal levels, until bromide approaches 10 mg/L, the bromide
subspecies approach 100% of the TTHM formed.
2) A regression model (R2 = 0.91) was determined to characterize the formation of
TTHM with statistically significant variables of water temperature, dissolved
organic carbon, pH, pre-chlorination and raw water bromide concentrations; and
hence can be used to predict TTHM formation.
3) The number of water treatment plants that fall into non-compliance if the MCL for
TTHM was to be lowered from 100 µg/L to 80 µg/L is minimal, implying that an
MCL reduction would be relatively straightforward to attain. A reduction from

51
100µg/L to 60µg/L would result in approximately 15% of all WTPs falling into
non-compliance and would be more difficult to accomplish. To reduce the MCL
to a level where the cancer risk would be de minimus, or 1 in 1,000,000 would
result in nearly all WTPs being out of compliance, and would not be feasible.
5.0 Acknowledgements
The authors would like to thank the DWSP of Ontario for their contributions in the
data collection phase. This research was funded by the Canada Research Chair
Program and the Ontario Research Foundation.
6.0 References
“A National Survey of Chlorinated Disinfection By-Products in Canadian Drinking
Water”. 1995. Health Canada. 12 Dec 2011 <http://www.hc-sc.gc.ca/ewh-
semt/pubs/water-eau/byproducts-sousproduits/results-resultats-eng.php>.
Berthouex, P. Mac. Statistics for environmental engineers. Boca Raton: Lewis, 1994.
Print.
Costa, A., Aldridge, D. C., Moggridge, G, D. “Seasonal variation of zebra mussel
susceptibility to molluscicidalagnets”, Journal of Applied Ecology, 2008, 45,
1712-1721.
Chang, E., Lin, Y., and Chiang, P., “Effects of bromide on the formation of THMs
and HAAs.” Chemosphere 43(2001): pp 1029-1034.
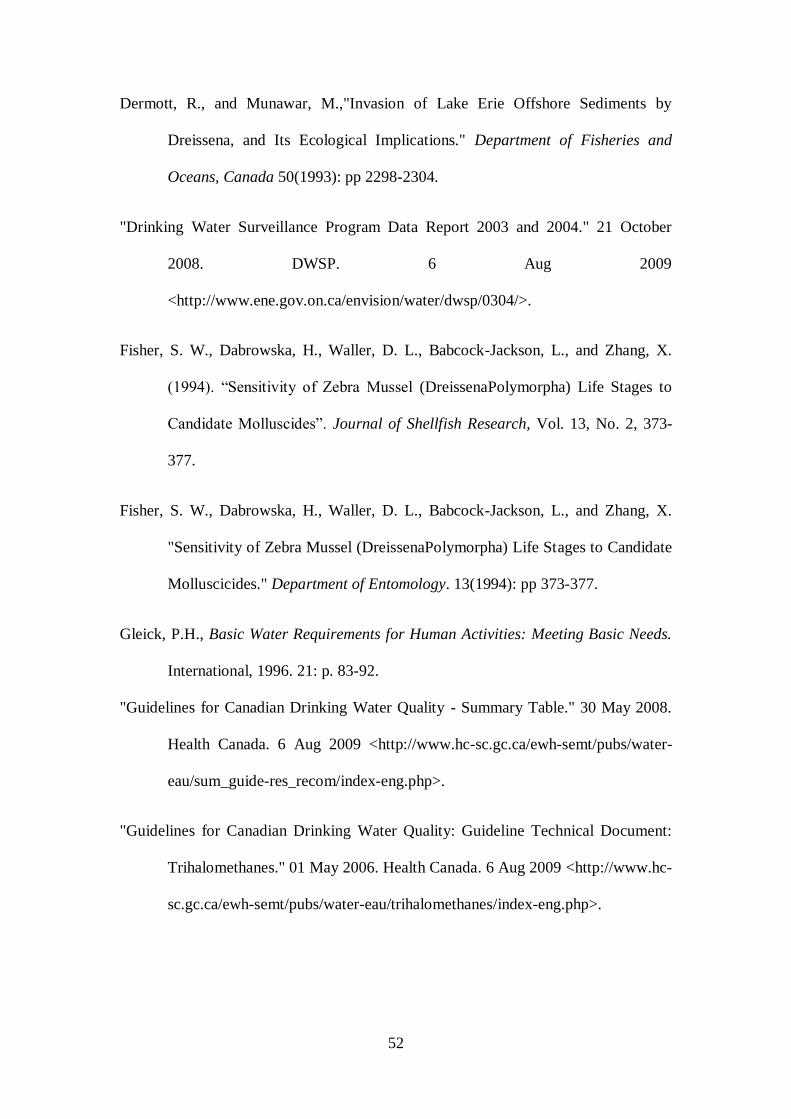
52
Dermott, R., and Munawar, M.,"Invasion of Lake Erie Offshore Sediments by
Dreissena, and Its Ecological Implications." Department of Fisheries and
Oceans, Canada 50(1993): pp 2298-2304.
"Drinking Water Surveillance Program Data Report 2003 and 2004." 21 October
2008. DWSP. 6 Aug 2009
<http://www.ene.gov.on.ca/envision/water/dwsp/0304/>.
Fisher, S. W., Dabrowska, H., Waller, D. L., Babcock-Jackson, L., and Zhang, X.
(1994). “Sensitivity of Zebra Mussel (DreissenaPolymorpha) Life Stages to
Candidate Molluscides”. Journal of Shellfish Research, Vol. 13, No. 2, 373-
377.
Fisher, S. W., Dabrowska, H., Waller, D. L., Babcock-Jackson, L., and Zhang, X.
"Sensitivity of Zebra Mussel (DreissenaPolymorpha) Life Stages to Candidate
Molluscicides." Department of Entomology. 13(1994): pp 373-377.
Gleick, P.H., Basic Water Requirements for Human Activities: Meeting Basic Needs.
International, 1996. 21: p. 83-92.
"Guidelines for Canadian Drinking Water Quality - Summary Table." 30 May 2008.
Health Canada. 6 Aug 2009 <http://www.hc-sc.gc.ca/ewh-semt/pubs/water-
eau/sum_guide-res_recom/index-eng.php>.
"Guidelines for Canadian Drinking Water Quality: Guideline Technical Document:
Trihalomethanes." 01 May 2006. Health Canada. 6 Aug 2009 <http://www.hc-
sc.gc.ca/ewh-semt/pubs/water-eau/trihalomethanes/index-eng.php>.

53
Harper, B., McBean, E., and Zhu, Z. (2012). Attaining Zebra Mussel Control and
Mitigating Disinfection By-Product Formation in Drinking Water Treatment.
Unpublished master‟s thesis, University of Guelph, Guelph, Ontario.
Hamilton, D. J., Ankney, C. D., and Bailey, R. C. 1994. “Predation of Zebra Mussels
by Diving Ducks: An Exclosure Study”. The Ecological Society of America.Pp
521-531.
Jolley, R.L., Conference. Water chlorination environmental impact and health effects,
Vol. 1: Proceedings of the Conference on the Environmental Impact of Water
Chlorination, Oak Ridge National Laboratory, Oak Ridge, Tennessee, October
22-24, 1975. Ann Arbor, Mich: Ann Arbor Science, 1978. Print.
Kampioti, A., and Stephanou, E., “The impact of bromide on the formation of neutral
and acidic disinfection by-products (DBPs) in Mediterranean chlorinated
drinking water.” Water Research 36(2002): pp 2596-2606.
Kilgour, B.W., and Mackie., G. L.,Colonization of Different Construction Materials
by the Zebra Mussel. Lewis Publishers, 1993.
McBean, E., Zhu, Z., and Zeng, W., "Systems Analysis Models for Disinfection By-
Product Formation in Chlorinated Drinking Water in Ontario." Civil
Engineering and Environmental Systems 25(2008): pp 127-138.
Metcalf, Eddy. Wastewater Engineering. New York: McGraw-Hill College, 2002.
Print.
Morrow, C., and Minear, R., “Use of Regression Models to Link Raw Water
Characteristics to Trihalomethane Concentrations in Drinking Water.” Water
Research 21(1987): pp 41-48.

54
"National Primary Drinking Water Regulations:" 16 December 1998. USEPA. 6 Aug
2009 <http://www.epa.gov/OGWDW/mdbp/dbpfr.html>.
"National Survey of Chlorinated Disinfection By-Products in Canadian Drinking
Water." 12 September 2008. Health Canada. 7 Aug 2009 <http://www.hc-
sc.gc.ca/ewh-semt/pubs/water-eau/byproducts-sousproduits/index-eng.php>.
Rajogopal, S., Van der Velde, G., Van der Gaag, M., Jenner, H. A., “How Effective is
Intermittent Chlorination to Control Adult Mussel Fouling in Cooling Water
Systems?”.Water Res.(2003) 37, 329-338.
Ram, J. L., Fong, P. P and Garton, D. W.,"Physiological Aspects of Zebra Mussel
Preproduction: Maturation, Spawning, and Fertilization." American Zoologist
36(1996): pp 326-338.
Sprecher, S., and Getsinger, K. D., "Zebra Mussel Chemical Control Guide." US
Army Corps of Engineers - Environmental Laboratory (2000): 1-116.
Sun, Y., Wu, Q., Hu, H., and Tian, J., “Effect of bromide on the formation of
disinfection by-products during wastewater chlorination.” Water Research
43(2009): pp 2391-2398.
Tutt, A. (2009). TTHM Formation Modeling Using Regression Analysis in Ontario
Water. Unpublished master‟s thesis, University of Guelph, Guelph, Ontario.
Uyak, V., and Toroz, I., “Investigation of bromide ion effects on disinfection by-
products formation and speciation in an Istanbul water supply.” Journal of
Hazardous Materials 149(2007): pp 445-451.

55
Verween, Vincx , M., Degraer, S., “Comparative toxicity of chlorine and peracetic
acid in the biofouling control of Mytilopsisleucophaeata and
Dreissenapolymorpha embryos (Mollusca, Bivalvia)”, International
Biodeterioration& Biodegradation, 63 (2009) 523–528.
Wang, G-S., Deng, and Lin, T., "Risk Assessment from Trihalomethanes in Drinking
Water." Science of the Total Environment 387(2007): 86-95.

56
Figure 1: Sum of Trihalomethane Subspecies in Ontario WTPs
0
5
10
15
20
25
30
Co
nce
ntr
atio
n (µ
g/L
)
Species
Sum of Trihalomethane Subspecies from 2004-2007 in Ontario WTPs
Bromoform
CDBM
Chloroform
BDCM

57
Figure 2: Subspecies formation based on bromide ion concentration (From Health Canada, 1995)
Figure 3: Percent speciation of TTHM subspecies given bromide concentrations in raw drinking water
0
0.2
0.4
0.6
0.8
1
<5 5-10 >10
Per
cen
t Sp
ecia
tio
n
Raw Water Bromide Concentration (ug/L)
Percent Speciation of TTHM Subspecies for all Ontario WTPs for 2004 - 2007
CF
CDBM
BF
BDCM
CF BF CDBM BDCM

58
Figure 4: Cancer Risk for TTHM Concentration of 20µg/L Given Bromide Concentration in Raw Water
Figure 5: TTHM Concentration when Bromide Concentration in Raw Water is Known
0.00E+00
5.00E-06
1.00E-05
1.50E-05
2.00E-05
2.50E-05
<10 >10
Can
cer
Ris
k
Raw Water Bromide Concentration (ug/L)
Cancer Risk for TTHM Concentration of 20µg/L Given
Bromide Concentration in Raw Water
CF
CDBM
BF
BDCM
TTHM
R² = 0.2321
0
20
40
60
80
100
120
0 10 20 30 40 50 60
TTH
M C
on
cen
trat
ion
(µ
g/L)
Raw Bromide Concentration (µg/L)
TTHM Concentration when Bromide Concentration in Raw Water is Known

59
Figure 6: Measured TTHM vs. Predicted TTHM from Equation 2
Figure 4: Measured TTHM vs. Predicted TTHM for Equations 1 and 2
R² = 0.9136
0
10
20
30
40
50
60
70
80
90
100
0 20 40 60 80 100
Mea
sure
d T
THM
µg/L
Predicted TTHM µg/L
Measured TTHM vs. Predicted TTHM
0
10
20
30
40
50
60
70
80
90
100
0 20 40 60 80 100
Mea
sure
d T
THM
µg/L
Predicted TTHM µg/L
Measured TTHM vs. Predicted TTHM
Equation 1
Equation 2

60
Figure 5: TTHM Cancer Risk with Altered Pre-Chlorination Dosage
1.00E-05
1.20E-05
1.40E-05
1.60E-05
1.80E-05
2.00E-05 C
ance
r R
isk
TTHM Cancer Risk with Altered Pre-Chlorination Dosage
TTHM Existing Chlorine
TTHM 10% Pre-Chlorine Reduction
TTHM 20% Pre-Chlorine Reduction
TTHM 30% Pre-Chlorine Reduction

61
Chapter 4
Paper #3: Modelling and Mitigation of Disinfection By-Product
Formation through the Development of a Bayesian Network Brett Harper, Zoe J. Y. Zhu and E. McBean
Abstract
Issues of Disinfection by-product (DBP) formation in response to chlorination in
drinking water treatment systems is a common issue encountered by WTP operators.
This is complicated by the presence of zebra mussels, which may inhabit the raw
water intake of WTPs. While chlorination at the intake to control zebra mussel
populations is effective, the formation of DBPs is exacerbated. A Bayesian network is
developed using the Webweavr-IV Toolkit, utilizing causal relationships between raw
water quality parameters in the form of conditional probabilities.
Four alternative chlorination scenarios are analyzed, one of which demonstrates the
probability of high TTHM concentrations (>80µg/L) can be reduced from 25.2% to
24.5%; and the probability of high cancer risk from TTHM (>10-5
) was reduced from
96.6% to 96.2%.
Keywords: Disinfection by-products (DBPs), Total Trihalomethanes, Bayesian
Network, Haloacetic acids (HAA), Organic matter, Chlorine.

62
1.0 Introduction
1.1 An Overview of Disinfection By-Products in Drinking Water
Total Trihalomethanes (TTHMs) are by-products created when the chlorine used in
the disinfection process reacts with naturally occurring organics (e.g. organics formed
by the decay of algae and vegetation) in raw water. In addition to chlorination,
TTHMs are known to also be influenced by temperature, bromide, and the
concentration of the dissolved organic carbon in the water (Health Canada, 2006). The
most common forms of trihalomethanes created are chloroform,
bromodichloromethane (BDCM), chlorodibromomethane (CDBM) and bromoform
indicating that the bromide ion is a contributing factor to the formation of TTHM
(Harper et al., 2012).
Chlorine and its compounds are the most commonly used disinfectants by water
treatment facilities. The popularity of chlorine is due to the combination of low cost,
high oxidizing potential, and the chlorine residual which exists throughout the
distribution system and protects against microbial recontamination (Sadiq and
Rodriguez, 2003). However in the 1970s, it was discovered that chlorine used during
water treatment reacts with organic matter, such as humic and fulvic acids, and
produces carcinogenic by-products. Given this, there is merit in reducing the
formation of these by-products, as feasible, by altering chlorination dosages.
However, additional issues which may counter the potential to alter chlorination
dosages is zebra mussels (Dreissena polymorpha), a class of mollusc similar to
oysters, clams, and scallops, which originated in the Black and Caspian seas and have
been inadvertently transported into the Great Lakes water by cargo ships. The mussels

63
grow to 1 inch in length and produce 35,000 eggs per season per female (Dermott et
al., 1993). The proliferation of zebra mussels is causing serious problems by clogging
raw-water intakes and discharge lines, increasing pipe corrosion, and producing
massive bio-fouling. As a result, zebra mussels are a recent problem for surface water
treatment facilities in parts of the US and Canada, particularly along the western
shores of Lake Erie. This paper evaluates several chlorination strategies to accomplish
lesser formation rates of the disinfection by-products while still controlling zebra
mussels.
2.0 Literature Review and Background
2.1 Known Health Effects of DBPs
Table 1 outlines the known health effects associated with different classes of DBPs.
Table 1: The health effects related to the major DBPs (modified from USEPA 1999)
Class of DBPs Compound Potential Health Effects
Total Trihalomethanes Chloroform Cancer, liver, kidney and reproductive
effects
Dibromochloromethane Nervous system, liver, kidney and
reproductive effects
Bromodichloromethane Cancer, liver, kidney and reproductive
effects
Bromoform Cancer, nervous system, liver and kidney
effects

64
The current standard for TTHM set by Health Canada is 100 µg/L (Health Canada
2006). By comparison, the US Environmental Protection Agency (USEPA) has set
their standards at 80 µg/L for TTHM (USEPA, 1999).
1.1 Research on chlorination and zebra mussels control
Verween et al. (2009) have shown that chlorination is an effective tool for eliminating
zebra mussels. One strategy to control zebra mussels is “Continuous Treatment”,
where chlorine is applied consistently to the water at concentrations around 2 mg/L at
the intake. This is very effective at killing all biological life in the water. It does,
however, produce high levels of DBPs (Harper et al., 2012).
Alternatively, zebra mussels can be controlled by killing the adult mussels by either
intermittent treatment, or periodic control chlorination (Klerks et al., 1993).
“Intermittent Treatment” includes killing the larvae before they settle and change into
their more-resilient juvenile forms. Sprecher et al. (2000) demonstrate that
chlorinating for 30 minutes every 12 hours is effective in controlling veliger (zebra
mussel larvae) populations and preventing new zebra mussels from settling; however,
this approach is not effective at killing established adult zebra mussels. By
chlorinating heavily for two to three weeks in late spring/early summer (in addition to
the preceding), the established adults can be killed. At this point, intermittent
treatment can be used to kill the young zebra mussels looking to “settle”.
It has been demonstrated that chlorination rates can be altered by incorporating
knowledge of the changing seasonal tolerances of zebra mussels (Costa et al., 2008).
A promising alternative to continuous treatment is “Periodic Treatment”, which
involves chlorinating “on” and “off” throughout the year. This treatment usually

65
consists of three treatment applications spread across the months of April to October.
Each treatment gives a dose of chlorine between 0.5 and 2 mg/L and lasts for 2-4
weeks. Costa et al. showed that in one experiment, a dose of 0.3 mg/L was applied in
3 sets of 2-3 week periods, resulting in a 95% mortality rate for zebra mussels.
2.3 Bromide Ion
Health Canada has listed the bromide ion as one of the contributing factors in the
formation of TTHMs (Health Canada, 1995). In the presence of chlorine and organic
material, as much as 50% of the bromide ion may become incorporated into
brominated trihalomethane subspecies (Chang et al., 2001; Harper et al., 2012). This
implies that a reduction in bromide concentration will have a significant impact on the
concentration TTHM. Until recently, only very limited bromide data have been
available. However, bromide data over a four year period (2005-2008) have recently
been released by the Ontario-based Drinking Water Surveillance Program (DWSP).
This study utilizes this recent bromide data in the development of a Bayesian network.
2.4 Bayesian Networks
This study employs the use of a Bayesian network to predict TTHM concentration
level by utilizing causal relationships between raw water quality parameters and
TTHMs, and causal relationships between the water quality parameters.
Bayesian networks are a type of intelligent system that represents domain knowledge
with a graphical structure that uses nodes to represent variables and arcs between the

66
nodes to represent dependencies between variables. A Bayesian network quantifies
this knowledge structure with probabilistic expressions of the interaction among
variables. Since probabilities are logical ways to quantify the unknown, Bayesian
networks are ideal intelligent systems. Bayesian networks also possess the unique
ability to incorporate expert estimates, as well as observed evidence, which allows
them to unite different kinds of uncertainty in a single theoretical environment (Olson
et al, 1990; van der Gaag, 1996).
Bayesian networks rely on Bayes‟ theorem to send information between nodes.
Bayes‟ theorem is displayed below.
The belief P(H|E) in a hypothesis given some evidence depends on the likelihood of
observing evidence, E, given both the hypothesis and its negation, P(E|H) and
P(E| H), and on the prior probability of the hypothesis P(H) (Pearl, 1982). The
denominator expresses a normalizing constant that indicates the prior probability of
the evidence, P(E).
Bayesian networks do not require that relationships between every variable be
specified. Rather, each variable in a Bayesian network requires only a local joint
probability distribution that reflects the possible configurations of its immediate
parents, if any, in the graph. A node with no parents is termed as „marginally

67
independent‟, meaning that the probabilities used to describe the node may be derived
from observed data or an estimate, but it is not dependant on any other nodes in the
network itself. Alternatively, conditional probabilities are used to describe the various
states of a node with parents, where each state of such a node is described in terms of
the various combinations of its parents‟ states. Ergo, the state of each child node is
conditional on the knowledge of the parents‟ states. This results in a network that
requires limited quantitative parameters to describe the influence of variables on one
another; conditional probabilities are described locally, but, through propagation of
probabilities from one node to the next, have global influence.
The WebWeavr IV Toolkit will be employed to model a Bayesian network that
utilizes the concentration levels of raw water parameters to predict concentration
levels of TTHM.
3.0 Study Area and Approach
3.1 WEBWEAVR-IV
The Bayesian network was created using the WEBWEAVR-IV Toolkit (Xiang,
2006); a Java-based research toolkit developed for decision support systems based on
graphical models. WEBWEAVR-IV supports the construction of Bayesian networks,
inference in standard and dynamic Bayesian networks and decomposable Markov
networks, construction and verification of multiply-sectioned Bayesian networks
(MSBNs), and inference in multi-agent MSBNs.

68
3.2 Bayesian Network Development
Shown in Figure 1 is the Bayesian network developed for TTHMs, and cancer risk
prediction. The network displays how the various water quality parameters, namely
cancer risk and zebra mussels rely on the other parameters in the network. For
example, Zebra mussels are dependent on raw water temperature, and TTHMs are
dependent on bromine and DOC in raw water, and pre- and post- chlorine dosages.
3.3 Conditional Probabilities
The conditional probabilities for the Bayesian network were developed using data
from six WTPs (five from surface water sources, one from mixed surface water and
groundwater sources) in Ontario during 2005 to 2008. Only for six treatment plants
were all chlorination dosage data and bromide data available and hence used in the
Bayesian Network.
The probability values were developed from the raw water data as follows:
A series of ranges was assigned to each raw water quality parameter, and cancer risk,
and is shown in Table 2.

69
Table 2: Raw Water Quality Parameter Assigned Ranges
Parameter Range
Temperature Low: <12°C Med:12°C – 20°C High: >20°C
Zebra Mussels Low, Med, High
Raw DOC Low: <4.1µg/L Med: 4.1µg/L – 6.3µg/L High:
>6.3µg/L
Bromine Low: <12.9µg/L Med:12.9µg/L – 21.5µg/L
High: >21.5µg/L
Pre-
Chlorination
Dose
Low: <1.6mg/L Med:1.6mg/L – 1.76mg/L
High: >1.76mg/L
Post-
Chlorination
Dose
Low: <1.28mg/L Med: 1.32mg/L – 2.2mg/L
High: >2.2mg/L
Total
Trihalomethanes
Low: <50µg/L Med: 50µg/L – 80µg/L High:
>80µg/L
Cancer Risk Low: <10-6
Med: 10-6
– 10-5
High: >10-5
Each individual raw water datum was converted from a magnitude to either low,
medium, or high, depending on where each datum fell in the range.
Probability levels for three of the four parent nodes (Bromine, Pre-chlorination and
Post-chlorination) in the Bayesian network was determined to be equal split among
low, medium and high (0.333 probability for each level). The other parent node,
temperature, was assigned range values that did not reflect an equal frequency
between temperature levels, but rather correlated with zebra mussel spawning rates, as
zebra mussel populations tend to increase when the water is above 12°C.

70
Given the range values for the four parent nodes, as well as the ranges of each child
node in the Bayesian network, the conditional probabilities for each child node were
determined by calculating the probability the dependent water quality parameter,
given the value of the parent water quality parameter.
3.4 The Seasonal Impact on Zebra Mussel Control
To effectively control zebra mussels using chlorination, the seasonal variation of
zebra mussel susceptibility to chlorination patterns must be considered. According to
experiments by Bryant et al. (1985), Heinonen (2001), Rajagopal et al. (2002a), and
Costa et al. (2008), the high susceptibility of zebra mussels to chlorine is observed in
the U.S. to some extent in June and peaks in July and August, after reproduction. This
occurs because of mussels‟ low body weight, high filtration activity and the high
water temperatures. However, given Ontario‟s very long, cold winters and short
summers, the peaks of susceptibility move to between August and September (Harper
et al., 2012). Hence, it is in August and September when zebra mussels are most
susceptible to chlorine and is the optimal period to pre-chlorinate to reduce zebra
mussel levels. Given this, consideration of both zebra mussel control and treatment
strategies is feasible.
3.5 Cancer Risk
From TTHM concentrations, the exposure to each of these compounds, given by the
Lifetime Average Daily Dose (LADD), can be calculated.
The LADD is defined as:

71
LADD = (Cw x IR x EFx ED)/(BW x AT)
Where,
Cw = Contaminant Concentration,
IR = Intake Rate,
EF = Exposure Frequency,
ED = Exposure Duration,
BW = Body Weight and,
AT = Averaging Time.
Assuming a body weight of 70kg, an intake rate of 2L of water a day (Gleick 1996)
for 365 days per year, a lifespan of 70 years (ED), and an average lifetime of 25,550
days; the consumption of water per mass per day (L/(kg*day)) is:
LADD = Cw x consumption of water per mass per day.
The consumption of water per mass per day is:
0.029L/(kg*day).
The corresponding incremental excess lifetime cancer risk, IECLR, for TTHM
concentrations is calculated by multiplying the LADD by its corresponding CSF.
Harper et al. (2012) calculated the CSF for TTHM to be 0.0204 (mg/kg/day)-1
. The
resulting cancer risk probabilities for TTHM are shown in Table 3.

72
4.0 Integrated Analysis
4.1 Comparison of Altered Pre- and Post- Chlorination Levels for TTHM
Reduction
Consider four scenarios with varying levels of pre- and post-chlorination in an effort
to mimic alternative approaches to chlorination while also incorporating mussel
control. The variables being examined were: pre-chlorination, post-chlorination,
treated water temperature, raw DOC, and bromine. Using the Bayesian network,
values of TTHM and cancer risk were calculated. The four scenarios are as follows:
Scenario 1: pre-chlorination was regular (the same as current conditions) but post-
chlorination was set to the low level (<1.28mg/L).
Scenario 2: During the months of May, July and September, pre-chlorination was set
to 0.5mg/L and the rest of the year it was set to 0.001mg/L, and post-chlorination was
set to 3mg/L. This test follows “Intermittent Treatment” (Sprecher, 2000), where there
are three treatments a year using pre-chlorination.
Scenario 3: This test was similar to scenario 2, but instead utilized a process known as
“End-of-season treatment” (after Sprecher, 2000). Pre-chlorination was assumed at a
concentration of 0.75mg/L during the months of May and July, and at a concentration
of 3.0mg/L in September. The purpose of the higher dose in September was to flush

73
out any remaining adult zebra mussels prior to the next season beginning. Again, the
post-chlorination was 3mg/L.
Scenario 4: This scenario is quite different from the preceding scenarios. In this
scenario, “Continuous Treatment” was used during the months where the water
temperature exceeded 12oC. During the months of May to November the dose of pre-
chlorine was set to 3mg/L, and at 0.001mg/L for the remainder of the year. During the
months of May to November the dose of post-chlorine was set to 0.3mg/L, and
3.3mg/L for the remainder of the year. This scenario was designed to be the most
secure test in terms of microbial disinfection and zebra mussel control.
4.2 Bayesian Network Results
Shown in Table 3 are the probability results generated by the Bayesian Network for
current, average water quality conditions of reported by WTPs across Ontario.
Table 3: Bayesian Network Results
Parameter Range Low Medium High
Temperature Low: <12°C Med:12°C – 20°C High: >20°C 0.517 0.207 0.276
Zebra Mussels Low, Med, High 0.359 0.334 0.307
Raw DOC Low: <4.1µg/L Med: 4.1µg/L – 6.3µg/L High:
>6.3µg/L 0.313 0.334 0.353
Bromine Low: <12.9µg/L Med:12.9µg/L – 21.5µg/L
High: >21.5µg/L 0.333 0.333 0.333
Pre-
Chlorination
Dose
Low: <1.6mg/L Med:1.6mg/L – 1.76mg/L
High: >1.76mg/L 0.333 0.333 0.333

74
Post-
Chlorination
Dose
Low: <1.28mg/L Med: 1.32mg/L – 2.2mg/L
High: >2.2mg/L 0.333 0.333 0.333
Total
Trihalomethanes
Low: <50µg/L Med: 50µg/L – 80µg/L High:
>80µg/L 0.459 0.289 0.252
Cancer Risk Low: <10-6
Med: 10-6
– 10-5
High: >10-5
0 0.034 0.966
The results in Table 3 display the predicted probability of each outcome occurring.
For example, temperature has a probability of 0.517, or a 51.7% chance of being
under 12°C throughout any given year. Of interest is that given the input parameters
of average WTP raw water concentrations from the data from 2005 – 2008, cancer
risk has a 0% chance of being less than „de minimus‟ (one in a million), a 3.4%
chance of being between one in a million and 1 in 100,000, and a 96.6% chance of
being over 1 in 100,000. Shown in Table 4 is a comparison of how the current,
average conditions relate to those in Scenarios 1 through 4.
Table 4: Comparison of Current, Average Conditions with the Four Scenarios
Scenario Magnitude
Parameter
Pre-
Chlorination
Dose
Post-
Chlorination
Dose
Total
Trihalomethan
es
Cancer Risk
Original
Data
Low 0.333 0.333 0.459 0.000
Medium 0.333 0.333 0.289 0.034
High 0.333 0.333 0.252 0.966
Scenario 1
Low 0.333 1.000 0.510 0.000
Medium 0.333 0.000 0.245 0.038
High 0.333 0.000 0.245 0.962
Scenario 2 Low 0.750 0.000 0.354 0.000

75
Medium 0.250 0.000 0.338 0.027
High 0.000 1.000 0.308 0.973
Scenario 3
Low 0.750 0.000 0.348 0.000
Medium 0.167 0.000 0.340 0.026
High 0.083 1.000 0.312 0.974
Scenario 4
Low 0.500 0.500 0.435 0.000
Medium 0.000 0.000 0.296 0.033
High 0.500 0.500 0.270 0.967
Table 4 displays the probabilities of pre-chlorination dose, post-chlorination dose,
TTHM, and cancer risk being low, medium, or high (Refer to Table 2 for the range of
magnitudes of each level). For example, the probability of TTHM being low in
Scenario 1 is 0.510, or 51.0%. For each Scenario, the probabilities of a given
parameter being low, medium or high, all sum to 1.
It was found that cancer risk is at its lowest in Scenario 1, as the probability of a high
cancer risk (>10-5
) is 96.2%, which is lower than the probability of high cancer risk of
96.6% that is associated with current WTP conditions. All other Scenarios
demonstrate probabilities of high cancer risk greater than those in Scenario 1. The
small change in cancer risk can be attributed to the lack of data available for the
Bayesian network. Lack of data requires that the Bayesian network have very coarse
grid spacing (only three levels: low, medium and high), which results in the output of
the Bayesian network being equally coarse. This means that either very large, or very
minute changes in cancer risk will be observed.

76
It was also found that current WTP conditions and all Scenarios demonstrated a
probability of 0, or a 0% chance for cancer risk to be low (<10-6
). Given this, it is
evident that under current WTP conditions, as well as in all possible Scenarios, that
cancer risk is above „de minimus‟ (one in a million).
The probability of a high level of TTHM (80µg/L) being encountered is lowest in
Scenario 2, at 24.5%. Original conditions have a 25.2% chance of high trihalomethane
concentrations, followed by Scenario 4 at 27.0%, Scenario 2 at 30.8%, and Scenario 3
at 31.2%.
5.0 Conclusions
1. A Bayesian network was developed to predict TTHM concentration levels.
This was done using the Webweavr-IV Toolkit, and by utilizing the causal
relationships between raw water quality parameters and TTHM, as well as the
causal relationships between the water quality parameters, themselves.
2. Under current, average WTP conditions, cancer risk was found to be above „de
minimus‟ (one in a million).
3. Scenario 1 was found to be the most effective chlorination alternative to
current practices because the probability of high TTHM concentrations was
reduced from 25.2% to 24.5%; and the probability of high cancer risk from
TTHM was reduced from 96.6% to 96.2%. The small change in cancer risk
can be attributed to the lack of data available for the Bayesian network, which
results in the output of the Bayesian network being coarse.

77
6.0 Acknowledgements
The authors would like to thank the DWSP of Ontario for their contributions in the
data collection phase. This research was funded by the Canada Research Chair
Program and the Ontario Research Foundation.
7.0 References
“A National Survey of Chlorinated Disinfection By-Products in Canadian Drinking
Water”. 1995. Health Canada. 12 Dec 2011 <http://www.hc-sc.gc.ca/ewh-
semt/pubs/water-eau/byproducts-sousproduits/results-resultats-eng.php>.
Berthouex, P. Mac. Statistics for environmental engineers. Boca Raton: Lewis, 1994.
Print.
Costa, A., Aldridge, D. C., Moggridge, G, D. “Seasonal variation of zebra mussel
susceptibility to molluscicidalagnets”, Journal of Applied Ecology, 2008, 45,
1712-1721.
Chang, E., Lin, Y., and Chiang, P., “Effects of bromide on the formation of THMs
and HAAs.” Chemosphere 43(2001): pp 1029-1034.
Dermott, R., and Munawar, M.,"Invasion of Lake Erie Offshore Sediments by
Dreissena, and Its Ecological Implications." Department of Fisheries and
Oceans, Canada 50(1993): pp 2298-2304.
78
"Drinking Water Surveillance Program Data Report 2003 and 2004." 21 October
2008. DWSP. 6 Aug 2009
<http://www.ene.gov.on.ca/envision/water/dwsp/0304/>.
Fisher, S. W., Dabrowska, H., Waller, D. L., Babcock-Jackson, L., and Zhang, X.
(1994). “Sensitivity of Zebra Mussel (DreissenaPolymorpha) Life Stages to
Candidate Molluscides”. Journal of Shellfish Research, Vol. 13, No. 2, 373-
377.
Fisher, S. W., Dabrowska, H., Waller, D. L., Babcock-Jackson, L., and Zhang, X.
"Sensitivity of Zebra Mussel (DreissenaPolymorpha) Life Stages to Candidate
Molluscicides." Department of Entomology. 13(1994): pp 373-377.
Gleick, P.H., Basic Water Requirements for Human Activities: Meeting Basic Needs.
International, 1996. 21: p. 83-92.
"Guidelines for Canadian Drinking Water Quality - Summary Table." 30 May 2008.
Health Canada. 6 Aug 2009 <http://www.hc-sc.gc.ca/ewh-semt/pubs/water-
eau/sum_guide-res_recom/index-eng.php>.
"Guidelines for Canadian Drinking Water Quality: Guideline Technical Document:
Trihalomethanes." 01 May 2006. Health Canada. 6 Aug 2009 <http://www.hc-
sc.gc.ca/ewh-semt/pubs/water-eau/trihalomethanes/index-eng.php>.
Hamilton, D. J., Ankney, C. D., and Bailey, R. C. 1994. “Predation of Zebra Mussels
by Diving Ducks: An Exclosure Study”. The Ecological Society of America.Pp
521-531.

79
Harper, B., McBean, E., and Zhu, Z. (2012). Attaining Zebra Mussel Control and
Mitigating Disinfection By-Product Formation in Drinking Water Treatment.
Unpublished Manuscript, University of Guelph, Guelph, Ontario.
Harper, B., McBean, E., and Zhu, Z. (2012). Mitigation of Disinfection By-Product
Formation by the Development of a Regression Equation with the Bromide
Ion. Unpublished Manuscript, University of Guelph, Guelph, Ontario.
Jolley, R.L., Conference. Water chlorination environmental impact and health effects,
Vol. 1: Proceedings of the Conference on the Environmental Impact of Water
Chlorination, Oak Ridge National Laboratory, Oak Ridge, Tennessee, October
22-24, 1975. Ann Arbor, Mich: Ann Arbor Science, 1978. Print.
Kampioti, A., and Stephanou, E., “The impact of bromide on the formation of neutral
and acidic disinfection by-products (DBPs) in Mediterranean chlorinated
drinking water.” Water Research 36(2002): pp 2596-2606.
Kilgour, B.W., and Mackie., G. L.,Colonization of Different Construction Materials
by the Zebra Mussel. Lewis Publishers, 1993.
McBean, E., Zhu, Z., and Zeng, W., "Systems Analysis Models for Disinfection By-
Product Formation in Chlorinated Drinking Water in Ontario." Civil
Engineering and Environmental Systems 25(2008): pp 127-138.
Metcalf, Eddy. Wastewater Engineering. New York: McGraw-Hill College, 2002.
Print.
Morrow, C., and Minear, R., “Use of Regression Models to Link Raw Water
Characteristics to Trihalomethane Concentrations in Drinking Water.” Water
Research 21(1987): pp 41-48.

80
"National Primary Drinking Water Regulations:" 16 December 1998. USEPA. 6 Aug
2009 <http://www.epa.gov/OGWDW/mdbp/dbpfr.html>.
"National Survey of Chlorinated Disinfection By-Products in Canadian Drinking
Water." 12 September 2008. Health Canada. 7 Aug 2009 <http://www.hc-
sc.gc.ca/ewh-semt/pubs/water-eau/byproducts-sousproduits/index-eng.php>.
Olson, R.L., Willer, J.L. and Wager, T.L. 1990. A Framework for Modeling
Uncertain Reasoning in Ecosystem Management: Bayesian Belief Netowrks.
AI Applications 4(4):11-23.
Rajogopal, S., Van der Velde, G., Van der Gaag, M., Jenner, H. A., “How Effective is
Intermittent Chlorination to Control Adult Mussel Fouling in Cooling Water
Systems?”.Water Res.(2003) 37, 329-338.
Ram, J. L., Fong, P. P and Garton, D. W.,"Physiological Aspects of Zebra Mussel
Preproduction: Maturation, Spawning, and Fertilization." American Zoologist
36(1996): pp 326-338.
Sprecher, S., and Getsinger, K. D., "Zebra Mussel Chemical Control Guide." US
Army Corps of Engineers - Environmental Laboratory (2000): 1-116.
Sun, Y., Wu, Q., Hu, H., and Tian, J., “Effect of bromide on the formation of
disinfection by-products during wastewater chlorination.” Water Research
43(2009): pp 2391-2398.
Tutt, A. (2009). TTHM Formation Modeling Using Regression Analysis in Ontario
Water. Unpublished master‟s thesis, University of Guelph, Guelph, Ontario.

81
Uyak, V., and Toroz, I., “Investigation of bromide ion effects on disinfection by-
products formation and speciation in an Istanbul water supply.” Journal of
Hazardous Materials 149(2007): pp 445-451.
Van der Gaag, L., 1996. Bayesian Belief Networks: Odds and Ends. The Computer
Journal 39(2):97-113.
Verween, Vincx , M., Degraer, S., “Comparative toxicity of chlorine and peracetic
acid in the biofouling control of Mytilopsisleucophaeata and
Dreissenapolymorpha embryos (Mollusca, Bivalvia)”, International
Biodeterioration& Biodegradation, 63 (2009) 523–528.
Wang, G-S., Deng, and Lin, T., "Risk Assessment from Trihalomethanes in Drinking
Water." Science of the Total Environment 387(2007): 86-95.
Xiang, Y. (2002). Probabilistic Reasoning in Multiagent Systems: A graphical models
approach. Cambridge, UK: Cambridge University Press.
Xiang, Y. (2006). Webweaver-IV Research Toolkit. [Software]. Available from
http://www.socs.uoguelph.ca/~yxiang/

82
Figure 1: Bayesian Network to Determine TTHM levels and Resulting Cancer Risk

83
Chapter 5
Conclusions
5.1 Summary
In Ontario, cancer risks from TTHMs and its subspecies with current disinfection
practices currently exceed one in a million and the incremental cancer risk ranges
from 1 in 50,000 to 100,000. In an effort to reduce cancer risk from TTHMs, two
multiple regression models which predict the formation of TTHMs were developed
using water quality data from Ontario WTPs. The first TTHM model was developed
using data from 2000 to 2003; and water temperature, dissolved organic carbon in raw
water, dissolved organic carbon in treated water, pre-chlorination and post-
chlorination were all found to be statistically significant parameters. The other TTHM
model was derived from data from 2005 to 2008; and water temperature, dissolved
organic carbon, pH, pre-chlorination and raw water bromide concentrations were
found to be statistically significant.
The first model (R2
= 0.75) was used to estimate how TTHM levels could be reduced,
while still continuing to provide adequate zebra mussel removal. The model that was
developed results in the pre-chlorination variable having a higher exponent than the
post-chlorination variable, indicating that TTHM concentrations are more heavily
influenced by pre-chlorination dosages. This indicates that reducing the pre-
chlorination dose when feasible, and making up for this reduction by increasing the
post-chlorination dose has merit. This can be accomplished in winter months as zebra
mussels are considerably less active during this time. The model was used to develop
a strategy for effectively controlling zebra mussels, which is to pre-chlorinate at

84
3mg/L when the temperature exceeds 12oC, and post-chlorinate year-round. This
strategy results in a reduction of TTHM formation of 24% and reduces cancer risk by
24%, while maintaining effective disinfection and zebra mussel removal. During the
development of this model, it was found that there is a strong correlation between
increasing temperature and increasing chloroform and TTHM concentrations and that
there is not as strong of a correlation between the other TTHM subspecies and
temperature.
The second model (R2 = 0.91) was used to estimate how TTHM levels could be
reduced, but does not take zebra mussels into account due to post-chlorination
concentrations not being statistically significant in the model. During the development
of this model, further investigation was done on the newly-documented bromide ion.
It was found that when bromide is at low concentrations, chloroform concentrations
are nearly 100% of the TTHM formed, but when bromide is at higher concentrations
(approximately 0.5 mg/L), all trihalomethane subspecies are typically at
approximately equal levels, until bromide approaches 10 mg/L, when the bromide
subspecies approach 100% of the TTHM formed.
A Bayesian network was developed to predict TTHM concentration levels. This was
done using the Webweavr-IV Toolkit, and by utilizing the causal relationships
between raw water quality parameters and TTHM, as well as the causal relationships
between the water quality parameters, themselves. Holding pre-chlorination the same
as current conditions and setting post-chlorination to the low level (<1.28mg/L), was
found to be the most effective chlorination alternative to current practices. This

85
reduced the probability of high TTHM concentrations from 25.2% to 24.5%; and
reduced the probability of high cancer risk from TTHM from 96.6% to 96.2%.
5.2 Recommendations
It may be advisable for the DWSP to encourage participating WTPs to record water
quality results on a monthly basis, rather than 2-4 times per year. This would make it
easier to identify the seasonal changes of DBP formation, as well as enhance the
predictive capabilities of the multiple regression equations and the Bayesian network.
Consequently, zebra mussel mitigation could be enhanced, as DBP levels could be
more accurately calculated, allowing pre-chlorination levels to be optimized for both
zebra mussel control and minimal DBP formation.
Further documentation of the bromide ion would be beneficial to future studies. It has
been shown in this study that bromide plays a statistically significant role in the
formation of TTHMs in Ontario. Currently, bromide is monitored by few WTPs in
Ontario and thus the available data is still rather sparse. Further documentation of the
bromide ion could improve the accuracy of the regression equations and Bayesian
network, which would provide more information for WTP operators to mitigate
TTHM formation.
Greater amounts of water quality data (WTP data, expert opinions, or wet lab
experiments) are required to appropriately train the Bayesian network. Currently, the
amount of data available from the DWSP is limited when compared to the large

86
requirements of the Bayesian network. Obtaining this data would be beneficial to
creating a more useful Bayesian network.

87
References
“A National Survey of Chlorinated Disinfection By-Products in Canadian Drinking
Water”. 1995. Health Canada. 12 Dec 2011 <http://www.hc-sc.gc.ca/ewh-
semt/pubs/water-eau/byproducts-sousproduits/results-resultats-eng.php>.
Berthouex, P. Mac. Statistics for environmental engineers. Boca Raton: Lewis, 1994.
Print.
Chang, E., Lin, Y., and Chiang, P., “Effects of bromide on the formation of THMs
and HAAs.” Chemosphere 43(2001): pp 1029-1034.
Costa, A., Aldridge, D. C., Moggridge, G, D. “Seasonal variation of zebra mussel
susceptibility to molluscicidalagnets”, Journal of Applied Ecology, 2008, 45,
1712-1721.
Dermott, R., and Munawar, M., "Invasion of Lake Erie Offshore Sediments by
Dreissena, and Its Ecological Implications." Department of Fisheries and
Oceans, Canada 50(1993): pp 2298-2304.
"Drinking Water Surveillance Program Data Report 2003 and 2004." 21 October
2008. DWSP. 6 Aug 2009
<http://www.ene.gov.on.ca/envision/water/dwsp/0304/>.
Fisher, S. W., Dabrowska, H., Waller, D. L., Babcock-Jackson, L., and Zhang, X.
(1994). “Sensitivity of Zebra Mussel (DreissenaPolymorpha) Life Stages to
Candidate Molluscides”. Journal of Shellfish Research, Vol. 13, No. 2, 373-
377.

88
Fisher, S. W., Dabrowska, H., Waller, D. L., Babcock-Jackson, L., and Zhang, X.
"Sensitivity of Zebra Mussel (DreissenaPolymorpha) Life Stages to Candidate
Molluscicides." Department of Entomology. 13(1994): pp 373-377.
Gleick, P.H., Basic Water Requirements for Human Activities: Meeting Basic Needs.
International, 1996. 21: p. 83-92.
"Guidelines for Canadian Drinking Water Quality - Summary Table." 30 May 2008.
Health Canada. 6 Aug 2009 <http://www.hc-sc.gc.ca/ewh-semt/pubs/water-
eau/sum_guide-res_recom/index-eng.php>.
"Guidelines for Canadian Drinking Water Quality: Guideline Technical Document:
Trihalomethanes." 01 May 2006. Health Canada. 6 Aug 2009 <http://www.hc-
sc.gc.ca/ewh-semt/pubs/water-eau/trihalomethanes/index-eng.php>.
Hamilton, D. J., Ankney, C. D., and Bailey, R. C. 1994. “Predation of Zebra Mussels
by Diving Ducks: An Exclosure Study”. The Ecological Society of America.
Pp 521-531.
Jolley, R.L., Conference. Water chlorination environmental impact and health effects,
Vol. 1: Proceedings of the Conference on the Environmental Impact of Water
Chlorination, Oak Ridge National Laboratory, Oak Ridge, Tennessee, October
22-24, 1975. Ann Arbor, Mich: Ann Arbor Science, 1978. Print.
Kampioti, A., and Stephanou, E., “The impact of bromide on the formation of neutral
and acidic disinfection by-products (DBPs) in Mediterranean chlorinated
drinking water.” Water Research 36(2002): pp 2596-2606.
Kilgour, B.W., and Mackie., G. L., Colonization of Different Construction Materials
by the Zebra Mussel. Lewis Publishers, 1993.

89
McBean, E., Zhu, Z., and Zeng, W., "Systems Analysis Models for Disinfection By-
Product Formation in Chlorinated Drinking Water in Ontario." Civil
Engineering and Environmental Systems 25(2008): pp 127-138.
Metcalf, Eddy. Wastewater Engineering. New York: McGraw-Hill College, 2002.
Print.
Morrow, C., and Minear, R., “Use of Regression Models to Link Raw Water
Characteristics to Trihalomethane Concentrations in Drinking Water.” Water
Research 21(1987): pp 41-48.
"National Primary Drinking Water Regulations:" 16 December 1998. US EPA. 6 Aug
2009 <http://www.epa.gov/OGWDW/mdbp/dbpfr.html>.
"National Survey of Chlorinated Disinfection By-Products in Canadian Drinking
Water." 12 September 2008. Health Canada. 7 Aug 2009 <http://www.hc-
sc.gc.ca/ewh-semt/pubs/water-eau/byproducts-sousproduits/index-eng.php>.
Olson, R.L., Willer, J.L. and Wager, T.L. 1990. A Framework for Modeling
Uncertain Reasoning in Ecosystem Management: Bayesian Belief Netowrks.
AI Applications 4(4):11-23.
Rajogopal, S., Van der Velde, G., Van der Gaag, M., Jenner, H. A., “How Effective is
Intermittent Chlorination to Control Adult Mussel Fouling in Cooling Water
Systems?”. Water Res.(2003) 37, 329-338.
Ram, J. L., Fong, P. P and Garton, D. W., "Physiological Aspects of Zebra Mussel
Preproduction: Maturation, Spawning, and Fertilization." American Zoologist
36(1996): pp 326-338.
Richards, D. Chief Operator, Brockville Water Treatment. Phone: (613) 342-7819
90
Sprecher, S., and Getsinger, K. D., "Zebra Mussel Chemical Control Guide." US
Army Corps of Engineers - Environmental Laboratory (2000): 1-116.
Sun, Y., Wu, Q., Hu, H., and Tian, J., “Effect of bromide on the formation of
disinfection by-products during wastewater chlorination.” Water Research
43(2009): pp 2391-2398.
Tutt, A. (2009). TTHM Formation Modeling Using Regression Analysis in Ontario
Water. Unpublished master‟s thesis, University of Guelph, Guelph, Ontario.
Uyak, V., and Toroz, I., “Investigation of bromide ion effects on disinfection by-
products formation and speciation in an Istanbul water supply.” Journal of
Hazardous Materials 149(2007): pp 445-451.
Van der Gaag, L., 1996. Bayesian Belief Networks: Odds and Ends. The Computer
Journal 39(2):97-113.
Verween ., , Vincx , M., Degraer, S., “Comparative toxicity of chlorine and peracetic
acid in the biofouling control of Mytilopsisleucophaeata and
Dreissenapolymorpha embryos (Mollusca, Bivalvia)”, International
Biodeterioration& Biodegradation, 63 (2009) 523–528.
Wang, G-S, Deng, and Lin. "Risk Assessment from Trihalomethanes in Drinking
Water." Science of the Total Environment 387(2007): 86-95.