Embed Size (px)
Citation preview

University of Central Florida University of Central Florida
STARS STARS
Electronic Theses and Dissertations, 2004-2019
2014
Study of the Formation and Control of Disinfection By-Products Study of the Formation and Control of Disinfection By-Products
Originating from a Surface Water Supply on the Volcanic Island of Originating from a Surface Water Supply on the Volcanic Island of
Guam Guam
Erica LaBerge University of Central Florida
Part of the Environmental Engineering Commons
Find similar works at: https://stars.library.ucf.edu/etd
University of Central Florida Libraries http://library.ucf.edu
This Masters Thesis (Open Access) is brought to you for free and open access by STARS. It has been accepted for
inclusion in Electronic Theses and Dissertations, 2004-2019 by an authorized administrator of STARS. For more
information, please contact [email protected].
STARS Citation STARS Citation LaBerge, Erica, "Study of the Formation and Control of Disinfection By-Products Originating from a Surface Water Supply on the Volcanic Island of Guam" (2014). Electronic Theses and Dissertations, 2004-2019. 4817. https://stars.library.ucf.edu/etd/4817

STUDY OF THE FORMATION AND CONTROL OF DISINFECTION BY-PRODUCTS ORIGINATING FROM A SURFACE WATER SUPPLY ON THE VOLCANIC ISLAND OF
GUAM
by
ERICA R. LABERGE, E.I. B.S.Env.E., University of Central Florida, 2013
A thesis submitted in partial fulfillment of the requirements for the degree of Master of Science
in the Department of Civil, Environmental, and Construction Engineering in the College of Engineering and Computer Science
at the University of Central Florida Orlando, Florida
Fall Term 2014

© 2014 Erica R. LaBerge
ii

ABSTRACT
Three oxidants have been evaluated for use as alternative chemical pretreatments for Fena Lake, a
surface water that supplies the U.S. Navy’s Public Water System (PWS) on the volcanic island of
Guam. The study consisted of two investigative components. The first and primary component
included a bench-scale evaluation to study the effects of different pre-oxidant chemicals on the
formation of chlorinated disinfection by-products (DBPs). The second and ancillary component
included a series of water treatment and distribution system management studies that analyzed
DBP formation within the treatment plant and water distribution system. The goal of this research
was to reduce total trihalomethane (TTHM) and the five haloacetic acid (HAA5) formations in the
PWS.
In the primary component of the research, raw surface water from Fena Lake was collected by
U.S. Navy personnel and shipped to University of Central Florida (UCF) laboratories for
experimentation. Bench-scale tests that simulated the coagulation, flocculation, sedimentation and
filtration (CSF) that comprises the Navy Water Treatment Plant (NWTP) were used to evaluate
the use of two alternative pre-oxidants, potassium permanganate (KMnO4) and chlorine dioxide
(ClO2) in lieu of gaseous chlorine (Cl2). The research assessed DBP formation by comparing
several pretreatment scenarios, namely: (1) no pretreatment, (2) chlorine pretreatment, and (3)
alternative oxidant pretreatment. KMnO4 pretreatment resulted in the lowest percent reduction of
TTHMs and HAA5 relative to chlorine pretreatment, at 5.7% and 22.7%, respectively; however,
this amount was still a reduction from the results demonstrated for the chlorine pretreatment
condition. Without using a pre-oxidant, TTHM and HAA5 formation were reduced by 22.8% and
iii

37.3%, respectively, relative to chlorine pretreatment. Chlorine dioxide demonstrated the greatest
TTHM and HAA5 reduction relative to chlorine pretreatment at 34.4% and 53.3%, respectively.
The second component of research consisted of a series of studies that evaluated distribution
system operations and management alternatives to identify opportunities that could achieve DBP
reduction within the PWS. Three concerns that were addressed were the NWTP’s compliance with
the U.S. Environmental Protection Agency’s (USEPA’s) Stage 2 Disinfectants/Disinfection By-
Products (D/DBP) Rule, variable hydraulic detention times within a small subdivision in the
distribution system, and severe weather. It was determined that: (1) A decision based on in-plant
studies to cease prechlorination at the NWTP resulted in a decrease in TTHMs and HAA5s
throughout the distribution system by 62% and 75%, respectively; (2) A fluoride tracer study led
to the discovery of a valved pipeline responsible for elevated DBPs because of excessive water
age that when exercised and managed resolved intermittent DBP spikes in the PWS; and (3) when
the NWTP’s ballasted floc clarifier (BFC) was operated in-series prior to the conventional CSF
process during severe weather conditions the TTHM and HAA5 were below 39 ug/L and 29 ug/L,
respectively, proving BFC in-series is a practical option for the plant during severe weather.
iv

This thesis is dedicated to the LaBerge family: Chris, Patricia, Craig, and Jenny
v

ACKNOWLEDGMENTS
The work conducted for this research project would not have been possible without the support of
a number of individuals. First and foremost, the author would like to express her gratitude to Dr.
Steven Duranceau for the opportunity to complete this research, for serving as the author’s
committee chair, and for his support in the author’s continuing education. The author would like
to thank Dr. Andrew Randall and Dr. Woo Hyoung Lee for serving as committee members and
reviewing this document. The author wishes to show great appreciation to the efforts of Mrs. Maria
Real-Robert, the Civil, Environmental, and Construction Engineering (CECE) laboratory
coordinator, for her guidance. The author would also like to thank Christine Hall for her support
and help, both on campus and in Guam. The author wishes to express her gratitude to the
contributions and assistance of UCF students Danielle Barnhill, Paul Biscardi, Andrea Cumming,
Carlyn Higgins, Samantha Jeffery, Samantha Meyers, Tiffany Miller, Erin Reed, Angie Rodriguez,
Tyler Smith, Benjamin Yoakum, and David Yonge.
The author would like to sincerely thank the DZSP21 laboratory staff in Santa Rita, Guam for their
time and efforts throughout this study. Special thanks to the Naval Facilities Engineering
Command (NAVFAC), especially Maria Lewis, for allowing UCF to conduct research for the
Navy Water Treatment Plant (NWTP) in Santa Rita, Guam. Thank you to Brown & Caldwell
(Honolulu, HI), specifically Doug Lee and Bill Persich for their guidance throughout the course of
this research project.
vi
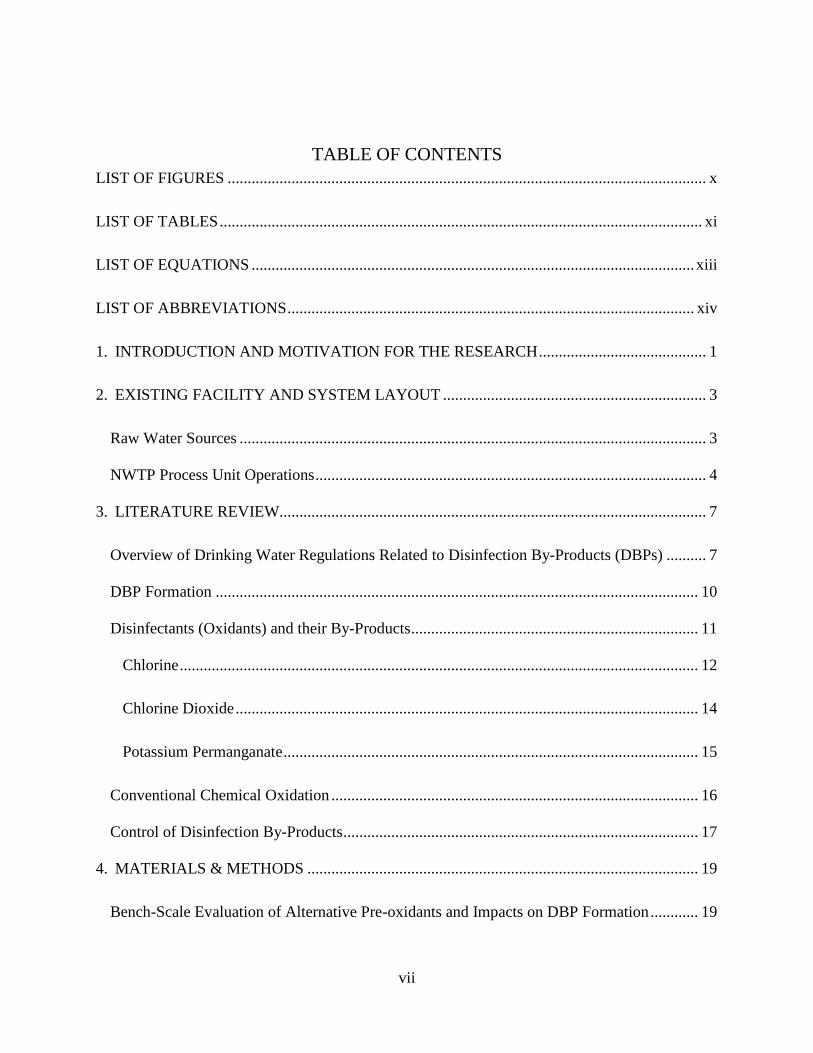
TABLE OF CONTENTS LIST OF FIGURES ........................................................................................................................ x
LIST OF TABLES ......................................................................................................................... xi
LIST OF EQUATIONS ............................................................................................................... xiii
LIST OF ABBREVIATIONS ...................................................................................................... xiv
1. INTRODUCTION AND MOTIVATION FOR THE RESEARCH .......................................... 1
2. EXISTING FACILITY AND SYSTEM LAYOUT .................................................................. 3
Raw Water Sources ..................................................................................................................... 3
NWTP Process Unit Operations .................................................................................................. 4
3. LITERATURE REVIEW........................................................................................................... 7
Overview of Drinking Water Regulations Related to Disinfection By-Products (DBPs) .......... 7
DBP Formation ......................................................................................................................... 10
Disinfectants (Oxidants) and their By-Products ........................................................................ 11
Chlorine .................................................................................................................................. 12
Chlorine Dioxide .................................................................................................................... 14
Potassium Permanganate ........................................................................................................ 15
Conventional Chemical Oxidation ............................................................................................ 16
Control of Disinfection By-Products ......................................................................................... 17
4. MATERIALS & METHODS .................................................................................................. 19
Bench-Scale Evaluation of Alternative Pre-oxidants and Impacts on DBP Formation ............ 19
vii

Overview of the Experimental Plan ....................................................................................... 19
Sample Collection .................................................................................................................. 21
Tests, Methods, Equipment, and Preservation ....................................................................... 21
Chemicals and Reagents ........................................................................................................ 23
Fena Lake Dosing in Jar Testing Unit .................................................................................... 26
Coagulation, Flocculation, Sedimentation, and Filtration (CSF) ........................................... 28
Dosing at the Clearwell .......................................................................................................... 29
DBP Formation Potentials ...................................................................................................... 29
System Management Experimental Plan ................................................................................... 31
In-Plant DBP Analysis at the NWTP Clearwell and Distribution System Pre and Post-chlorine
Shutoff .................................................................................................................................... 31
Fluoride Tracer Study ............................................................................................................ 32
BFC Study for Severe Weather Conditions ........................................................................... 33
Analytical Testing Locations .................................................................................................... 33
Field and Laboratory Quality Control ....................................................................................... 33
Accuracy ................................................................................................................................ 34
Precision ................................................................................................................................. 35
5. RESULTS & DISCUSSION .................................................................................................... 37
Alternative Pre-oxidant Study Results for DBP Removal ........................................................ 37
DBP Formation Potentials for Alternative Pre-oxidant Study .................................................. 39
viii
DBP Formation at the NWTP and Distribution System with and without Prechlorination ...... 42
Fluoride Tracer Study Results ................................................................................................... 45
Ballasted Floc Clarifier In-Series .............................................................................................. 46
Quality Control Results ............................................................................................................. 46
6. CONCLUSIONS & RECOMMENDATIONS ........................................................................ 48
Conclusions ............................................................................................................................... 48
Recommendations ..................................................................................................................... 50
UCF TTHM DATA ...................................................................................... 52
UCF HAA5 DATA ....................................................................................... 59
CHLORITE AND CHLORATE DATA ....................................................... 64
WATER QUALITY DATA ......................................................................... 66
SYSTEM MANAGEMENT DBP DATA .................................................... 69
REFERENCES ............................................................................................................................. 71
ix

LIST OF FIGURES
Figure 2.1 NWTP process flow diagram ....................................................................................... 6
Figure 3.1 Schematic illustration of reactions of various oxidants with NOM and reduced inorganic substances (adapted from American Water Works Association, 2011) ....................................... 10
Figure 4.1 UCF bench-scale disinfection by-product study layout ............................................. 20
Figure 4.2 Siemens AC-10 chlorine dioxide generator ............................................................... 25
Figure 4.3 DBP jar testing equipment used for experimentation ................................................. 27
Figure 5.1 7-Day formation potential TTHM and HAA5 percent reduction relative to chlorine pretreatment for various pretreatment conditions ......................................................................... 39
Figure 5.2 TTHM formation potential for alternative pre-oxidant study .................................... 40
Figure 5.3 HAA5 formation potential for alternative pre-oxidant study ..................................... 41
Figure 5.4 Average chlorite and chlorate concentrations for the 1.1 mg/L ClO2 dose ................ 42
Figure 5.5 DBP concentrations at NWTP clearwell grab samples pre and post-chlorine shutoff 43
Figure 5.6 TTHM concentrations in the distribution system with and without prechlorination to illustrate the significant reduction in DBPs between 2011 and 2013 ........................................... 44
Figure 5.7 HAA5 concentrations in the distribution system with and without prechlorination to illustrate the significant reduction in DBPs between 2011 and 2013 ........................................... 44
Figure 5.8 Fluoride tracer study [8/30 – 9/8/2013] ...................................................................... 45
Figure 5.9 Control chart for TTHM accuracy .............................................................................. 47
Figure 5.10 Control chart for TTHM precision ........................................................................... 47
x

LIST OF TABLES
Table 3.1 Stage 1 D/DBP Rule regulated contaminants (American Water Works Association, 2011) ............................................................................................................................................... 8
Table 3.2 DBP precursor removal treatment technique requirements ............................................ 8
Table 3.3 Stage 1 vs. Stage 2 D/DBP Rule TTHM and HAA5 monitoring requirements ............. 9
Table 3.4 Oxidants and their application in water treatment (adapted from Crittenden et al., 2005)....................................................................................................................................................... 16
Table 3.5 Common oxidants, forms, and application methods (adapted from Crittenden et al., 2005) ............................................................................................................................................. 17
Table 4.1 Summary of analytical testing methods used for characterization of water samples .. 22
Table 4.2 Summary of chemicals used in DBP bench-scale experiments ................................... 23
Table 4.3 UCF bench-scale treatment DBP formation potential study ....................................... 30
Table 5.1 Summary of DBP data collected by experiment event ................................................. 38
Table 5.2 DBPs by location when running BFC in-series [10/09/2013] ..................................... 46
Table A.1 October 16, 2013 THM FP concentrations - Cl2 vs. KMnO4 ...................................... 53
Table A.2 October 28, 2013 THM FP concentrations - Cl2 vs. KMnO4 ...................................... 54
Table A.3 January 21, 2014 THM FP concentrations - Cl2 vs. KMnO4 ....................................... 55
Table A.4 June 17, 2014 THM FP concentrations - Cl2 vs. ClO2................................................. 56
Table A.5 July 7, 2014 THM FP concentrations - Cl2 vs. ClO2 ................................................... 57
Table A.6 July 7, 2014 THM FP concentrations - Cl2 vs. KMnO4 vs. ClO2 ............................... 58
Table B.1 June 16, 2014 HAA5 concentrations: Cl2 vs. KMnO4 vs. ClO2 ................................. 60
Table B.2 June 30, 2014 HAA5 concentrations: Cl2 vs. KMnO4 vs. ClO2 ................................. 61
xi

Table B.3 July 7, 2014 HAA5 concentrations: Cl2 vs. KMnO4 vs. ClO2 .................................... 62
Table B.4 August 4, 2014 HAA5 concentrations: Cl2 vs. KMnO4 vs. ClO2 ............................... 63
Table C.1 Chlorate and chlorite concentrations for 1.1 mg/L ClO2 pre-oxidant dose.................. 65
Table D.1 Water quality data ........................................................................................................ 67
Table E.1 Clearwell DBP data ...................................................................................................... 70
Table E.2 Distribution system DBP data ...................................................................................... 70
Table E.3 Fluoride tracer study ..................................................................................................... 70
xii
LIST OF EQUATIONS
3-1 ................................................................................................................................................. 12
3-2 ................................................................................................................................................. 12
3-3 ................................................................................................................................................. 12
3-4 ................................................................................................................................................. 12
3-5 ................................................................................................................................................. 14
3-6 ................................................................................................................................................. 14
4-1 ................................................................................................................................................. 28
4-2 ................................................................................................................................................. 28
4-3 ................................................................................................................................................. 34
4-4 ................................................................................................................................................. 34
4-5 ................................................................................................................................................. 35
4-6 ................................................................................................................................................. 35
4-7 ................................................................................................................................................. 35
4-8 ................................................................................................................................................. 35
4-9 ................................................................................................................................................. 36
xiii

LIST OF ABBREVIATIONS
ACS American Chemical Society AEL Advanced Environmental Laboratories, Inc. alum aluminum sulfate B1285 Building 1285 BFC ballasted floc clarifier BrO3
- bromate °C degree(s) Celsius CaCO3 calcium carbonate Ca(OCl)2 calcium hypochlorite CCl3COOH trichloroacetic acid CECE Civil, Environmental, and Construction Engineering CHBrCl2 bromodichloromethane CHBr2Cl dibromochloromethane CHBr3 bromoform CHCl2COOH dichloroacetic acid CHCl3 chloroform CH2BrCOOH monobromoacetic acid CHBr2COOH dibromoacetic acid CH2ClCOOH monochloroacetic acid Cl- chloride ion Cl2 chlorine ClO2 chlorine dioxide ClO2
- chlorite ClO3
- chlorate CSF coagulation, flocculation, sedimentation and filtration Ct product of chlorine residual concentration and contact time D/DBP disinfectants/disinfection by-products DBPs disinfection byproducts DOC dissolved organic carbon EDA ethylenediamine EDTA ethylenediaminetetraacetic acid FAC free available chlorine Fe iron FP formation potential ft feet g grams
xiv

g/L grams per liter GAC granular activated carbon GC gas chromatography HAAs haloacetic acids HAA5 five haloacetic acids HOBr hypobromous acid HOCl hypochlorous acid IDSE initial distribution system evaluation KMnO4 potassium permanganate L liter lbs pounds LCL/LWL lower control limit/lower warning limit LRAA locational running annual average MCL maximum contaminant level mg/L milligrams per liter MG/MGD million gallons/million gallons per day mL milliliter Mn manganese MRDL maximum residual disinfectant level MRDLG maximum residual disinfectant level goal MTBE methyl tertiary-butyl ether NA not applicable Na2SO3 sodium sulfite NaOCl sodium hypochlorite NAVFAC Naval Facilities Engineering Command NF nanofiltration NH2Cl chloramine NH4
+ ammonium NH4Cl ammonium chloride NOM natural organic matter NTU nephelometric turbidity unit NWTP Navy Water Treatment Plant O3 ozone OCl- hypochlorite ion OH- hydroxide PLC programmable logic controller
xv

PWS public water system RAA running annual average RO reverse osmosis RPD relative percent difference rpm revolutions per minute S2- sulfide SDWA Safe Drinking Water Act SG specific gravity SM standard methods THMs trihalomethanes TOC total organic carbon TTHMs total trihalomethanes UCF University of Central Florida UCL/UWL upper control limit/upper warning limit USEPA United States Environmental Protection Agency UV ultraviolet WTP water treatment plant µg/L micrograms per liter
xvi

1. INTRODUCTION AND MOTIVATION FOR THE RESEARCH
Disinfection of drinking water inactivates pathogenic bacteria and viruses and has effectively
controlled biological waterborne disease outbreaks where employed. However, disinfectants react
with natural organic matter (NOM) and inorganics present in source water and distribution systems
to form regulated and non-regulated disinfection by-products (DBPs), including several that are
known carcinogens, and many others whose toxicity are unknown (Crittenden, Trussell, Hand,
Howe, & Tchobanoglous, 2005). The United States Environmental Protection Agency (USEPA)
requires community water systems to comply with the Safe Drinking Water Act’s (SDWA’s) Stage
2 Disinfectants and Disinfection By-Product (D/DBP) Rule to improve public health protection by
limiting the consumer’s exposure to regulated DBPs. According the USEPA (2006), the Stage 2
D/DBP rule builds upon earlier DBP rules by tightening compliance monitoring requirements for
DBPs, including total trihalomethanes (TTHM) and five haloacetic acids (HAA5).
The U.S. Navy owns and operates its Navy Water Treatment Plant (NWTP) on the volcanic island
of Guam located in the Marianas Islands. The NWTP is a conventional treatment plant that treats
surface water from Fena Lake, Almagosa Spring, and Bona Spring using a coagulation,
flocculation, sedimentation, and filtration (CSF) process. A review of water quality data by Brown
and Caldwell (2014) demonstrated that numerous locations within the U.S. Navy’s public water
system (PWS) regularly exceeded the maximum contaminant levels (MCLs) for DBPs between
2009 and 2012.
In 2013 the Naval Facilities Engineering Command (NAVFAC) requested that the University of
Central Florida (UCF) help the U.S. Navy’s by conducting research to better understanding DBP
1

formation chemistry within the Guam PWS. The Navy directed the University to work with its
retained professional engineering firms to study alternative means to reduce DBP levels
throughout the Navy’s PWS on the island of Guam.
The primary motivation behind the research reported herein was to evaluate the alternative
oxidants, potassium permanganate (KMnO4) and chlorine dioxide (ClO2), for use in treating Fena
Lake in lieu of gaseous chlorine (Cl2) pretreatment as a means to avoid the formation of
trihalomethanes (THMs) and haloacetic acids (HAAs) in the Navy’s PWS. The second component
of research assessed system operations and management alternatives to reduce DBP formation at
the NWTP and throughout the water distribution system. This was achieved through a series of
studies performed in Guam that addressed three concerns: (1) the NWTP’s compliance with the
Stage 2 D/DBP, (2) variable hydraulic detention times within a small subdivision in the distribution
system registering increased levels of DBPs, and (3) impacts of severe weather conditions and
subsequent effects on the NWTP. UCF was to evaluate alternative means to achieve measurable
reductions in DBPs throughout the Navy PWS and provide recommend solutions in order that the
Navy can achieve compliance with the D/DBP Rule. UCF was also tasked to evaluate interim
solutions that may include changes to operational methods, implementation of treatment process
changes, and/or other improvements that will achieve full compliance with Stage 2 D/DBP Rules.
2

2. EXISTING FACILITY AND SYSTEM LAYOUT
This chapter provides an overview of the Navy’s raw water sources, NWTP configuration,
operations, and water distribution system located on the island of Guam, as these descriptions
relate to aspects of the facilities that are pertinent to DBP concerns.
Raw Water Sources
The U.S. Navy’s PWS on the volcanic island of Guam is located in the western Pacific Ocean. The
Fena Valley watershed of the Naval Magazine, a secure military compound, provides water to
most naval facilities, in addition to some civilian communities. To supplement the primary water
sources, the northern distribution system also has groundwater wells (Brown and Caldwell, 2014).
The raw water sources for the NWTP include Fena Valley Reservoir (Fena Lake), Almagosa
Spring, and Bona Spring. Fena Lake is located in an inactive volcano crater and has a storage
capacity of 2.1 billion gallons. The drainage area above the dam is six square miles of moderately
to steeply sloped lands, heavy in jungle growth and covered with a variety of grasses (Boyle
Engineering Corporation, 2001). Water from these southern volcanic areas of Guam tend to be
soft, low in alkalinity, low in soluble minerals, and high in organics. Fena Lake supplies
approximately 63% (8 million gallons per day (MGD)) to the Navy’s water system (Boyle
Engineering Corporation, 2001). Raw water from Fena Lake is typically withdrawn through a
constructed screen house complex at a 12-foot (ft) depth, however the intake structure can be
utilized at depths of up to 50 feet.
3

The Almagosa Spring supply is from the Upper Dobo, Lower Dobo, and Chepek springs and
supplies approximately 22% (2.9 MGD) to the water system. Bona Spring discharges from two
springs within limestone caverns supplying approximately 15% (1.9 MGD) to the water system
(Boyle Engineering Corporation, 2001). Raw water from the reservoir and the springs is pumped
to, and treated by, the U.S. Navy’s conventional surface water treatment plant. Springflow is highly
dependent upon rainfall, and the yield from both springs may vary from 0.5 MGD throughout the
dry season to 3 MGD during the wet season. A series of low limestone formation hills act as natural
water storage reservoirs permitting recharge to the springs (Boyle Engineering Corporation, 2001).
NWTP Process Unit Operations
The NWTP is a conventional surface water treatment plant that treats the combination of Fena
Lake water, Almagosa Spring, and Bona Spring. The water treatment plant is designed to produce
13.5 MGD of potable water. According to the U.S. Navy, the water treatment production varies
from 10.5 MGD to 12.5 MGD during the wet and dry seasons, respectively. The raw water sources
and key unit operations of the Navy’s PWS are depicted in Figure 2.1.
A chlorine chemical feed point is located at the Fena Lake Pump Station’s Building 1285 (B1285).
The water is processed through conventional water treatment which includes coagulation,
flocculation, and sedimentation. The Navy uses aluminum sulfate (alum) as the coagulant, adds
lime for pH adjustment and polymer (as needed) for enhanced coagulation during the rapid mix
phase of the process. There is a chlorine chemical feed location at the rapid mix location. The
coagulation, flocculation, and sedimentation process is operated as a combined-unit operation as
the Navy operates two clarifiers: a conventional CSF solids-contact process as previously
4

described and a ballasted floc clarifier (BFC). These two clarifiers can be operated either in parallel
or series configuration, depending on season, demand, and water quality (e.g. turbidity levels
entering plant).
After the clarification process, there is a chlorine chemical feed point prior to filtration. The water
is filtered through six dual-media, anthracite-sand filters, followed by post-filter fluoridation, and
disinfection with ultraviolet (UV) and sodium hypochlorite. The finished water continues to a
rectangular, dual-compartment, 1.06-million-gallon (MG), baffled clearwell to achieve contact
time (Ct) requirements. Finished water is distributed between the Naval Magazine (0.72 MG),
Maanot (0.59 MG), Apra Heights (0.5 MG) and Tupo (5.0 MG) reservoirs. From these primary
finished water storage reservoirs, potable water is distributed to secondary reservoirs and
throughout the Navy’s water distribution system.
In January 2013 the U.S. Navy retained Brown & Caldwell (Honolulu, HI) and the UCF Civil,
Environmental, and Construction Engineering (CECE) department to conduct research to
investigate iron, manganese and DBP water quality issues within the Navy’s Guam PWS. Early
results showed that prechlorination significantly contributed to the formation of DBPs. Based on
UCF’s initial findings as reported in Hall (2014), the U.S. Navy ceased prechlorination at Fena
Lake as well as at the rapid mix and post-filter chemical feed locations on August 28, 2013 (Hall,
2014). Additional discussion related to the significance of this decision and its impact on research
activities is discussed herein.
5

Figure 2.1 NWTP process flow diagram
6
3. LITERATURE REVIEW
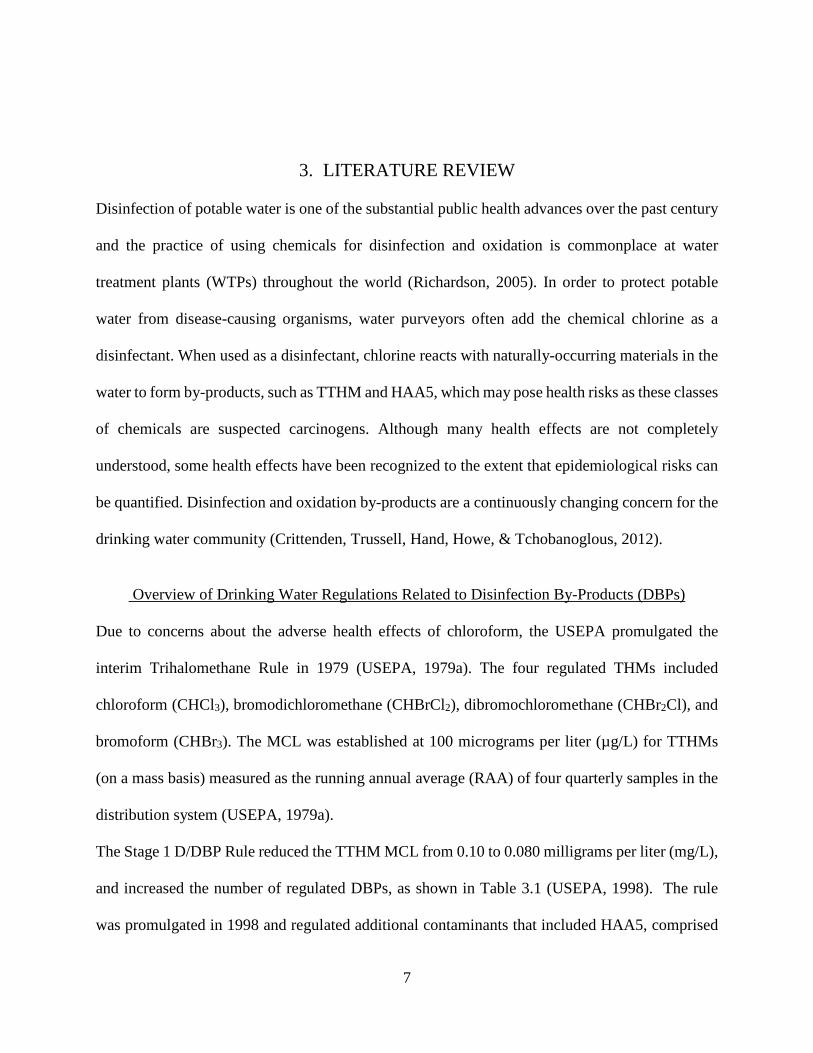
Disinfection of potable water is one of the substantial public health advances over the past century
and the practice of using chemicals for disinfection and oxidation is commonplace at water
treatment plants (WTPs) throughout the world (Richardson, 2005). In order to protect potable
water from disease-causing organisms, water purveyors often add the chemical chlorine as a
disinfectant. When used as a disinfectant, chlorine reacts with naturally-occurring materials in the
water to form by-products, such as TTHM and HAA5, which may pose health risks as these classes
of chemicals are suspected carcinogens. Although many health effects are not completely
understood, some health effects have been recognized to the extent that epidemiological risks can
be quantified. Disinfection and oxidation by-products are a continuously changing concern for the
drinking water community (Crittenden, Trussell, Hand, Howe, & Tchobanoglous, 2012).
Overview of Drinking Water Regulations Related to Disinfection By-Products (DBPs)
Due to concerns about the adverse health effects of chloroform, the USEPA promulgated the
interim Trihalomethane Rule in 1979 (USEPA, 1979a). The four regulated THMs included
chloroform (CHCl3), bromodichloromethane (CHBrCl2), dibromochloromethane (CHBr2Cl), and
bromoform (CHBr3). The MCL was established at 100 micrograms per liter (µg/L) for TTHMs
(on a mass basis) measured as the running annual average (RAA) of four quarterly samples in the
distribution system (USEPA, 1979a).
The Stage 1 D/DBP Rule reduced the TTHM MCL from 0.10 to 0.080 milligrams per liter (mg/L),
and increased the number of regulated DBPs, as shown in Table 3.1 (USEPA, 1998). The rule
was promulgated in 1998 and regulated additional contaminants that included HAA5, comprised
7

of monochloroacetic acid (CH2ClCOOH), dichloroacetic acid (CHCl2COOH), trichloroacetic acid
(CCl3COOH), monobromoacetic acid (CH2BrCOOH), and dibromoacetic acid (CHBr2COOH).
The Stage 1 D/DBP Rule also established maximum residual disinfectant levels (MRDLs),
maximum residual disinfectant level goals (MRDLGs), and included a provision for surface water
systems to meet DBP precursor removal requirements. Table 3.1 presents a summary of the key
provisions of the Stage 1 D/DBP Rule, listing the type of DBP, its MCL, MRDL and MRDLG.
Table 3.2 presents the mandatory DBP precursor (total organic carbon (TOC)) removal goals for
varying TOC levels as a function of alkalinity as summarized in the Stage 1 D/DBP Rule.
Compliance with the updated and revised MCLs began in January 2002 (USEPA, 1998).
Table 3.1 Stage 1 D/DBP Rule regulated contaminants (American Water Works Association, 2011)
Regulated Contaminant MCL (mg/L) By-product of MRDL (mg/L) MRDLG
(mg/L) TTHM 0.080 Chlorine 4.0 (as Cl2) 4.0 (as Cl2)
HAA5 0.060 Chlorine 4.0 (as Cl2) 4.0 (as Cl2)
Bromate (BrO3-) 0.010 Ozone NA NA
Chlorite (ClO2-) 1.0 Chlorine dioxide 0.8 (as ClO2) 0.8 (as ClO2)
NA = not applicable
Table 3.2 DBP precursor removal treatment technique requirements
Source water TOC (mg/L)
Source water alkalinity (mg/L as CaCO3) 0-60 > 60 -120 > 120
> 2.0 to 4.0 35.0% 25.0% 15.0% > 4.0 to 8.0 45.0% 35.0% 25.0% > 8.0 50.0% 40.0% 30.0%
8

The Stage 2 D/DBP Rule was promulgated by the USEPA in January 2006 to further reduce the
consumer’s exposure to DBPs without compromising the control of microbial pathogens (USEPA,
2006). The Stage 2 D/DBP Rule requires water treatment utilities to complete an initial distribution
system evaluation (IDSE). The IDSE is used to identify the locations throughout the system with
the highest DBP concentrations and evaluate compliance via a locational running annual average
(LRAA) (USEPA, 2006). Table 3.3 provides a summary of the difference in monitoring
requirements between the Stage 1 and Stage 2 D/DBP Rule.
Table 3.3 Stage 1 vs. Stage 2 D/DBP Rule TTHM and HAA5 monitoring requirements
Elements Stage 1 D/DBP Rule Stage 2 D/DBP Rule
Consecutive system
Must monitor if the system provides any type of disinfection other than UV. No monitoring requirement if only the wholesale system provides treatment.
Must monitor if the system provides water treated with any type of disinfectant other than UV.
Number of samples
Based on population served, source water type and number of plants.
Based only on population served and source water type.
Sample locations
Locations representing maximum residence time in the distribution system. Larger system may include locations of average residence time.
Locations of highest TTHM and HAA5 averages as determined during the IDSE.
Determination of MCL compliance
Based on RAA or the average of four consecutive quarters of samples taken in the distribution system for TTHM and HAA5.
Based on LRAA or the average of four consecutive quarters of samples taken at each specific sampling location within the distribution system for TTHM and HAA5.
Monitoring frequency
System must conduct monitoring every quarter.
System must conduct monitoring every 90 days.
9

DBP Formation
The chemical by-products of the DBPs themselves are of particular interest in water treatment.
DBPs are formed when disinfectants react with species naturally present in the water, particularly
NOM and inorganic species. Some of this NOM is highly reactive with a wide range of oxidants.
The reaction products include reduced forms of the oxidants (e.g., chloride, hydroxide, and chlorite
when using chlorine, ozone, and chlorine dioxide, respectively) and oxidized forms of the organic
or inorganic reactants (e.g., bromate), as presented in Figure 3.1 (American Water Works
Association, 2011).
Figure 3.1 Schematic illustration of reactions of various oxidants with NOM and reduced inorganic
substances (adapted from American Water Works Association, 2011)
The sites of disinfectant (oxidant) attack on NOM are often carbon-carbon double bonds and
reduced heteroatoms (e.g., nitrogen and sulfur). The organic by-products formed are more highly
oxidized, often containing more oxygen atoms. As the extent of the reaction increases, organic
10

matter becomes more fragmented, and the specific by-products are simpler in structure (American
Water Works Association, 2011).
Several of the disinfectants are capable of producing by-products that have halogen atoms (i.e.,
chlorine, bromine, and iodine) incorporated into their structure. Aqueous chlorine and bromine do
this to the greatest extent, followed by chloramines and ozone. Aqueous chlorine, chloramines,
and ozone are capable of oxidizing naturally occurring bromide to form active bromine (i.e.,
hypobromous acid (HOBr) or bromamines). The latter will react with NOM to form brominated
organic compounds (e.g., bromoform and dibromoacetic acid) and, in the presence of free chlorine,
mixed bromochloro-organics. The same is true with respect to the formation of iodinated DBPs in
the presence of iodide, although iodinated DBPs tend to be found only in chloraminated waters
(American Water Works Association, 2011).
Formation potentials (FPs) are an analysis of the capability of DBPs to form in water under
controlled conditions. The analysis is conducted with predefined conditions to produce the
maximum target DBP concentrations (Crittenden et al., 2012).
There are many factors that influence the formation of DBPs. Among them are contact time,
temperature, pH, precursor type and concentration, disinfectant type and concentration, the ratio
of oxidant to precursor, and concentrations of bromide and nitrogen (Connell, 1996).
Disinfectants (Oxidants) and their By-Products
Although hundreds of specific compounds have been identified as DBPs, only chlorination and
chlorine dioxide by-products will be addressed in detail because they were the focus of this
11

research. Potassium permanganate is introduced as a pre-oxidant, but does not produce by-
products.
Chlorine
Chlorine is the most commonly used oxidant and disinfectant in water treatment practice. Chlorine
is available in gaseous form (as Cl2), as a concentrated aqueous solution (sodium hypochlorite,
NaOCl, i.e., bleach), or as a solid (calcium hypochlorite, Ca(OCl)2), or it can be electrolytically
generated on-site (American Water Works Association, 2011). When water is dosed with chlorine
gas, the chlorine quickly disproportionates to form hypochlorous acid (HOCl) and the chloride ion
(Cl-), as presented in Equation 3-1. Hypochlorous acid is a weak acid (pKa = 7.6 at 25°C) that can
transfer a proton to form the hypochlorite ion (OCl-), as shown in Equation 3-2 (American Water
Works Association, 2011).
Cl2 + H2O HOCl + H+ + Cl- (3-1)
HOCl = H+ + OCl- (3-2)
The sum of Cl2, HOCl, and OCl- is frequently referred to as free available chlorine (FAC), and the
concentrations of each species and their sum are most often expressed in the units of mg/L as Cl2.
If chlorine is added to water as liquid sodium hypochlorite, the following reactions occur:
NaOCl Na+ + OCl- (3-3)
OCl- + H2O = HOCl + OH- (3-4)
The relative distribution of HOCl and OCl- that results from the addition of sodium hypochlorite
will be determined by pH, temperature, and the total chlorine concentration. Chlorine gas produces
12

an acidic reaction which lowers the pH of the solution, whereas sodium hypochlorite is a base
which will raise the pH of the water. The alkalinity of the water will impact the amount of change
in the pH. The change of pH is likely to be fairly small due to low doses of chlorine are often used.
Hypochlorous acid and the hypochlorite ion are both strong oxidizing agents, but HOCl is the
stronger of the two. Hence, in general, oxidation reactions of chlorine are usually more effective
at low pH values “unless the reactant exhibits pH-dependent behavior as in the case of phenol”
(American Water Works Association, 2011).
The chlorination by-products include a wide range of halogenated and non-halogenated organic
compounds. THMs and HAAs are end products of the reaction of chlorine with organic matter.
There are four types of THMs and nine types of HAAs. According to the American Water Works
Association (2011), waters with low bromide levels will produce the fully chlorine-substituted
forms as the predominate species (e.g., chloroform and di- and trichloroacetic acid). Waters with
high levels of bromide are likely to contain elevated levels of the bromide-containing analogues
(e.g., bromoform and dibromoacetic acid) following chlorination. Waters with moderate levels of
bromide will contain the mixed bromo/chloro analogues (e.g., bromodichloromethane and
bromodichloroacetic acid) (American Water Works Association, 2011).
Given THMs volatility, chemical stability, and high halogen-carbon ratio, this class of compounds
could be easily analyzed and were the first by-products to be found in finished drinking waters
(Rook, 1974) (Bellar & Lichtenberg, 1974). The discovery of HAAs in chlorinated drinking water
systems (Miller & Uden, 1983) and subsequent occurrence studies followed far behind the
developed knowledge of THM studies by several years.
13
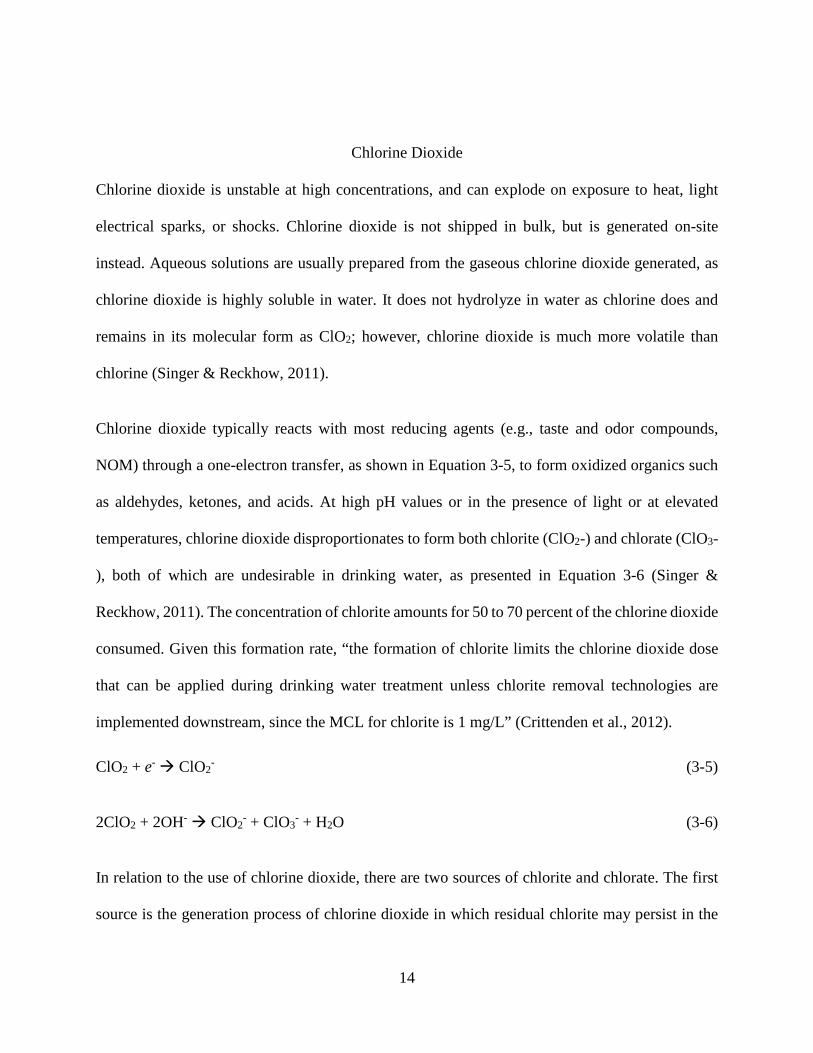
Chlorine Dioxide
Chlorine dioxide is unstable at high concentrations, and can explode on exposure to heat, light
electrical sparks, or shocks. Chlorine dioxide is not shipped in bulk, but is generated on-site
instead. Aqueous solutions are usually prepared from the gaseous chlorine dioxide generated, as
chlorine dioxide is highly soluble in water. It does not hydrolyze in water as chlorine does and
remains in its molecular form as ClO2; however, chlorine dioxide is much more volatile than
chlorine (Singer & Reckhow, 2011).
Chlorine dioxide typically reacts with most reducing agents (e.g., taste and odor compounds,
NOM) through a one-electron transfer, as shown in Equation 3-5, to form oxidized organics such
as aldehydes, ketones, and acids. At high pH values or in the presence of light or at elevated
temperatures, chlorine dioxide disproportionates to form both chlorite (ClO2-) and chlorate (ClO3-
), both of which are undesirable in drinking water, as presented in Equation 3-6 (Singer &
Reckhow, 2011). The concentration of chlorite amounts for 50 to 70 percent of the chlorine dioxide
consumed. Given this formation rate, “the formation of chlorite limits the chlorine dioxide dose
that can be applied during drinking water treatment unless chlorite removal technologies are
implemented downstream, since the MCL for chlorite is 1 mg/L” (Crittenden et al., 2012).
ClO2 + e- ClO2- (3-5)
2ClO2 + 2OH- ClO2- + ClO3
- + H2O (3-6)
In relation to the use of chlorine dioxide, there are two sources of chlorite and chlorate. The first
source is the generation process of chlorine dioxide in which residual chlorite may persist in the
14

product solution if exceptionally high concentrations of sodium chlorite are used in the generator
and are then injected into the process stream with the chlorine dioxide (Crittenden et al., 2012).
The second source of chlorite and chlorate is formation as a by-product of the chlorine dioxide
disinfection and oxidation reactions.
The primary application of chlorine dioxide has been for taste and odor control, although it is also
an effective oxidant for reduced iron and manganese and is a primary disinfectant. One of the
principal advantages of chlorine dioxide is that it does not react with ammonia. Hence, much lower
doses of chlorine dioxide are required for most oxidative applications compared to chlorine dosage
requirements. Another advantage is that chlorine dioxide does not enter into substitution reactions
with NOM to the same degree that free chlorine does and, accordingly, does not form
trihalomethanes, haloacetic acids, or most other commonly observed halogenated disinfection by-
products that result from chlorination, at least not to any appreciable extent. Chlorine dioxide
reacts only very slowly with bromide. Hence, brominated by-products, either organic or inorganic
are not a concern following treatment with chlorine dioxide (Singer & Reckhow, 2011).
Potassium Permanganate
Potassium permanganate is an alternative to chlorine for oxidation at water treatment plants, and
according to Crittenden and coworkers (2012) has proven effective for the control of iron (Fe),
manganese (Mn), and sulfide (S2-). Potassium permanganate forms less THMs and HAAs than
chlorine when used as a pre-oxidant and is not known to produce regulated by-products. However,
KMnO4 is a weak disinfectant, so additional chemical disinfection is often needed and may result
in DBP formation (Crittenden et al., 2012).
15

Conventional Chemical Oxidation
Oxidation is the reaction between two chemicals in which an exchange of electrons between one
chemical and the chemical being oxidized takes place (Connell, 1996). Oxidation is often used in
municipal drinking water treatment to treat aesthetic qualities such as color, taste, and odor that
affect the consumer perception and acceptance of a water (Crittenden et al., 2012).
The three oxidants evaluated in this research (chlorine, potassium permanganate, and chlorine
dioxide), and their corresponding applications, are summarized in Table 3.4. The forms and
application methods of chlorine, chlorine dioxide, and potassium permanganate are described in
Table 3.5. Additional oxidants that are often used in water treatment include, but are not limited
to, ozone, monochloramine, and hydrogen peroxide. The oxidants are often added at the beginning
(e.g. pre-oxidation) or end (e.g. disinfection) of the water treatment process; however, oxidants
can also be added at various intermediate points (Crittenden et al., 2005).
Table 3.4 Oxidants and their application in water treatment (adapted from Crittenden et al., 2005)
Purpose Oxidants Applications Oxidation of reduced inorganic species
Chlorine, permanganate, chlorine dioxide
Convert soluble metals such as Fe (II) and Mn (II) to insoluble forms; oxidize odorous sulfide; destroy metal organic complexes
Oxidation of organics
Permanganate, chlorine dioxide
Destroy taste-and odor-causing compounds; destroy toxic organics [e.g., pesticides, benzene, trichloroethene, methyl tertiary-butyl ether (MTBE)]; eliminate color; reduce natural organic matter and disinfection by-product precursors
Biocidal agents Chlorine Control nuisance growths such as algae in pretreatment basin or reservoirs; as primary disinfectants to meet Cta regulations
a Ct = product of chlorine residual concentration (mg/L) and contact time (min).
16

Table 3.5 Common oxidants, forms, and application methods (adapted from Crittenden et al., 2005)
Oxidant Forms Application Methods Chlorine, free Chlorine gas, sodium hypochlorite
solution Gas eductors and spray jets
Chlorine dioxide
Chlorine dioxide gas produced on-site using 25 percent sodium chlorite solution reacted with gaseous chlorine, aqueous chlorine, or acid
Gas eductors
Permanganate Available in bulk as granules Added as dry chemical using feeder or as concentrated solution (no more than 5% by weight)
Control of Disinfection By-Products
There are numerous approaches to control DBP concentrations. Many efforts have focused on
changing the type of the disinfectant. Reducing the disinfectant use to minimize DBP formation
has proved to be effective; however, doing so has direct implications for increasing the risk of
illness from microbial contamination. Other alternatives to control DBP concentrations have been
done by changing from free chlorine to ozone or UV primary disinfection and from free chlorine
to chloramination for secondary disinfection. Potassium permanganate pretreatment was found to
reduce the formation potential of chloroform. As the amount of permanganate consumption
increased, chloroform reduction increased as well (Colthurst & Singer, 1982). Permanganate
addition and chloramination was found to reduce DBPs below 20 µg/L in a study (Nnadi,
Hernandez, & Fulkerson, 2004). A study on the formation of DBPs after pre-oxidation with
chlorine dioxide resulted in a 45% reduction in THM formation potentials (Yang et al., 2013).
However, if the use of alternative disinfectants is not viable, as would be in the case of coastal
estuarine environments, then another method is to minimize DBP formation by removing organic
17
precursor material prior to the point of disinfection is evaluated. Consequently, optimizing the
coagulation process for removal of both TOC and particles (turbidity) becomes an effective
strategy as has been demonstrated by enhanced coagulation experiences in the drinking water
community (Matilainen, Vepsäläinen, & Sillanpää, 2010) (USEPA, 1999).
Removing DBPs after their formation is most appropriate for control of biodegradable by-products
and possibly for removal of highly volatile DBPs such as chloroform (American Water Works
Association, 2011). Results from a study showed that air stripping greatly reduced the required
amount of disinfectant and removed THMs (Nnadi et al., 2004). Results from an additional study
showed a high efficacy of chlorite removal on granular activated carbon (GAC) filters (Ranieri &
Swietlik, 2010).
Removing DBPs after their formation is limited and can be costly if membranes are required
(Duranceau & Taylor, 2010). The removal of DBP precursors or dissolved organic carbon (DOC)
by reverse osmosis (RO) or nanofiltration (NF) has been studied extensively (Jones & Taylor,
1992; Taylor, Mulford, Barrett, Duranceau, & Smith, 1989; Taylor, Mulford, Duranceau, &
Barrett, 1989). Nanofiltration membranes have been shown to control THM formation potential in
highly organic (>10 mg/L DOC) potable water sources (Taylor et al., 1986). These efforts have
often been necessitated by inadequate efficiency of DBP removal using conventional coagulation
and softening treatment processes (Duranceau & Taylor, 2010).
18

4. MATERIALS & METHODS
This chapter initially describes the experimental plan, testing locations, tests, materials, chemicals,
and procedures used to conduct the bench-scale evaluation of the alternative pre-oxidants study.
Additionally, the experimental plan for the treatment and distribution system operations and
management alternatives analysis component of work is described. This second component of
research consisted of a series of studies designed to identify opportunities that could achieve DBP
reduction within the PWS. The methods and procedures used in both components work were
developed to aid UCF research activities in support of the overall study. This chapter also provides
a description of the methods used to obtain existing database information, third-party sources,
laboratory procedures and field activities, or compiled from computerized databases (should they
exist).
Bench-Scale Evaluation of Alternative Pre-oxidants and Impacts on DBP Formation
Overview of the Experimental Plan
Raw surface water from Fena Lake was collected by the U.S. Navy and shipped to UCF
laboratories for evaluation and analysis. Bench-scale jar tests that simulated the conventional
NWTP were used to evaluate several pretreatment scenarios, namely 1) no pretreatment, 2)
chlorine pretreatment 3) potassium permanganate pretreatment, and 4) chlorine dioxide
pretreatment. Assessing the DBPs formed in each of these scenarios would aid in the understanding
of DBP formation within the U.S. Navy’s PWS on Guam.
19
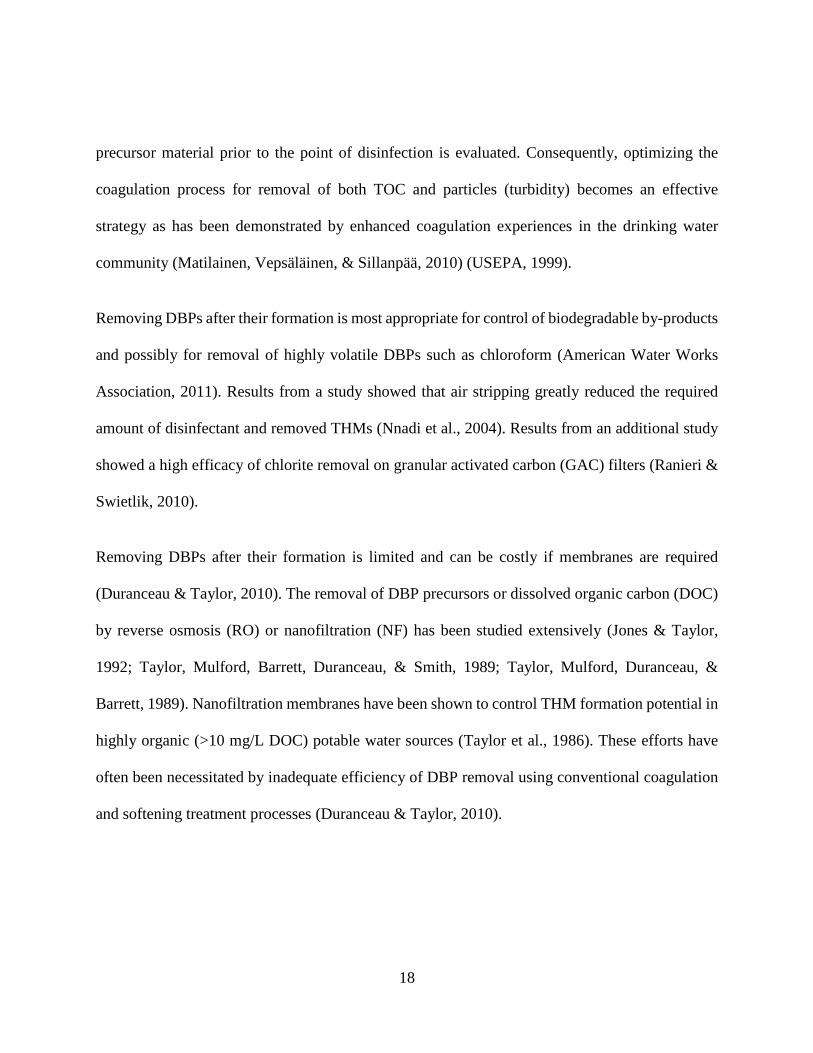
A schematic that presents an illustrative overview of the bench-scale study experimental design is
presented in Figure 4.1. In this plan, Fena Lake raw water was first disinfected with 1) no
pretreatment, 2) chlorine (NaClO), 3) potassium permanganate, and 4) chlorine dioxide. Then, the
water was disinfected at the rapid mix (for the chlorine dose condition only) followed by
coagulation, flocculation, sedimentation, filtration, and chlorine disinfection at the clearwell.
TTHM and HAA5 formation potential samples, in addition to chlorine residual samples, were
collected and incubated at 30°C to represent the distribution system. Water quality was taken
throughout the bench-scale experiments. Detailed descriptions of these procedures are provided in
the remainder of this section.
Figure 4.1 UCF bench-scale disinfection by-product study layout
20

Sample Collection
Raw water samples were collected from various depths of Fena Lake by the U.S. Navy and shipped
to UCF drinking water laboratories for experimentation between October 2013 and August 2014.
Sampling depths were determined by the NWTP and mimicked the full-scale system (usually
drawn at 12-foot depth). The water samples were collected in 1-L plastic amber bottles and were
shipped on ice for preservation until received at UCF. Samples were then stored in 4°C until the
experiments took place. Samples were collected and stored in accordance with Standard Methods
for the Examination of Water and Wastewater 1060 B. Collection of Samples and 1060 C. Sample
Storage and Preservation (American Public Health Association, American Water Works
Association, & Water Environment Federation, 2005) in addition to the Handbook for Analytical
Quality Control in Water and Wastewater Laboratories (USEPA, 1979b).
Tests, Methods, Equipment, and Preservation
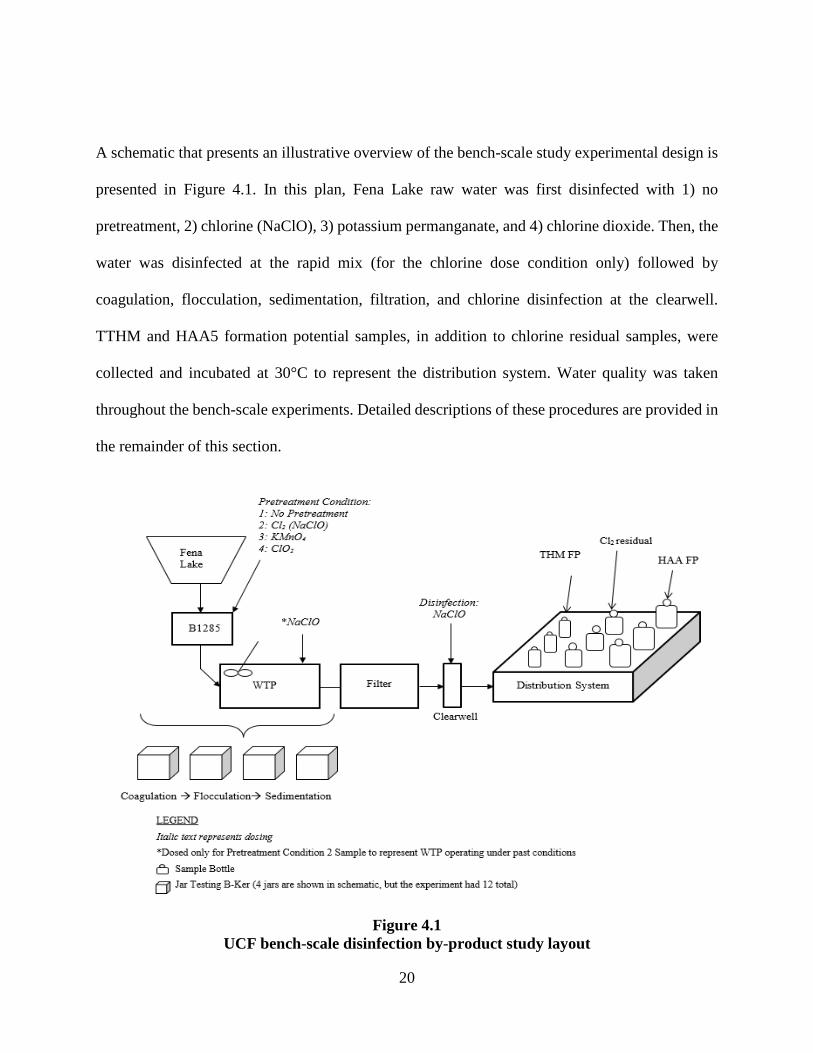
Table 4.1 provides a list of test locations, methods, detection levels, preservation techniques, and
holding times required for the tests used during this research. Analyses were conducted in the field
and in the laboratory. The method reference and the equipment used for each test is listed in Table
4.1 for reference. The preservation technique describes how the samples were preserved for the
specified test, unless the test had to be analyzed immediately (in which case the sample was not
preserved for later analysis). The holding time is the time in which the specified test can be
analyzed in; for example, the pH test should only be conducted within 0.25 hours holding time,
after which the sample should no longer be tested for pH, according to the method provided.
21
Table 4.1 Summary of analytical testing methods used for characterization of water samples
Test Test location Method/ equipment description Method
detection level Preservation
technique Holding
time
.pH UCF lab/field
SM: 4500-H+ B Electrometric Method/ HQ40d Portable pH, Conductivity, and Temperature Meter 0.01 pH Units Analyze
immediately 0.25 hours
Chlorine Dioxide (ClO2)
UCF lab HACH Method 8138: Chlorine Dioxide Direct Reading Method/ HACH Spectrophotometer DR5000 5 mg/L ClO2
Analyze immediately
0.25 hours
Chlorine (Cl2), free UCF lab HACH Method 8021:Chlorine, Free DPD Method/ HACH
Spectrophotometer DR5000 0.02 mg/L Cl2 Analyze
immediately 0.25 hours
Chlorate AEL EPA Method 300.1:Determination of Inorganic Anions in Drinking Water by Ion Chromatography/ Ion chromatograph 0.003 mg/L 50 mg/L EDA 28 days
Chlorite AEL EPA Method 300.1/ Ion chromatograph 0.01 mg/L 50 mg/L EDA; cool, 4 °C in the dark 14 days
Conductivity UCF lab/field
SM:2510 B Laboratory Method/ HQ40d Portable pH, Conductivity, and
Temperature Meter 0.01 μS/cm Analyze
immediately 0.25 hours
HAA5 AEL SM:5710C/ Agilent 6890N Network Gas Chromatograph 3 μg/L Analyze
immediately; or cool, 4oC in the dark
14 days
Temperature UCF lab/field
SM: 2550 B: Laboratory Method/ HQ40d Portable pH, Conductivity, and Temperature Meter 0.01 °C Analyze
immediately 0.25 hours
TOC UCF lab SM: 5310C: Persulfate-Ultraviolet Oxidation Method/ Tekmarr-Dohrmann Phoenix 8000: The UV-Persulfate TOC Analyzer 0.1 mg/L Cool, 4oC in the
dark 28 days
TTHM UCF lab SM: 6232 B: Liquid-Liquid Extraction Gas Chromatographic Method/ Agilent 6890N Network Gas Chromatograph 1 μg/L
Analyze immediately; or
cool, 4oC in the dark 14 days
Turbidity UCF lab/field
SM: 2130 B: Nephelometric Method/ HACH 2100q Portable Turbidimeter 0.01 NTU
Analyze immediately; or
cool, 4oC in the dark 48 hours
UV-254 UCF lab SM: 5910 B: Ultraviolet Absorption Method/ DR5000 0.01 cm-1 Analyze
immediately; or cool, 4oC in the dark
48 hours
SM = Standard Methods AEL = Advanced Environmental Laboratories , Inc. EDA = ethylenediamine
22

Chemicals and Reagents
Table 4.2 provides a list and a brief description of the chemicals used in the UCF bench-scale
component of work.
Table 4.2 Summary of chemicals used in DBP bench-scale experiments
Chemical Description
Aluminum sulfate (alum) Coagulant, SG = 1.34, dry weight = 48.5%
Ammonium chloride ACS grade – used for HAA analysis
Chlorine dioxide 1700 mg/L stock concentration
DPD free chlorine reagent Powder pillows – used for chlorine residual analysis
EDTA Used for chlorite and chlorate sample preservation
Hexane ACS grade – used for THM analysis
pH buffer solutions 4, 7, and 10 pH buffer solutions
Potassium permanganate ACS grade – solid
Sodium hydroxide ACS grade – solid, 97.8% used for pH adjustment
Sodium hypochlorite stock ACS grade – liquid, used for chlorine dosing
Sodium sulfite ACS grade – used for THM analysis
THM calibration standard mix 100,000 mg/L stock concentration – 4-8047 Supelco ACS = American Chemical Society EDTA = ethylenediaminetetraacetic acid SG = specific gravity
Preparation of Potassium Permanganate
A solution of potassium permanganate was prepared by diluting one gram of potassium
permanganate crystals in a 100-milliliter (mL) volumetric flask of distilled water. The volumetric
flask was covered with parafilm and mixed thoroughly. A secondary stock solution was prepared
23

in order to be able to dose small volumes of Fena Lake water by diluting one-mL of the primary
potassium permanganate stock solution in 100-mL of distilled water. 10-mL of the secondary stock
solution was equal to one-mg/L potassium permanganate.
Preparation of Chlorine Dioxide
In order to produce chlorine dioxide chemical for use in experimentation, a Siemens AC-10
chlorine dioxide generator was installed by Evoqua (2650 Tallevast; Sarasota, FL) at UCF’s
drinking water laboratory which was used to evaluate Fena Lake’s chlorine dioxide demand at the
bench-scale. The generator works on the basis of the acid/chlorite process and generates chlorine
dioxide as an aqueous solution. Dilute hydrochloric acid (9%) and dilute sodium chlorite (7.5%)
are used as starting components for the generation of chlorine dioxide (Siemens Water
Technologies).
In the chlorine dioxide bench-scale unit, reagents are fed from carboys to the reaction tank with a
peristaltic pump where a solution with approximately 20-grams (g) ClO2 per liter (L) is generated.
This solution is flushed with water into the preparation tank after a defined reaction time. This
generates a defined chlorine dioxide solution with less than 2.5 grams per liter (g/L). The
preparation tank is in connection with the intermediate tank. From the intermediate tank the
solution is taken by the metering pumps. The exact addition of both starting components is
monitored by electronic flow sensors. The chlorine dioxide solution was pumped from the
generator into 125-mL amber bottles, capped, and stored in a refrigerator. The initial concentration
of the chlorine dioxide solution was measured immediately after collection using the Chlorine
Dioxide Direct Reading Method 8138.
24

Figure 4.2 Siemens AC-10 chlorine dioxide generator
In the event of deviation, the control unit automatically activates an alarm. If there is insufficient
operating water available for dilution, the system switches to a stop mode. Vapors produced during
the solution flow within the tanks are safely removed in the absorption unit that is installed within
the generator equipment. The system is controlled by programmable logic controller (PLC) in
combination with an operating and observation panel with a sealed keypad. In addition, the unit is
placed within a locked laboratory with limited access by key-card only.
25

Fena Lake Dosing in Jar Testing Unit
Bulk water from Fena Lake was mixed in a 5-gallon bucket to allow for a homogenous sample.
The initial water quality parameters (conductivity, pH, temperature, turbidity, and TOC) were
recorded. The sample water was then transferred to two six-paddle programmable jar testers that
were used to conduct this study. Each apparatus included six stainless-steel, one-inch x three-inch
paddles spaced six inches apart, simultaneous variable speed adjustment for paddle rotation from
1 to 300 revolutions per minute (rpm), powder-coated steel uni-frame chassis, built-in illuminator,
anti-glare curtain, and dust cover. The paddles were adjusted to the maximum depth of nine inches
during each experiment. Twelve two-L square acrylic B-KER2® testing jars, equipped with
sampling ports, were used to contain the water samples for each jar testing unit.
The jar testing beakers (jars) were filled with two liters of sample water. There were three jars per
pre-oxidant condition; i.e. three jars for no pretreatment, chlorine pretreatment, potassium
permanganate pretreatment, and chlorine dioxide pretreatment. There were twelve jars total, as
presented in Figure 4.3.
26

Figure 4.3 DBP jar testing equipment used for experimentation
Next, the jars were dosed for pretreatment using Equation 4-1, in which the oxidant dosing volume
was the only unknown value and was solved for using the equation. Jars 1, 2, and 3 were not dosed
with a pre-oxidant (to represent no pretreatment). Jars 4, 5, and 6 were dosed with 1.25 mg/L Cl2.
This chlorine dose concentration was calculated using Equation 4-2, in which the pounds (lbs) and
flow operation data was provided by the NWTP to represent Fena Lake under previous operating
conditions. Jars 7, 8, and 9 were dosed with 1.75 mg/L KMnO4, which was established as the
optimum potassium permanganate dose in a previous UCF study (UCF, 2013). Jars 10, 11, and 12
were dosed with 1.1 mg/L ClO2, which was established as the optimum chlorine dioxide dose in a
separate UCF study (UCF, 2014).
27

𝐶𝐶1𝑉𝑉1 = 𝐶𝐶2𝑉𝑉2 (4-1)
𝐶𝐶1 = 𝑐𝑐𝑐𝑐𝑐𝑐𝑐𝑐𝑐𝑐𝑐𝑐𝑐𝑐𝑐𝑐𝑐𝑐𝑐𝑐𝑐𝑐𝑐𝑐𝑐𝑐 𝑐𝑐𝑜𝑜 𝑐𝑐ℎ𝑐𝑐 𝑐𝑐𝑜𝑜𝑐𝑐𝑜𝑜𝑐𝑐𝑐𝑐𝑐𝑐 𝑠𝑠𝑐𝑐𝑐𝑐𝑐𝑐𝑠𝑠 𝑠𝑠𝑐𝑐𝑠𝑠𝑠𝑠𝑐𝑐𝑐𝑐𝑐𝑐𝑐𝑐 �𝑚𝑚𝑚𝑚𝐿𝐿�
𝐶𝐶2 = 𝑐𝑐𝑐𝑐𝑐𝑐𝑡𝑡𝑐𝑐𝑐𝑐 𝑐𝑐𝑐𝑐𝑐𝑐𝑐𝑐𝑐𝑐𝑐𝑐𝑐𝑐𝑐𝑐𝑐𝑐𝑐𝑐𝑐𝑐𝑐𝑐𝑐𝑐 𝑐𝑐𝑜𝑜 𝑐𝑐ℎ𝑐𝑐 𝑠𝑠𝑐𝑐𝑠𝑠𝑠𝑠𝑠𝑠𝑐𝑐 �𝑚𝑚𝑚𝑚𝐿𝐿�
𝑉𝑉1, 𝑉𝑉2 = 𝑐𝑐𝑜𝑜𝑐𝑐𝑜𝑜𝑐𝑐𝑐𝑐𝑐𝑐 𝑜𝑜𝑐𝑐𝑠𝑠𝑐𝑐𝑐𝑐𝑡𝑡 𝑣𝑣𝑐𝑐𝑠𝑠𝑠𝑠𝑠𝑠𝑐𝑐 (𝑠𝑠𝑚𝑚), 𝑠𝑠𝑐𝑐𝑠𝑠𝑠𝑠𝑠𝑠𝑐𝑐 𝑣𝑣𝑐𝑐𝑠𝑠𝑠𝑠𝑠𝑠𝑐𝑐 (𝑠𝑠𝑚𝑚)
𝑚𝑚𝑏𝑏𝑠𝑠 = 𝐹𝐹𝑠𝑠𝑐𝑐𝐹𝐹 (𝑀𝑀𝑀𝑀𝑀𝑀) × 𝐶𝐶𝑐𝑐𝑐𝑐𝑐𝑐𝑐𝑐𝑐𝑐𝑐𝑐𝑐𝑐𝑐𝑐𝑐𝑐𝑐𝑐𝑐𝑐𝑐𝑐 �𝑚𝑚𝑚𝑚𝐿𝐿� × 8.34 (4-2)
The jar testing units were then covered and mixed at 120 rpm for two hours to simulate pipe flow.
According to the plant operators, Fena Lake water takes approximately two hours to go from
Building 1285 to the NWTP Fena Pipe influent location.
Coagulation, Flocculation, Sedimentation, and Filtration (CSF)
Once the jars were mixed for two hours, alum coagulant was added to each of the jars at the rapid
mix. The laboratory at the NWTP in Guam, DZSP21, shipped alum that was used at the NWTP to
the UCF laboratory for the bench-scale tests. The coagulant dose was based on daily plant
operations data acquired from the NWTP and was between 35-40 mg/L. Also, Jars 4, 5, and 6 were
dosed with 0.7 mg/L Cl2 (hypochlorite) to represent the rapid mix location under previous
chlorination conditions. This chlorine dose concentration was calculated using Equation 4-2, in
which the pounds and flow operation data was provided by the NWTP to represent past operating
prechlorination conditions. The different coagulation-flocculation phases were chosen by jar tests
performed and consisted of a rapid mix at a speed of 150 rpm for three minutes and a slow agitation
phase at the speed of 25 rpm for 15 minutes (Zogo, Bawa, Soclo, & Atchekpe, 2011). Then, the
sample water settled for one hour to represent the sedimentation process.
28

After the sedimentation process was complete, samples were collected in multiple 1000-mL
Erlenmeyer flasks for filtration. The samples were filtered through a 0.45-micron filter using a
vacuum filter apparatus. The vacuum apparatus was cleaned and a new filter was used for each
sample.
Dosing at the Clearwell
After the samples had been filtered, they were collected in 4-L glass amber bottles (four bottles
total, one for each pretreatment condition). Each sample volume was dosed with bleach
(hypochlorite) disinfectant to simulate primary disinfection at the clearwell. The “no pretreatment”
sample was dosed with 3 mg/L Cl2, which was determined from NWTP data (when the NWTP
ceased prechlorination). The “chlorine pretreatment” sample was dosed with 2.5 mg/L Cl2, also
determined from NWTP data (when the NWTP used prechlorination). The “potassium
permanganate pretreatment” and “chlorine dioxide pretreatment” samples were dosed with 3.75
and 3 mg/L Cl2, respectively.
DBP Formation Potentials
THM and HAA samples were collected in 60-mL and 250-mL capped amber glass bottles,
respectively, for formation potential testing. Chlorine residual samples were collected in 125-mL
capped amber glass bottles. The chlorine residual, TTHM, and HAA5 samples were incubated at
30°C to represent the distribution system. There were chlorine residual, TTHM, and HAA5 sample
bottles to represent each of the following times: clearwell (0-hour), 48-hour, and 168-hour.
Chlorite and chlorate samples were collected from the water that had been pre-treated with chlorine
dioxide in 125-mL glass amber bottles. The chlorite and chlorate samples were preserved with
29

ethylenediaminetetraacetic acid (EDTA) and stored at 4°C in accordance with EPA Method 300
(Hautman, 1997). Table 4.3 provides a summary of the samples collected for residual chlorine,
TTHM, HAA5, and TOC parameters.
Table 4.3 UCF bench-scale treatment DBP formation potential study
Location Parameter Comments
B1285 Post-Chlorination Station
Residual chlorine, TTHM, HAA5, TOC Grab and Quench*. Take chlorine residual reading
Rapid Mix Residual chlorine, TTHM, HAA5, TOC Grab and Quench*. Take chlorine residual reading
Clearwell Residual chlorine, TTHM,
HAA5, TOC, Chlorite, Chlorate
Grab and Quench*. Take chlorine residual reading
Clearwell formation potential (bulk sample to be collected at the same time as the "grab and quench")
Clearwell (2-Hours) Residual chlorine, TTHM, HAA5
Quench* after 2 hours of incubation at 30°C. Take chlorine residual reading
Clearwell (4-Hours) Residual chlorine, TTHM, HAA5
Quench* after 4 hours of incubation at 30°C. Take chlorine residual reading
Clearwell (8-Hours) Residual chlorine, TTHM, HAA5
Quench* after 8 hours of incubation at 30°C. Take chlorine residual reading
Clearwell (24-Hours) Residual chlorine, TTHM, HAA5
Quench* after 24 hours of incubation at 30°C. Take chlorine residual reading
Clearwell (48-Hours) Residual chlorine, TTHM, HAA5
Quench* after 48 hours of incubation at 30°C. Take chlorine residual reading
Clearwell (96-Hours) Residual chlorine, TTHM, HAA5
Quench* after 96 hours of incubation at 30°C. Take chlorine residual reading
Clearwell (168-Hours) Residual chlorine, TTHM, HAA5
Quench* after 168 hours of incubation at 30°C. Take chlorine residual reading
*Quenched the TTHM and HAA5 samples only
The samples were then removed from the oven at the designated time and residual chlorine was
measured; TTHM bottles were quenched with sodium sulfite (Na2SO3) and stored at 4°C in a
refrigerator until analysis could be performed. In a similar fashion, the HAA5 bottles were
quenched with ammonium chloride (NH4Cl) and stored at 4°C until chemical analysis could be
performed. The TTHM FP and HAA5 FP samples were collected and measured in UCF’s drinking
water laboratories in accordance with Standard Methods for the Examination of Water and
30

Wastewater 5710 B, Total Trihalomethane Formation Potential and 5710 D, Formation of Other
Disinfection By-Products (American Public Health Association et al., 2005).
TTHMs were analyzed after the final 168-hour sample was quenched using gas chromatography
(GC) analysis. TTHMs were analyzed in UCF’s drinking water laboratories in accordance with
the Standard Methods for the Examination of Water and Wastewater 6232 B, Liquid-Liquid
Extraction Gas Chromatographic Method (American Public Health Association et al., 2005).
TTHM’s were analyzed at UCF; however, for purposes of time and schedule, the majority of
HAA5s, chlorite, and chlorate analyses were performed at a certified laboratory in Orlando, FL.
The DBP formation potentials for these source waters were plotted in Excel, in which the specific
DBP concentrations obtained by experimentation were graphed over time. The ultimate (7-day or
168-hour) TTHM formation was determined from experimental data to serve as a means of
representation of distribution system conditions experienced within the U.S. Navy’s PWS.
System Management Experimental Plan
Several in-plant studies were performed at the NWTP in addition to studies performed throughout
the Navy’s distribution system in Guam to evaluate the formation of DBPs under various
conditions.
In-Plant DBP Analysis at the NWTP Clearwell and Distribution System Pre and Post-chlorine Shutoff
In-plant studies were performed at the NWTP and throughout the distribution system from May to
September of 2013 regarding DBP formation before and after the Navy ceased prechlorination at
31

Fena Lake, the rapid mix chemical feed location, and the chemical feed location upstream of the
filters. TTHM and HAA5 samples were collected from within the plant’s clearwell and at four
sample locations throughout the distribution system (McCool’s, Madrid Circle, Plumeria St., and
Portola St.) in capped 125-mL glass vials. The samples were then delivered to and analyzed at the
DZSP21 laboratory in Guam. The clearwell DBP concentrations were to be used in comparison
with TTHM and HAA5 concentrations at the clearwell from the previous year (September 2012)
to analyze the DBPs with and without prechlorination operating under the same seasonal
conditions. The samples collected within the distribution system were to be compared with
historical plant data. The goal of this study was to investigate the extent of DBP formation
throughout the distribution system caused by prechlorination that caused the Navy to violate the
Stage 2 D/DBP Rule.
Fluoride Tracer Study
Laboratory staff at DZSP21 indicated that the NWTP’s treated water required nine days to reach
one residential unit in the Apra View Housing complex (a DBP monitoring sample location in the
distribution system), while the housing unit across the street experienced a five-day travel time for
the water to reach the home after leaving the NWTP. A fluoride tracer study was performed within
the U.S. Navy’s PWS originating at the NWTP in September of 2013 to quantify dispersion and
determine the contact time for the disinfectant and confirm the nine-day detention time in the Apra
View Housing complex.
32

BFC Study for Severe Weather Conditions
In October 2013, the NWTP plant operated the BFC in series with the conventional alum
coagulation surface water treatment plant due to severe weather that occurred coincidentally with
two earthquakes that caused a rise in raw water turbidity. DBP samples were taken throughout the
distribution system in order to provide DBP formation conditions within the PWS distribution
system while the BFC was online to provide another opportunity for system management.
Analytical Testing Locations
The research described in this document was in part conducted at primarily two locations: (1) on-
site at the U.S. Naval Base on Guam from May to October 2013, and (2) at the UCF’s Orlando
campus location between October 2013 and August 2014. Samples were collected by the Navy at
various depths of the Navy’s Fena Lake Reservoir. Sampling depths were determined by the
NWTP and mimicked the full-scale system (usually drawn at 12-ft depth). Samples were then
shipped by the Navy to UCF.
Field and Laboratory Quality Control
Statistics and quality control analyses were calculated in accordance with the Standard Methods
for the Examination of Water and Wastewater 1010 B. Statistics and 1020 B. Quality Control
(American Public Health Association et al., 2005), respectively.
Relative percent difference (RPD) was used in replicate and duplicate analyses and was calculated
using Equation 4-3. An acceptable range of RPD between the ranges of 90%-110%. If a value fell
outside three times the standard deviations from the mean, it was considered an outlier and was
removed from the results.
33

𝑅𝑅𝑅𝑅𝑀𝑀 = 𝑆𝑆−𝐷𝐷(𝑆𝑆+𝐷𝐷)/2
× 100% (4-3)
𝑆𝑆 = 𝑠𝑠𝑐𝑐𝑠𝑠𝑠𝑠𝑠𝑠𝑐𝑐 𝑐𝑐𝑐𝑐𝑠𝑠𝑠𝑠𝑠𝑠𝑐𝑐 (𝑠𝑠𝑡𝑡/𝑚𝑚)
𝑀𝑀 = 𝑜𝑜𝑠𝑠𝑠𝑠𝑠𝑠𝑐𝑐𝑐𝑐𝑐𝑐𝑐𝑐𝑐𝑐 𝑠𝑠𝑐𝑐𝑠𝑠𝑠𝑠𝑠𝑠𝑐𝑐 𝑐𝑐𝑐𝑐𝑠𝑠𝑠𝑠𝑠𝑠𝑐𝑐 (𝑠𝑠𝑡𝑡/𝑚𝑚)
Accuracy
An accuracy chart was constructed from the average and standard deviation The percent recovery
was calculated for each spiked TTHM sample processed through the GC using Equation 4-4. The
percent recovery of each spike was plotted on an accuracy chart to assess the consistency of the
GC analyzer accuracy.
% 𝑅𝑅𝑐𝑐𝑐𝑐𝑐𝑐𝑣𝑣𝑐𝑐𝑐𝑐𝑅𝑅 = 𝐶𝐶𝑠𝑠𝑠𝑠𝑠𝑠𝑠𝑠𝑠𝑠𝑠𝑠+𝑠𝑠𝑠𝑠𝑠𝑠𝑠𝑠𝑠𝑠−𝐶𝐶𝑠𝑠𝑠𝑠𝑠𝑠𝑠𝑠𝑠𝑠𝑠𝑠
𝐶𝐶𝑠𝑠𝑠𝑠𝑠𝑠𝑠𝑠𝑠𝑠× 100% (4-4)
𝐶𝐶𝑠𝑠𝑠𝑠𝑚𝑚𝑠𝑠𝑠𝑠𝑠𝑠+𝑠𝑠𝑠𝑠𝑠𝑠𝑠𝑠𝑠𝑠 = 𝑐𝑐ℎ𝑐𝑐 𝑐𝑐𝑐𝑐𝑐𝑐𝑐𝑐𝑐𝑐𝑐𝑐𝑐𝑐𝑐𝑐𝑐𝑐𝑐𝑐𝑐𝑐𝑐𝑐𝑐𝑐 𝑐𝑐𝑜𝑜 𝑐𝑐ℎ𝑐𝑐 𝑠𝑠𝑠𝑠𝑐𝑐𝑠𝑠𝑐𝑐𝑜𝑜 𝑠𝑠𝑐𝑐𝑠𝑠𝑠𝑠𝑠𝑠𝑐𝑐 (𝑠𝑠𝑡𝑡/𝑚𝑚)
𝐶𝐶𝑠𝑠𝑠𝑠𝑚𝑚𝑠𝑠𝑠𝑠𝑠𝑠 = 𝑐𝑐ℎ𝑐𝑐 𝑐𝑐𝑐𝑐𝑐𝑐𝑐𝑐𝑐𝑐𝑐𝑐𝑐𝑐𝑐𝑐𝑐𝑐𝑐𝑐𝑐𝑐𝑐𝑐𝑐𝑐 𝑐𝑐𝑜𝑜 𝑐𝑐ℎ𝑐𝑐 𝑠𝑠𝑐𝑐𝑠𝑠𝑠𝑠𝑠𝑠𝑐𝑐(𝑠𝑠𝑡𝑡/𝑚𝑚)
𝐶𝐶𝑠𝑠𝑠𝑠𝑠𝑠𝑠𝑠𝑠𝑠 = 𝑐𝑐ℎ𝑐𝑐 𝑐𝑐𝑐𝑐𝑐𝑐𝑐𝑐𝑐𝑐𝑐𝑐𝑐𝑐𝑐𝑐𝑐𝑐𝑐𝑐𝑐𝑐𝑐𝑐𝑐𝑐 𝑐𝑐𝑜𝑜 𝑐𝑐ℎ𝑐𝑐 𝑠𝑠𝑠𝑠𝑐𝑐𝑠𝑠𝑐𝑐 (𝑠𝑠𝑡𝑡/𝑚𝑚)
The accuracy chart also includes upper and lower warning levels (UWL and LWL, respectively)
in addition to upper and lower control levels (UCL and LCL, respectively). The warning limits
and control limits were defined to be plus or minus two and three standard deviations from the
mean, respectively. The UCL and LCL were calculated using Equation 4-5. The UWL and LWL
were calculated using Equation 4-6.
34
𝑈𝑈𝐶𝐶𝑚𝑚 = 𝜇𝜇 + 3𝑠𝑠 𝑐𝑐𝑐𝑐𝑜𝑜 𝑚𝑚𝐶𝐶𝑚𝑚 = 𝜇𝜇 − 3𝑠𝑠 (4-5)
𝑈𝑈𝑈𝑈𝑚𝑚 = 𝜇𝜇 + 2𝑠𝑠 𝑐𝑐𝑐𝑐𝑜𝑜 𝑚𝑚𝑈𝑈𝑚𝑚 = 𝜇𝜇 − 2𝑠𝑠 (4-6)
𝜇𝜇 = 𝑐𝑐ℎ𝑐𝑐 𝑠𝑠𝑐𝑐𝑐𝑐𝑐𝑐 𝑐𝑐𝑜𝑜 𝑐𝑐ℎ𝑐𝑐 𝑠𝑠𝑐𝑐𝑐𝑐𝑐𝑐𝑐𝑐𝑐𝑐𝑐𝑐 𝑐𝑐𝑐𝑐𝑐𝑐𝑐𝑐𝑣𝑣𝑐𝑐𝑐𝑐𝑅𝑅 𝑣𝑣𝑐𝑐𝑠𝑠𝑠𝑠𝑐𝑐𝑠𝑠
𝑠𝑠 = 𝑐𝑐ℎ𝑐𝑐 𝑠𝑠𝑐𝑐𝑐𝑐𝑐𝑐𝑜𝑜𝑐𝑐𝑐𝑐𝑜𝑜 𝑜𝑜𝑐𝑐𝑣𝑣𝑐𝑐𝑐𝑐𝑐𝑐𝑐𝑐𝑐𝑐𝑐𝑐 𝑐𝑐𝑜𝑜 𝑐𝑐ℎ𝑐𝑐 𝑠𝑠𝑐𝑐𝑐𝑐𝑐𝑐𝑐𝑐𝑐𝑐𝑐𝑐 𝑐𝑐𝑐𝑐𝑐𝑐𝑐𝑐𝑣𝑣𝑐𝑐𝑐𝑐𝑅𝑅 𝑣𝑣𝑐𝑐𝑠𝑠𝑠𝑠𝑐𝑐𝑠𝑠
Precision
A precision chart was constructed from the average and standard deviation values to monitor
process variation. Upper warning limits and upper control limits are calculated for precision charts.
The industrial statistic (I-statistic) was calculated using Equation 4-7 to create control charts for
the precision of the THM analysis.
𝐼𝐼 = |S−D|(𝑆𝑆+𝐷𝐷) (4-7)
𝑆𝑆 = 𝑠𝑠𝑐𝑐𝑠𝑠𝑠𝑠𝑠𝑠𝑐𝑐 𝑐𝑐𝑐𝑐𝑠𝑠𝑠𝑠𝑠𝑠𝑐𝑐 (𝑠𝑠𝑡𝑡/𝑚𝑚)
𝑀𝑀 = 𝑜𝑜𝑠𝑠𝑠𝑠𝑠𝑠𝑐𝑐𝑐𝑐𝑐𝑐𝑐𝑐𝑐𝑐 𝑠𝑠𝑐𝑐𝑠𝑠𝑠𝑠𝑠𝑠𝑐𝑐 𝑐𝑐𝑐𝑐𝑠𝑠𝑠𝑠𝑠𝑠𝑐𝑐 (𝑠𝑠𝑡𝑡/𝑚𝑚)
Upper control limits (UCL) for precision charts were defined to be the average I-value plus three
standard deviations and were calculated using Equation 4-8. Upper warning limits (UWL) for
precision charts were defined as the average I-value plus two standard deviations of the industrial
statistic values and were calculated using Equation 4-9.
𝑈𝑈𝐶𝐶𝑚𝑚 = 𝐼𝐼𝑠𝑠𝑎𝑎𝑚𝑚 + 3𝑠𝑠 (4-8)
35
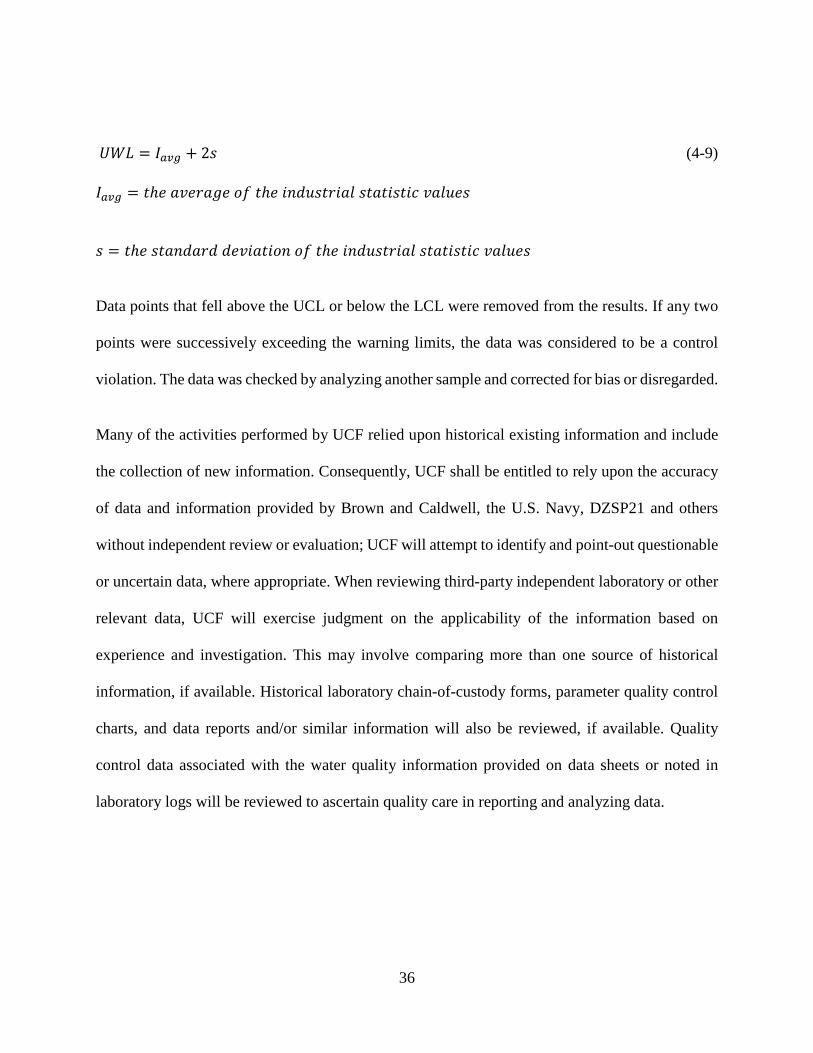
𝑈𝑈𝑈𝑈𝑚𝑚 = 𝐼𝐼𝑠𝑠𝑎𝑎𝑚𝑚 + 2𝑠𝑠 (4-9)
𝐼𝐼𝑠𝑠𝑎𝑎𝑚𝑚 = 𝑐𝑐ℎ𝑐𝑐 𝑐𝑐𝑣𝑣𝑐𝑐𝑐𝑐𝑐𝑐𝑡𝑡𝑐𝑐 𝑐𝑐𝑜𝑜 𝑐𝑐ℎ𝑐𝑐 𝑐𝑐𝑐𝑐𝑜𝑜𝑠𝑠𝑠𝑠𝑐𝑐𝑐𝑐𝑐𝑐𝑐𝑐𝑠𝑠 𝑠𝑠𝑐𝑐𝑐𝑐𝑐𝑐𝑐𝑐𝑠𝑠𝑐𝑐𝑐𝑐𝑐𝑐 𝑣𝑣𝑐𝑐𝑠𝑠𝑠𝑠𝑐𝑐𝑠𝑠
𝑠𝑠 = 𝑐𝑐ℎ𝑐𝑐 𝑠𝑠𝑐𝑐𝑐𝑐𝑐𝑐𝑜𝑜𝑐𝑐𝑐𝑐𝑜𝑜 𝑜𝑜𝑐𝑐𝑣𝑣𝑐𝑐𝑐𝑐𝑐𝑐𝑐𝑐𝑐𝑐𝑐𝑐 𝑐𝑐𝑜𝑜 𝑐𝑐ℎ𝑐𝑐 𝑐𝑐𝑐𝑐𝑜𝑜𝑠𝑠𝑠𝑠𝑐𝑐𝑐𝑐𝑐𝑐𝑐𝑐𝑠𝑠 𝑠𝑠𝑐𝑐𝑐𝑐𝑐𝑐𝑐𝑐𝑠𝑠𝑐𝑐𝑐𝑐𝑐𝑐 𝑣𝑣𝑐𝑐𝑠𝑠𝑠𝑠𝑐𝑐𝑠𝑠
Data points that fell above the UCL or below the LCL were removed from the results. If any two
points were successively exceeding the warning limits, the data was considered to be a control
violation. The data was checked by analyzing another sample and corrected for bias or disregarded.
Many of the activities performed by UCF relied upon historical existing information and include
the collection of new information. Consequently, UCF shall be entitled to rely upon the accuracy
of data and information provided by Brown and Caldwell, the U.S. Navy, DZSP21 and others
without independent review or evaluation; UCF will attempt to identify and point-out questionable
or uncertain data, where appropriate. When reviewing third-party independent laboratory or other
relevant data, UCF will exercise judgment on the applicability of the information based on
experience and investigation. This may involve comparing more than one source of historical
information, if available. Historical laboratory chain-of-custody forms, parameter quality control
charts, and data reports and/or similar information will also be reviewed, if available. Quality
control data associated with the water quality information provided on data sheets or noted in
laboratory logs will be reviewed to ascertain quality care in reporting and analyzing data.
36

5. RESULTS & DISCUSSION
Alternative Pre-oxidant Study Results for DBP Removal
Historically, the NWTP implemented chlorination at four locations that included Fena Lake, the
rapid mix basin, pre-filters and the clearwell prior to the distribution system point-of-entry.
However, soon after research conducted by UCF and as reported by Hall (2013) commenced,
prechlorination was ceased on August 28, 2013 at three of the historical locations: Fena Lake, the
rapid-mix, and pre-filter locations. This was because Hall (2013) and colleagues at UCF had
demonstrated (soon after commencing research on the Navy’s water supply) that prechlorination
was not required as background iron was in the oxidized form and manganese remained below the
detection limit under normal Fena Lake operating conditions.
After prechlorination ceased, it was found that DBP levels had significantly decreased within the
PWS. Consequently, as a stop-gap measure to comply with the D/DBP Rule, the evaluation of
DBPs formed without a pre-oxidant (to represent the WTP’s current conditions) was integrated
into the testing plan in addition to the evaluation of DBPs formed when alternative pre-oxidants,
potassium permanganate and chlorine dioxide, were used in treating Fena Lake in lieu of gaseous
chlorine. Each of these four pre-oxidant conditions (no pretreatment, Cl2 pretreatment, KMnO4
pretreatment, and ClO2 pretreatment) were simulated and resultant samples were treated with
chlorine (simulating post chlorination at the clearwell) for primary disinfection.
A total of six experimental runs were performed at UCF, and are summarized in Table 5.1. The
first three experiments evaluated TTHMs formed when chlorine, potassium permanganate, and no
37

pre-oxidant were added at the Fena Lake pump station. Experiment 4, 5, and 6 evaluated TTHMS
and HAA5s for the four pre-oxidant conditions (no pre-oxidant, Cl2, KMnO4, and ClO2).
Table 5.1 Summary of DBP data collected by experiment event
Experiment # Experiment date
Pre-oxidant
KMnO4 Cl2 ClO2 No pre-oxidant
TTHM HAA5 TTHM HAA5 TTHM HAA5 TTHM HAA5
1 Oct. 2013
2 Oct. 2013
3 Jan. 2014
4 June 2014
5 July 2014
6 Aug. 2014
A summary of the TTHMs and HAA5 formations for the experiments conducted in these studies
are presented in Figure 5.1. The average amount of TTHMs and HAA5 formed by using potassium
permanganate, chlorine dioxide, and without using a pre-oxidant were compared to the TTHMs
and HAA5 formed when the plant used prechlorination. The results show that without using a pre-
oxidant at the Fena Lake pump station, TTHMs and HAA5 formation would be reduced by 22.8%
and 37.3%, respectively, based on this specific set of experimental conditions. Potassium
permanganate had the lowest percent reduction of TTHMs and HAA5, at 5.7% and 22.7%,
respectively; however, this amount was still a reduction from the results demonstrated for the
chlorine pretreatment condition. Chlorine dioxide demonstrated the greatest TTHM and HAA5
reduction at 34.4% and 53.3%, respectively.
38

Figure 5.1 7-Day formation potential TTHM and HAA5 percent reduction relative to chlorine
pretreatment for various pretreatment conditions
DBP Formation Potentials for Alternative Pre-oxidant Study
The DBP formation potentials for these source waters were determined by plotting the specific
DBP concentrations obtained by experimentation against time. The TTHM and HAA5 formation
potentials in Figure 5.2 and Figure 5.3, respectively, display the average results of the evaluation
of four pre-oxidant conditions at Fena Lake: no pre-oxidant, chlorine pretreatment, potassium
permanganate pretreatment, and chlorine dioxide pretreatment. These samples were taken from
Fena Lake and treated by jar test simulations of the NWTP.
Results show that the greatest amount of TTHMs and HAAs were formed by the chlorine pre-
oxidant dose, followed by potassium permanganate, no pre-oxidant condition, and chlorine
22.8%
37.3%
5.7%
22.7%
34.4%
53.3%
0.0%
10.0%
20.0%
30.0%
40.0%
50.0%
60.0%
TTHM HAA5
Perc
ent R
educ
tion
Rel
ativ
e to
Cl 2
(%)
No Preoxidant 1.75 mg/L KMnO4 1.1 mg/L ClO2
39

dioxide, respectively. Chlorine dioxide and no pre-oxidant were the two conditions that did not
exceed the regulated TTHM MCL of 80 μg/L after 168 hours of disinfectant contact time, as shown
in Figure 5.2. As for the HAA5s, the results indicated that at the 168-hour mark the chlorine pre-
oxidant condition was the one condition that would exceed the 60 μg/L HAA5 MCL, as shown in
Figure 5.3.
Cl2 = 1.25 and 0.7 mg/L Cl2 at B1285 and the rapid mix, respectively KMnO4 = 1.75 mg/L KMnO4 at B1285 ClO2 = 1.1 mg/L ClO2 at B1285
Figure 5.2 TTHM formation potential for alternative pre-oxidant study
0
20
40
60
80
100
120
0 20 40 60 80 100 120 140 160 180
TTH
M C
once
ntra
tion
(µg/
L)
Time (Hours)
TTHM MCL No Preoxidant Cl2 KMnO4 ClO2
40

Cl2 = 1.25 and 0.7 mg/L Cl2 at B1285 and the rapid mix, respectively KMnO4 = 1.75 mg/L KMnO4 at B1285 ClO2 = 1.1 mg/L ClO2 at B1285
Figure 5.3 HAA5 formation potential for alternative pre-oxidant study
These results are comparable to those found in literature. While permanganate is a weaker
disinfectant than chlorine, it is an acceptable oxidant that has been used for the control of iron,
manganese, and sulfide (Crittenden et al., 2012). Potassium permanganate was found to form less
TTHMs and HAA5s than chlorine. Chlorine dioxide, however, is a stronger oxidant and
disinfectant. Chlorine dioxide produces two inorganic by-products when applied to natural waters:
chlorite and chlorate. The Stage 1 D/DBP Rule set the MCL for chlorite in water at 1.0 mg/l (1,000
µg/L) and although no MCL for chlorate exists at the federal level, the state of California limits it
to 0.8 mg/L (800 µg/L) (Crittenden et al., 2012). The 1.1 mg/L ClO2 dose used in these experiments
produced a chlorite concentration of 65 µg/L and therefore did not exceed the chlorite MCL, as
shown in Figure 5.4.
0
10
20
30
40
50
60
70
80
90
0 20 40 60 80 100 120 140 160 180
HA
A5
Con
cent
ratio
n (µ
g/L)
Time (Hours)
HAA5 MCL No Preoxidant Cl2 KMnO4 ClO2
41
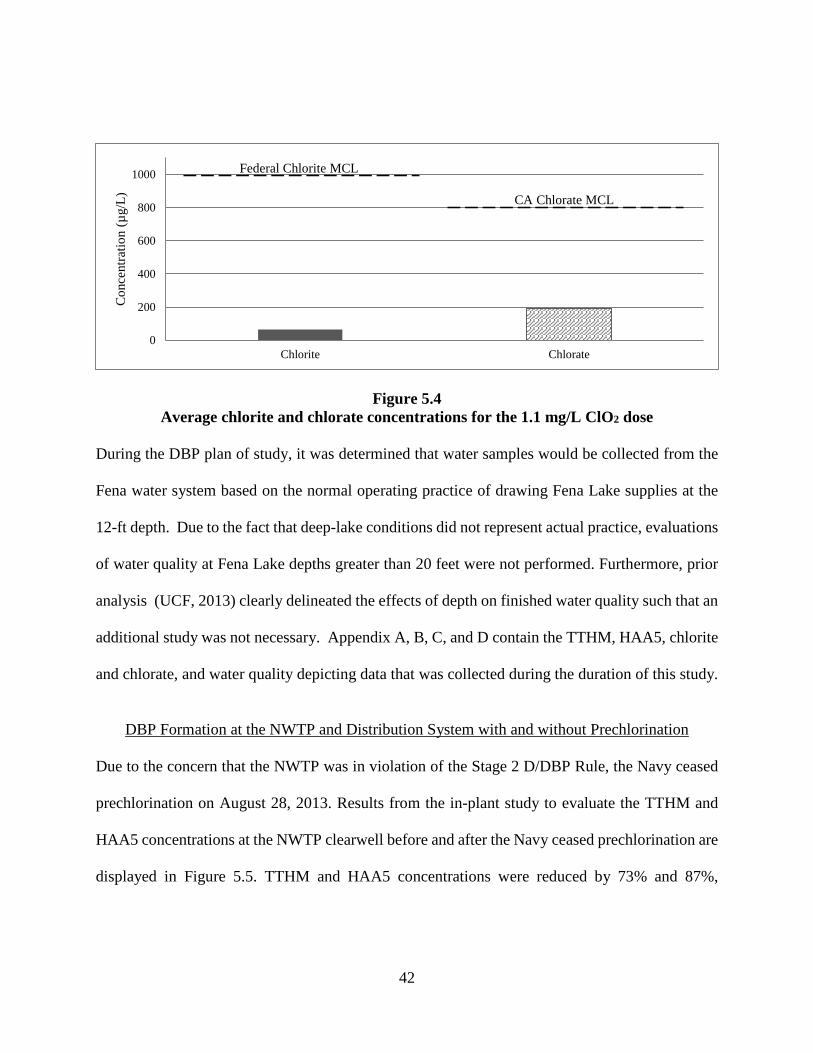
Figure 5.4 Average chlorite and chlorate concentrations for the 1.1 mg/L ClO2 dose
During the DBP plan of study, it was determined that water samples would be collected from the
Fena water system based on the normal operating practice of drawing Fena Lake supplies at the
12-ft depth. Due to the fact that deep-lake conditions did not represent actual practice, evaluations
of water quality at Fena Lake depths greater than 20 feet were not performed. Furthermore, prior
analysis (UCF, 2013) clearly delineated the effects of depth on finished water quality such that an
additional study was not necessary. Appendix A, B, C, and D contain the TTHM, HAA5, chlorite
and chlorate, and water quality depicting data that was collected during the duration of this study.
DBP Formation at the NWTP and Distribution System with and without Prechlorination
Due to the concern that the NWTP was in violation of the Stage 2 D/DBP Rule, the Navy ceased
prechlorination on August 28, 2013. Results from the in-plant study to evaluate the TTHM and
HAA5 concentrations at the NWTP clearwell before and after the Navy ceased prechlorination are
displayed in Figure 5.5. TTHM and HAA5 concentrations were reduced by 73% and 87%,
0
200
400
600
800
1000
Chlorite Chlorate
Con
cent
ratio
n (µ
g/L)
Federal Chlorite MCL
CA Chlorate MCL
42

respectively after the Navy ceased prechlorination. Historical plant data from September of 2012
was used as a comparison to September 2013 so that the same time of year was used.
Figure 5.5 DBP concentrations at NWTP clearwell grab samples pre and post-chlorine shutoff
As previously stated, a review of water quality data by Brown and Caldwell (2014) demonstrated
that numerous locations within the U.S. Navy water system regularly exceeded the MCLs for
DBPs between 2009 and 2012. Four sampling locations within the U.S. Navy distribution system
were used for comparison purposes to evaluate the TTHM and HAA5 concentrations before and
after the prechlorination was turned off. The TTHM and HAA5 results are presented in Figure 5.6
and Figure 5.7, respectively. As shown in the figure, the four locations in the distribution exceeded
the TTHM and HAA5 MCLs of 80 and 60 µg/L, respectively. However, after the Navy ceased
prechlorination, the TTHMs and HAA5s were reduced by an average of 62% and 75%,
respectively, and were significantly below the MCLs.
0
20
40
60
80
100
120
TTHM Concentration HAA5 Concentration
Con
cent
ratio
n (u
g/L)
With Chlorine [Sept. 2012] Chlorine Shutoff [Sept. 2013]
HAA5 MCL
TTHM MCL
43

Figure 5.6 TTHM concentrations in the distribution system with and without prechlorination to
illustrate the significant reduction in DBPs between 2011 and 2013
Figure 5.7 HAA5 concentrations in the distribution system with and without prechlorination to
illustrate the significant reduction in DBPs between 2011 and 2013
0
20
40
60
80
100
120
McCool's #68 Madrid Circle #70 Plumeria St. #24 Portola St.
Con
cent
ratio
n (µ
g/L)
with pre-chlorination [2011]
without pre-chlorination [2013]
TTHM MCL
0
20
40
60
80
100
120
McCool's #68 Madrid Circle #70 Plumeria St. #24 Portola St.
Con
cent
ratio
n (µ
g/L)
with pre-chlorination [2011]
without pre-chlorination [2013]
HAA5 MCL
44

Fluoride Tracer Study Results
The results from the fluoride tracer study that were used to confirm that the detention times varied
within a small subdivision within the distribution system are displayed in Figure 5.8. It was
discovered that the #8 Anae Lane, Apra View location was being fed by a dead-end pipeline at the
back of the unit and had a ten-day detention time whereas the location across the street had a five-
day detention time. The TTHM and HAA5 concentrations were also much higher for the #8 Anae
Lane, Apra View compared to the house across the street. The pipeline valve was adjusted and as
a result, the detention time was reduced from ten to five days and the DBP concentrations were
similar to the sample location across the street.
Figure 5.8 Fluoride tracer study [8/30 – 9/8/2013]
0
0.1
0.2
0.3
0.4
0.5
0.6
0.7
0.8
0 2 4 6 8 10 12
Fluo
ride
conc
entra
tion
(mg/
L)
Number of days
McCool's #17 Powers, Lockwood#68 Madrid Circle, N. Tipalao #70 Plumeria St., Apra Palms#8 Anae Lane, Apra View #24 Portola St., N. Tipalao
45

Ballasted Floc Clarifier In-Series
Table 5.2 presents the TTHM and HAA5 data from when the NWTP operated the BFC in-series
with the conventional system under severe weather conditions. The TTHM and HAA5
concentrations were below 39 and 28 µg/L, respectively. The data shows that BFC in-series is a
practical option for the plant during severe weather.
Table 5.2 DBPs by location when running BFC in-series [10/09/2013]
Analyte
Sample location
McCool's #17
Powers, Lockwood
#9 Anae Lane,
Apra View
#68 Madrid
Circle, N. Tipalao
#70 Plumeria St., Apra
Palms
#24 Portola St., N. Tipalao
TTHM (ug/L) 29.9 30.5 38.7 36.2 31.0 29.3
HAA5 (ug/L) 20.6 23.3 28.0 24.1 17.2 21.2
Quality Control Results
A quality control chart based on percent recovery was plotted for accuracy and is presented in
Figure 5.9. There was one percent recovery value that exceeded the UCL. The precision quality
control chart, displayed in Figure 5.10, was based on the I-statistic values. There was one I-statistic
value that violated the UCL and one value that violated the UWL. The errors shown in both quality
control charts were most likely due to human error or contamination. The values in violation of
the UCL and UWL were not included in the TTHM analysis and final results.
46

Figure 5.9 Control chart for TTHM accuracy
Figure 5.10 Control chart for TTHM precision
0
20
40
60
80
100
120
140
160
180
200
0 5 10 15 20 25 30 35 40
% R
ecov
ery
Spike Number
UCL = 146 UWL = 133
= 106
LWL = 79.8LCL = 66.5
0
0.02
0.04
0.06
0.08
0.1
0.12
0.14
0.16
0.18
0 5 10 15 20 25 30 35 40
I-St
atis
tic
Duplicate Pair
UCL = 0.144
UWL = 0.104
47
6. CONCLUSIONS & RECOMMENDATIONS
Conclusions
• Eliminating prechlorination at Fena Lake reduced DBPs in the NWTP and PWS. Based on the
results obtained from grab samples drawn at the NWTP in Guam, the TTHM and HAA5
concentrations at the clearwell were reduced by 72.8% and 87.0%, respectively, when
prechlorination ceased at Fena Lake. Also, the TTHM and HAA5 concentrations throughout
the distribution system were reduced by an average of 61.6% and 75.0%, respectively.
• Treating Fena Lake raw water with chlorine dioxide resulted in significant DBP reduction.
Based on the formation potential studies performed in UCF drinking water laboratories
comparing alternative pre-oxidant treatments (chlorine, potassium permanganate, chlorine
dioxide, and no pre-oxidant), chlorine dioxide resulted in the highest TTHM and HAA5
reduction at 34.4% and 53.3%, respectively. No pre-oxidant at Fena Lake resulted in 22.8%
reduction and 37.3 % reduction for TTHM and HAA5 formation, respectively in the formation
potential studies.
• A chlorine dioxide dose of 1.1 mg/L on raw Fena Lake water did not produce chlorite in excess
of the chlorite MCL. The Stage 1 D/DBP Rule set the MCL for chlorite in water at 1 mg/L
(1,000 µg/L) and the 1.1 mg/L ClO2 dose used in the UCF laboratory experiments resulted in
a chlorite concentration of 65 µg/L, significantly below the MCL.
• Treating Fena Lake raw water with potassium permanganate resulted in slight DBP reduction
compared to historical prechlorination conditions. Based on the studies performed in UCF
drinking water laboratories comparing alternative pre-oxidant treatments (chlorine, potassium
permanganate, chlorine dioxide, and no pre-oxidant), potassium permanganate resulted in
48

TTHM and HAA5 percent reductions of 5.70% and 22.7%, respectively, when compared to
prechlorination that was historically implemented at Fena Lake. Although Colthurst and Singer
(1982) found that KMnO4 absorbs THM precursors that can then be removed in sedimentation
and filtration, the increase in DBPs with KMnO4 pretreatment relative to no pretreatment may
be due to the additional primary disinfectant added downstream or because the dissolved
organic carbon was less amendable to coagulation. The use of potassium permanganate may
also present operation challenges related to chemical feed containment, handling and dosing
control that could compromise its use and not having accurate control of the permanganate
dosages will result in pink water formation as demonstrated by Hall (2014).
• An analysis of fluoride tracer data confirmed excessive detention times existed within the
PWS. Variable hydraulic detention times existed within Apra View Housing ranging from 5
to 10 days. It was determined that the housing complex was being fed by a dead-end pipeline.
The information was used to take corrective management actions.
• A BFC placed in-series with the CSF clarifier was effective in controlling DBP formation
during severe weather conditions. Based on the results obtained, the TTHM and HAA5
concentrations taken throughout the distribution system were below 39 µg/L and 29 µg/L,
respectively, when the NWTP ran BFC in-series with the conventional system and the
prechlorination process was off-line at Fena Lake. Should the plant experience severe weather
in the future, a BFC-CSF clarifier in-series approach is a practical option recommended for
application in the NWTP.
49

Recommendations
• Additional studies to evaluate DBP formation throughout the distribution system when using
various blends of Fena Lake, Bona Spring, and Almagosa Spring are recommended. One
option the US Navy should consider to study further is related to the qualitative observation
that would indicate that the spring-lake blends produce less DBP formation than that of Fena
Lake itself. Consequently, if proven, this would allow the Navy to increase spring flows and
reduce Fena Lake flows during peak DBP events (should they occur). Consequently, should
higher levels of DBPs be observed, then the flow of the springs could be increased (if available)
in proportion to the Fena Lake flows, thereby further reducing DBP formation within the Navy
distribution system. However, secondary impacts of this decision could mean intermittent red
water complaints or corrosion impacts as the Springs’ water is a different quality than Fena
Lake. Thus it is not a long-term solution, but would be able to be implemented quickly at low
cost until other options have been fully vetted. Consequently a study that further investigates
this observed trend may be of benefit to the Navy’s operations.
• Prechlorination should remain off-line at Fena Lake to avoid excessive DBP formation within
the NWTP and PWS. Based on the results of this study, to avoid excessive DBP formation in
the PWS, it is recommended that prechlorination remain off-line. However, it is further
recommended that an alternative pretreatment system be identified to either enhance or replace
prechlorination in the event a taste and odor event occur in Fena Lake.
• Additional chlorine dioxide engineering evaluations to include pilot testing are required to
pursue an alternative option to the continued use of chlorination pretreatment. It is
recommended that pilot testing of chlorine dioxide pretreatment be performed for a minimum
50

of eight months to capture seasonal impacts prior to engineering studies and design activities
commencing for this pretreatment option. The use of chlorine dioxide would aid in operation
of the facility with respect to iron and manganese control, taste and odor (based on analogous
water industry research), as well as aid in reducing formation of regulated DBPs. Public
outreach and education would be a necessary component of these additional studies and
evaluations should this option be pursued.
51

UCF TTHM DATA
52

Table A.1 October 16, 2013 THM FP concentrations - Cl2 vs. KMnO4
Pre-oxidant
Number of Hours After
Dose
Chloroform Bromo-dichloromethane
Dibromo-chloromethane Bromoform TTHM
(µg/L) (µg/L) (µg/L) (µg/L) (µg/L)
Control
0 < 5.00 < 1.00 < 1.00 < 1.00 < 8.00 2 15.7 6.28 < 1.00 < 1.00 23.9 6 22.5 8.59 1.31 < 1.00 33.4 24 35.4 11.9 1.94 < 1.00 50.2 96 60.1 16.4 2.63 < 1.00 80.2 168 74.5 18.1 2.85 < 1.00 96.5
Cl2
B1285 12.7 < 1.00 < 1.00 < 1.00 15.7 Rapid Mix 20.0 1.49 < 1.00 < 1.00 23.5
0 24.2 2.40 < 1.00 < 1.00 28.6 2 33.3 3.44 < 1.00 < 1.00 38.7 6 40.7 4.35 < 1.00 < 1.00 47.0 24 61.8 6.34 < 1.00 < 1.00 70.1 96 96.5 9.06 < 1.00 < 1.00 107 168 115 10.0 < 1.00 < 1.00 127
KMnO4
B1285 < 5.00 < 1.00 < 1.00 < 1.00 < 8.00 Rapid Mix < 5.00 < 1.00 < 1.00 < 1.00 < 8.00
0 < 5.00 < 1.00 < 1.00 < 1.00 < 8.00 2 20.2 7.56 1.05 < 1.00 29.8 6 26.1 9.44 1.41 < 1.00 38.0 24 40.9 12.9 1.94 < 1.00 56.8 96 71.4 17.8 2.56 < 1.00 92.8 168 91.1 19.9 2.82 < 1.00 114
53

Table A.2 October 28, 2013 THM FP concentrations - Cl2 vs. KMnO4
Pre-oxidant
Number of Hours After
Dose
Chloroform Bromo-dichloromethane
Dibromo-chloromethane Bromoform TTHM
(µg/L) (µg/L) (µg/L) (µg/L) (µg/L)
Control
0 < 5.00 < 1.00 < 1.00 < 1.00 < 8.00 2 13.7 4.66 < 1.00 < 1.00 20.3 6 19.4 7.07 < 1.00 < 1.00 28.5 24 30.9 10.2 1.16 < 1.00 43.3 96 52.2 14.5 1.96 < 1.00 69.7 168 66.3 16.4 2.07 1.39 89.2
Cl2
B1285 12.9 < 1.00 < 1.00 < 1.00 15.9 Rapid Mix 23.0 1.28 < 1.00 < 1.00 26.3
0 28.0 2.72 < 1.00 < 1.00 32.7 2 34.1 3.82 < 1.00 < 1.00 39.9 6 42.7 5.14 < 1.00 < 1.00 49.8 24 58.6 6.78 < 1.00 < 1.00 67.4 96 83.5 8.92 < 1.00 < 1.00 94.4 168 98.5 9.13 < 1.00 < 1.00 109.6
KMnO4
B1285 < 5.00 < 1.00 < 1.00 < 1.00 < 8.00 Rapid Mix < 5.00 < 1.00 < 1.00 < 1.00 < 8.00
0 < 5.00 < 1.00 < 1.00 < 1.00 < 8.00 2 14.7 5.42 < 1.00 1.24 22.3 6 20.9 7.61 < 1.00 1.29 30.5 24 32.4 10.4 1.11 1.79 45.7 96 58.6 16.2 2.09 1.80 77.9 168 73.2 18.3 2.42 1.79 95.0
54

Table A.3 January 21, 2014 THM FP concentrations - Cl2 vs. KMnO4
Pre-oxidant
Number of Hours After
Dose
Chloroform Bromo-dichloromethane
Dibromo-chloromethane Bromoform TTHM
(µg/L) (µg/L) (µg/L) (µg/L) (µg/L)
Control
0 < 5.00 < 1.00 < 1.00 < 1.00 < 8.00 2 8.16 3.68 < 1.00 < 1.00 13.8 6 14.0 6.70 < 1.00 < 1.00 22.7 24 29.7 13.2 1.33 < 1.00 45.2 96 51.3 18.6 2.47 < 1.00 73.4 168 61.5 20.7 2.79 < 1.00 86.1
Cl2
0 20.4 2.92 < 1.00 < 1.00 25.4 2 25.6 3.57 < 1.00 < 1.00 31.2 6 32.7 5.30 < 1.00 < 1.00 40.0 24 51.0 11.6 < 1.00 < 1.00 64.7 72 71.0 11.4 < 1.00 < 1.00 84.5 168 97.7 17.3 1.80 < 1.00 117
KMnO4
0 < 5.00 < 1.00 < 1.00 < 1.00 < 8.00 2 13.3 5.35 1.40 < 1.00 21.0 6 19.4 12.0 1.61 < 1.00 34.0 24 37.7 14.7 3.91 < 1.00 57.4 72 57.9 19.3 4.56 < 1.00 82.8 168 80.8 23.0 5.53 < 1.00 110
55

Table A.4 June 17, 2014 THM FP concentrations - Cl2 vs. ClO2
Pre-oxidant
Number of Hours After
Dose
Chloroform Bromo-dichloromethane
Dibromo-chloromethane Bromoform TTHM
(µg/L) (µg/L) (µg/L) (µg/L) (µg/L)
Control
0 < 5.00 < 1.00 < 1.00 < 1.00 < 8.00
48 38.8 14.6 4.77 < 1.00 59.2
168 55.6 20.0 6.34 < 1.00 83.0
Cl2
0 19.7 5.05 1.76 < 1.00 27.5
48 51.5 12.5 3.58 < 1.00 68.7
168 87.9 18.2 4.47 < 1.00 111
ClO2
0 < 5.00 < 1.00 < 1.00 < 1.00 < 8.00
48 21.1 12.4 6.00 < 1.00 40.5
168 34.2 17.5 8.00 < 1.00 60.8
56

Table A.5 July 7, 2014 THM FP concentrations - Cl2 vs. ClO2
Pre-oxidant
Number of Hours After
Dose
Chloroform Bromo-dichloromethane
Dibromo-chloromethane Bromoform TTHM
(µg/L) (µg/L) (µg/L) (µg/L) (µg/L)
Cl2
0 14.3 4.31 1.44 < 1.00 21.1
2 21.9 6.82 2.18 < 1.00 31.9
6 28.5 8.61 2.71 < 1.00 40.8
24 41.8 12.4 3.57 < 1.00 58.9
96 70.0 17.8 4.46 < 1.00 93.4
168 86.8 20.2 4.83 < 1.00 112
ClO2
0 < 5.00 < 1.00 < 1.00 < 1.00 < 8.00
2 8.22 7.66 4.83 1.20 21.9
6 12.7 10.6 6.08 1.34 30.8
24 21.9 14.9 8.16 1.50 46.5
96 35.9 19.4 9.35 1.60 66.3
168 41.8 20.3 9.24 1.58 73.0
57

Table A.6 July 7, 2014 THM FP concentrations - Cl2 vs. KMnO4 vs. ClO2
Pre-oxidant
Number of Hours After
Dose
Chloroform Bromo-dichloromethane
Dibromo-chloromethane Bromoform TTHM
(µg/L) (µg/L) (µg/L) (µg/L) (µg/L)
Control
0 4.68 0.83 0.56 < 0.45 5.51
48 38.3 7.67 6.05 < 0.45 52.0
168 51.9 18.8 6.43 < 0.45 77.2
Cl2
0 12.2 3.67 1.01 < 0.45 16.9
48 52.3 12.8 0.56 < 0.45 65.2
168 81.6 15.1 3.23 < 0.45 100
KMnO4
0 4.46 0.79 0.56 < 0.45 5.25
48 39.0 16.2 5.46 < 0.45 60.8
168 66.3 21.3 6.63 < 0.45 94.3
ClO2
0 1.58 0.61 0.56 < 0.45 2.19
48 21.2 13.1 6.60 < 0.45 40.9
168 39.0 17.9 8.04 0.52 65.5
58

UCF HAA5 DATA
59

Table B.1 June 16, 2014 HAA5 concentrations: Cl2 vs. KMnO4 vs. ClO2
Pre-oxidant
Number of Hours
After Dose
Bromoacetic Acid
Chloroacetic Acid
Dibromoacetic Acid
Dichloroacetic Acid
Trichloroacetic Acid HAA5
(µg/L) (µg/L) (µg/L) (µg/L) (µg/L) (µg/L)
Control
0 0.54 0.200 0.540 4.21 2.47 6.68
48 0.90 0.240 0.900 19.0 16.4 37.5
168 0.68 4.84 1.13 26.6 15.5 48.8
Cl2
0 0.63 2.98 0.540 13.3 7.71 24.6
48 0.77 4.76 0.870 29.1 20.4 55.9
168 0.65 7.41 1.00 40.1 24.5 73.1
KMnO4
0 0.54 0.200 0.540 4.53 2.66 7.19
48 0.75 4.12 0.770 21.6 18.0 45.3
168 0.60 4.91 1.18 32.1 21.6 60.5
ClO2
0 0.54 0.200 0.540 2.91 1.17 4.08
48 0.83 3.97 1.09 13.2 8.09 27.2
168 0.94 5.29 1.37 21.1 10.0 38.8
60

Table B.2 June 30, 2014 HAA5 concentrations: Cl2 vs. KMnO4 vs. ClO2
Pre-oxidant
Number of Hours
After Dose
Bromoacetic Acid
Chloroacetic Acid
Dibromoacetic Acid
Dichloroacetic Acid
Trichloroacetic Acid HAA5
(µg/L) (µg/L) (µg/L) (µg/L) (µg/L) (µg/L)
Control
0 0.54 1.16 0.540 3.91 2.12 7.19
48 0.85 0.200 0.840 22.0 17.3 41.0
168 0.71 5.17 1.38 36.0 23.2 66.5
Cl2
0 0.54 2.84 0.540 16.9 12.4 32.2
48 0.78 4.36 0.910 34.2 26.1 66.4
168 0.65 7.57 1.29 52.0 33.6 95.2
KMnO4
0 0.54 1.47 0.540 4.08 2.16 7.71
48 0.81 0.200 0.960 21.9 19.0 42.7
168 0.67 5.23 1.38 34.3 24.7 66.3
ClO2
0 0.54 0.200 0.650 2.40 0.910 2.40
48 0.82 0.200 1.47 13.0 6.22 21.5
168 0.86 0.200 1.73 20.3 7.17 30.1
61

Table B.3 July 7, 2014 HAA5 concentrations: Cl2 vs. KMnO4 vs. ClO2
Pre-oxidant
Number of Hours
After Dose
Bromoacetic Acid
Chloroacetic Acid
Dibromoacetic Acid
Dichloroacetic Acid
Trichloroacetic Acid HAA5
(µg/L) (µg/L) (µg/L) (µg/L) (µg/L) (µg/L)
Control
0 0.54 1.48 0.540 3.41 1.72 6.61
48 0.83 0.200 0.910 17.6 14.7 34.1
168 0.92 5.30 0.830 24.1 15.7 46.9
Cl2
0 0.54 0.200 0.540 13.4 8.75 22.2
48 0.82 4.89 0.810 27.2 20.7 54.5
168 0.91 6.93 0.880 40.3 28.4 77.5
KMnO4
0 0.54 2.00 0.540 3.97 2.17 8.14
48 0.89 4.97 0.790 20.1 11.8 38.5
168 1.04 5.37 1.25 35.2 16.1 56.1
ClO2
0 0.54 0.200 0.540 2.47 0.91 2.47
48 1.11 0.200 1.63 11.9 4.11 18.8
168 1.28 4.79 1.44 18.6 5.07 31.2
62

Table B.4 August 4, 2014 HAA5 concentrations: Cl2 vs. KMnO4 vs. ClO2
Pre-oxidant
Number of Hours
After Dose
Bromoacetic Acid
Chloroacetic Acid
Dibromoacetic Acid
Dichloroacetic Acid
Trichloroacetic Acid HAA5
(µg/L) (µg/L) (µg/L) (µg/L) (µg/L) (µg/L)
Control 168 0.86 3.96 1.35 24.9 15.3 46.4
Cl2 168 0.75 5.73 0.94 42.7 25.0 75.2
KMnO4 168 0.84 4.35 1.34 31.0 20.8 58.4
ClO2 168 0.93 3.58 2.05 21.0 8.18 35.7
63

CHLORITE AND CHLORATE DATA
64

Table C.1 Chlorate and chlorite concentrations for 1.1 mg/L ClO2 pre-oxidant dose
Experiment # Chlorate Concentration Chlorite Concentration (µg/L) (µg/L)
4 < 190 < 65 5 - - 6 < 190 < 65
Federal chlorite MCL = 1000 µg/L, California chlorate MCL = 800 µg/L
65

WATER QUALITY DATA
66

Table D.1 Water quality data
Experiment Date Sample ID Parameter
pH Temp Conductivity Turbidity TOC UV254 (Std Units) (°C) (uS/cm) (NTU) (mg/L) (1/cm)
Part 1 Trial 1 10/16/2013
Raw 7.62 21.5 155 2.31 NC NC Cl2 7.02 22.5 169 1.28 NC NC No pretreatment 7.04 22.5 154 1.46 NC NC KMnO4 7.01 22.5 158 1.08 NC NC Raw Filtered 7.52 23.4 157 0.03 NC NC Cl2 Filtered 7.25 23.2 173 0.08 NC NC No pretreatment Filtered 7.23 23.2 157 0.06 NC NC KMnO4 Filtered 7.25 23.1 157 0.07 NC NC
Part 1 Trial 2 10/28/2013
Raw 7.56 21.5 144 2.90 NC NC Cl2 7.05 21.6 171 2.91 NC NC No pretreatment 7.01 21.6 153 2.85 NC NC KMnO4 6.97 21.5 158 2.83 NC NC Raw Filtered 7.49 22.3 156 0.03 NC NC Cl2 Filtered 6.92 22.5 173 0.09 NC NC No pretreatment Filtered 6.88 22.5 163 0.07 NC NC KMnO4 Filtered 6.91 22.5 162 0.04 NC NC
Part 1 Trial 3 1/21/2014
Raw 8.03 20.3 194 2.12 NC NC Cl2 7.07 20.3 211 2.19 NC NC No pretreatment 7.08 20.3 201 2.11 NC NC KMnO4 7.13 20.3 201 2.04 NC NC Raw Filtered 8.01 22.4 154 0.04 NC NC Cl2 Filtered 7.02 22.5 169 0.10 NC NC No pretreatment Filtered 6.97 22.3 162 0.08 NC NC KMnO4 Filtered 6.92 22.5 159 0.07 NC NC
NC = not collected (continued)
67

Table D.1 (Continued) Water quality data
Experiment Date Sample ID Parameter
pH Temp Conductivity Turbidity TOC UV254 (Std Units) (°C) (uS/cm) (NTU) (mg/L) (1/cm)
Part 2 Trial 4 6/17/2014
Raw 8.58 22.3 215 1.67 3.52 NC Cl2 7.11 23.5 238 1.71 3.71 NC No Pretreatment 7.13 23.2 227 1.64 3.65 NC KMnO4 7.04 22.0 224 1.69 3.62 NC ClO2 6.80 21.9 241 1.73 3.59 NC Raw Filtered 7.32 22.5 214 0.03 2.69 NC Cl2 Filtered 7.12 22.4 222 0.21 NC NC No Pretreatment Filtered 7.10 22.4 219 0.16 NC NC KMnO4 Filtered 7.08 22.5 221 0.13 NC NC ClO2 Filtered 7 22.5 235 0.15 NC NC
Part 2 Trial 3 7/7/2014
Raw 8.15 22.5 263 1.40 3.57 0.040 Cl2 7.11 22.0 280 2.35 3.72 0.050 No Pretreatment 7.11 22.0 270 2.56 3.65 0.061 KMnO4 7.04 22.5 273 2.47 3.63 0.064 ClO2 6.78 22.6 294 1.59 3.13 0.045 Raw Filtered 7.88 22.5 262 0.03 3.32 0.039 Cl2 Filtered 7.43 22.6 281 0.19 2.52 0.023 No Pretreatment Filtered 7.37 22.6 274 0.16 2.37 0.028 KMnO4 Filtered 7.34 22.7 275 0.15 2.29 0.028 ClO2 Filtered 7.00 22.9 296 0.16 2.16 0.023
Part 2 Trial 4 8/4/2014
Raw 7.99 21.8 249 1.58 3.43 0.005 Cl2 7.91 22.0 254 1.82 3.80 0.042 No Pretreatment 7.92 21.9 247 1.52 3.53 0.051 KMnO4 7.96 21.8 248 1.71 3.58 0.052 ClO2 6.95 22.0 272 1.91 3.78 0.047 Cl2 Filtered 7.16 22.9 274 0.10 2.53 0.016 No Pretreatment Filtered 6.99 22.3 262 0.13 1.98 0.019 KMnO4 Filtered 6.99 22.5 264 0.09 2.00 0.023 ClO2 Filtered 7.10 22.4 295 0.08 1.85 0.021
68

SYSTEM MANAGEMENT DBP DATA
69

Table E.1 Clearwell DBP data
Date Condition TTHM (ug/L)
HAA5 (ug/L)
% Reduction TTHM HAA
Sept. 2012 with prechlorination 117 93.7 - -
Sept. 2013 without prechlorination 31.8 12.2 72.8% 87.0%
Table E.2 Distribution system DBP data
Sample Location 2011 2013 TTHM HAA5 TTHM HAA5
McCool's 111 97.6 36.6 21.5 #68 Madrid Circle, N. Tipalao 94.5 76.8 36.5 21.8 #70 Plumeria St., Apra Palms 90.6 79.8 35.7 19.4 #24 Portola St., N. Tipalao 86.6 96.4 37 24.3
Table E.3 Fluoride tracer study
Number of Days / Location
Fluoride Concentration (mg/L)
Date Sampled McCool's
#17 Powers,
Lockwood
#68 Madrid
Circle, N. Tipalao
#70 Plumeria St., Apra
Palms
#8 Anae Lane, Apra View
#24 Portola St., N. Tipalao
1 0.548 0.509 0.593 0.393 0.648 0.435 8/30/2013 2 0.551 0.348 0.393 0.326 0.706 0.325 8/31/2013 3 0.509 0.281 0.290 0.278 0.668 0.264 9/1/2013 4 0.251 0.252 0.251 0.263 0.703 0.218 9/2/2013 5 <mdl <mdl <mdl <mdl 0.510 <mdl 9/3/2013 6 0.395 9/4/2013 7 0.382 9/5/2013 8 0.291 9/6/2013 9 0.248 9/7/2013 10 0.236 9/8/2013 11 <mdl 9/9/2013
70

REFERENCES
American Public Health Association, American Water Works Association, & Water Environment
Federation. (2005). Standard Methods for the Examination of Water & Wastewater (A. D.
Eaton & M. A. H. Franson Eds.): American Public Health Association.
American Water Works Association. (2011). Water Quality & Treatment: A Handbook on
Drinking Water (J. K. Edzwald Ed.): McGraw-Hill New York.
Bellar, T. A., & Lichtenberg, J. J. (1974). Determining volatile organics at microgram-per-litre
levels by gas chromatography. Journal (American Water Works Association), 739-744.
Boyle Engineering Corporation. (2001). Comprehensive Performance Evaluation of the Fena
Water Treatment Plant. U.S. Navy Public Water System, Tamuning, Guam, Marianas
Islands: Duenas & Associates, Inc.
Brown and Caldwell. (2014). Disinfection-By-Product (DBP) Reduction Study for Navy Water
Sources, Production and Treatment, and Distribution Systems, Guam.
Colthurst, J. M., & Singer, P. C. (1982). Removing trihalomethane precursors by permanganate
oxidation and manganese dioxide adsorption. American Water Works Association Journal,
74(2), 78-83.
Connell, G. F. (1996). Chlorination/chloramination handbook: American Water Works
Association.
71

Crittenden, J. C., Trussell, R. R., Hand, D. W., Howe, K. J., & Tchobanoglous, G. (2005). Water
treatment: Principles and Design Second Edition (2nd ed.). Hoboken, N.J.: Wiley.
Crittenden, J. C., Trussell, R. R., Hand, D. W., Howe, K. J., & Tchobanoglous, G. (2012).
Principles of Water Treatment: Wiley.
Duranceau, S. J., & Taylor, J. S. (2010). Chapter 11 Membrane Processes Water Quality and
Treatment (6 ed., pp. 11-11 to 11-106). New York: McGraw-Hill.
Hall, C. (2014). Evaluation of iron and manganese control for a volcanic surface water supply
treated with conventional coagulation, sedimentation and filtration processes. University
of Central Florida, Master's Thesis. Orlando, FL. Available from EBSCOhost cat00846a
database.
Hautman, D. P. M., David J. (1997). U.S. EPA Method 300.1 Determination of Inorganic Anions
in Drinking Water by Ion Chromatography.
Jones, P. A., & Taylor, J. S. (1992). DBP Control by Nanofiltration, Cost and Performance.
American Water Works Association Journal, 84, 104-116.
Matilainen, A., Vepsäläinen, M., & Sillanpää, M. (2010). Natural organic matter removal by
coagulation during drinking water treatment: A review. Advances in Colloid and Interface
Science, 159, 189-197.
72

Miller, J. W., & Uden, P. C. (1983). Characterization of nonvolatile aqueous chlorination products
of humic substances. Environmental Science & Technology, 17(3), 150-157. doi:
10.1021/es00109a006
Nnadi, F. N., Hernandez, M., & Fulkerson, M. (2004). Evaluation of Techniques for Control of
Disinfection By-products: A Pilot Study. Journal of Environmental Science and Health,
Part A, 39(6), 1573-1585. doi: 10.1081/ESE-120037855
Ranieri, E., & Swietlik, J. (2010). DBPs control in European drinking water treatment plants using
chlorine dioxide: Two case studies. Journal of Environmental Engineering and Landscape
Management, 18(2), 85-91. doi: 10.3846/jeelm.2010.10
Richardson, S. D. (2005). New Disinfection By-Product Issues: Emerging DBPs and Alternative
Routes of Exposure. Global NEST Journal, 7(1), 43-60.
Rook, J. J. (1974). Formation of haloforms during chlorination of natural waters. J. Water Treat.
Exam., 23, 234-243.
Siemens Water Technologies. Millenium III AC-3/10 Chlorine Dioxide Generator. (Book No.
WT.085.262.000.UA.IM.0908).
Singer, P. C., & Reckhow, D. A. (2011). Chapter 7 Chemical Oxidation Water Quality &
Treatment: A Handbook on Drinking Water (6 ed., pp. 7-1 to 7-52). New York: McGraw-
Hill.
73

Taylor, J. S., Mulford, L. A., Barrett, W. M., Duranceau, S. J., & Smith, D. K. (1989). Cost and
Performance of Membrane Processes for Organic Control on Small Systems. Cincinnati,
OH: U.S. Environmental Protection Agency Water Engineering Research Laboratory.
Taylor, J. S., Mulford, L. A., Duranceau, S. J., & Barrett, W. (1989). Cost and Performance of a
Membrane Pilot Plant. American Water Works Association Journal, 81(11), 52-60.
Taylor, J. S., Thompson, D., Carswell, J. K., & Keith, J. (1987). Applying Membrane Processes to
Groundwater Sources for Trihalomethane Precursor Control. American Water Works
Association Journal, 79(8), 72-82.
Taylor, J. S., Thompson, D., Snyder, B. R., Less, J., & Mulford, J. L. (1986). Cost and Performance
Evaluation of In-Plant Trihalomethane Control Techniques, EPA 600/2-85-168.
Cincinnati, OH: U.S. Environmental Protection Agency.
UCF. (2013). Iron and Manganese Water Quality and Treatment Study Component Findings and
Recommendations. Orlando, FL: University of Central Florida. Funding Contract
16208121.
UCF. (2014). Disinfection By-Product Reduction Study. Orlando, FL: University of Central
Florida. Funding Contract 16208121.
USEPA. (1979a). Control of Trihalomethanes in Drinking Water. Final Rule. Federal Register.
44:68624.
74

USEPA. (1979b). Handbook for Analytical Quality Control in Water and Wastewater
Laboratories. Cincinnati, Ohio: Environmental Monitoring and Support Laboratory. U.S.
EPA Office of Research and Development. EPA-600/-79-019.
USEPA. (1998). National Primary Drinking Water Regulations: Disinfectants and Disinfection
Byproducts. Final Rule. Federal Register: December 16, 1998. 63 (241), 69389-69476.
USEPA. (1999). Enhanced Coagulation and Enhanced Precipitative Softening Guide. Office of
Water. EPA 815-R-99-012.
USEPA. (2006). National Primary Drinking Water Regulations: Stage 2 Disinfectant/Disinfection
Byproducts Rule. Final Rule. Federal Register: March 6, 2006. 71 (388), 388-493.
Yang, X., Guo, W., Zhang, X., Chen, F., Ye, T., & Liu, W. (2013). Formation of disinfection by-
products after pre-oxidation with chlorine dioxide or ferrate. Water Research, 47(15),
5856-5864.
Zogo, D., Bawa, L., Soclo, H., & Atchekpe, D. (2011). Influence of pre-oxidation with potassium
permanganate on the efficiency of iron and manganese removal from surface water by
coagulation-flocculation using aluminium sulphate: case of the Okpara dam in the Republic
of Benin. J Environ Chem Ecotoxicol, 3(1), 1-8.
75