Embed Size (px)
Citation preview
MIT Supply Chain Risk Survey
Findings: South Africa

Contents• Supply Chain Risk Management
• Introduction & Context
• Survey Span
• Respondent Description
• Key Findings
– Most important supply chain risks
– Major internal & external risks
– Company urgency alignment
– Broad risk occurrence frequency
– Response focus areas
– Risk Management
• Next Steps
• Questions

Supply Chain Risk Management
Poor Product Quality
Poor Delivery
UnexpectedPoor CustomerPerformance
Poor Performance
due toInternal Business Practices
People
Technology & Systems
SC Interruptions due to External
Factors
UnexpectedPoor FinancialPerformance
Poor Asset Management
Poor Profits
• Excess Inventory
• Excessive A/R
• Abuse of A/P
• Cost too high
• Sales too low
• Prices too low
• Out of RM Stock
• Out of FG Stock
• Poor Distr Process
Loss of Control
Supply ChainInterruption
Difficult Business Climate
Political & Social
Mother Nature
Health & Environment
Crime & Terror
Economic & Financial

Introduction and Context
• Global risk survey undertaken in 12 countries, with respondents
from over 70 countries. Over 250 respondents visited South African
survey.
• Motivation was to identify common supply chain risk perceptions,
management thereof & meaning within a South African context.
• Risk environment in South Africa can now be compared to
international findings.
• Conditions at the time of Survey:
– Global recession nearing end
– Eskom power price hikes in question, not yet confirmed
– Ongoing strikes & high volume of job losses
– Soccer world cup “anticipation”

Survey Span
BRA 58
COL 17
RSA 142
UK 21SPA 113NDR 12GER 12SWI 129ITA 74
CAN 23
USA 466
MEX 37
CHI 53
AUS 20
IND 65
• A total of 2434 people visited the survey• 1461 people from over 70 countries completed survey• Significant responses (10+) recieved from countries shown• Mixture of “supplier” and “consumer” countries

Respondent description
• 81% male respondents.
• 88% of all respondents over the age of 30.
• 65% have a college/university degree or higher with the vast
majority of these in the business, and to a lesser degree,
engineering fields.
• Generally respondents work in middle management/supervisory
roles.
• Respondents work mainly in South African urban centres.
• Operations, supply chain planning and consulting fields are most
prominent job positions.

Respondent description
0%
10%
20%
30%
40%
50%
60%
70%
80%
90%
100%
Grew Up in Work in
Pe
rce
nta
ge o
f re
spo
nd
en
ts
Setting grew up in/work in
Large City
Small City
Suburban
Small Town
Rural
Farm
70%
75%
80%
85%
90%
95%
100%
Grew Up in Work in
Pe
rce
nta
ge o
f re
spo
nd
en
ts
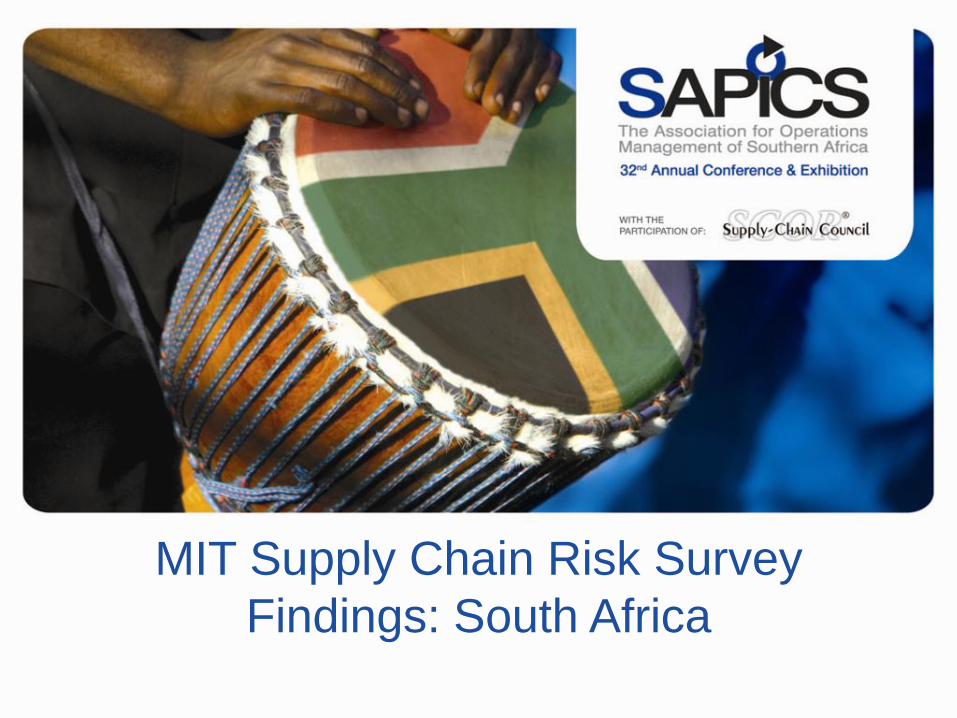
Country grew up in/work in
Other
UAE
Austrailia
Cameroon
Namibia
USA
UK
Zimbabwe
South Africa
Respondent description

0% 5% 10% 15% 20% 25%
Sales
Marketing
Manufacturing
Transportation
Customer Service
R&D
Sourcing
Engineering
Risk Management
Finance
General Mgmnt
Purchasing
Distribution
Other
SC Planning
Operations
Job and Supply Chain Position
Respondent description
•Operations and planning activities
are where many respondents are
involved
•“Other” positions are generally
consulting or technology related.

Key Findings
Most Important
Supply Chain
Risks
Frequency of Major
disruptions –
Internal & External
Risk Response
Management
Risk Response
& Perceived
Action Areas
Frequency of
broad types of
Risk
1
2
4
6
5Company
Urgency
Alignment
3
Key Survey
Findings

0
10
20
30
40
50
60
70
80
Raw Material supplier failure
Transportation carrier failure
Finished Goods manufacturing
failure
Product Quality Failure
Economic Recession or
Market Collapse
Failure of major software systems
Spike in raw material costs
Extended Loss of Electricity (>
1 day)
Inventory write-off due to new design change
Cash crisis due to customers
delaying
payment
Top 10 Supply Chain Risks
1st most important Risk 2nd most important Risk 3rd most important Risk
Key Findings
Nu
mb
er o
f R
esp
on
ses
1
• Respondents rated list of possible risks
by 1st, 2nd, 3rd most important.
• Accumulation of responses shown for
each risk.
• Raw material supplier failure ranks as
most important risk – Follows
international trend.

Key Findings
0% 1% 2% 3% 4% 5% 6% 7% 8% 9% 10%
Cash crisis due to sudden drop in credit rating
Price collapse due to a new competitor
Sales collapse due to a new competing product
Spike in energy costs
Spike in raw material costs
Cash crisis due to customers delaying payment
Employee theft and executive misdeeds
Failure of major software systems
Inventory write-off due to new design change
Raw Material supplier failure
Finished Goods manufacturing failure
Product Quality Failure
Transportation carrier failure
Internal Events - Major Distruptions
2
• Respondents rated major
external disruptions according to
frequency of their occurrence
• Data weighted according to
disruption frequency (Higher
frequency carries higher weight)
• Four top disruptions generally in
line with international findings

Key Findings
0% 2% 4% 6% 8% 10% 12% 14% 16% 18%
Earthquakes or Tsunamis
Hurricanes, Tornados, or Typhoons
Floods or Mudslides
Civil Unrest or Terrorism
Disease or Infestation
Fires or Explosions
Product Tampering or Counterfeit Products
Computer Virus or Cyber Attack
Sudden Currency Devaluation
Economic Recession or Market Collapse
Extended Loss of Electricity (>1 day)
Protracted Labor Disputes
External Events - Major Disruptions
2
• Respondents rated major
external disruptions according to
frequency of their occurrence
• Data weighted according to
disruption frequency (Higher
frequency carries higher weight)
•Protracted labour disputes and
extended loss of electricity occur
most frequently. Unique South
African conditions.

Key Findings 3
0%
10%
20%
30%
40%
50%
60%
70%
80%
90%
100%
Supplier/Company Alignment Customer/Company Alignment
Company Urgency Alignment
Completely Different Sense of Urgency Mostly different sense of urgency
Midway alignment Similar sense of urgency
Exactly the same sense of urgency
•Lack of urgency alignment
indicates greater risk potential.
• Alignment stronger with customer
than supplier

Key Findings 4
0% 2% 4% 6% 8% 10% 12% 14% 16% 18% 20%
Run out of cash
People are not available
Cannot ship or deliver your products
Sudden drop in customer demand
Cannot communicate with vendors/customers/other sites
Lose supply of quality materials
Internal operations distruption
Frequency of Major Supply Chain Risks
Never Rarely About Yearly Weekly or Monthly Almost Daily
• Respondents rated
major types of
disruptions according to
frequency of their
occurrence.
• Greater frequencies
weighted higher.
• Severity indicated by
fade to red.
• Internal and supplier-
related disruptions are
most prominent and
occur most frequently.

Key Findings 5
0%
5%
10%
15%
20%
25%
30%
35%
Much more effort on Risk Prevention
Slightly more effort on Risk
Prevention
Equal effort to each
Slightly more effort on Event
Response
Much more effort on Event
Response
Pe
rce
nta
ge o
f R
esp
on
de
nts
Mitigation Actions
Risk Mitigation Perceptions
• Respondents rated the effort they believe
should be placed on “prevention vs cure”
• More emphasis should be placed on
prevention.
• This suggests that not enough is currently
being done to prevent risks from occurring.

Key Findings
0%
5%
10%
15%
20%
25%
30%
35%
40%
45%
Response Action vs Direction of effort
Planning Risk Prevention Measures Planning Event Response Actions
Implementing Prevention Measures Performing event response Actions
Directed Centrally Directed LocallyEve
nt
Re
sp
on
se
R
isk
Pre
ve
nti
on
Ac
tio
ns
M
ea
su
res
• Respondents rated the scale at which planning vs responding activities should be directed
• The scale shifts from central to local the more immediate the measure/action is
• Site level would thus see the implementation of a centrally planned event response or preventative measure
5

Key Findings
0% 1% 2% 3% 4% 5% 6% 7% 8% 9%
Simulate different supply chain risks and disruptions
Have emergency operations center
Have business continuity manager/group
Risk manager goes beyond just buying insurance
Work with customers on SCRM
Work with law enforcement/emergency managemen on SCRM
Work with suppliers on SCRM
Have a formal security strategy
Monitor world events for incidents that affect us
Have a "risk" manager or group
Actively work on supply chain risk management
Have business continuity plan
Analyze incidents, identify process improvements
Approaches to SCRM
• Respondents rated the actions that
are currently being undertaken at their
organisations to deal with supply chain
risk
• Most companies have a plan or risk
manager/group, or approach SCRM
on an ad hoc basis
6

Phase 2: International Benchmarking
• Compare South African data to international findings.
• Understand differences and underlying drivers
Phase 3: Applied Research
• More analysis on specific risk factors and mitigation
factors.
• Apply findings to future risk scenarios.
• Investigate company specific approaches
Next Steps

Questions?