Embed Size (px)
Citation preview

MIT ICATMIT ICAT
Airline Industry Recent Trend Update (October 2006)
Prof. R. John HansmanProf. R. John Hansman
With the help of the Faculty and Students of the MIT Global With the help of the Faculty and Students of the MIT Global Industry StudyIndustry Study
[email protected]@mit.eduTraffic Source: Sage Analysis courtesy Prof Ian Waitz

MIT ICATMIT ICAT RPK by Region
Scheduled Revenue Passenger-Kilometers by Region
0
200
400
600
800
1000
1200
1400
1970 1980 1990 2000 2010
RPK
(bill
ion)
North America
Europe
Asia andPacificLatin America& CaribbeanMiddle East
Africa
Data source: ICAO, scheduled services of commercial air carriers
MIT ICATMIT ICAT Freight Trends by Region
Freight Tonne-Kilometers by Region
0
10
20
30
40
50
60
1970 1980 1990 2000 2010
FTK
(bill
ion)
North America
Europe
Asia andPacificLatin America& CaribbeanMiddle East
Africa
Data source: ICAO, scheduled services of commercial air carriers

MIT ICATMIT ICAT U.S. Domestic RPMs
20
25
30
35
40
45
50
Jan Feb Mar Apr May Jun Jul Aug Sep Oct Nov Dec
Bill
ions
2000 2001 2002 2003 2004 2005 2006
Source: ATA Monthly Passenger Traffic ReportData source: ATA, US member airlines, scheduled mainline service
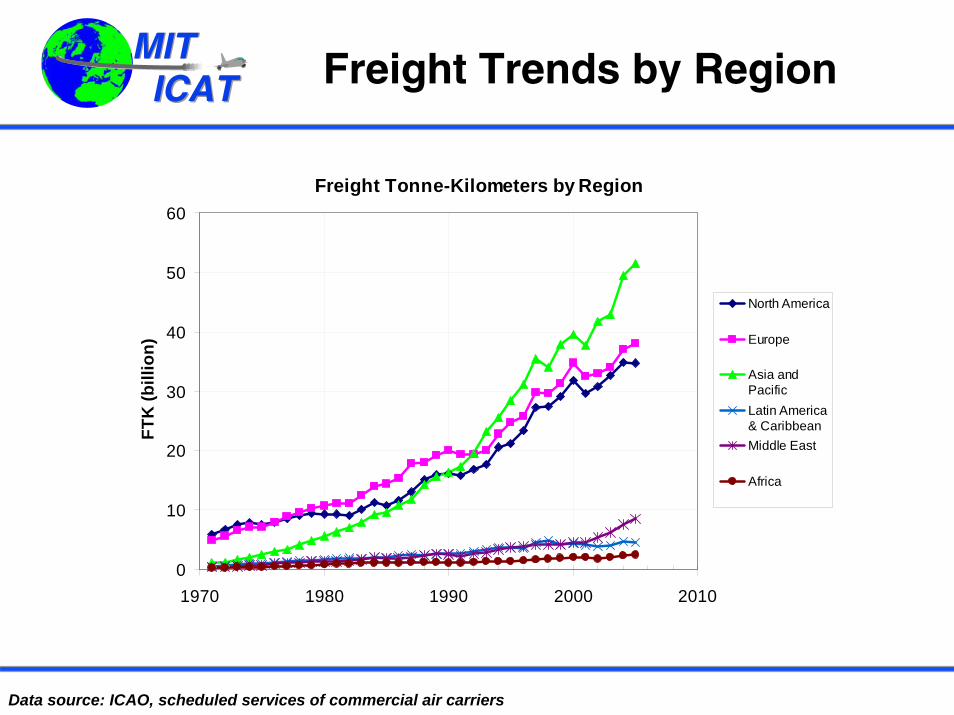
MIT ICATMIT ICAT
U.S. Domestic Average Load Factor
45.0%
50.0%
55.0%
60.0%
65.0%
70.0%
75.0%
80.0%
85.0%19
70
1972
1974
1976
1978
1980
1982
1984
1986
1988
1990
1992
1994
1996
1998
2000
2002
2004
2006
Data source: ATA, US member airlines, scheduled mainline service (average of first 9 months for 2006)

MIT ICATMIT ICAT U.S. Domestic ASMs and RPMs
-
100
200
300
400
500
600
700
1970
1972
1974
1976
1978
1980
1982
1984
1986
1988
1990
1992
1994
1996
1998
2000
2002
2004
2006
Bill
ions ASMs
RPMs
Data source: ATA, US member airlines, scheduled mainline service (projection based on first 9 months for 2006)
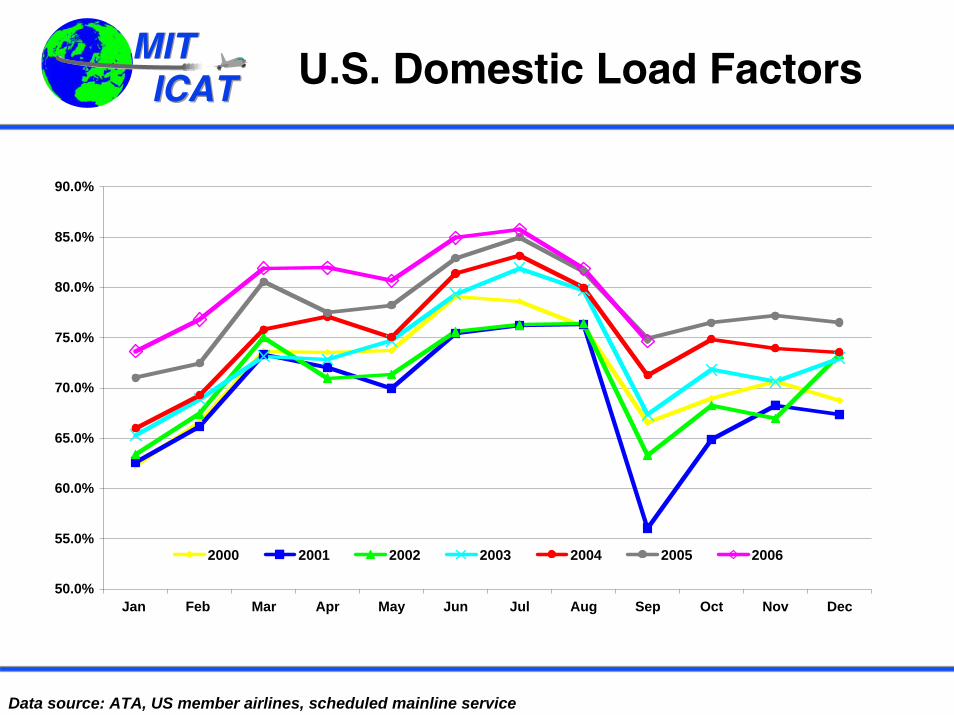
MIT ICATMIT ICAT U.S. Domestic Load Factors
50.0%
55.0%
60.0%
65.0%
70.0%
75.0%
80.0%
85.0%
90.0%
Jan Feb Mar Apr May Jun Jul Aug Sep Oct Nov Dec
2000 2001 2002 2003 2004 2005 2006
Source: ATA Monthly Passenger Traffic ReportData source: ATA, US member airlines, scheduled mainline service

MIT ICATMIT ICAT U.S. Average Domestic Yield
10.00
11.00
12.00
13.00
14.00
15.00
16.00
Yiel
d (c
ents
/mile
)
2000 2001 2002 2003 2004 2005 2006
Data source: ATA Monthly Passenger Revenue Report, 7 US major airlines excluding Southwest (WN).

MIT ICATMIT ICAT
0.65%
0.70%
0.75%
0.80%
0.85%
0.90%
0.95%
1.00%
1.05%
80 81 82 83 84 85 86 87 88 89 90 91 92 93 94 95 96 97 98 99 00 01 02 03 04 05 06 07
Spending on Air Travel Has Fallen as % of U.S. Economy
Recent Quarters’ Modest Recovery Still $28B Short of Historical Norm
Historical Band
*Four-quarter rolling passenger revenue derived from government filings of U.S. passenger airlines
Syst
emw
ide
Pass
enge
r Rev
enue
as
% o
f Nom
inal
GD
P*
≅ $28B
Sources: ATA, ATA Passenger Airline Cost Index; Bureau of Economic Analysis; U.S. Department of Transportation

MIT ICATMIT ICAT
Historic Yield Trend1995-2006
6
7
8
9
10
11
12
13
14
15
16
Jan-
99
Jul-9
9
Jan-
00
Jul-0
0
Jan-
01
Jul-0
1
Jan-
02
Jul-0
2
Jan-
03
Jul-0
3
Jan-
04
Jul-0
4
2-Ja
n
2-Ju
l
3-Ja
n
3-Ju
l
4-Ja
n
4-Ju
l
5-Ja
n
5-Ju
l
6-Ja
n
6-Ju
l
Janu
ary
July
Yiel
d (c
/mile
)
2000 2001 2002 2003 2004 2005 20061995 1996 1997 1998 1999
Latin
Domestic
Pacific
Atlantic
Data source: ATA Passenger Yield Report, 7 US major airlines excluding Southwest (WN).

MIT ICATMIT ICAT
$(2,500)
$(2,100)
$(1,700)
$(1,300)
$(900)
$(500)
$(100)
$300
2000Q1 2000Q3 2001Q1 2001Q3 2002Q1 2002Q3 2003Q1 2003Q3 2004Q1 2004Q3 2005Q1
Net
Inco
me
(Los
s)
in
mill
ions
AmericanUnitedDeltaNorthwestContinentalSouthwestJetBlueAmerica WestAlaskaATAUS Airways
Airline Profits
9/11 Attacks
-17B
+23B
Data source: Airline quarterly reports, profits and losses including reorganization items including reorganization items
including reorganization items

MIT ICATMIT ICAT
Cargo Operations Remain Profitable
$0
$400
$800
$1,200
$1,600
2000Q1 2000Q3 2001Q1 2001Q3 2002Q1 2002Q3 2003Q1 2003Q3 2004Q1 2004Q3
Net
Inco
me
in m
illio
ns
UPS FedEx
9/11 Attacks
SARSIraq War
West CoastDock Strike
Data source: Companies’ annual reports

MIT ICATMIT ICAT
Market Cap: US Majors, 20-October-2006
Mesa Air0.8%
Frontier Airlines0.8%
Delta Air Lines0.7%
Pinnacle0.5% Midwest Airlines
0.4%
Mesa Air Group, Inc.0.8%
Republic Airways1.8%
Skywest4.5%
AirTran Airways2.6%
Alaska Airlines4.9%
Continental Airlines8.0%
US Airways9.6%
United Air Lines9.6%
American Airlines15.3%
JetBlue Airways5.1%
Southwest Airlines34.4%
Northwest Airlines0.2%
Total Market Cap: $36.6 billionTotal Market Cap: $36.6 billion
Data source: Yahoo Finance.

MIT ICATMIT ICAT
Market Cap: US Majors, 26-May-2005
Pinnacle1.0%
Mesa Air0.9%
United Air Lines0.6%
American West Airlines0.9%
US Airways0.2%
Midwest Airlines0.2%
Midway0.0%
Republic Airways2.0%
Delta Air Lines2.6%
Frontier Airlines2.1%
Northwest Airlines2.2%
Alaska Airlines3.7%
Continental Airlines4.2%
AirTran Airways4.1%
American Airlines9.9%
JetBlue Airways10.9%
Southwest Airlines54.3%
Atlantic Coast Airlines0.2%
Total Market Cap: $21.2 billionTotal Market Cap: $21.2 billion
Data source: Yahoo Finance.

MIT ICATMIT ICAT
Current Market Cap vs. RPM ShareUS Majors (RPMs: July 2006 / Market Cap:
October 20th 2006)
Source: Yahoo! Finance and Bureau of Transportation Statistics

MIT ICATMIT ICAT
US Airline Net Profit Model Best Fit of Undamped Oscillation
Cycle Period = 11.3 yr eFolding Time = 7.9 yr
-20
-15
-10
-5
0
5
10
15
20
25
30
78 80 82 84 86 88 90 92 94 96 98 00 02 04 06 08 10 12
Bill
ions
Net P
rofit
($)
* American Airlines, Delta Airlines, United Airlines, Northwest, Continental, Southwest, JetBlue, America West, Alaska.** The projection for the full year is computed as 2 times the loss for Q1 & Q2 combined
Estimates from 9 airlines* for Q1 & Q2 2006 and projection** for full year
Data from ATA (www.airlines.org)
Data from airline financial quarterly reports
Projection

MIT ICATMIT ICAT
US Airline Net Profit Model Apparent 1 year phase advance in cycle
-20
-15
-10
-5
0
5
10
15
20
25
30
78 80 82 84 86 88 90 92 94 96 98 00 02 04 06 08 10 12
Bill
ions
Net
Pro
fit ($
)
* American Airlines, Delta Airlines, United Airlines, Northwest, Continental, Southwest, JetBlue, America West, Alaska.** The projection for the full year is computed as 2 times the profits for Q1 & Q2 combined
Estimates from 9 airlines* for Q1 & Q2 2006 and projection** for full year
Data from ATA (www.airlines.org)
Data from airline financial quarterly reports
Projection
MIT ICATMIT ICAT
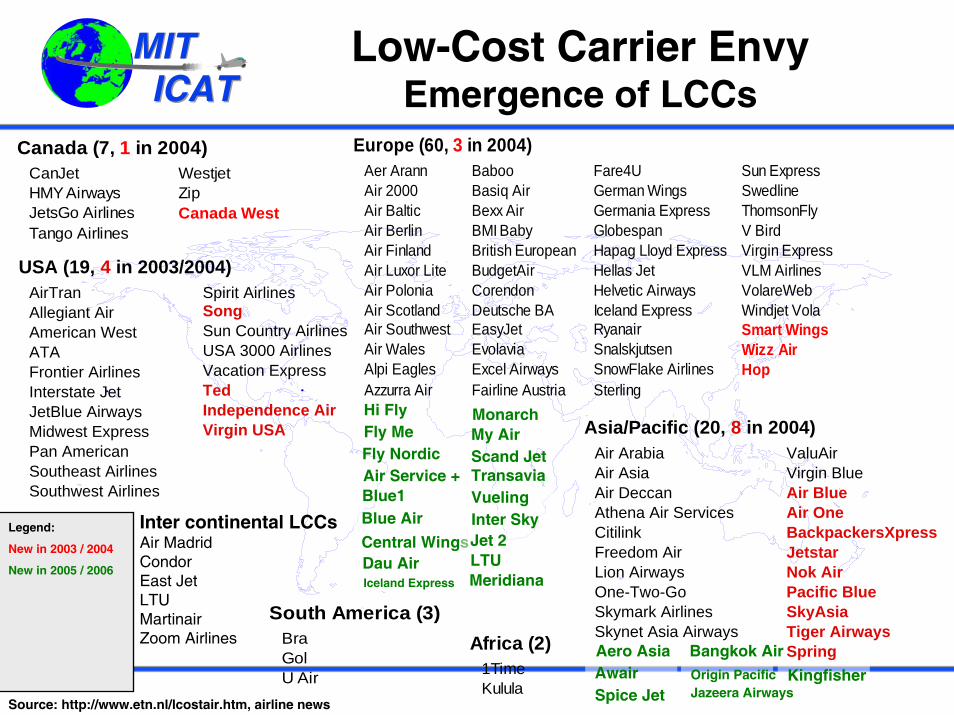
Low-Cost Carrier Envy Emergence of LCCs
Source: http://www.etn.nl/lcostair.htm, airline news
Africa (2)1TimeKulula
Europe (60, 3 in 2004)Aer Arann Baboo Fare4U Sun Express Air 2000 Basiq Air German Wings SwedlineAir Baltic Bexx Air Germania Express ThomsonFlyAir Berlin BMI Baby Globespan V BirdAir Finland British European Hapag Lloyd Express Virgin Express Air Luxor Lite BudgetAir Hellas Jet VLM AirlinesAir Polonia Corendon Helvetic Airways VolareWeb Air Scotland Deutsche BA Iceland Express Windjet VolaAir Southwest EasyJet Ryanair Smart WingsAir Wales Evolavia Snalskjutsen Wizz AirAlpi Eagles Excel Airways SnowFlake Airlines HopAzzurra Air Fairline Austria Sterling
Asia/Pacific (20, 8 in 2004)Air Arabia ValuAirAir Asia Virgin Blue Air Deccan Air BlueAthena Air Services Air OneCitilink BackpackersXpressFreedom Air JetstarLion Airways Nok AirOne-Two-Go Pacific BlueSkymark Airlines SkyAsiaSkynet Asia Airways Tiger Airways
Spring
South America (3)BraGolU Air
Canada (7, 1 in 2004)CanJet WestjetHMY Airways ZipJetsGo Airlines Canada WestTango Airlines
USA (19, 4 in 2003/2004)AirTran Spirit AirlinesAllegiant Air Song American West Sun Country AirlinesATA USA 3000 AirlinesFrontier Airlines Vacation ExpressInterstate Jet TedJetBlue Airways Independence AirMidwest Express Virgin USAPan AmericanSoutheast AirlinesSouthwest Airlines
Hi FlyFly MeFly NordicAir Service +Blue1Blue Air
Central WingsDau AirIceland Express
Inter SkyJet 2LTUMeridiana
MonarchMy AirScand JetTransaviaVueling
Aero AsiaAwair
Bangkok AirOrigin Pacific
Spice Jet
Inter continental LCCsAir MadridCondorEast JetLTUMartinairZoom Airlines
Jazeera AirwaysKingfisher
Legend:
New in 2003 / 2004
New in 2005 / 2006

MIT ICATMIT ICAT
Low-Cost Carrier Envy (or not)Emergence of LCCs
Source: http://www.etn.nl/lcostair.htm, airline news
Africa (2)1TimeKulula
Europe (60, 3 in 2004)Aer Arann Baboo Fare4U Sun Express Air 2000 Basiq Air German Wings SwedlineAir Baltic Bexx Air Germania Express ThomsonFlyAir Berlin BMI Baby Globespan V BirdAir Finland British European Hapag Lloyd Express Virgin Express Air Luxor Lite BudgetAir Hellas Jet VLM AirlinesAir Polonia Corendon Helvetic Airways VolareWeb Air Scotland Deutsche BA Iceland Express Windjet VolaAir Southwest EasyJet Ryanair Smart WingsAir Wales Evolavia Snalskjutsen Wizz AirAlpi Eagles Excel Airways SnowFlake Airlines HopAzzurra Air Fairline Austria Sterling
Asia/Pacific (20, 8 in 2004)Air Arabia ValuAirAir Asia Virgin Blue Air Deccan Air BlueAthena Air Services Air OneCitilink BackpackersXpressFreedom Air JetstarLion Airways Nok AirOne-Two-Go Pacific BlueSkymark Airlines SkyAsiaSkynet Asia Airways Tiger Airways
Spring
South America (3)BraGolU Air
Canada (7, 1 in 2004)CanJet WestjetHMY Airways ZipJetsGo Airlines Canada WestTango Airlines
USA (19, 4 in 2003/2004)AirTran Spirit AirlinesAllegiant Air Song American West Sun Country AirlinesATA USA 3000 AirlinesFrontier Airlines Vacation ExpressInterstate Jet TedJetBlue Airways Independence AirMidwest Express Virgin USAPan AmericanSoutheast AirlinesSouthwest Airlines
Hi FlyFly MeFly NordicAir Service +Blue1Blue Air
Central WingsDau AirIceland Express
Inter SkyJet 2LTUMeridiana
MonarchMy AirScand JetTransaviaVueling
Aero AsiaAwair
Bangkok AirOrigin Pacific
Spice Jet
Inter continental LCCsAir MadridCondorEast JetLTUMartinairZoom Airlines
Jazeera AirwaysKingfisher
Legend:
New in 2003 / 2004
New in 2005 / 2006
Not Operating

MIT ICATMIT ICAT
ConsolidationAmerica West - USAirways Merger

MIT ICATMIT ICAT Trends in Fuel Price
Average Crude Oil and Jet Fuel Prices
$0
$10
$20
$30
$40
$50
$60
$70
$80
Jan-
86
Jan-
00
Jan-
88
Jan-
89
Jan-
90
Jan-
91
Jan-
92
Jan-
93
Jan-
94
Jan-
95
Jan-
96
Jan-
97
Jan-
98
Jan-
99
Jan-
00
Jan-
01
Jan-
02
Jan-
03
Jan-
04
Jan-
05
Jan-
06
Cru
de O
il: S
pot P
rice
per B
arre
l
40¢
60¢
80¢
100¢
120¢
140¢
160¢
180¢
200¢
220¢
240¢
Jet Fuel: Price Paid per Gallon
Jet Fuel (R)
Crude Oil (L)
Data source: ATA; U.S. major, national, large regional passenger and cargo airlines; all services (last data point: 10/13/06)

MIT ICATMIT ICAT
Airline Profits Adjusted for Constant Fuel Price
-30
-20
-10
0
10
20
30
40
78 80 82 84 86 88 90 92 94 96 98 00 02 04 06 08 10 12
Billi
ons
Net
Pro
fit ($
)
US Profit (Fuel Adjusted)
US Profit Fit (Non Adjusted for fuel) Assumptions: Fuel price: 69 c/gallonAdjustment made on the basis of:-difference between actual and assumed fuel price-annual fuel consumption
Projection for full year based on Q1 & Q2 2006

MIT ICATMIT ICAT
Fuel Efficiency Through Increased Load Factor
Fuel Efficiency
20
25
30
35
40
45
50
1980
1982
1984
1986
1988
1990
1992
1994
1996
1998
2000
2002
2004
Mile
s pe
r Gal
lon
Revenue Passenger Miles Available Seat Miles
Source: ATA data

MIT ICATMIT ICAT Unit Costs for Labor and Fuel
2.95
2.88
0.00
0.50
1.00
1.50
2.00
2.50
3.00
3.50
4.00
4.50
1Q19
90
1Q19
91
1Q19
92
1Q19
93
1Q19
94
1Q19
95
1Q19
96
1Q19
97
1Q19
98
1Q19
99
1Q20
00
1Q20
01
1Q20
02
1Q20
03
1Q20
04
1Q20
05
Uni
t Ope
ratin
g C
ost (
c pe
r ava
ilabl
e se
at m
ile)
LaborFuel
1990 1991 1992 1993 1994 1995 1996 1997 1998 1999 2000 2001 2002 2003 2004 20051990 1991 1992 1993 1994 1995 1996 1997 1998 1999 2000 2001 2002 2003 2004 20051990 1991 1992 1993 1994 1995 1996 1997 1998 1999 2000 2001 2002 2003 2004 2005
Data source: ATA U.S. Airline Cost Index, 3rd Quarter 2005.

MIT ICATMIT ICAT
Productivity Improvements Driving Cost ReliefNetwork Restructuring, Work Rules, Human Capital,
Outsourcing, Technology
1,500
1,700
1,900
2,100
2,300
2,500
2,700
1Q19
90
1Q19
91
1Q19
92
1Q19
93
1Q19
94
1Q19
95
1Q19
96
1Q19
97
1Q19
98
1Q19
99
1Q20
00
1Q20
01
1Q20
02
1Q20
03
1Q20
04
1Q20
05
ASM
s (0
00) p
er F
TE
Source: ATA US Airline Cost Index: Major & National Passenger Carriers, Q3 2005

MIT ICATMIT ICAT
Employees Full Time: US Network Carriers 2001-2005
US Network Carrier Employees
0
20,000
40,000
60,000
80,000
100,000
120,000
2001 2002 2003 2004 2005
Empl
oyee
s (F
ull T
ime) American
United
Delta
Northw est
Continental
US Airw ays
Alaska
Source: US DOT

MIT ICATMIT ICAT
Employees Full Time: Low Cost Carriers 2001-2005
Low-Cost Carrier Employees
0
5,000
10,000
15,000
20,000
25,000
30,000
35,000
2001 2002 2003 2004 2005
Empl
oyee
s (F
ull T
ime)
Southw est
America West
JetBlue
AirTran
ATA
Frontier
IndependenceAirSpirit
Source: US DOT

MIT ICATMIT ICAT Retirement Plan Terminations
Summary of US and United Plan Terminations
($ in billions)
US Airways
United Airlines
Total Termination Liability $7.9 $16.8
Assets $2.9 $7.0
Unfunded Termination Liability $5.0 $9.8
PBGC Guaranteed Portion of Underfunding $2.9 $6.6
Value of Lost Benefits $2.1 $3.2
Lost Benefits as % of Total Term. Liability 26.58% 19.05%
Delta and NWA Chap 11 filings estimated at $16B Liability
Source: Subcommittee on Aviation Hearing on Airline Pensions: Avoiding Further Collapse, also NYT http://www.house.gov/transportation/aviation/06-22-05/06-22-05memo.html
MIT ICATMIT ICAT

MIT ICATMIT ICAT
MIT ICATMIT ICAT
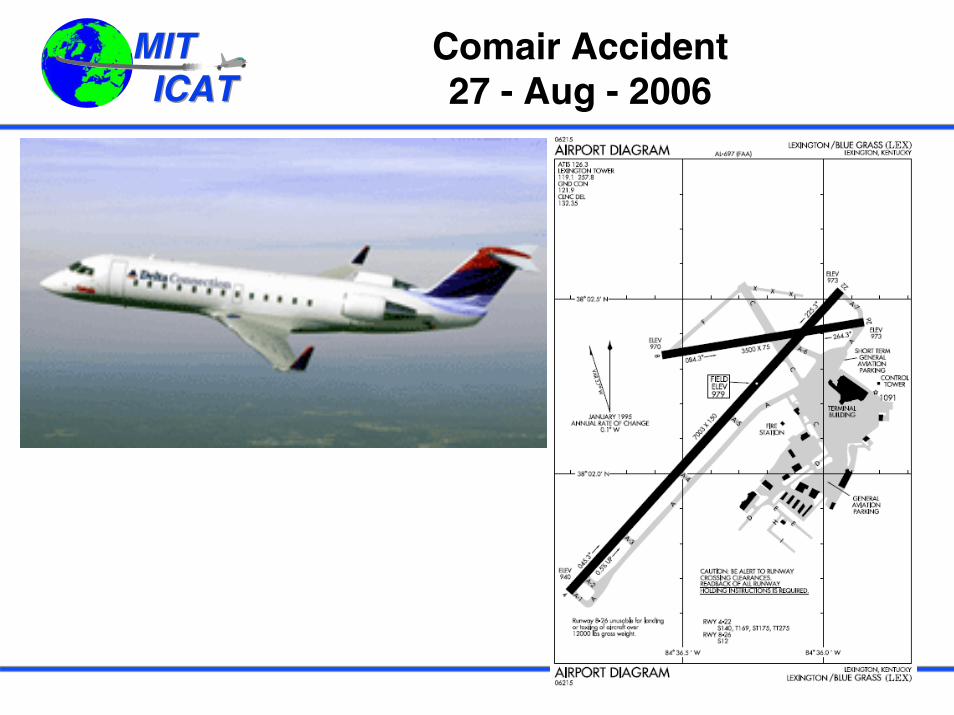
Comair Accident27 - Aug - 2006

MIT ICATMIT ICAT
US Flight Delays US Flight Delays from 1995 to 2006from 1995 to 2006
National delays from 1995 to 2006
0
0.5
1
1.5
2
2.5
3
3.5
Jan-95 Jan-96 Jan-97 Jan-98 Jan-99 Jan-00 Jan-01 Jan-02 Jan-03 Jan-04 Jan-05 Jan-06
Milli
ons
Del
ays
(in m
in.)
National Delays12 per. Mov. Avg. (National Delays)
Data source: FAA Operational Network (OPSNET)

MIT ICATMIT ICAT
US Flight DelaysUS Flight Delaysfrom 2000 to 2006from 2000 to 2006
National Delays (in minutes)
0
0.5
1
1.5
2
2.5
3
3.5
Jan
Feb Mar Apr
May Jun Ju
l
Aug Sep Oct
Nov Dec
Milli
onD
elay
s (in
min
.)
20062005
2004200320022001
2000
Source: FAA OPSNET data

MIT ICATMIT ICAT
New Delay CauseTSA Power Failure’s
LGA 7/16/06
Hawaii 10/15/06

MIT ICATMIT ICAT
Aviation Remains Perceived TargetExpanding Security Burden
QuickTime™ and aTIFF (Uncompressed) decompressor
are needed to see this picture.
NO LIQUIDS OR GELS OF ANY KIND WILL BE PERMITTED IN CARRY-ON BAGGAGE. THESE ITEMS MUST BE IN CHECKED BAGGAGE. This includes all beverages, shampoo, suntan lotion, creams, tooth paste, hair gel, and other items of
similar consistency. Read our Permitted and Prohibited Items list
for more information.

MIT ICATMIT ICAT
Flight Cancellationsfrom 1990 to 2006from 1990 to 2006
0
50
100
150
200
250
1990 1991 1992 1993 1994 1995 1996 1997 1998 1999 2000 2001 2002 2003 2004 2005 2006
Thou
sand
sC
ance
llatio
ns
Projection based on first 6 months of 2006
Source: DOT, Air Travel Consumer Report, http://airconsumer.ost.dot.gov/
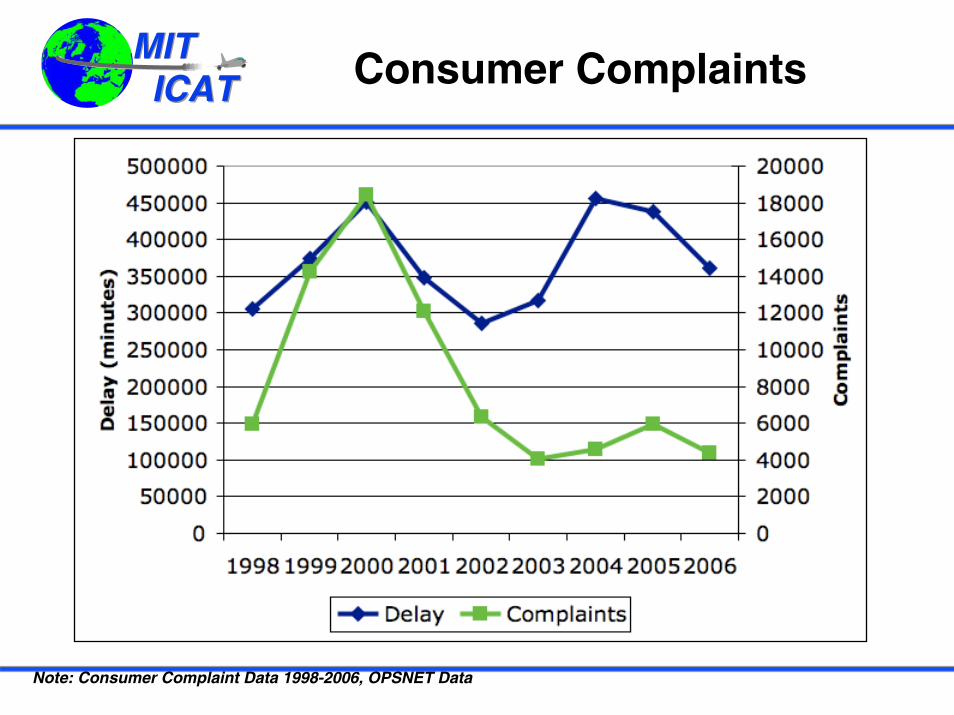
MIT ICATMIT ICAT Consumer Complaints
Note: Consumer Complaint Data 1998-2006, OPSNET Data

Air Traffic Controller Staffing
ATO Hiring Forecast vs. Losses
Time to CPC (Certified Professional Controller)Terminal; 8 - 24 monthsEnroute: 36 - 60 Source: Air Traffic Controller Workforce Plan - 2004

MIT ICATMIT ICAT
Projected % Developmental Controllers
From: ATCS Workforce Plan Briefing

MIT ICATMIT ICAT
Controller ContractCongressional 60 day response period ended June 5, 2006

MIT ICATMIT ICAT OEP and NGATS
10 Year PlanFAA
20 Year PlanMulti-AgencyFAA, DOD, CommerceDHS, NASA, DOT, OSTP

MIT ICATMIT ICAT FAA Reauthorization ‘07
FAA Reauthorization bill: deadline Sept. 30, 2007
Funding Modernization (NGATS)
Contributions from the general fund
The “battle” over user fees:Airlines vs Business Aviation

MIT ICATMIT ICAT
Trends in Aircraft Size
80
100
120
140
160
180
200
220
1990 1991 1992 1993 1994 1995 1996 1997 1998 1999 2000 2001 2002 2003 2004 2005
Ave
rage
sea
ts p
er d
epar
ture
Domestic
International
Total
Data source: Form 41 Traffic data from Bureau of Transportation Statistics (includes Regional Jets and Turboprops)
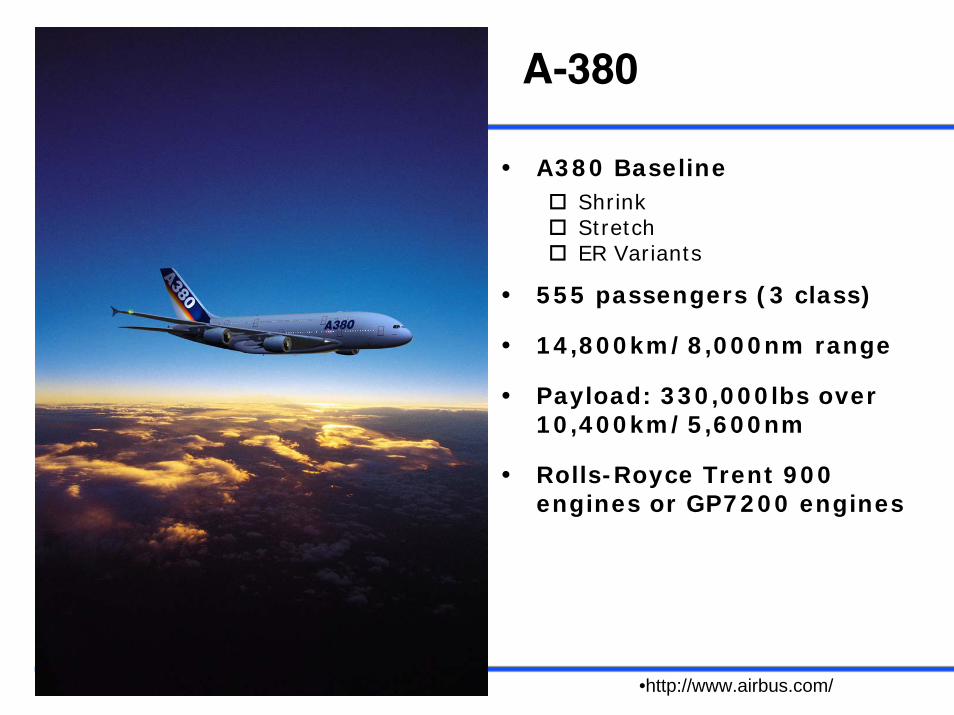
MIT ICATMIT ICAT A-380
•http://www.airbus.com/
A380 BaselineShrinkStretchER Variants
555 passengers (3 class)
14,800km/8,000nm range
Payload: 330,000lbs over 10,400km/5,600nm
Rolls-Royce Trent 900 engines or GP7200 engines
MIT ICATMIT ICAT
A380 First Flight(4/27/05)
QuickTime™ and aTIFF (Uncompressed) decompressor
are needed to see this picture.

MIT ICATMIT ICAT A-380 Delays
SELECTED A380 MILESTONE SCHEDULES1
ORIGINAL CURRENT
First flight 12/2005 4/27/2006
First delivery to Singapore Airlines (19 a/c) Early 2006 10/2007
First delivery to Emirates Airlines (43 a/c) 10/2006 8/2008
First freighter delivery (FedEx) 2008 2010
Bad News1:
On Oct 4th Airbus announced a third delay to A380 production prompting airlines to review their orders (no cancellations yet).CEO Christian Streiff resigned after 100 days of tenure on Oct 10th.Cash-flow crisis at EADS puts the development of A350XWB (replacement of A330/A340) on hold.Financial analysts are skeptical that Airbus cost-cutting program Power8 can deliver.Lack of funds to develop the A320 replacement in the coming decade. Differences between the proposed A350XWB and the original A350 for which Airbus has contracts.
Good News2:
Airbus Wake Vortex Steering Group found that 10 nm separation for following the A380 needs to be applied only to light aircraft, with 6 nm for heavy and 8 nm for medium-sized aircraft. (Approximately breakeven on airport seat throughput)
Data source: 1Aviation Week & Space Technology 10/09/2006, 2Air Transport World Daily News 09/292006

MIT ICATMIT ICAT
A 380 Ordersaprox 159 (17 Cargo)
Singapore Airlines (10)
Lufthansa (15)
Emirates (43)
Air France (10)
Qantas (12)
Malaysia Airlines (6)
Virgin Atlantic (6)
International Lease Finance (10)
Kingfisher Airlines (5)
Qatar Airways (2)
Federal Express (10)
Korean Air (5)
Thai Airways (6)
Etihad Airways (4)
China Southern Airlines (5)
Delivery Delays (normal)9 in 2007 vs 25 plan
Wake Vortex Issue ICAO 10 Mile in trail requirement
Source: http://www.aerospace-technology.com/projects/a380/

MIT ICATMIT ICAT
B-787
QuickTime™ and aTIFF (Uncompressed) decompressor
are needed to see this picture.
QuickTime™ and aTIFF (Uncompressed) decompressor
are needed to see this picture.
QuickTime™ and aTIFF (Uncompressed) decompressor
are needed to see this picture.
-300 (290-330 pax) (3000-3500 nm)
-800 (210-250 pax) (8000-8500 nm)
-900 (250-290 pax) (8600-8800 nm)
MIT ICATMIT ICAT
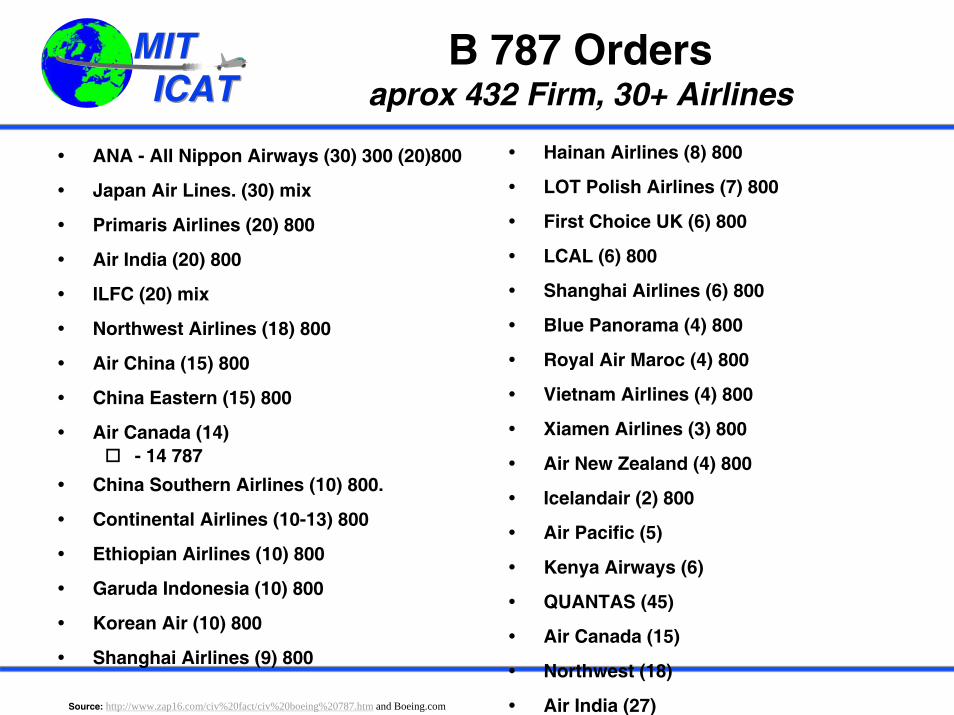
B 787 Ordersaprox 432 Firm, 30+ Airlines
ANA - All Nippon Airways (30) 300 (20)800
Japan Air Lines. (30) mix
Primaris Airlines (20) 800
Air India (20) 800
ILFC (20) mix
Northwest Airlines (18) 800
Air China (15) 800
China Eastern (15) 800
Air Canada (14)- 14 787
China Southern Airlines (10) 800.
Continental Airlines (10-13) 800
Ethiopian Airlines (10) 800
Garuda Indonesia (10) 800
Korean Air (10) 800
Shanghai Airlines (9) 800
Hainan Airlines (8) 800
LOT Polish Airlines (7) 800
First Choice UK (6) 800
LCAL (6) 800
Shanghai Airlines (6) 800
Blue Panorama (4) 800
Royal Air Maroc (4) 800
Vietnam Airlines (4) 800
Xiamen Airlines (3) 800
Air New Zealand (4) 800
Icelandair (2) 800
Air Pacific (5)
Kenya Airways (6)
QUANTAS (45)
Air Canada (15)
Northwest (18)
Air India (27)Source: http://www.zap16.com/civ%20fact/civ%20boeing%20787.htm and Boeing.com
MIT ICATMIT ICAT
“All New” A350Not your fathers A330
QuickTime™ and aTIFF (Uncompressed) decompressor
are needed to see this picture.
Source: http://www.airbus.com
250-300 Seats
7500-8800 nm Range

MIT ICATMIT ICAT
Turboprops
ATR 72 DHC-8 Q400
ATR sales 2005/2006:
- Record 90 orders for ATR 42/72 turboprops in 2005
- Sold 46 in the Q1 2006
MIT ICATMIT ICAT
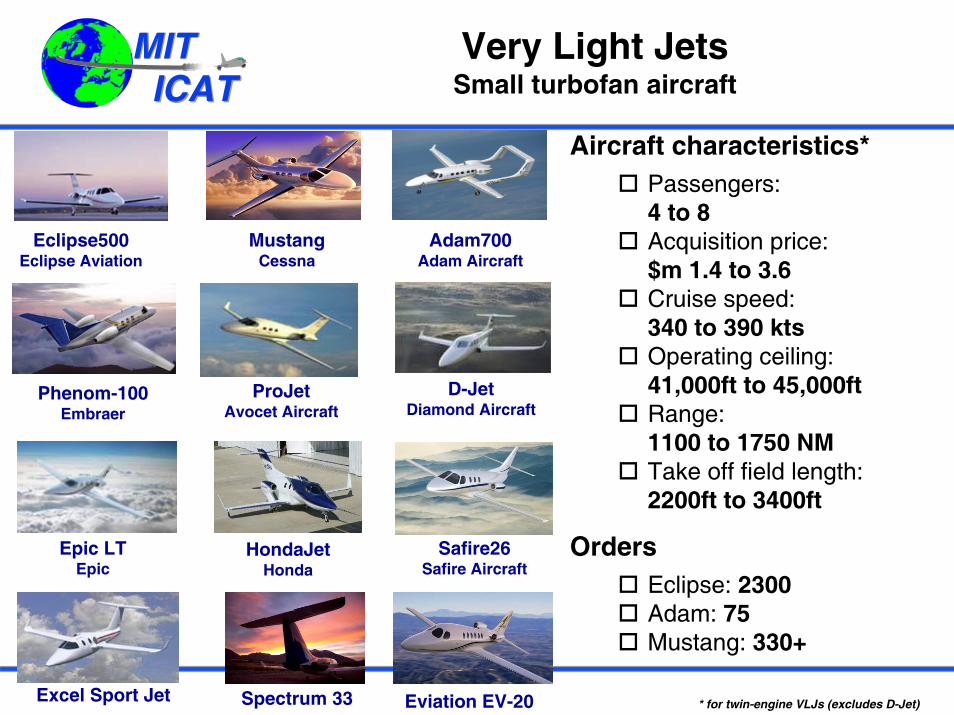
Very Light JetsSmall turbofan aircraft
Aircraft characteristics*Passengers: 4 to 8Acquisition price: $m 1.4 to 3.6Cruise speed: 340 to 390 ktsOperating ceiling: 41,000ft to 45,000ftRange: 1100 to 1750 NMTake off field length: 2200ft to 3400ft
OrdersEclipse: 2300Adam: 75Mustang: 330+
* for twin-engine VLJs (excludes D-Jet)
Eclipse500Eclipse Aviation
MustangCessna
Adam700Adam Aircraft
Safire26Safire Aircraft
D-JetDiamond Aircraft
Phenom-100Embraer
ProJetAvocet Aircraft
HondaJetHonda
Epic LTEpic
Spectrum 33Excel Sport Jet Eviation EV-20

MIT ICATMIT ICAT
Battle for New Nonstop Service between China and the U.S.
The U.S. Department of Transportation will award one new route between China and the U.S. by the end of 2006.
Four U.S. airlines are competing for the route: United, Northwest, American and Continental.
map of world and routes, list of airlines and restriction
Current services: from New York, Chicago and San Francisco.
The U.S. Department of Transportation will award one last route (until 2008) between China and the U.S. by the end of the year.
Four U.S. airlines are competing for the route:
United,Northwest, Continental,American
Contest between airlines to develop support for a particular route.
Northwest AirlinesRoute: Detroit toShanghaiSeats: 335Flight Time: 14 hr. 45 mins.
American AirlinesRoute: Dallas/Ft. Worth to BeijingSeats: 247Flight Time: 14 hr. 30 mins.
Continental AirlinesRoute: Newark, N.J.to ShanghaiSeats: 283Flight Time: 14 hr.
United AirlinesRoute: Washington, D.C. Worth to BeijingSeats: 347Flight Time: 15 hr. 15 mins.
Source: Detroit Free Press 10/18/2006
MIT ICATMIT ICAT
QuickTime™ and aMicrosoft Video 1 decompressorare needed to see this picture.