Embed Size (px)
Citation preview

M i s s o u r i L a b o r
A n a l y s i s
Missouri Economic Reserach and Information Center
DemandSupply
&

ii

Contents
Labor Supply and Demand by State and Workforce Region 3
Total Employment and Wages 7
Projected Demand 8
Supply Demographics 10
Educational Attainment 11
Job Field Definition 12
Workforce Areas 13
iii
1
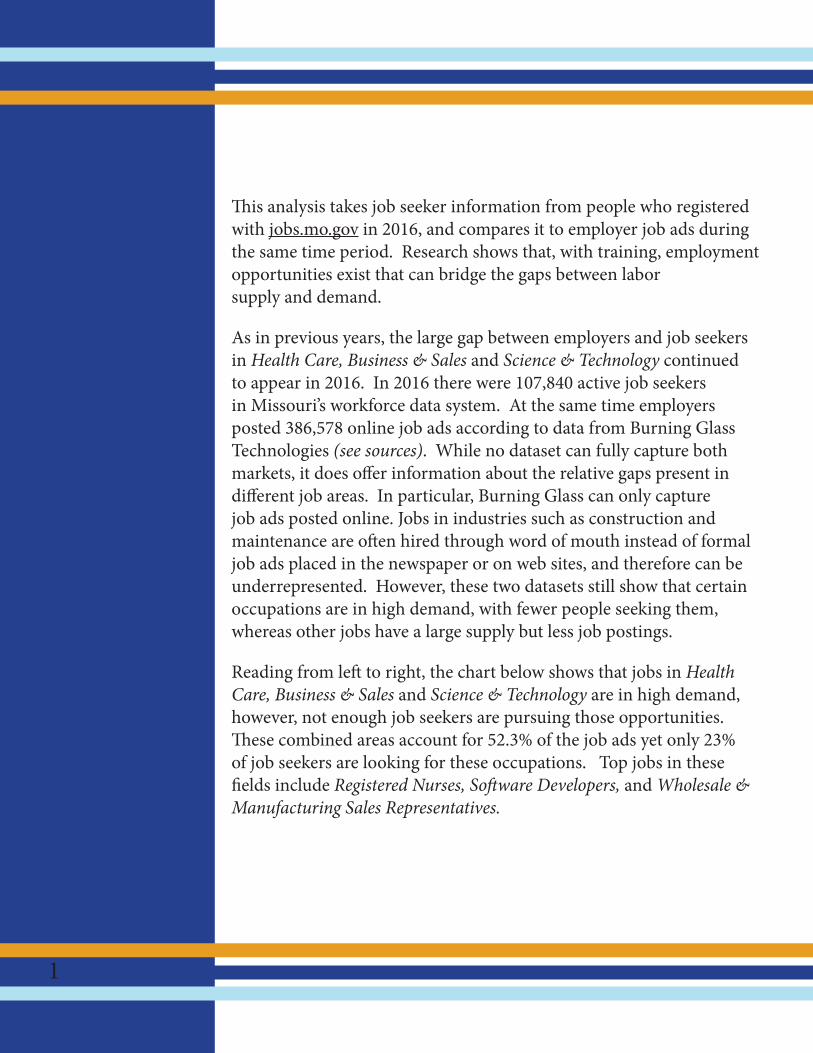
This analysis takes job seeker information from people who registered with jobs.mo.gov in 2016, and compares it to employer job ads during the same time period. Research shows that, with training, employment opportunities exist that can bridge the gaps between labor supply and demand.
As in previous years, the large gap between employers and job seekers in Health Care, Business & Sales and Science & Technology continued to appear in 2016. In 2016 there were 107,840 active job seekers in Missouri’s workforce data system. At the same time employers posted 386,578 online job ads according to data from Burning Glass Technologies (see sources). While no dataset can fully capture both markets, it does offer information about the relative gaps present in different job areas. In particular, Burning Glass can only capture job ads posted online. Jobs in industries such as construction and maintenance are often hired through word of mouth instead of formal job ads placed in the newspaper or on web sites, and therefore can be underrepresented. However, these two datasets still show that certain occupations are in high demand, with fewer people seeking them, whereas other jobs have a large supply but less job postings.
Reading from left to right, the chart below shows that jobs in Health Care, Business & Sales and Science & Technology are in high demand, however, not enough job seekers are pursuing those opportunities. These combined areas account for 52.3% of the job ads yet only 23% of job seekers are looking for these occupations. Top jobs in these fields include Registered Nurses, Software Developers, and Wholesale & Manufacturing Sales Representatives.
0%
5%
10%
15%
20%
25%
30%
DemandSupply
Production*CIMRManagement & Support
Food Service
Other Services
Transpor-tation
Science & Technology
Business & Sales
Health Care & Related
20.3
9.8 9.9
19.6
12.4
8.58.6
6.2 5.76.9
4.9
28.3
20.3
5.5
14.312.6
2.93.3
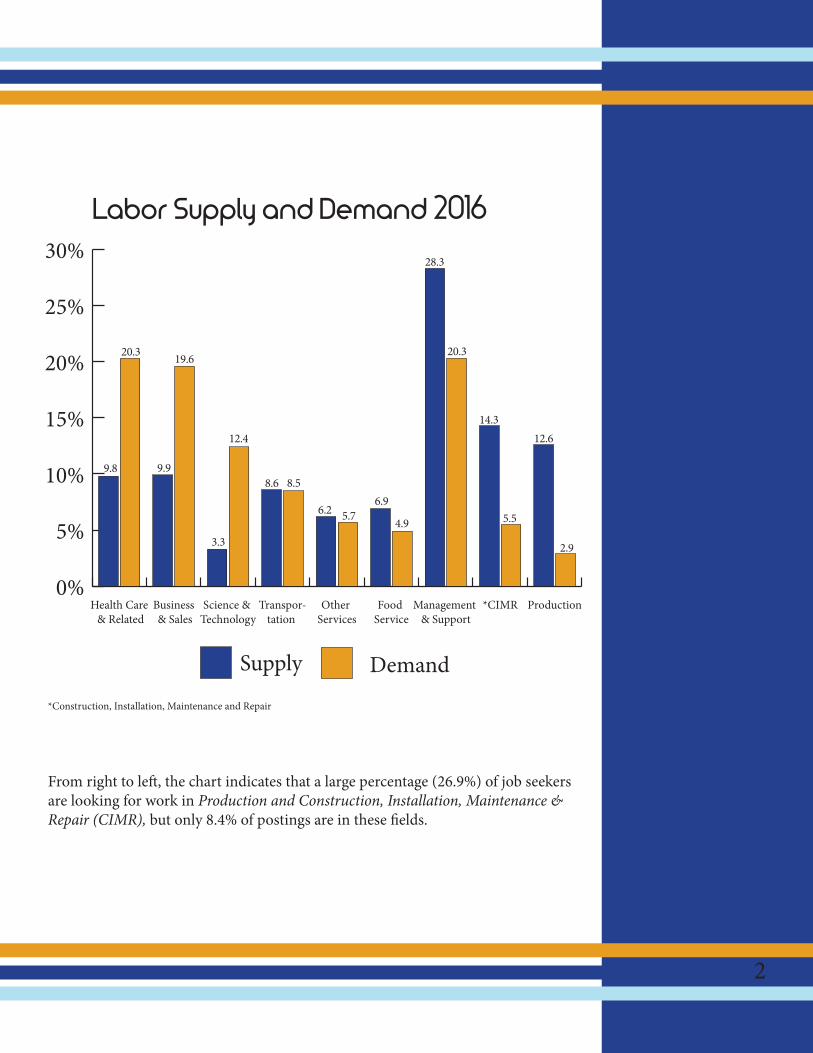
Labor Supply and Demand 2016
*Construction, Installation, Maintenance and Repair
2
From right to left, the chart indicates that a large percentage (26.9%) of job seekers are looking for work in Production and Construction, Installation, Maintenance & Repair (CIMR), but only 8.4% of postings are in these fields.
3
Labor Supply and Demand by State and Workforce Region
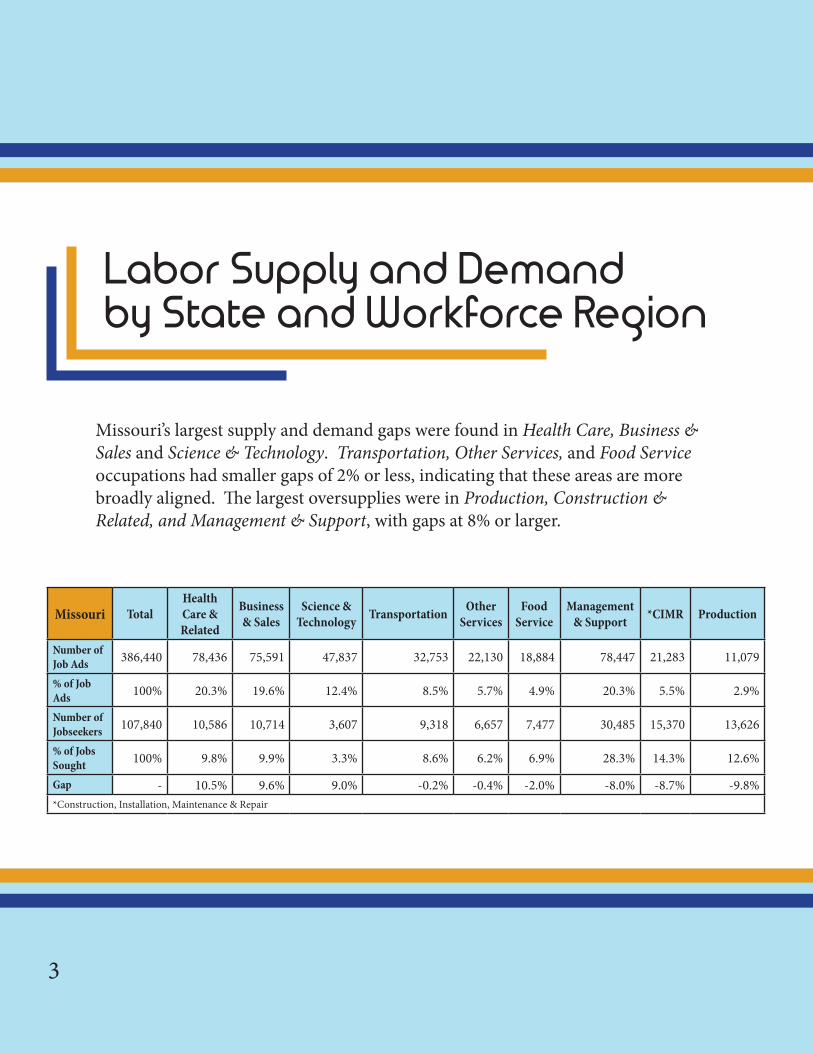
Missouri’s largest supply and demand gaps were found in Health Care, Business & Sales and Science & Technology. Transportation, Other Services, and Food Service occupations had smaller gaps of 2% or less, indicating that these areas are more broadly aligned. The largest oversupplies were in Production, Construction & Related, and Management & Support, with gaps at 8% or larger.
Missouri TotalHealth Care & Related
Business & Sales
Science & Technology Transportation Other
ServicesFood
ServiceManagement
& Support *CIMR Production
Number of Job Ads 386,440 78,436 75,591 47,837 32,753 22,130 18,884 78,447 21,283 11,079
% of Job Ads 100% 20.3% 19.6% 12.4% 8.5% 5.7% 4.9% 20.3% 5.5% 2.9%
Number of Jobseekers 107,840 10,586 10,714 3,607 9,318 6,657 7,477 30,485 15,370 13,626
% of Jobs Sought 100% 9.8% 9.9% 3.3% 8.6% 6.2% 6.9% 28.3% 14.3% 12.6%
Gap - 10.5% 9.6% 9.0% -0.2% -0.4% -2.0% -8.0% -8.7% -9.8%*Construction, Installation, Maintenance & Repair
4
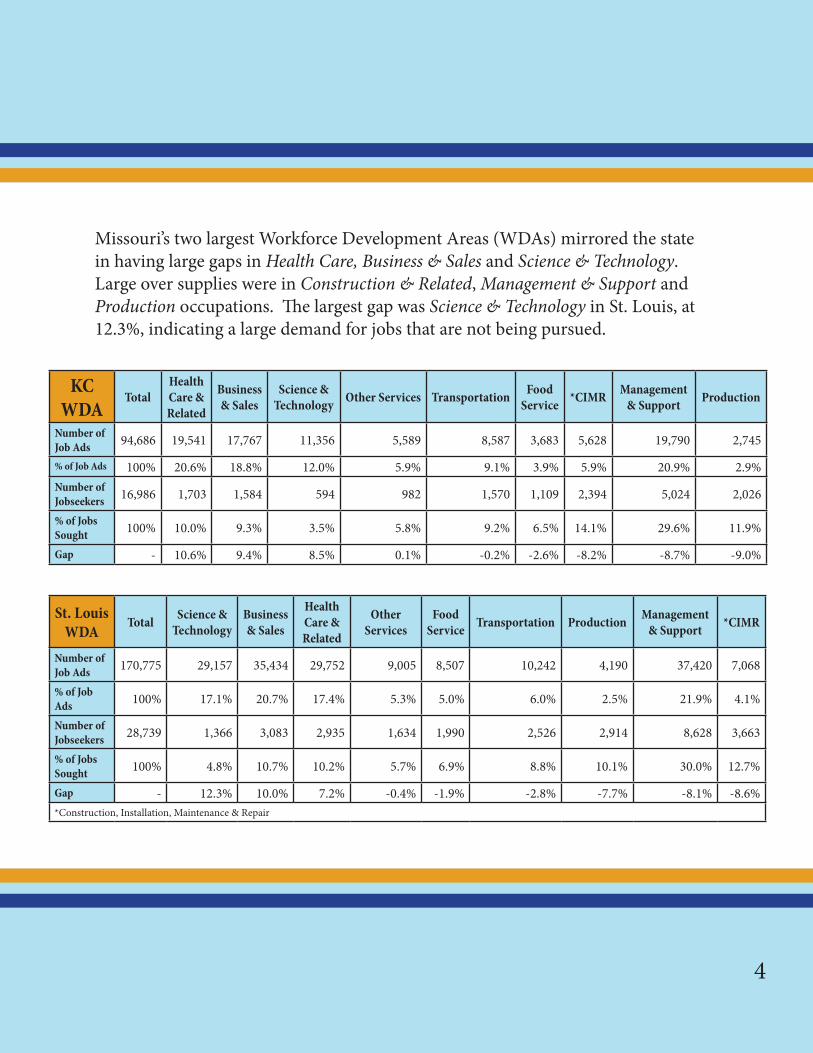
Missouri’s two largest Workforce Development Areas (WDAs) mirrored the state in having large gaps in Health Care, Business & Sales and Science & Technology. Large over supplies were in Construction & Related, Management & Support and Production occupations. The largest gap was Science & Technology in St. Louis, at 12.3%, indicating a large demand for jobs that are not being pursued.
KC WDA
TotalHealth Care & Related
Business & Sales
Science & Technology Other Services Transportation Food
Service *CIMR Management & Support Production
Number of Job Ads 94,686 19,541 17,767 11,356 5,589 8,587 3,683 5,628 19,790 2,745
% of Job Ads 100% 20.6% 18.8% 12.0% 5.9% 9.1% 3.9% 5.9% 20.9% 2.9%Number of Jobseekers 16,986 1,703 1,584 594 982 1,570 1,109 2,394 5,024 2,026
% of Jobs Sought 100% 10.0% 9.3% 3.5% 5.8% 9.2% 6.5% 14.1% 29.6% 11.9%
Gap - 10.6% 9.4% 8.5% 0.1% -0.2% -2.6% -8.2% -8.7% -9.0%
St. Louis WDA
Total Science & Technology
Business & Sales
Health Care & Related
Other Services
Food Service Transportation Production Management
& Support *CIMR
Number of Job Ads 170,775 29,157 35,434 29,752 9,005 8,507 10,242 4,190 37,420 7,068
% of Job Ads 100% 17.1% 20.7% 17.4% 5.3% 5.0% 6.0% 2.5% 21.9% 4.1%
Number of Jobseekers 28,739 1,366 3,083 2,935 1,634 1,990 2,526 2,914 8,628 3,663
% of Jobs Sought 100% 4.8% 10.7% 10.2% 5.7% 6.9% 8.8% 10.1% 30.0% 12.7%
Gap - 12.3% 10.0% 7.2% -0.4% -1.9% -2.8% -7.7% -8.1% -8.6%*Construction, Installation, Maintenance & Repair

5
Central WDA
Total Health Care & Related
Business & Sales
Science & Technology Transportation Other
ServicesFood
Service *CIMR Production Management & Support
Number of Job Ads 32,038 8,817 5,797 2,504 3,098 2,059 1,532 1913 854 5,464
% of Job Ads 100% 27.5% 18.1% 7.8% 9.7% 6.4% 4.8% 6.0% 2.7% 17.1%Number of Jobseekers 11,272 1,221 1,086 362 783 765 867 1,687 1,392 3,109
% of Jobs Sought 100% 10.8% 9.6% 3.2% 6.9% 6.8% 7.7% 15.0% 12.3% 27.6%
Gap - 16.7% 8.5% 4.6% 2.7% -0.4% -2.9% -9.0% -9.7% -10.5%
NE WDA
Total Health Care & Related
Business & Sales Transportation Science &
TechnologyOther
ServicesFood
Service *CIMR Management & Support Production
Number of Job Ads 9,090 2,647 1,389 1,158 415 572 380 546 1,644 339
% of Job Ads 100% 29.1% 15.3% 12.7% 4.6% 6.3% 4.2% 6.0% 18.1% 3.7%Number of Jobseekers 4,362 462 404 346 126 301 252 654 1,194 622
% of Jobs Sought 100% 10.60% 9.27% 7.93% 2.90% 6.90% 5.77% 15.00% 27.38% 14.26%
Gap - 18.5% 6.0% 4.8% 1.7% -0.6% -1.6% -9.0% -9.3% -10.5%*Construction, Installation, Maintenance & Repair
NW WDA Total Health Care
& RelatedBusiness & Sales Transportation Science &
TechnologyOther
ServicesFood
Service *CIMR Management & Support Production
Number of Job Ads 13,318 2,703 2,181 2,199 586 903 787 1,281 2,049 629
% of Job Ads 100% 20.3% 16.4% 16.5% 4.4% 6.8% 5.9% 9.6% 15.4% 4.7%Number of Jobseekers 5,033 450 430 459 148 339 297 748 1,310 852
% of Jobs Sought 100% 8.9% 8.6% 9.1% 2.9% 6.7% 5.9% 14.9% 26.0% 16.9%
Gap - 11.4% 7.8% 7.4% 1.5% 0.0% 0.0% -5.2% -10.6% -12.2%
Ozark WDA Total Business
& SalesHealth Care
& RelatedScience &
Technology Transportation Other Services
Food Service *CIMR Production Management
& SupportNumber of Job Ads 29,152 6,116 5,062 2,077 3,018 1,864 1,879 2,096 880 6,160
% of Job Ads 100% 21.0% 17.4% 7.1% 10.4% 6.4% 6.4% 7.2% 3.0% 21.1%Number of Jobseekers 13,668 1,531 1,175 391 1,097 913 1,064 1,964 1,416 4,117
% of Jobs Sought 100% 11.2% 8.6% 2.9% 8.0% 6.7% 7.8% 14.4% 10.4% 30.1%
Gap - 9.8% 8.8% 4.3% 2.3% -0.3% -1.3% -7.2% -7.3% -9.0%
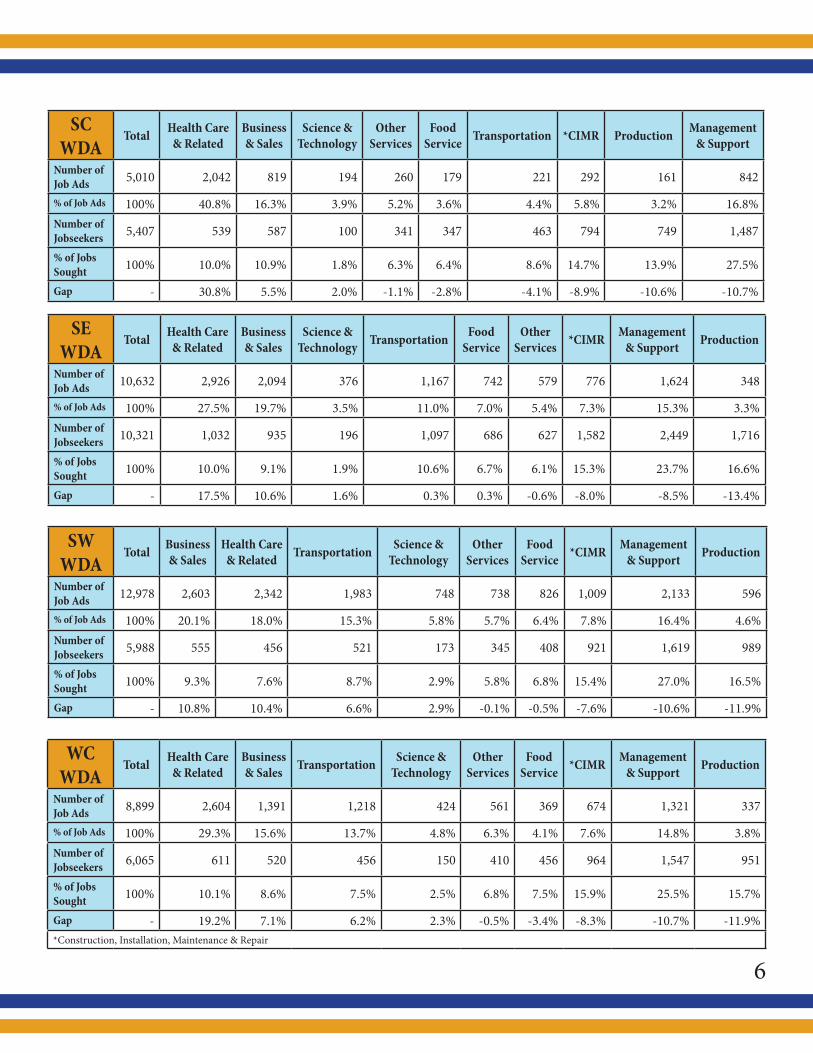
Additional areas of the state (see notes) had large gaps for Health Care positions ranging from 8.8% in the Ozark Workforce Development Area (WDA) up to 30.8% in the South Central WDA. All regions also showed a demand for Business & Sales jobs and all areas had over supplies in Construction & Related, Management & Support, and Production.
6
SC WDA
Total Health Care & Related
Business & Sales
Science & Technology
Other Services
Food Service Transportation *CIMR Production Management
& Support
Number of Job Ads 5,010 2,042 819 194 260 179 221 292 161 842
% of Job Ads 100% 40.8% 16.3% 3.9% 5.2% 3.6% 4.4% 5.8% 3.2% 16.8%Number of Jobseekers 5,407 539 587 100 341 347 463 794 749 1,487
% of Jobs Sought 100% 10.0% 10.9% 1.8% 6.3% 6.4% 8.6% 14.7% 13.9% 27.5%
Gap - 30.8% 5.5% 2.0% -1.1% -2.8% -4.1% -8.9% -10.6% -10.7%
SE WDA
Total Health Care & Related
Business & Sales
Science & Technology Transportation Food
ServiceOther
Services *CIMR Management & Support Production
Number of Job Ads 10,632 2,926 2,094 376 1,167 742 579 776 1,624 348
% of Job Ads 100% 27.5% 19.7% 3.5% 11.0% 7.0% 5.4% 7.3% 15.3% 3.3%Number of Jobseekers 10,321 1,032 935 196 1,097 686 627 1,582 2,449 1,716
% of Jobs Sought 100% 10.0% 9.1% 1.9% 10.6% 6.7% 6.1% 15.3% 23.7% 16.6%
Gap - 17.5% 10.6% 1.6% 0.3% 0.3% -0.6% -8.0% -8.5% -13.4%
SW WDA
Total Business & Sales
Health Care & Related Transportation Science &
TechnologyOther
ServicesFood
Service *CIMR Management & Support Production
Number of Job Ads 12,978 2,603 2,342 1,983 748 738 826 1,009 2,133 596
% of Job Ads 100% 20.1% 18.0% 15.3% 5.8% 5.7% 6.4% 7.8% 16.4% 4.6%Number of Jobseekers 5,988 555 456 521 173 345 408 921 1,619 989
% of Jobs Sought 100% 9.3% 7.6% 8.7% 2.9% 5.8% 6.8% 15.4% 27.0% 16.5%
Gap - 10.8% 10.4% 6.6% 2.9% -0.1% -0.5% -7.6% -10.6% -11.9%
WC WDA
Total Health Care & Related
Business & Sales Transportation Science &
TechnologyOther
ServicesFood
Service *CIMR Management & Support Production
Number of Job Ads 8,899 2,604 1,391 1,218 424 561 369 674 1,321 337
% of Job Ads 100% 29.3% 15.6% 13.7% 4.8% 6.3% 4.1% 7.6% 14.8% 3.8%Number of Jobseekers 6,065 611 520 456 150 410 456 964 1,547 951
% of Jobs Sought 100% 10.1% 8.6% 7.5% 2.5% 6.8% 7.5% 15.9% 25.5% 15.7%
Gap - 19.2% 7.1% 6.2% 2.3% -0.5% -3.4% -8.3% -10.7% -11.9%*Construction, Installation, Maintenance & Repair
7
Total Employment and Wages
Job Fields Total Employment Average Annual Wage
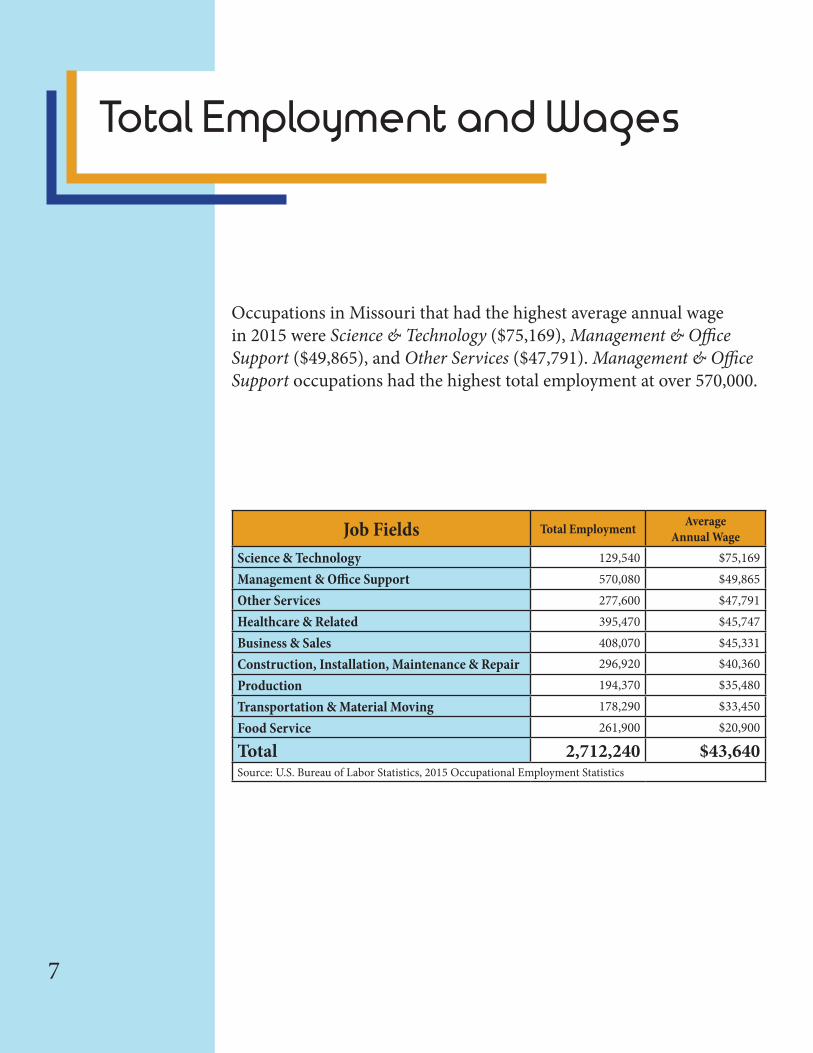
Science & Technology 129,540 $75,169
Management & Office Support 570,080 $49,865
Other Services 277,600 $47,791
Healthcare & Related 395,470 $45,747
Business & Sales 408,070 $45,331
Construction, Installation, Maintenance & Repair 296,920 $40,360
Production 194,370 $35,480
Transportation & Material Moving 178,290 $33,450
Food Service 261,900 $20,900
Total 2,712,240 $43,640Source: U.S. Bureau of Labor Statistics, 2015 Occupational Employment Statistics
Occupations in Missouri that had the highest average annual wage in 2015 were Science & Technology ($75,169), Management & Office Support ($49,865), and Other Services ($47,791). Management & Office Support occupations had the highest total employment at over 570,000.
8
Projected Demand
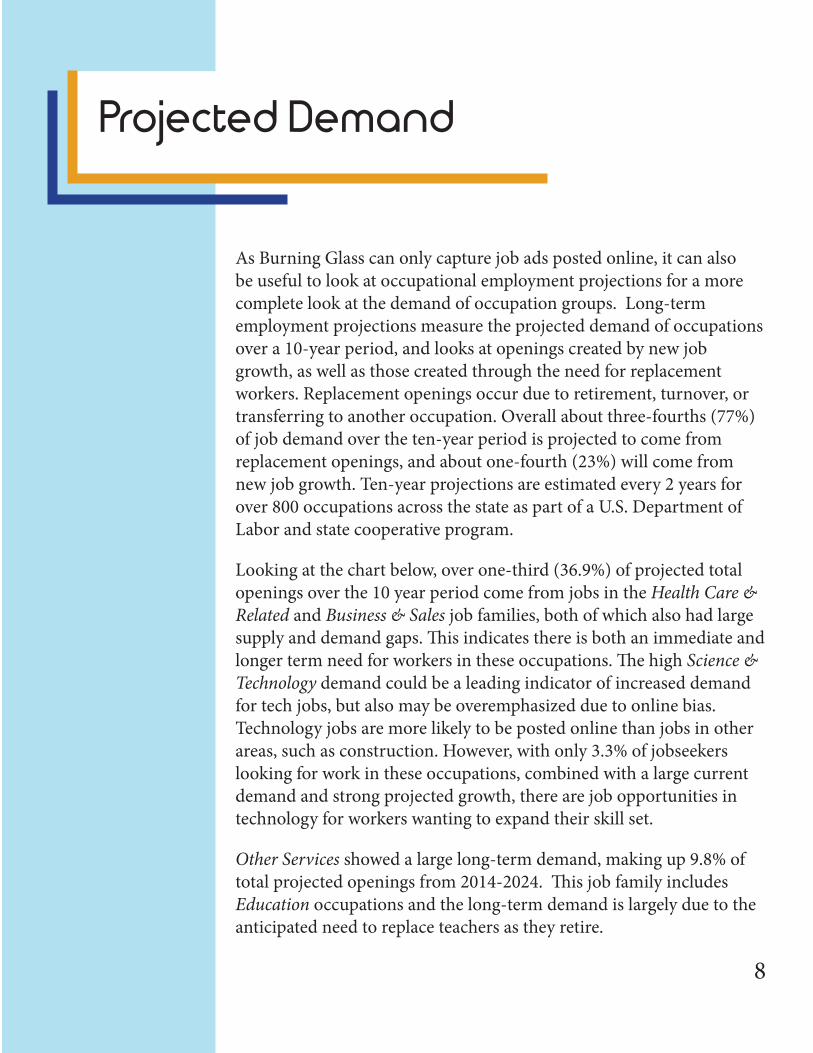
As Burning Glass can only capture job ads posted online, it can also be useful to look at occupational employment projections for a more complete look at the demand of occupation groups. Long-term employment projections measure the projected demand of occupations over a 10-year period, and looks at openings created by new job growth, as well as those created through the need for replacement workers. Replacement openings occur due to retirement, turnover, or transferring to another occupation. Overall about three-fourths (77%) of job demand over the ten-year period is projected to come from replacement openings, and about one-fourth (23%) will come from new job growth. Ten-year projections are estimated every 2 years for over 800 occupations across the state as part of a U.S. Department of Labor and state cooperative program.
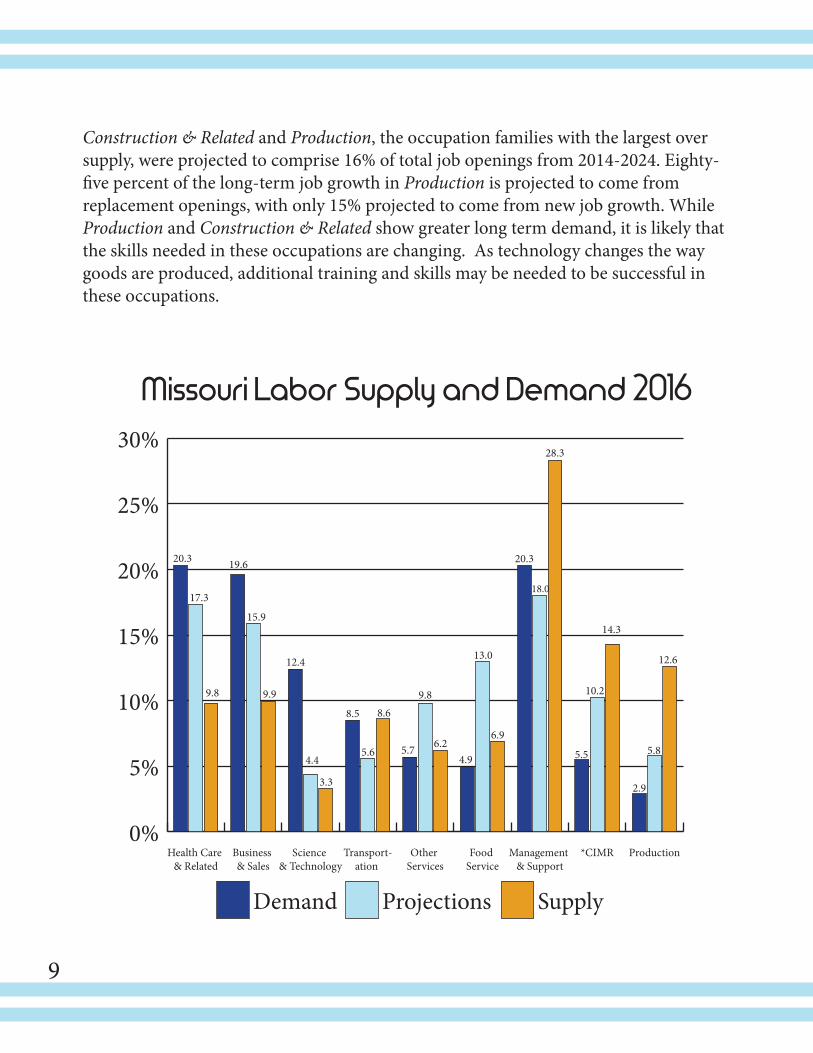
Looking at the chart below, over one-third (36.9%) of projected total openings over the 10 year period come from jobs in the Health Care & Related and Business & Sales job families, both of which also had large supply and demand gaps. This indicates there is both an immediate and longer term need for workers in these occupations. The high Science & Technology demand could be a leading indicator of increased demand for tech jobs, but also may be overemphasized due to online bias. Technology jobs are more likely to be posted online than jobs in other areas, such as construction. However, with only 3.3% of jobseekers looking for work in these occupations, combined with a large current demand and strong projected growth, there are job opportunities in technology for workers wanting to expand their skill set.
Other Services showed a large long-term demand, making up 9.8% of total projected openings from 2014-2024. This job family includes Education occupations and the long-term demand is largely due to the anticipated need to replace teachers as they retire.
9
Construction & Related and Production, the occupation families with the largest over supply, were projected to comprise 16% of total job openings from 2014-2024. Eighty-five percent of the long-term job growth in Production is projected to come from replacement openings, with only 15% projected to come from new job growth. While Production and Construction & Related show greater long term demand, it is likely that the skills needed in these occupations are changing. As technology changes the way goods are produced, additional training and skills may be needed to be successful in these occupations.
Missouri Labor Supply and Demand 2016
0%
5%
10%
15%
20%
25%
30%
SupplyProjectionsDemand
Production*CIMRManagement & Support
Food Service
Other Services
Transport-ation
Science & Technology
Business & Sales
Health Care & Related
20.3
17.3
9.8
19.6
15.9
9.9
12.4
4.4
3.3
8.5
5.6
8.6
5.7
9.8
6.24.9
13.0
6.9
20.3
18.0
28.3
5.5
10.2
14.3
2.9
5.8
12.6
10
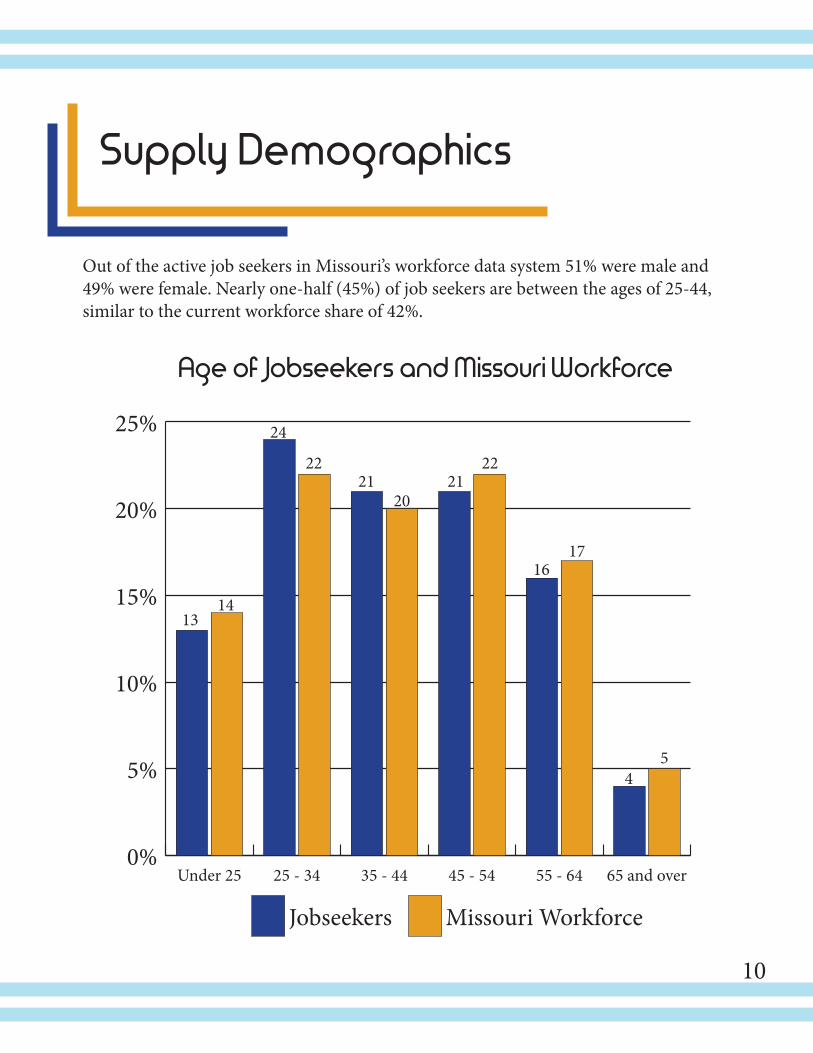
Out of the active job seekers in Missouri’s workforce data system 51% were male and 49% were female. Nearly one-half (45%) of job seekers are between the ages of 25-44, similar to the current workforce share of 42%.
Supply Demographics
Age of Jobseekers and Missouri Workforce
0%
5%
10%
15%
20%
25%
Missouri WorkforceJobseekers
65 and over55 - 6445 - 5435 - 4425 - 34Under 25
1314
24
2221
2021
22
1617
45
Educational Attainment of Jobseekersand Missouri Workforce
0%
10%
20%
30%
40%
50%
60%
JobseekersMissouri Workforce
Bachelor's Degree and Higher
Some College/Associate's Degree
High SchoolDiploma
Did Not Complete High School
12 13
33
53
32
23 23
11
11
Educational Attainment
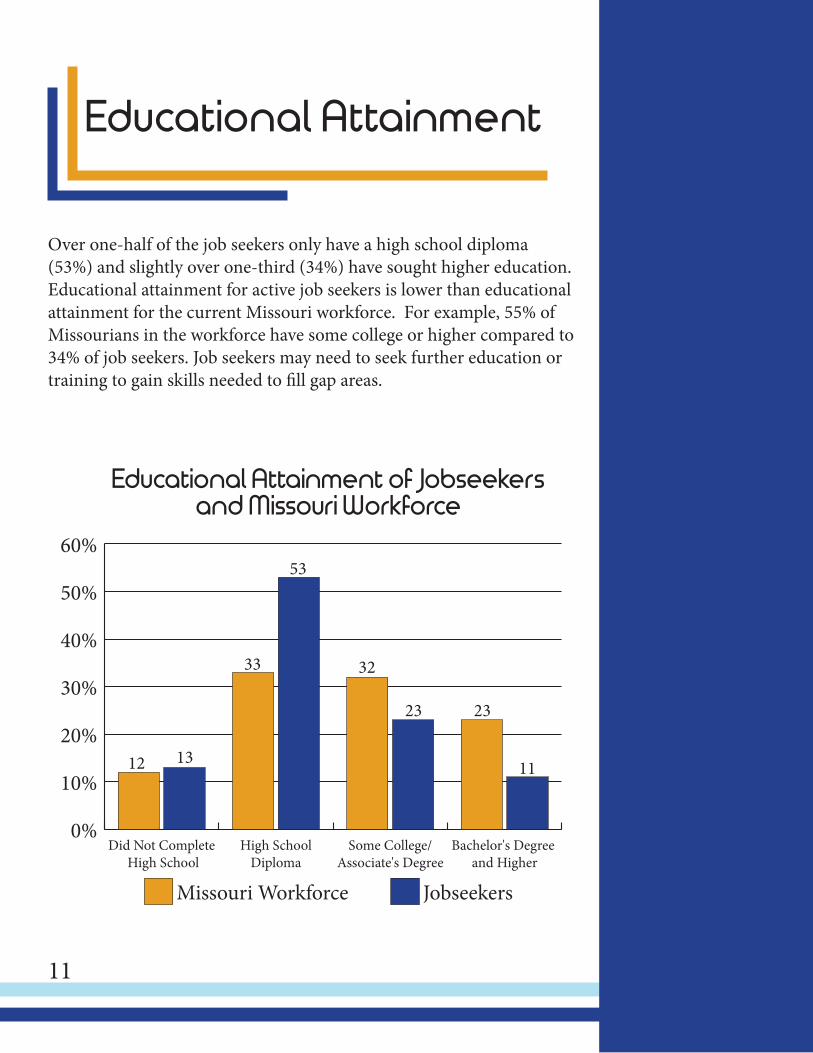
Over one-half of the job seekers only have a high school diploma (53%) and slightly over one-third (34%) have sought higher education. Educational attainment for active job seekers is lower than educational attainment for the current Missouri workforce. For example, 55% of Missourians in the workforce have some college or higher compared to 34% of job seekers. Job seekers may need to seek further education or training to gain skills needed to fill gap areas.
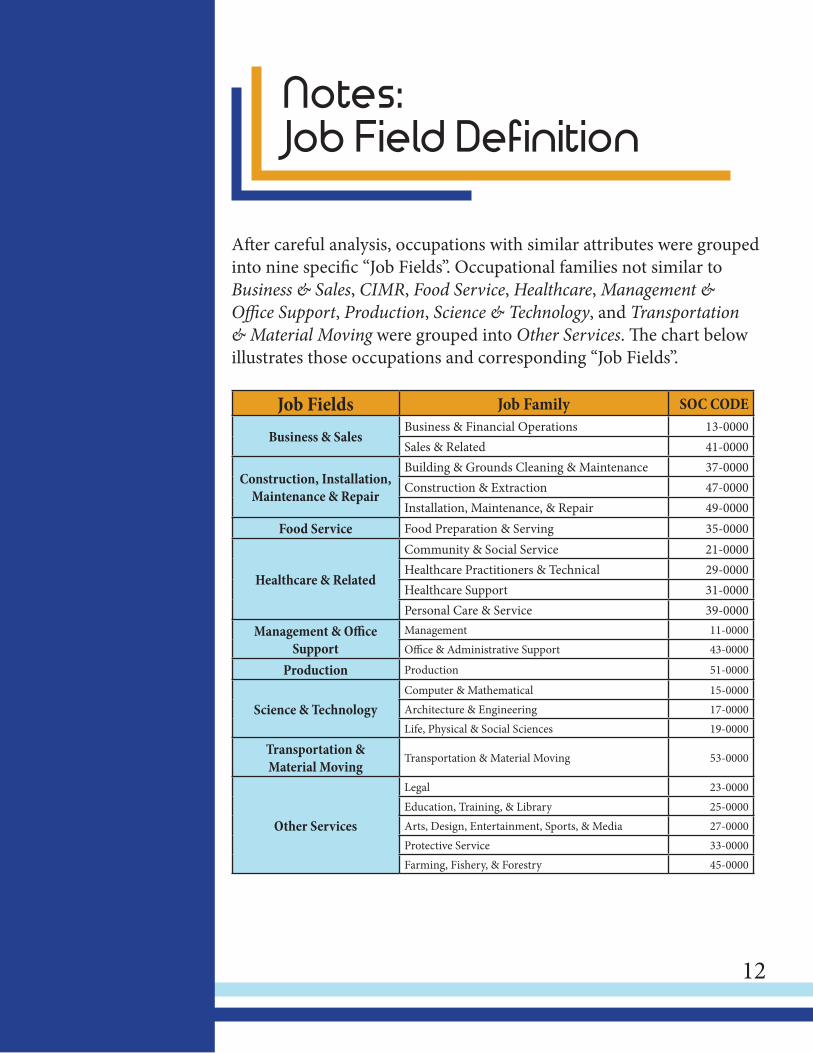
Job Fields Job Family SOC CODE
Business & SalesBusiness & Financial Operations 13-0000Sales & Related 41-0000
Construction, Installation, Maintenance & Repair
Building & Grounds Cleaning & Maintenance 37-0000Construction & Extraction 47-0000Installation, Maintenance, & Repair 49-0000
Food Service Food Preparation & Serving 35-0000
Healthcare & Related
Community & Social Service 21-0000Healthcare Practitioners & Technical 29-0000Healthcare Support 31-0000Personal Care & Service 39-0000
Management & Office Support
Management 11-0000Office & Administrative Support 43-0000
Production Production 51-0000
Science & TechnologyComputer & Mathematical 15-0000Architecture & Engineering 17-0000Life, Physical & Social Sciences 19-0000
Transportation & Material Moving
Transportation & Material Moving 53-0000
Other Services
Legal 23-0000
Education, Training, & Library 25-0000Arts, Design, Entertainment, Sports, & Media 27-0000Protective Service 33-0000Farming, Fishery, & Forestry 45-0000
12
Notes:Job Field Definition
After careful analysis, occupations with similar attributes were grouped into nine specific “Job Fields”. Occupational families not similar to Business & Sales, CIMR, Food Service, Healthcare, Management & Office Support, Production, Science & Technology, and Transportation & Material Moving were grouped into Other Services. The chart below illustrates those occupations and corresponding “Job Fields”.

13
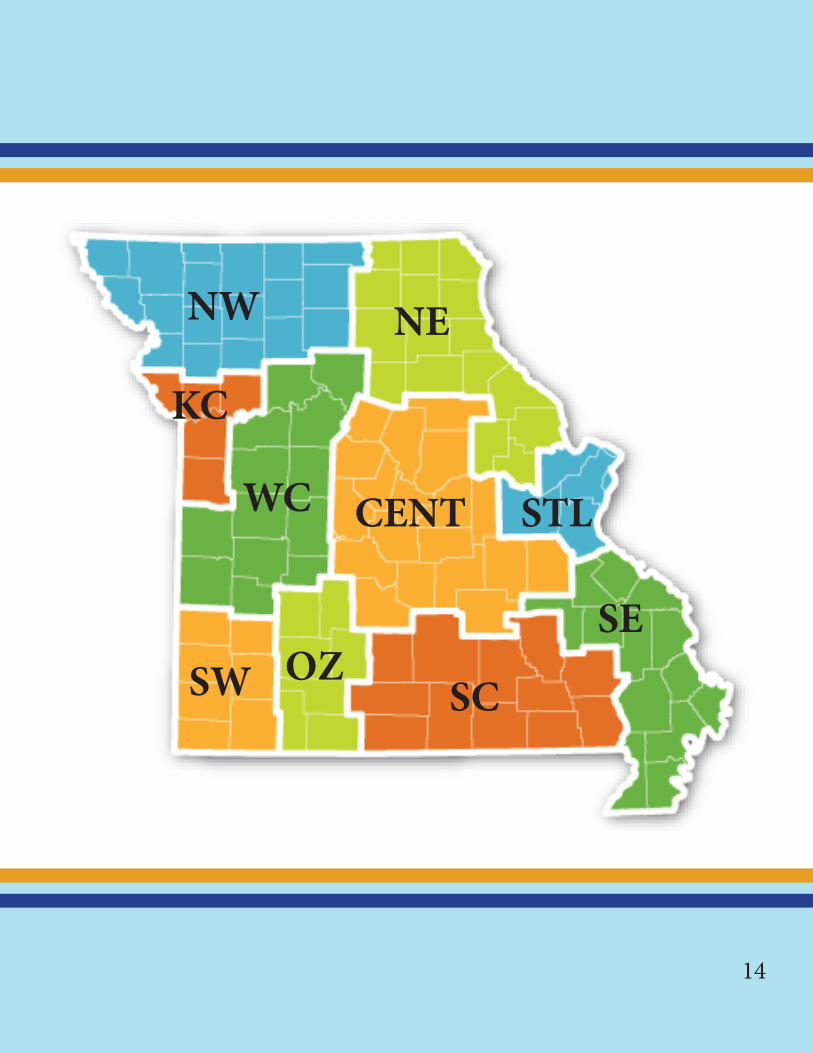
Workforce Areas
For research purposes Missouri is divided into 10 Workforce Development Areas: Central, St. Louis, Kansas City, West Central, Southwest, Ozark, South Central, Southeast, Northeast, and Northwest. Labor supply and demand data is determined by comparing online job ads and jobseeker data in each region. Due to regional differences in economic makeup across the state, labor supply gaps may differ from region to region.
NW NE
CENT STL
SE
SCOZSW
WC
KC
14
15
Sources:Burning Glass Technologies, Labor& Insight tool: Data for this analysis has been extracted using Burning Glass Technologies, Labor/Insight™ tool that collects information from over 35,000 web sources, including job boards, newspapers, large and small employer websites. Missouri Economic Research and Information Center (MERIC) uses this data to compile and publish reports for the State and Labor Market Regions. While this analysis presents a broad picture of hiring activity and serves as a measure of labor demand, it does not capture openings that are filled through other networks. Jobs.mo.gov jobseeker databaseU.S. Census Bureau, American Community Survey EstimatesU.S. Census Bureau, Quarterly Workforce IndicatorsU.S. Bureau of Labor Statistics, 2015 Occupational Employment Statistics
This workforce solution was funded by grants awarded by the U.S. Department of Labor’s Employment and Train-ing Administration, Workforce Information Grant. The solution was created by the grantee and does not necessarily reflect the official position of the U.S. Department of Labor. The Department of Labor makes no guarantees, warran-ties, or assurances of any kind, express or implied, with respect to such information, including any information on linked sites and including, but not limited to, accuracy of the information or its completeness, timeliness, usefulness, adequacy, continued availability, or ownership.

16

April 2017