Embed Size (px)
Citation preview

0 0 0
Trends In Labor Force Supply And Demand Wisconsin Family Impact Seminar Madison, WI November 4, 2015
Daniel Sullivan Executive Vice President and Director of Research Federal Reserve Bank of Chicago

1
Main Points Demographics and other long-running trends imply that the U.S.
labor force will grow more slowly in the years ahead – Slower growth in labor supply may pose a challenge for employers – The future labor force will also be older and better educated
Standard industrial and occupational projections foresee a continuation of past trends
– E.g., a declining share of employment in manufacturing
Such projections are highly uncertain – It is always difficult to anticipate key trends – Industry workforces are aging at different rates with implications
for future job openings
Hard and soft skills likely to be of increasing importance – Returns to academic and vocational skills remain high – Technology and international competition are eroding employment
opportunities for workers doing many routine tasks

2
62
64
66
68
1986 '91 '96 '01 '06 '11 '16
Labor Force Participation Rate is Falling Ages 16+ (percent)
Participation Rate
Long Run LFP Trend
Unemployment Based Prediction
3 3 3
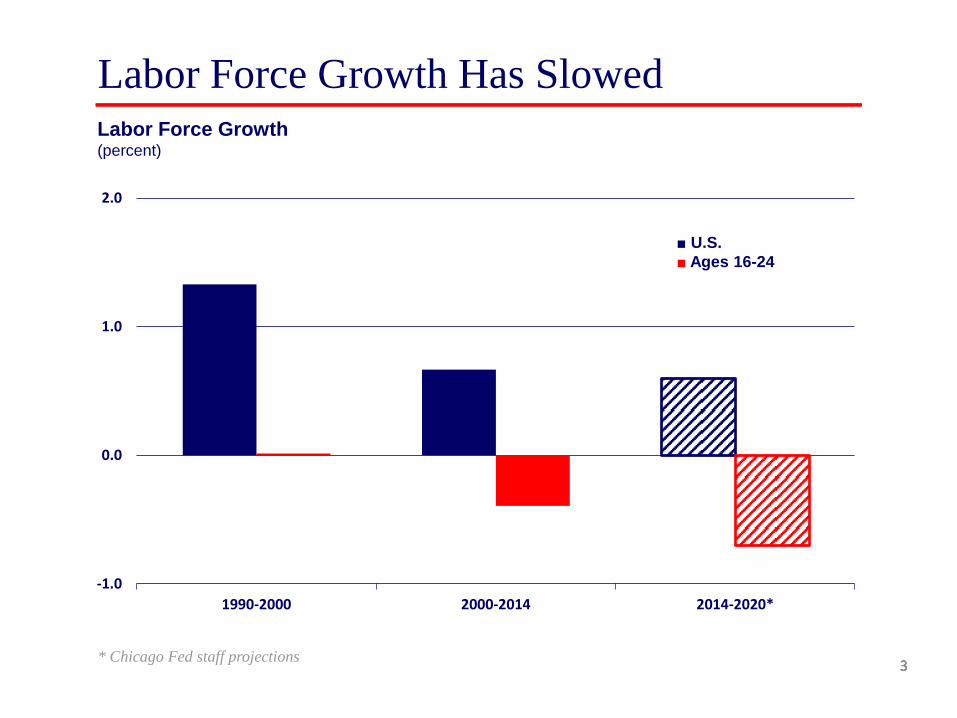
-1.0
0.0
1.0
2.0
1990-2000 2000-2014 2014-2020*
Labor Force Growth Has Slowed Labor Force Growth (percent)
■ U.S. ■ Ages 16-24
* Chicago Fed staff projections

4 4 4
0
5
10
15
20
25
30
1982 '86 '90 '94 '98 '02 '06 '10 '14 '18
Labor Force Share by Age Labor Force Share (percent)
Ages 16-19
Ages 20-24
Ages 55 and up
Projections prepared by Chicago Fed staff

5 5 5
0
10
20
30
40
50
1992 '96 '00 '04 '08 '12 '16 '20
Labor Force Share by Education Labor Force Share – Ages 25 and Older (percent)
HS Dropout
HS Degree
Some College
College Degree
Projections prepared by Chicago Fed staff
6 6 6
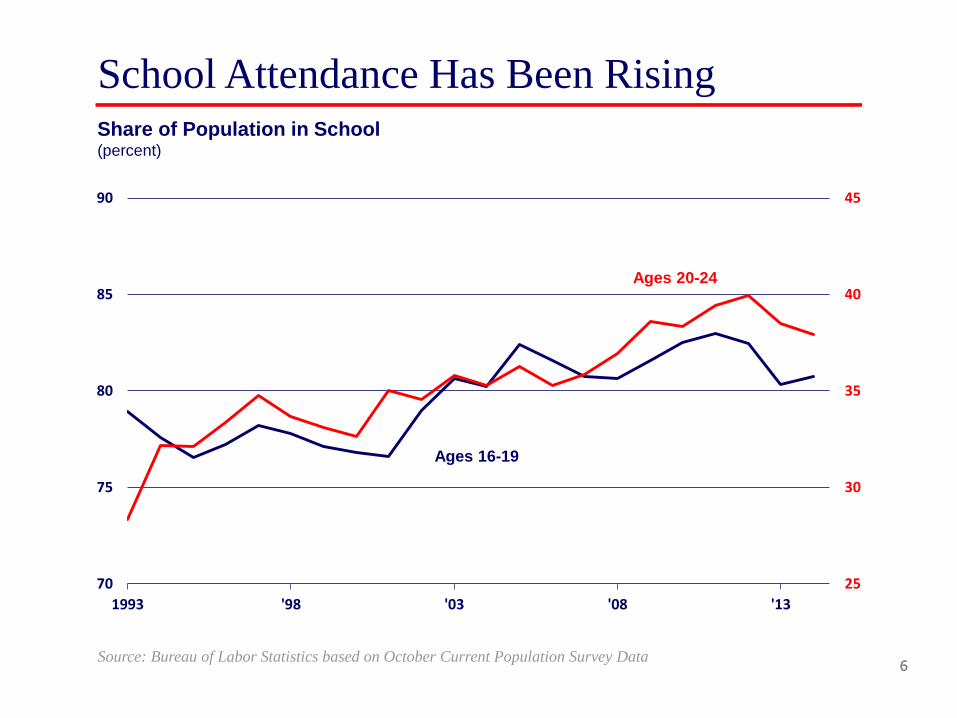
25
30
35
40
45
70
75
80
85
90
1993 '98 '03 '08 '13
School Attendance Has Been Rising Share of Population in School (percent)
Ages 16-19
Ages 20-24
Source: Bureau of Labor Statistics based on October Current Population Survey Data

7 7 7
0
5
10
15
1978 '83 '88 '93 '98 '03 '08 '13
Education Is A Good Investment On Average Internal Rate of Return to Higher Education (percent)
■ 4 Year College Graduate v. HS Graduate ■ 2 Year College Graduate v. HS Graduate
Source: Lisa Barrow and Ofer Malamud, Chicago Fed and University of Chicago.
8 8 8
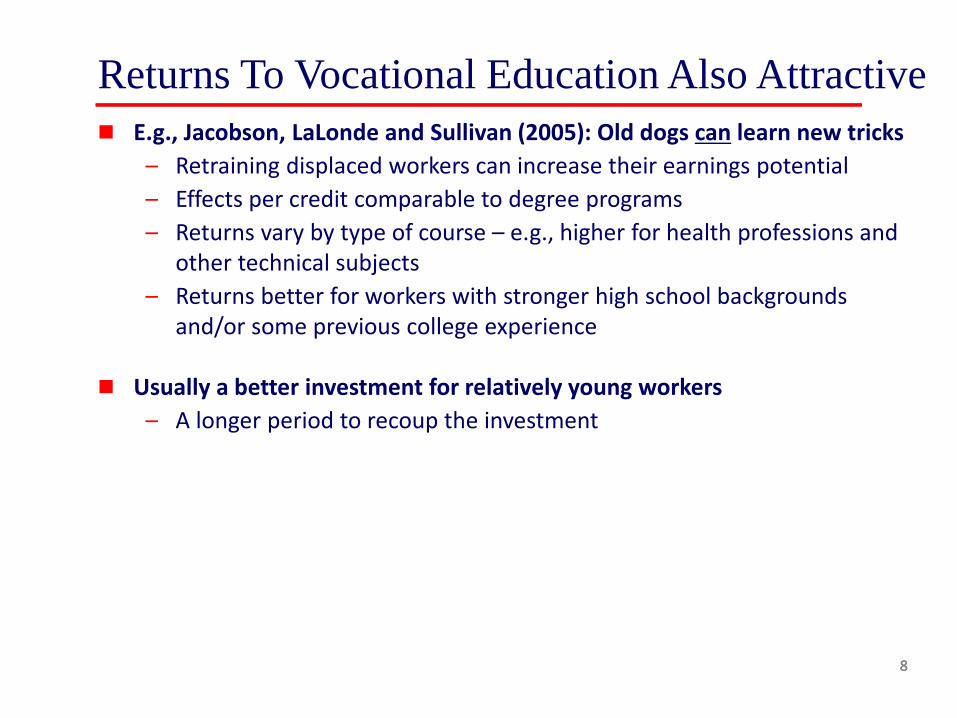
Returns To Vocational Education Also Attractive E.g., Jacobson, LaLonde and Sullivan (2005): Old dogs can learn new tricks
– Retraining displaced workers can increase their earnings potential – Effects per credit comparable to degree programs – Returns vary by type of course – e.g., higher for health professions and
other technical subjects – Returns better for workers with stronger high school backgrounds
and/or some previous college experience
Usually a better investment for relatively young workers – A longer period to recoup the investment

9 9 9
Helping Disadvantaged Youth More Difficult Historically, there have been many disappointments
– Interventions are often too small to have a chance of offsetting disadvantages
– Rigorous estimates of program impact are often indistinguishable from zero
Recently, some more hopeful outcomes – E.g., career academies – Professors Barnow and Lerman will discuss additional successful
approaches
10
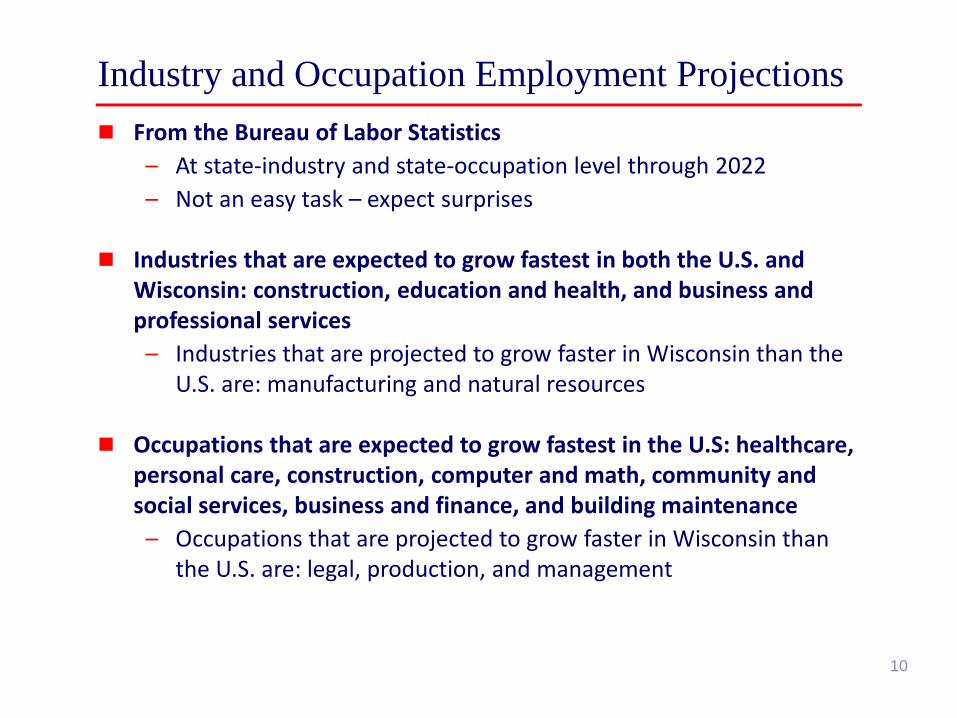
Industry and Occupation Employment Projections From the Bureau of Labor Statistics
– At state-industry and state-occupation level through 2022 – Not an easy task – expect surprises
Industries that are expected to grow fastest in both the U.S. and Wisconsin: construction, education and health, and business and professional services
– Industries that are projected to grow faster in Wisconsin than the U.S. are: manufacturing and natural resources
Occupations that are expected to grow fastest in the U.S: healthcare, personal care, construction, computer and math, community and social services, business and finance, and building maintenance
– Occupations that are projected to grow faster in Wisconsin than the U.S. are: legal, production, and management
11 11 11
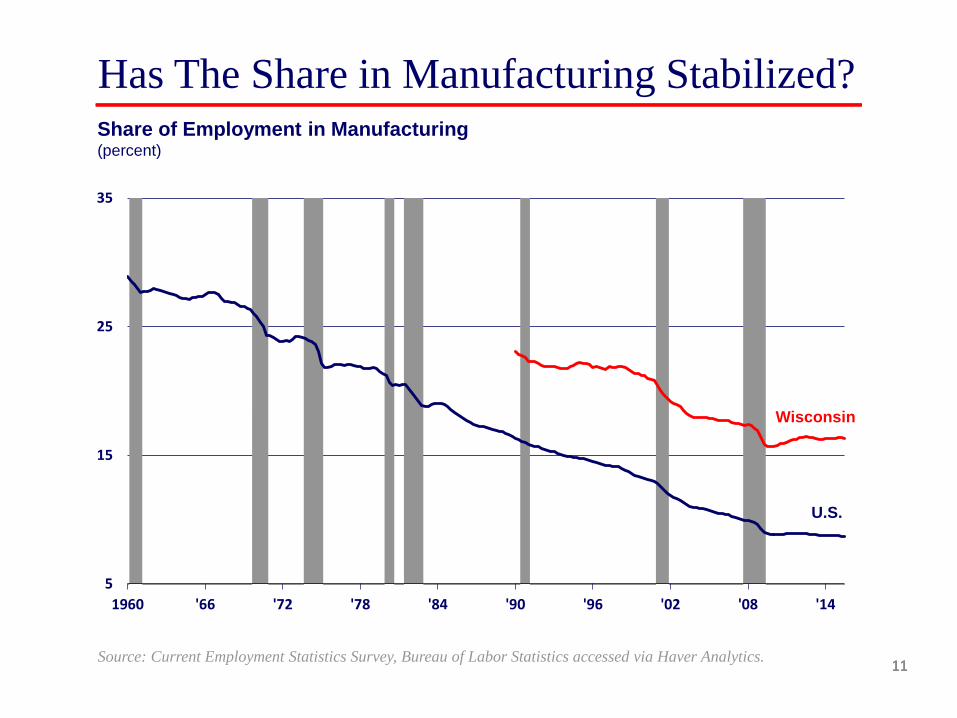
5
15
25
35
1960 '66 '72 '78 '84 '90 '96 '02 '08 '14
Share of Employment in Manufacturing (percent)
U.S.
Wisconsin
Has The Share in Manufacturing Stabilized?
Source: Current Employment Statistics Survey, Bureau of Labor Statistics accessed via Haver Analytics.

12 12 12
15
20
25
30
35
1977 '82 '87 '92 '97 '02 '07 '12
Manufacturing Workforce Older Share of Workers over 50 (percent)
Manufacturing
Non-manufacturing
Source: Chicago Fed Staff tabulations of Current Population Survey Data

13 13 13
0
1
2
3
Low Wage Mid Wage High Wage
Job Growth Slow in Middle-Wage Occupations Annualized Job Growth of Occupations Ranked by Wage Rate (percent)
■ Since 1990 ■ Since June 2009
Source: Bureau of Labor Statistics, Current Population Survey

14 14 14
14
16
18
20
1999 '04 '09 '1426
28
30
32
1999 '04 '09 '14
Routine Jobs Are Declining Cognitively Routine Jobs (percent of total US employment)
Manually Routine Jobs (percent of total US employment)
Source: From Bureau of Labor Statistics Occupational Employment Survey data, computed by Dan Aaronson and Brian Phelan, Chicago Fed and DePaul.
15
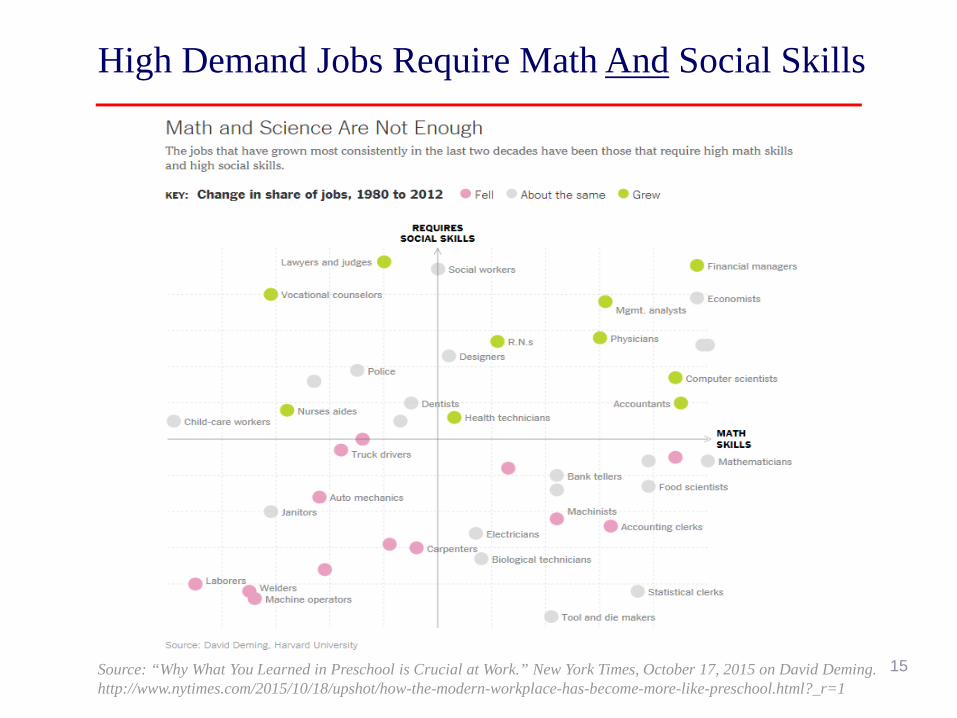
High Demand Jobs Require Math And Social Skills
Source: “Why What You Learned in Preschool is Crucial at Work.” New York Times, October 17, 2015 on David Deming. http://www.nytimes.com/2015/10/18/upshot/how-the-modern-workplace-has-become-more-like-preschool.html?_r=1

16
Summary The future workforce will
– Grow more slowly – Be older and better educated
Particular industrial and occupational growth rates will likely extend previous trends
– But there is a lot of uncertainty
A firmer expectation is that skills – both technical and social – will continue to be in high demand
– Occupations that can be automated or outsourced to lower-wage countries will likely shrink
– Highly routine jobs with little need for social interaction will be most vulnerable

17 17 17
Appendix

18 18 18
2013 Labor Force Participation Rates (percent, left axis) Men Women
Participation And Population Change By Age Change in Population Share (percentage points, right axis) 1995-2000 2010-2015
- 1.50%
-
1.50%
0.75%
0.00%
0.75%
Age
0
10
20
30
40
50
60
70
80
90
100
16 20 24 28 32 36 40 44 48 52 56 60 64 68 72 76 80

19 19 19
30
40
50
60
70
1977 '82 '87 '92 '97 '02 '07 '12
Teen LFP Has Fallen Massively Ages 16-19 (percent)
■ Men ■ Women
20 20 20
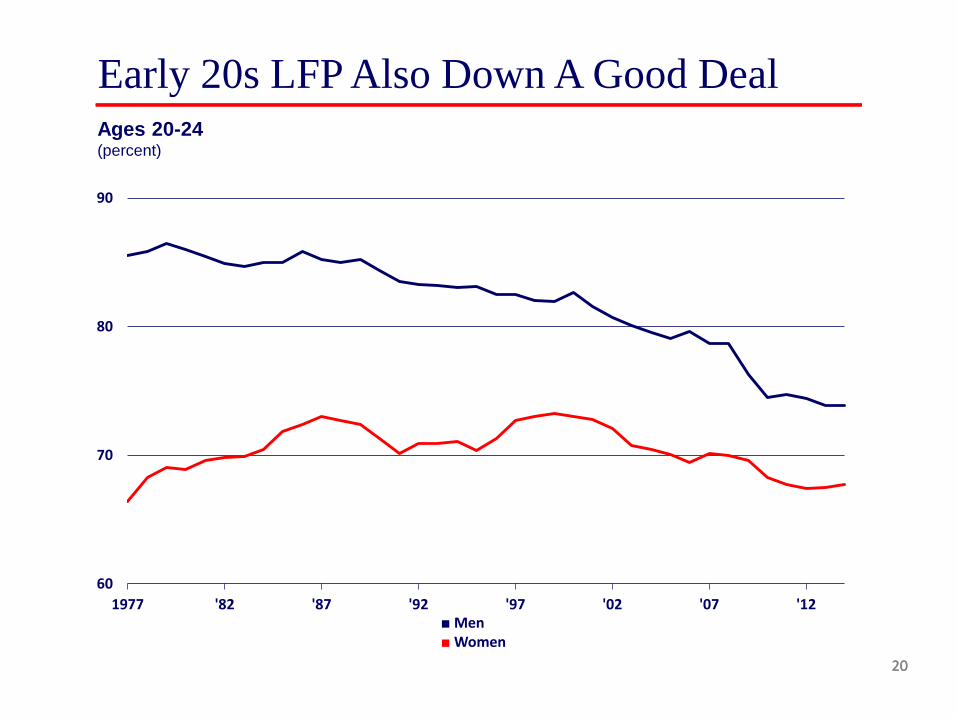
60
70
80
90
1977 '82 '87 '92 '97 '02 '07 '12
Early 20s LFP Also Down A Good Deal Ages 20-24 (percent)
■ Men ■ Women
21 21 21
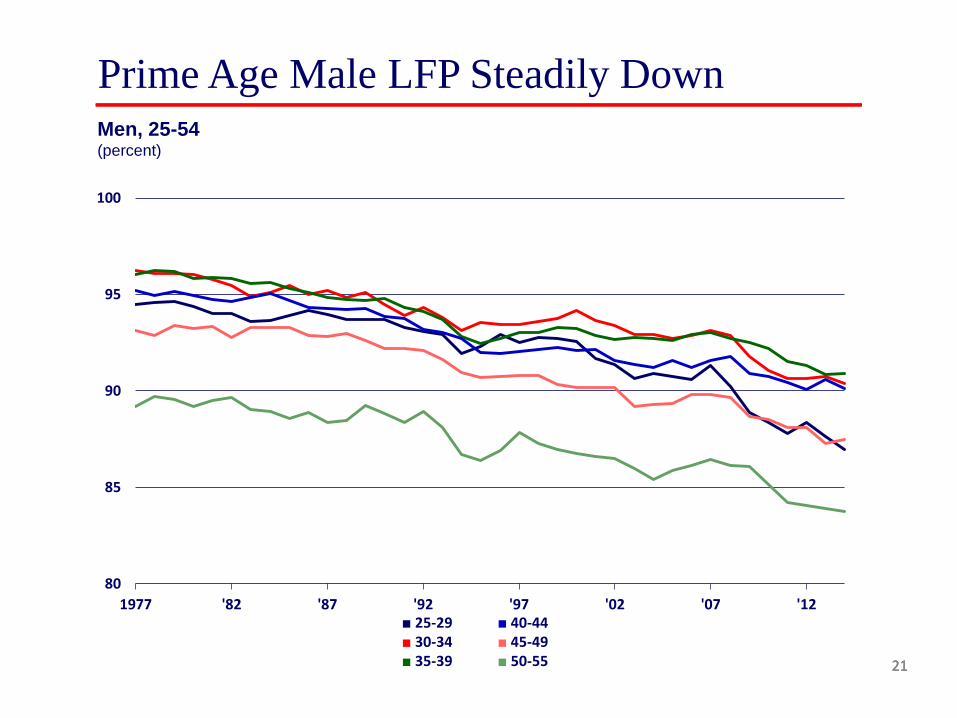
80
85
90
95
100
1977 '82 '87 '92 '97 '02 '07 '12
Prime Age Male LFP Steadily Down Men, 25-54 (percent)
■ 25-29 ■ 40-44 ■ 30-34 ■ 45-49 ■ 35-39 ■ 50-55

22 22 22
50
60
70
80
1977 '82 '87 '92 '97 '02 '07 '12
Prime Age Female LFP Now Slowly Down Women, 25-54 (percent)
■ 25-29 ■ 40-44 ■ 30-34 ■ 45-49 ■ 35-39 ■ 50-55
23 23 23
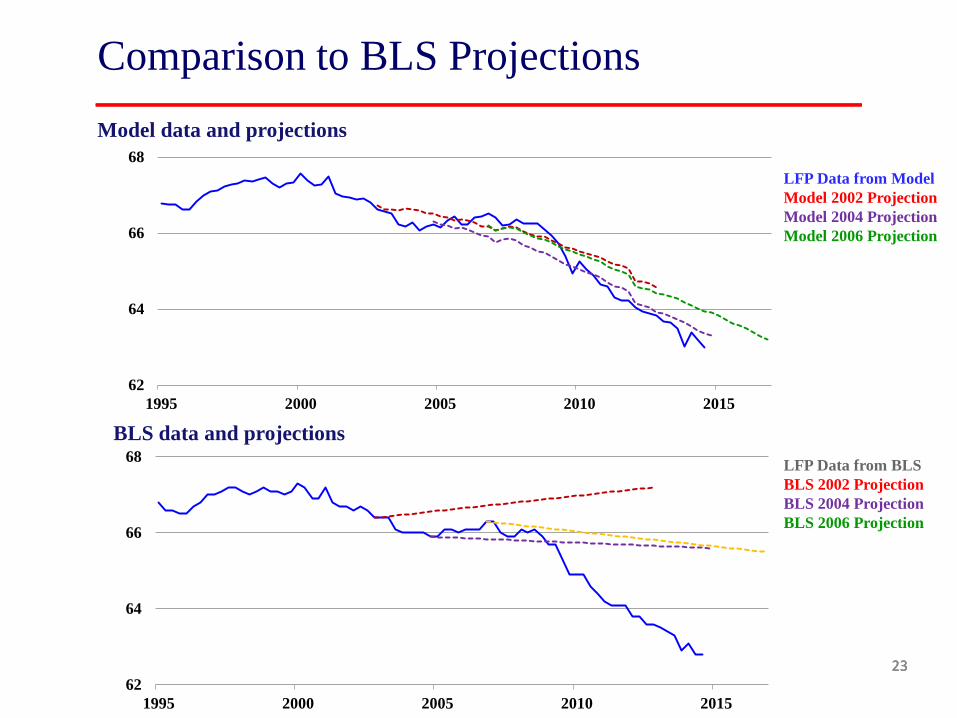
62
64
66
68
1995 2000 2005 2010 2015
Comparison to BLS Projections Model data and projections
LFP Data from Model Model 2002 Projection Model 2004 Projection Model 2006 Projection
62
64
66
68
1995 2000 2005 2010 2015
BLS data and projections LFP Data from BLS BLS 2002 Projection BLS 2004 Projection BLS 2006 Projection

24 24 24
Industry Employment Projections to 2022
% Difference in wages*
U.S. Employment
% Change WI 2012 WI Change WI % Change
Total 10.7 3,051,328 217,845 7.1 Goods 17.5 6.5 653,231 24,583 3.8 Natural Resources 16.3 -10.6 106,414 -1,694 -1.6 Construction 7.3 28.7 93,197 17,113 18.4 Manufacturing 22.8 -4.6 453,620 9,164 2.0 Service -3.7 12.2 2,244,265 185,817 8.3 Trade, Transportation, ddd& Utilities -16.1 7.2 525,447 22,801 4.3
Information 77.2 -2.4 46,313 565 1.2 Financial 66.3 9.6 162,632 15,922 9.8 Professional & fffflBusiness Services 30.0 19.4 289,552 42,089 14.5
Education & Health -10.3 27.9 637,625 70,748 11.1 Leisure -59.0 9.3 255,858 70,748 9.2 Other Services -33.8 10.5 146,986 7,362 5.0 Government N/A 2.3 179,852 2,688 1.5 * Percent difference in Industry Average Weekly Wage (2014) vs U.S. Average Weekly Wage for all Industries

25 25 25
Occupation Employment Projections to 2022
% Difference in wages*
U.S. Employment
% Change WI 2012 WI Change WI % Change
Total 10.7 3,051,328 217,845 7.1
Management 138.2 7.2 144,717 12,130 8.4
Business & Finance 53.3 12.5 146,675 12,518 8.5
Computer & Math 77.8 18.0 65,526 7,648 11.7
Architecture & Engineering 72.6 7.3 49,017 2,093 4.3 Life, Physical, and Social Sciences 48.4 10.1 24,271 2,019 8.3
Community and Social Services -4.1 17.2 35,929 2,377 6.6
Legal 114.1 10.7 15,176 2,447 16.1
Education 10.5 11.1 182,223 11,074 6.1
Arts, Design, Media, Sports 18.1 7.0 49,980 3,722 7.5
* Percent difference in 2014 Annual Mean Wage for Individual Occupations vs U.S. Mean Wage for All Occupations

26 26 26
Occupation Employment Projections to 2022
% Difference in wages*
U.S. Employment
% Change WI 2012 WI Change WI % Change
Healthcare 60.9 21.5 161,312 23,792 14.8 Healthcare support -39.0 28.1 82,784 10,984 13.3 Protective Services -6.9 7.9 54,884 2,499 4.6 Food prep -53.5 9.4 232,533 18,298 7.9 Building maintenance -44.2 12.5 102,621 12,852 12.5 Personal care -47.1 20.9 150,668 19,305 12.8 Sales -18.1 7.3 281,322 11,699 4.2 Office support -25.3 6.8 444,947 20,468 4.6 Farming -46.7 -3.4 84,896 -3,552 -4.2 Construction -1.3 21.4 97,504 14,648 15.0 Install, repair -4.3 9.6 108,958 7,703 7.1 Production -24.9 0.8 314,215 9,924 3.2 Transport -27.0 8.6 221,171 13,197 6.0
* Percent difference in WI 2014 Annual Mean Wage vs U.S. Mean Wage for all Occupations