Embed Size (px)
Citation preview

Mississippi Mills Wastewater Treatment Plant Annual Report 2013
Mississippi Mills Lagoon and WWTP Systems 2012 Annual Report
Please find below the 2013 Annual Performance Report and other supporting documents for the Mississippi Mills Wastewater Treatment Plant. This report is a requirement of the Environmental Compliance Approval (ECA) (formerly known as the certificate of approval (CofA)) Number 2425-8DXR5U (issued February 16, 2011). The ECA allotted of the operation of both the lagoon treatment facility as well as the new wastewater treatment plant (WWTP). The new WWTP was brought into service on July 11, 2012. This 2013 report is the first report based on treatment entirely from the new WWTP. Summary: Flow Exceedances:
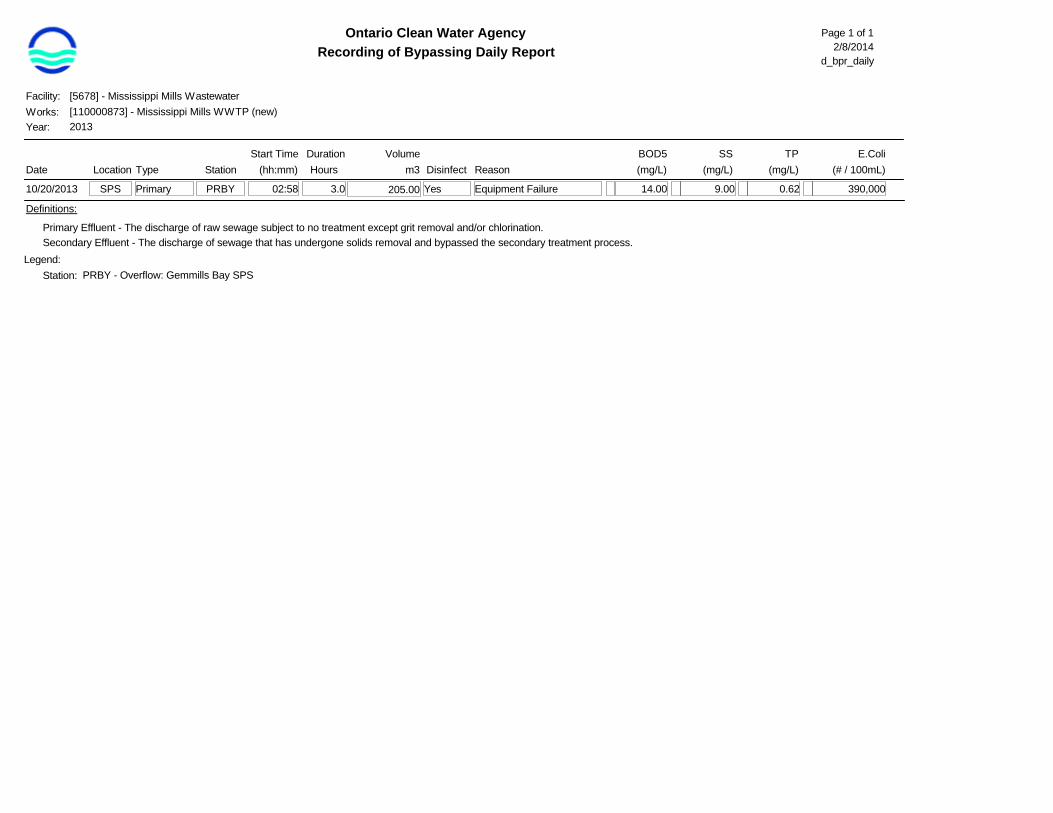
There were no flow exceedances. Bypass Events:
There was one bypass event due to equipment failure. Overflow Events: There were no overflow events Spills: There were two small sludge spills from a bio-filter line. Effluent Compliance Limits
Parameter Compliance Limit Met? Treatment Objectives Met?
Concentration Loadings Concentration Loadings cBOD YES YES YES YES Suspended Solids NO YES NO YES Total Phosphorus YES YES NO NO Total Ammonia YES YES YES YES E. Coli (geo-mean) N/A N/A YES N/A
Flow Assessment: WWTP Influent Flow Limits: The WWTP ECA approves: A design average daily treatment capacity of 4,700 m3/d and a peak treatment capacity of
14,100 m3/d.

Mississippi Mills WWTP 2013 Annual Report
2 of 14
Average Day Flow: The ECA limits the annual average day volume to 4700 m3/d. With a 2013 annual average day flow of 2657 m3/d, the new WWTP is at 56.5% capacity. The chart below depicts the month average day flow from the Gemmill’s Bay Pumping Station.
Peak Day Flow: The ECA limits the volume of wastewater pumped from the Gemmill’s Bay pumping station to WWTP to 14,100 m3/d. The peak raw sewage influent flow was 9566 m3/d therefore the compliance limit has not been exceeded. The chart below depicts the peak flow rates from the Gemmill’s Bay Pumping Station.
0
500
1000
1500
2000
2500
3000
3500
4000
4500
5000
Jan Feb Mar Apr May Jun Jul Aug Sep Oct Nov Dec
2013
Month Average Daily Flow WWT Influent (m3/d)
Average Day Flow
ECA Limit
0
2000
4000
6000
8000
10000
12000
14000
16000
Jan Feb Mar Apr May Jun Jul Aug Sep Oct Nov Dec
2013
Peak Daily Flow: Influent(m3/d)
Peak Day Flow
ECA Limit

Mississippi Mills WWTP 2013 Annual Report
3 of 14
Capacity Assessment:
Year 2010 2011 2012
Jan - Jul (Lagoon)
2012 Jul– Dec (WWTP)
2013
Average Day Flow (m3/d) 2770 2541 2380 1687 2657 ADF: Design Capacity (m3/d) 3020 3020 3020 4700 4700 % of capacity, based on average daily flows 91.7 84.1 78.8 35.9 56.5
Maximum Day Flow (m3/d) 13692 14989 16311 4901 9566 (a) A summary and interpretation of all monitoring data and a comparison to the effluent limits
including an overview of the success and adequacy of the Works
Effluent Limits: The requirements of the ECA for the treatment system are as follows:
Parameter Effluent Limits
Concentration Waste Loading cBOD5 25.0 mg/L 117.5 kg/d Suspended Solids 15.0 mg/L 70.5 kg/d Total Phosphorus
Sep 01 – May 30 0.3 mg/L 1.41 kg/d Jun 01 – Aug 31 0.2 mg/L 0.94 kg/d
Total Ammonia Sep 01 – Apr 30 15 mg/L 70.5 kg/d
May 01 – Aug 31 5 mg/L 23.5 kg/d pH of the effluent maintained between 6.0 to 9.5 inclusive, at all times. *Based on monthly average concentration and monthly average loading
Effluent Objectives The requirements of the ECA for the treatment system are as follows:
Parameter Effluent Objectives
Concentrations Loading cBOD5 10.0 mg/L 47 kg/d Suspended Solids 10.0 mg/L 47 kg/d Total Phosphorus 0.15 mg/L 0.71 kg/d Total Ammonia
Sep 01 – Apr 30 12 mg/L 56.4 kg/d May 01 – Aug 31 3.0 mg/L 14.1 kg/d
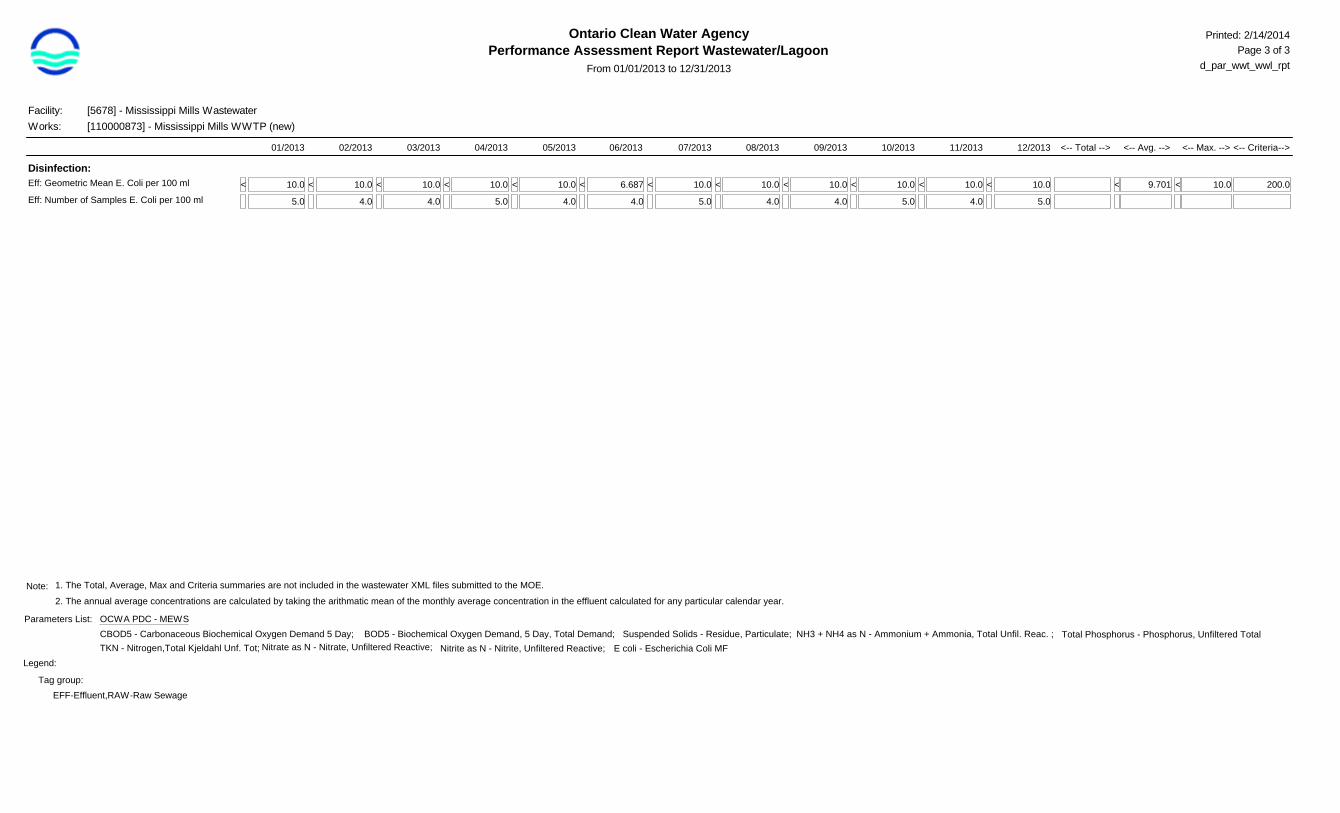
E. Coli 100 organisms per 100 millilitres (Monthly geometric Mean Density)
Not applicable

Mississippi Mills WWTP 2013 Annual Report
4 of 14
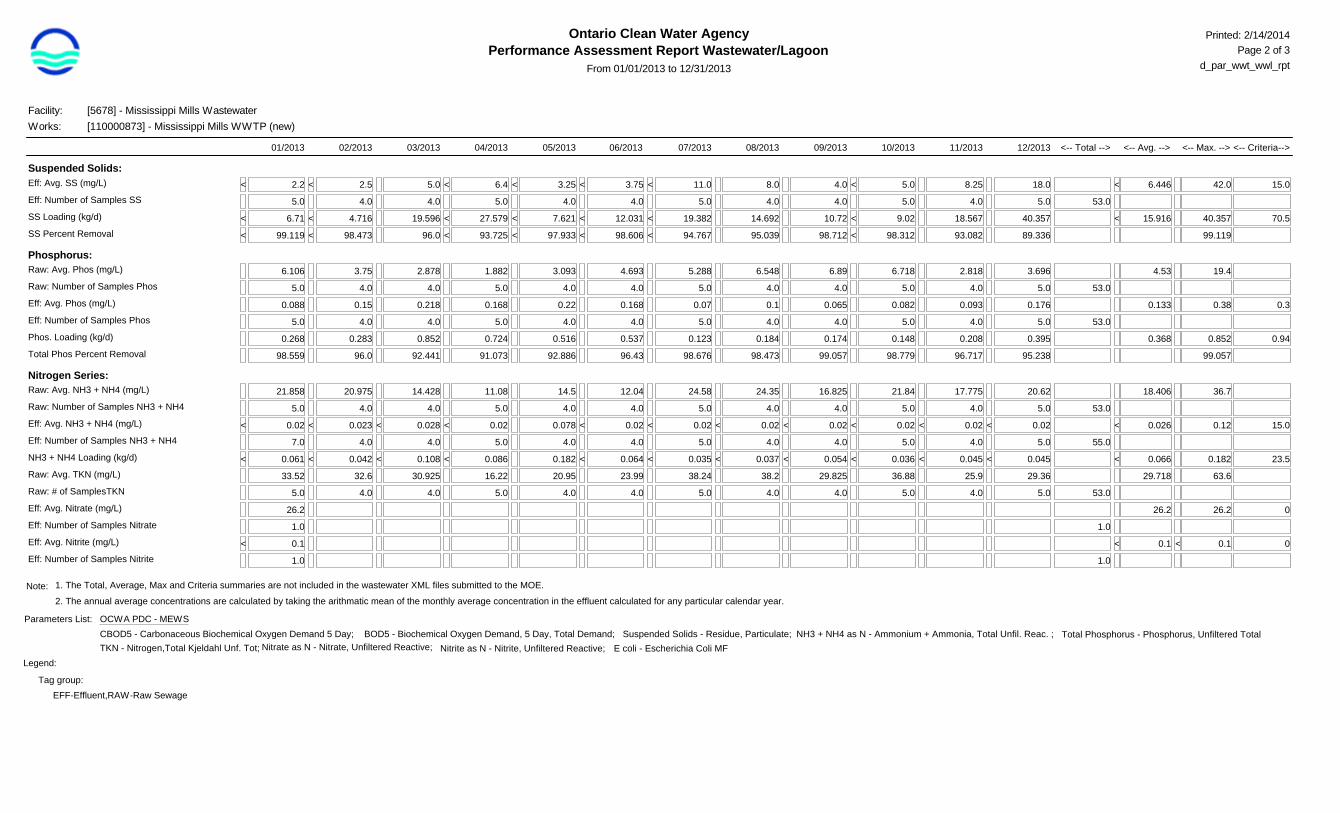
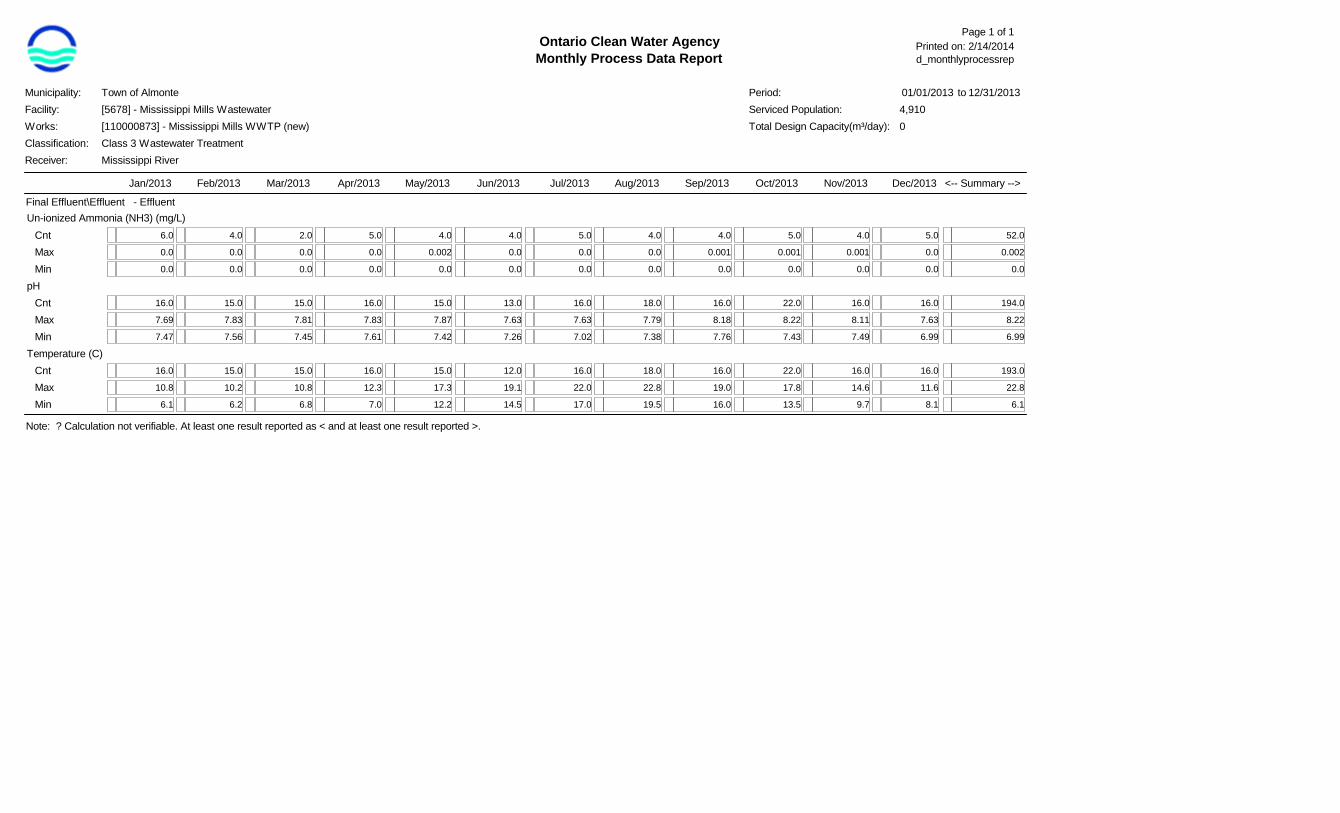
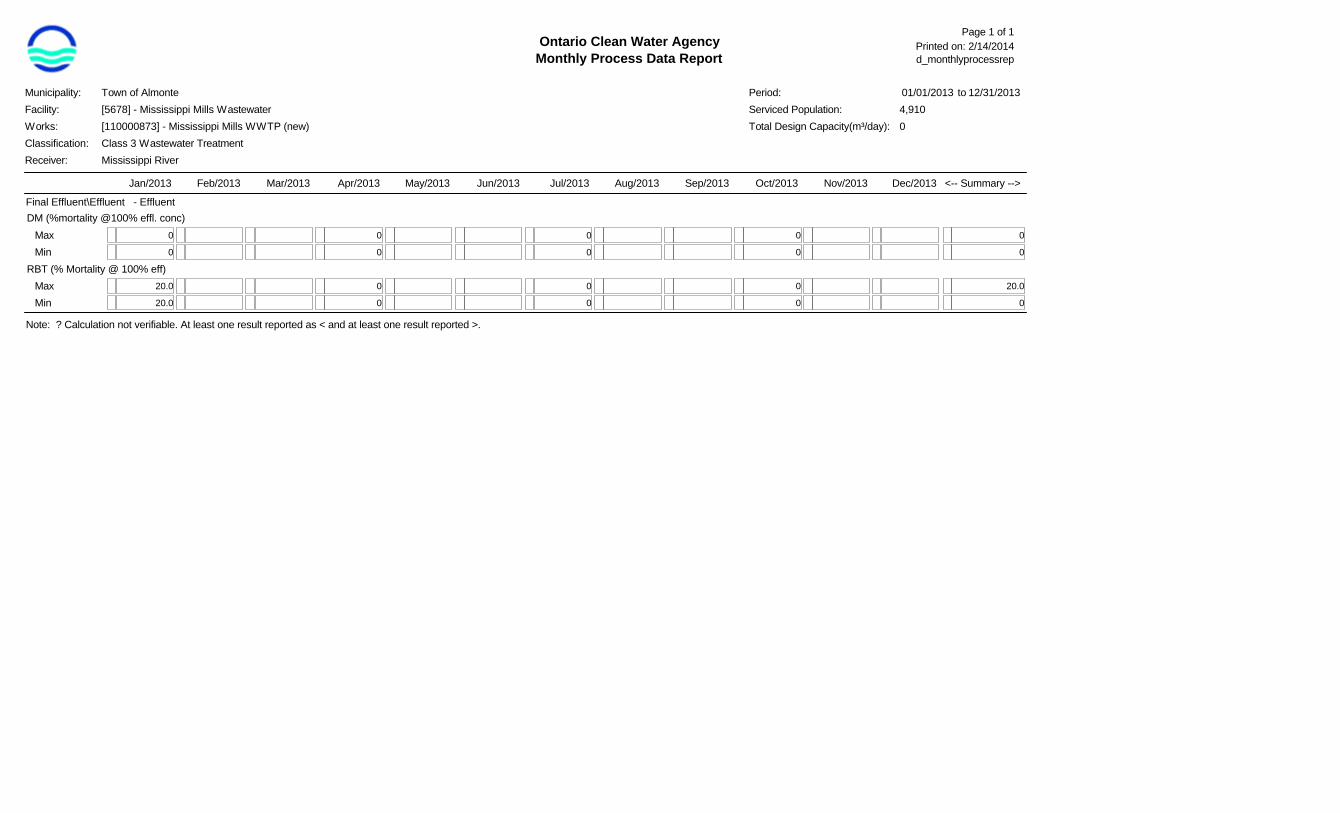
Please find attached a copy of OCWA’s Performance Assessment Report (PAR) - this report summarizes flow and chemical analysis for samples taken throughout the year. A report for effluent pH, temperature and unionized ammonia is attached. The ECA requires quarterly samples to be taken and analyzed for Acute Lethality. The effluent passed the requirements of these tests. A report on Acute Lethality testing for the new WWTP is included. RBT = Rainbow Trout and DM = Daphnia Magna test results.
Mississippi Mills WWTP 2013 Annual Report
5 of 14
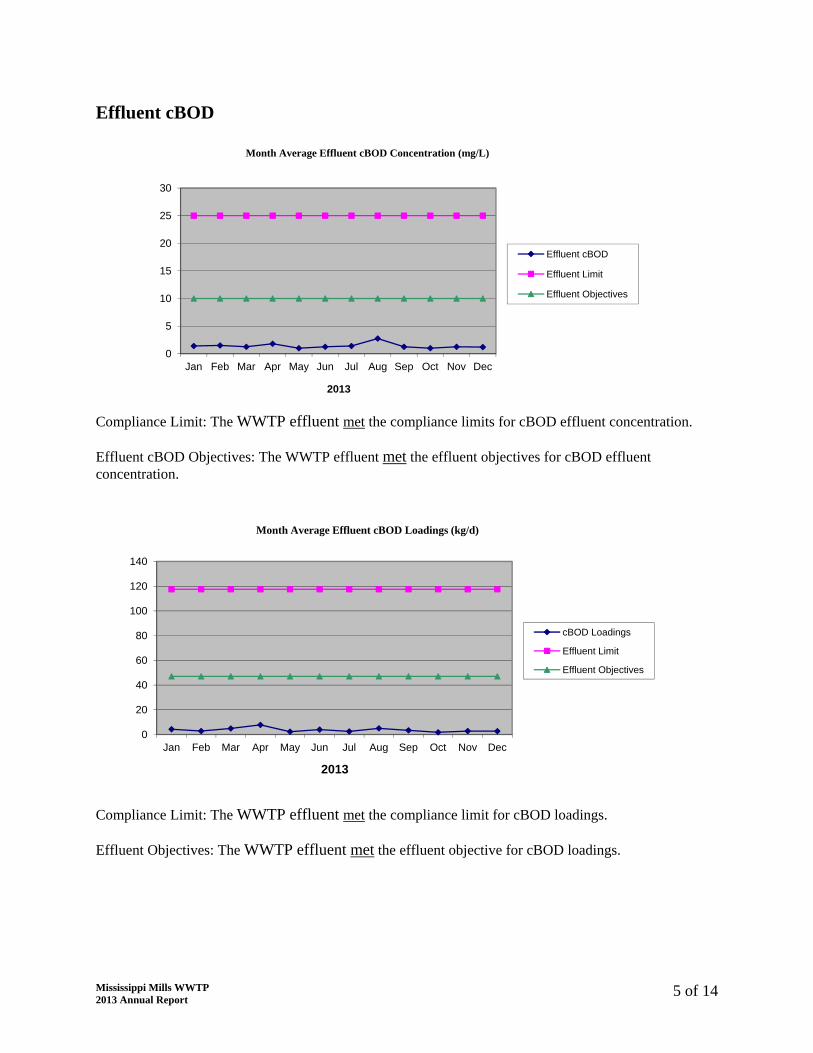
Effluent cBOD
Compliance Limit: The WWTP effluent met the compliance limits for cBOD effluent concentration. Effluent cBOD Objectives: The WWTP effluent met the effluent objectives for cBOD effluent concentration.
Compliance Limit: The WWTP effluent met the compliance limit for cBOD loadings. Effluent Objectives: The WWTP effluent met the effluent objective for cBOD loadings.
0
5
10
15
20
25
30
Jan Feb Mar Apr May Jun Jul Aug Sep Oct Nov Dec
2013
Month Average Effluent cBOD Concentration (mg/L)
Effluent cBOD
Effluent Limit
Effluent Objectives
0
20
40
60
80
100
120
140
Jan Feb Mar Apr May Jun Jul Aug Sep Oct Nov Dec
2013
Month Average Effluent cBOD Loadings (kg/d)
cBOD Loadings
Effluent Limit
Effluent Objectives

Mississippi Mills WWTP 2013 Annual Report
6 of 14
Effluent Suspended Solids
Compliance Limit: The WWTP effluent failed to meet the compliance limit for effluent suspended solids concentration in December 2013. Effluent Objectives: The WWTP effluent failed to meet the effluent objective for suspended solids concentration in July and in December 2013.
Compliance Limits: The WWTP effluent met the compliance limit for total suspended solids loading. Effluent Objectives: The WWTP effluent met the total suspended solids loading requirement.
0
2
4
6
8
10
12
14
16
18
20
Jan Feb Mar Apr May Jun Jul Aug Sep Oct Nov Dec
2013
Month Average Effluent Suspended Solids Concentration (mg/L)
Suspended Solids
Effluent Limit
Effluent Objectives
0
10
20
30
40
50
60
70
80
Jan Feb Mar Apr May Jun Jul Aug Sep Oct Nov Dec
Month Average Effluent Suspended Solids Loading (kg/d)
Suspended Solids
Compliance Limit
Effluent Objectives
2013

Mississippi Mills WWTP 2013 Annual Report
7 of 14
Effluent Phosphorus
Compliance Limits: The WWTP effluent met the Total Phosphorus treatment compliance limits. Effluent Objectives: The WWTP effluent did not meet the Total Phosphorus treatment effluent objective in Mar, Apr, May, June and Dec.
Compliance Limit: The WWTP effluent met the Total Phosphorus effluent loading compliance limit. Effluent Objective: The WWTP effluent failed to meet the Total Phosphorus effluent loading objective in March and April. Please refer to section (b) below regarding a description of the operating problems encountered for phosphorus.
0
0.5
Jan Feb Mar Apr May Jun Jul Aug Sep Oct Nov Dec
2013
Month Average Effluent Total Phosphorus Concentration (mg/L)
Effluent Concentration
Compliance Limit
Effluent Objective
0
1
2
Jan Feb Mar Apr May Jun Jul Aug Sep Oct Nov Dec
2013
Month Average Effluent Total Phosphorus Loading Concentration (kg/d)
Effluent Concentration
Compliance Limit
Effluent Objective
Mississippi Mills WWTP 2013 Annual Report
8 of 14
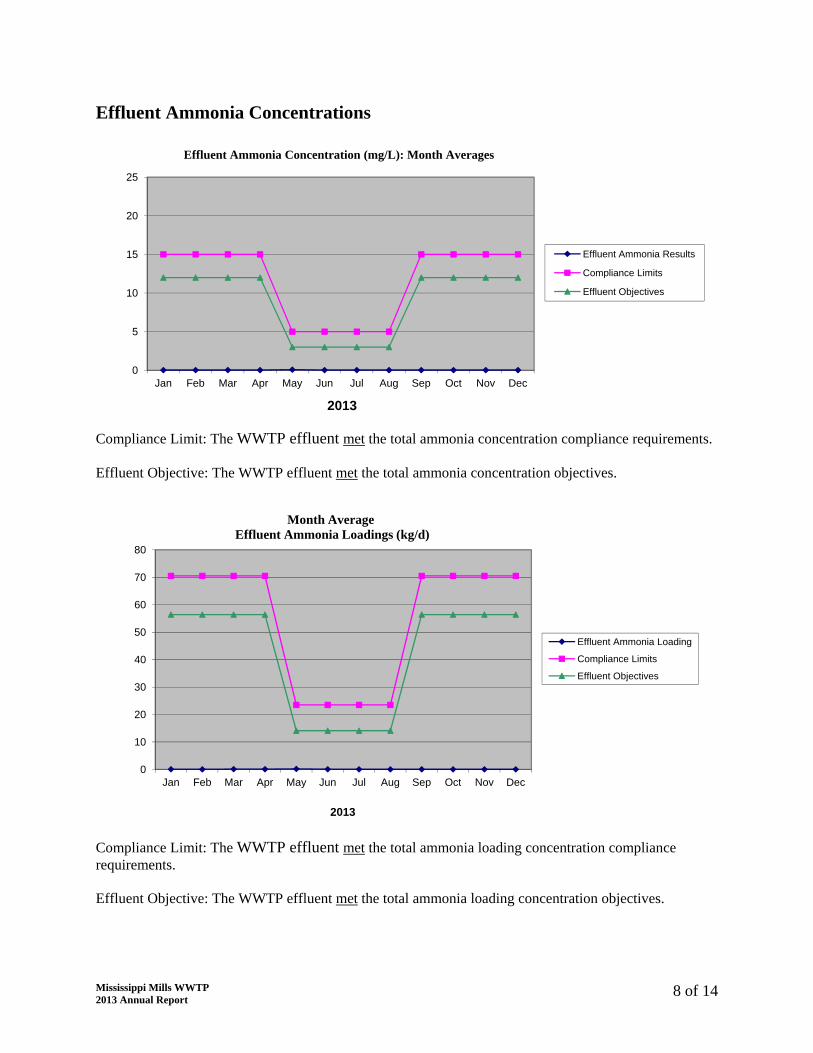
Effluent Ammonia Concentrations
Compliance Limit: The WWTP effluent met the total ammonia concentration compliance requirements. Effluent Objective: The WWTP effluent met the total ammonia concentration objectives.
Compliance Limit: The WWTP effluent met the total ammonia loading concentration compliance requirements. Effluent Objective: The WWTP effluent met the total ammonia loading concentration objectives.
0
5
10
15
20
25
Jan Feb Mar Apr May Jun Jul Aug Sep Oct Nov Dec
2013
Effluent Ammonia Concentration (mg/L): Month Averages
Effluent Ammonia Results
Compliance Limits
Effluent Objectives
0
10
20
30
40
50
60
70
80
Jan Feb Mar Apr May Jun Jul Aug Sep Oct Nov Dec
2013
Month Average Effluent Ammonia Loadings (kg/d)
Effluent Ammonia Loading
Compliance Limits
Effluent Objectives
Mississippi Mills WWTP 2013 Annual Report
9 of 14
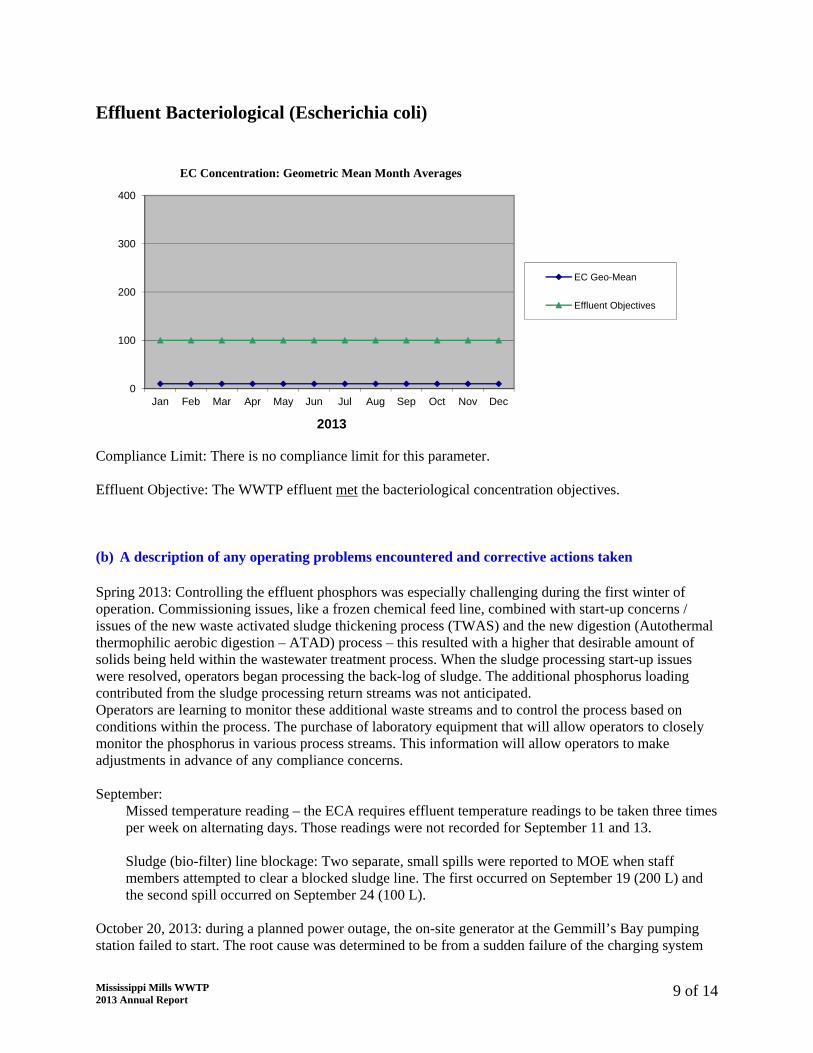
Effluent Bacteriological (Escherichia coli)
Compliance Limit: There is no compliance limit for this parameter. Effluent Objective: The WWTP effluent met the bacteriological concentration objectives. (b) A description of any operating problems encountered and corrective actions taken Spring 2013: Controlling the effluent phosphors was especially challenging during the first winter of operation. Commissioning issues, like a frozen chemical feed line, combined with start-up concerns / issues of the new waste activated sludge thickening process (TWAS) and the new digestion (Autothermal thermophilic aerobic digestion – ATAD) process – this resulted with a higher that desirable amount of solids being held within the wastewater treatment process. When the sludge processing start-up issues were resolved, operators began processing the back-log of sludge. The additional phosphorus loading contributed from the sludge processing return streams was not anticipated. Operators are learning to monitor these additional waste streams and to control the process based on conditions within the process. The purchase of laboratory equipment that will allow operators to closely monitor the phosphorus in various process streams. This information will allow operators to make adjustments in advance of any compliance concerns. September:
Missed temperature reading – the ECA requires effluent temperature readings to be taken three times per week on alternating days. Those readings were not recorded for September 11 and 13. Sludge (bio-filter) line blockage: Two separate, small spills were reported to MOE when staff members attempted to clear a blocked sludge line. The first occurred on September 19 (200 L) and the second spill occurred on September 24 (100 L).
October 20, 2013: during a planned power outage, the on-site generator at the Gemmill’s Bay pumping station failed to start. The root cause was determined to be from a sudden failure of the charging system
0
100
200
300
400
Jan Feb Mar Apr May Jun Jul Aug Sep Oct Nov Dec
2013
EC Concentration: Geometric Mean Month Averages
EC Geo-Mean
Effluent Objectives

Mississippi Mills WWTP 2013 Annual Report
10 of 14
for the starting battery. Additionally, the station control system and transfer switch also failed. Subsequent review indicated a history of failures with this specific type of charging system on other generators from the same manufacturer. From this the charging systems were changed out on both generator systems, at Gemmill’s Bay and at the main sewage plant. Additionally improved alarming was added to indicate any future similar events. December: the plant effluent failed to met the total suspended solids concentration unusually cold temperature froze the alum feed line and prevented proper chemical dosing. (c) summary of all maintenance carried out on any major structure, equipment, apparatus,
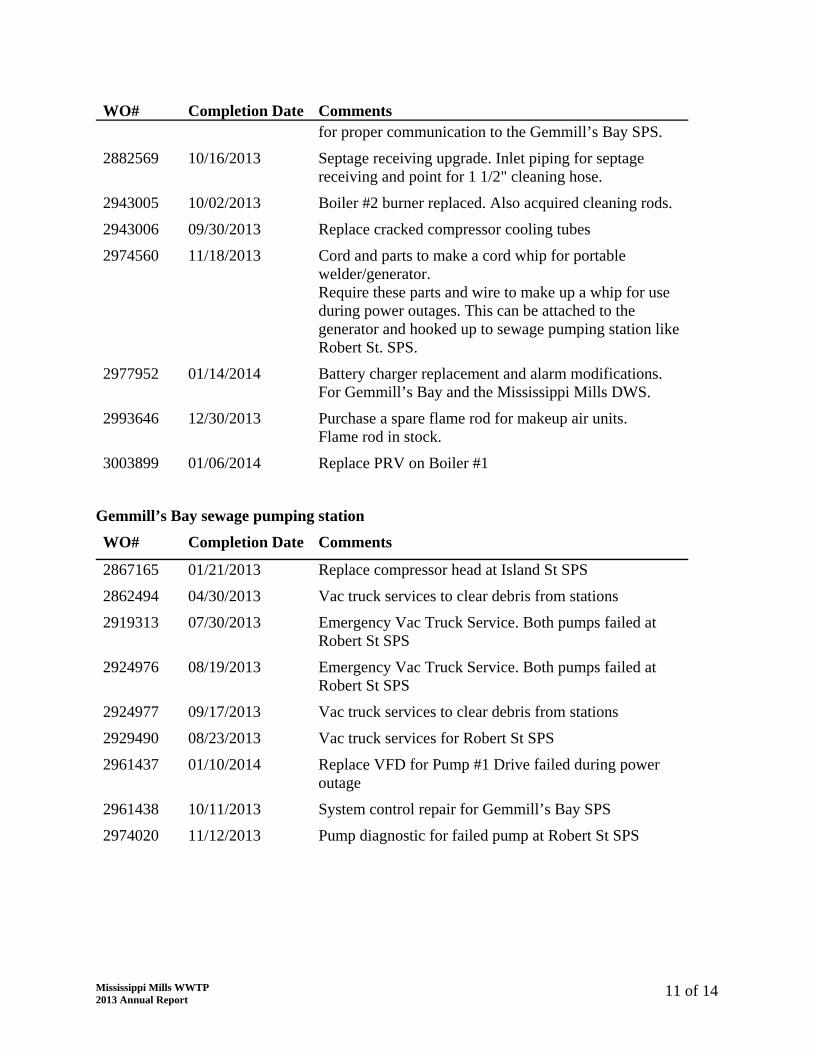
mechanism or thing forming part of the Works
Maintenance Summary OCWA: Mississippi Mills WWTP: WO# Completion Date Comments 1516678 12/18/2013 Exterior lighting at some buildings needed to be
replaced due to age. Due to age some fixtures will need to be replaced for security reasons.
2471350 01/23/2013 Confined space gas meter. Purchase of a unit on behalf of the municipality at no additional cost than the purchase price to take advantage of a multi unit order we are making for other areas and done so to seduce costs. Upon receipt, the unit will be handed over to town staff and training will be provided by supplier.
2471860 01/23/2013 Misc. hardware. Purchase of stainless steel bolts, washers and nuts to be added to stock and used/replaced as required when working on piping/valves etc at the sewage pumping stations.
2471861 01/23/2013 Purchase of replacement batteries for the PLC SCADA packs, alarm diallers and UPS`s used within the system
2471866 01/23/2013 Whitetail Ridge SPS Supply and install alarm dialer for new pumping station.
2882552 05/29/2013 SCADA control change for attenuation control. A change in the design was required for the control of the attenuation pumps. Added the ability to run on a timer cycle to ensure that plant was not overloaded.
2882558 05/29/2013 VPN switch. A new VPN switch was required to allow
Mississippi Mills WWTP 2013 Annual Report
11 of 14
WO# Completion Date Comments for proper communication to the Gemmill’s Bay SPS.
2882569 10/16/2013 Septage receiving upgrade. Inlet piping for septage receiving and point for 1 1/2" cleaning hose.
2943005 10/02/2013 Boiler #2 burner replaced. Also acquired cleaning rods.
2943006 09/30/2013 Replace cracked compressor cooling tubes
2974560 11/18/2013 Cord and parts to make a cord whip for portable welder/generator. Require these parts and wire to make up a whip for use during power outages. This can be attached to the generator and hooked up to sewage pumping station like Robert St. SPS.
2977952 01/14/2014 Battery charger replacement and alarm modifications. For Gemmill’s Bay and the Mississippi Mills DWS.
2993646 12/30/2013 Purchase a spare flame rod for makeup air units. Flame rod in stock.
3003899 01/06/2014 Replace PRV on Boiler #1
Gemmill’s Bay sewage pumping station
WO# Completion Date Comments
2867165 01/21/2013 Replace compressor head at Island St SPS
2862494 04/30/2013 Vac truck services to clear debris from stations
2919313 07/30/2013 Emergency Vac Truck Service. Both pumps failed at Robert St SPS
2924976 08/19/2013 Emergency Vac Truck Service. Both pumps failed at Robert St SPS
2924977 09/17/2013 Vac truck services to clear debris from stations
2929490 08/23/2013 Vac truck services for Robert St SPS
2961437 01/10/2014 Replace VFD for Pump #1 Drive failed during power outage
2961438 10/11/2013 System control repair for Gemmill’s Bay SPS
2974020 11/12/2013 Pump diagnostic for failed pump at Robert St SPS

Mississippi Mills WWTP 2013 Annual Report
12 of 14
Town of Mississippi Mills System Details (End of 2013)
Estimated Population Served – 5,350 2326 Residential and 287 Non Residential Accounts; Length of Distribution System – 34.80km (4.25km are new development / under
warranty); Weighted Age of System = 42.2 Years
System Maintenance and Repairs
Sewer Cleaning and CCTV work on approximately 7.2km of sanitary sewers in the Town’s north east service quadrant bound by Main Street/Ottawa Street and the Mississippi River;
Various manhole repairs on Almonte Street, Main Street and Bridge Street to address surface inflow;
Capital Investments / New Development
Initiated Sludge Characterization Work for Lagoon Sludge – Geofirma Completed Detailed Designs / MOE Approvals for Spring Street Sanitary Pump Station
Upgrade – Planned in 2014; Completed Detailed Designs / MOE Approvals for Spring Street and Clyde Street Trunk
Sewer Upgrades – Planned in 2014; April 2013 – Approximately 200m of 200mm PVC sanitary sewers on Finner Court /
Easement (Creekside Subdivision); System Planning and Administration
Feb 19/13 (Reso 63-13) – Town Council approves update to Water and Wastewater Financial Plan – Watson & Associates Economists Ltd.;
March 19/13 (Reso 102-13) - Town Council approves the 2013 Water and Sewer Budget. March 19/13 - Town Council receives the 2012 Annual Report from OCWA for the
Town’s wastewater system as per requirements of the Ontario Water Resources Act (Reso 127-13);
April 23/13 – Development Charges Bylaw is amended to include growth related water and sewer works identified within the 2012 Water and Wastewater Infrastructure Master Plan;
Dec 17/13 (Reso 438-13) – Town Completes Asset Management Plan – Includes Linear Sanitary Sewers
Dec 2013 – David Hoffmann – Wastewater Treatment Class II Renewal
Customer Requests
5 - Blocked/Partially Blocked Sewer Laterals (Private Plumbing Issue) 4 - Blocked/Partially Blocked Sewer Laterals (Public Lateral Repaired) 2 – Reports of Sewer Odour
Mississippi Mills WWTP 2013 Annual Report
13 of 14
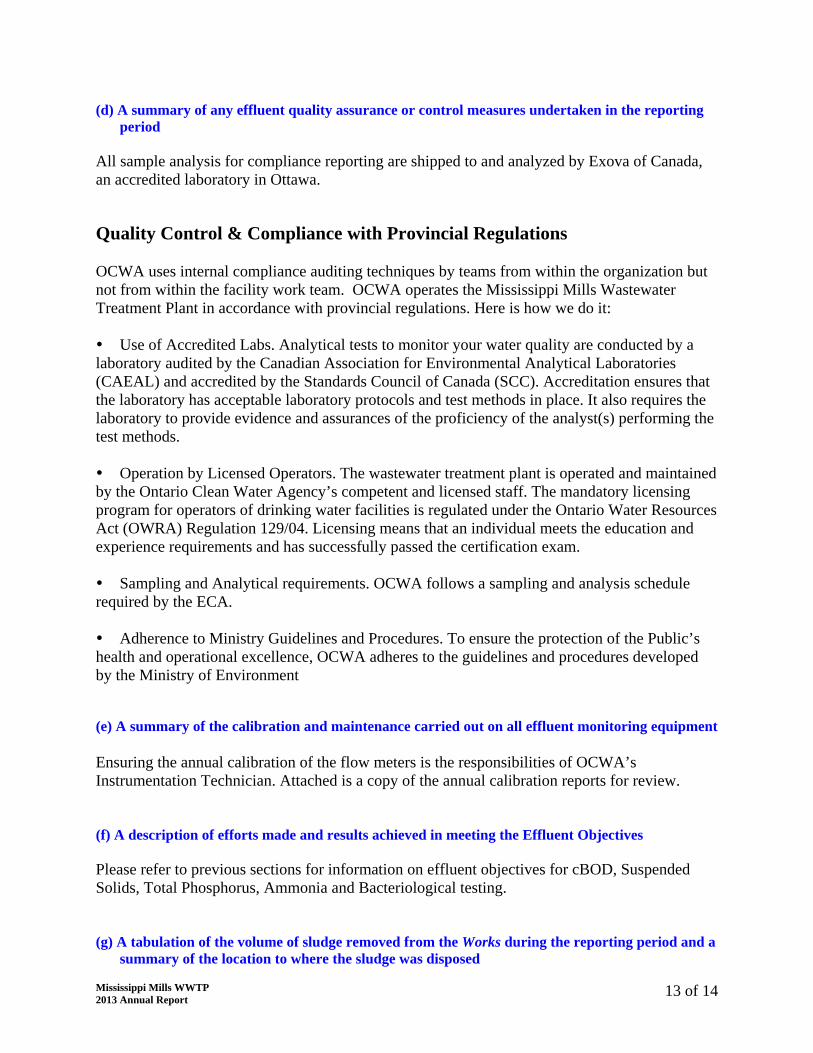
(d) A summary of any effluent quality assurance or control measures undertaken in the reporting period
All sample analysis for compliance reporting are shipped to and analyzed by Exova of Canada, an accredited laboratory in Ottawa.
Quality Control & Compliance with Provincial Regulations
OCWA uses internal compliance auditing techniques by teams from within the organization but not from within the facility work team. OCWA operates the Mississippi Mills Wastewater Treatment Plant in accordance with provincial regulations. Here is how we do it: Use of Accredited Labs. Analytical tests to monitor your water quality are conducted by a laboratory audited by the Canadian Association for Environmental Analytical Laboratories (CAEAL) and accredited by the Standards Council of Canada (SCC). Accreditation ensures that the laboratory has acceptable laboratory protocols and test methods in place. It also requires the laboratory to provide evidence and assurances of the proficiency of the analyst(s) performing the test methods. Operation by Licensed Operators. The wastewater treatment plant is operated and maintained by the Ontario Clean Water Agency’s competent and licensed staff. The mandatory licensing program for operators of drinking water facilities is regulated under the Ontario Water Resources Act (OWRA) Regulation 129/04. Licensing means that an individual meets the education and experience requirements and has successfully passed the certification exam. Sampling and Analytical requirements. OCWA follows a sampling and analysis schedule required by the ECA. Adherence to Ministry Guidelines and Procedures. To ensure the protection of the Public’s health and operational excellence, OCWA adheres to the guidelines and procedures developed by the Ministry of Environment (e) A summary of the calibration and maintenance carried out on all effluent monitoring equipment Ensuring the annual calibration of the flow meters is the responsibilities of OCWA’s Instrumentation Technician. Attached is a copy of the annual calibration reports for review. (f) A description of efforts made and results achieved in meeting the Effluent Objectives
Please refer to previous sections for information on effluent objectives for cBOD, Suspended Solids, Total Phosphorus, Ammonia and Bacteriological testing. (g) A tabulation of the volume of sludge removed from the Works during the reporting period and a
summary of the location to where the sludge was disposed

Mississippi Mills WWTP 2013 Annual Report
14 of 14
Sludge 388,000 kg of sludge were removed from the wastewater treatment facility and applied to agricultural land under the Nutrient Plan Submission ID 20811. See the attached Biosolids customized report for details regarding sample analysis. The facility is anticipating an increase in the amount of biosolids processed in 2014 as the facility is now accepting septage. (h) A summary of any complaints during the reporting period and any steps taken to address the
complaints The operating authority did not receive any complaints for the wastewater treatment system. Please refer to the Maintenance section – Town of Mississippi Mills – Customer requests for (i) A summary of all by-pass, spill or abnormal discharge events
Bypass Events: There was one (1) bypass event during this reporting period. In October approximately 205 m3 of raw wastewater was released to the Mississippi River due to equipment failure. Attached are two reports (Day and Month reports) of the bypass event. Spills – refer to previous section for sludge / bio-filter spill. Abnormal discharge: As noted previously, there were several instances where the effluent quality failed to meet the requirements of the ECA objectives and one instance of an effluent limit being exceeded. Septage Received: In June the plant started receiving septage. Between June and December 748 m3 (34 loads) of septage were received List of Attachments PARs: WWTP Performance Assessment Report Customized Report: WWTP: Effluent pH, Temperature and Unionized Ammonia Customized Report: WWTP Acute Lethality: Daphnia magna (DM) and Rainbow Trout (RBT) Meter Calibration Reports Biosolids Quality Report Bypass / Overflow Daily Report: WWTP Bypass / Overflow Month Report: WWTP END

Facility: [5678] - Mississippi Mills Wastewater[110000873] - Mississippi Mills WWTP (new)Works:
d_par_wwt_wwl_rptPage 1 of 3
Printed: 2/14/2014
From 01/01/2013 to 12/31/2013Performance Assessment Report Wastewater/Lagoon
Ontario Clean Water Agency
04/2013 05/2013 06/2013 07/2013 08/2013 09/2013 10/2013 11/201302/201301/2013 03/2013 12/2013 <-- Total --> <-- Avg. --> <-- Max. --> <-- Criteria-->
Flow:121.492 129.277 72.689 96.248 54.622 56.935 80.402 55.922 71.402 969.87883.51294.553 52.823Raw: Total Flow 1000 m3
3.919 4.309 2.345 3.208 1.762 1.837 2.68 1.804 2.38 2.6572.6943.05 1.887Raw: Avg. Day Flow 1000 m3/day
8.157 9.566 3.489 5.223 3.22 3.507 4.744 2.43 3.057 9.5663.9556.435 3.318Raw: Max. Day Flow 1000 m3/day
121.492 129.277 72.691 96.248 54.622 56.932 80.402 55.922 67.518 951.98469.50494.553 52.823Eff: Total Flow 1000 m3
3.919 4.309 2.345 3.208 1.762 1.837 2.68 1.804 2.251 2.6082.2423.05 1.887Eff: Avg. Day Flow 1000 m3/day
8.157 9.566 3.489 5.223 3.22 3.504 4.744 2.43 2.569 9.5663.1396.435 3.318Eff: Max. Day Flow 1000 m3/day
Biochemical O2 Demand:97.25 57.0 101.75 63.5 148.2 170.0 118.0 150.0 80.75 114.675 271.0124.8144.6 120.25Raw: Avg. BOD5 (mg/L)
4.0 5.0 4.0 4.0 5.0 4.0 4.0 5.0 4.0 53.05.05.0 4.0Raw: Number of Samples BOD5
1.25< 2.8< 1.25< 1.0< 1.4< 3.0< 1.0< 1.0< 1.5 1.492 9.0 0<< 1.21.0 1.5Eff: Avg. BOD5 (mg/L) << <
4.0 5.0 4.0 4.0 5.0 4.0 4.0 5.0 4.0 53.05.05.0 4.0Eff: Number of Samples BOD5
4.899< 12.066< 2.931< 3.208< 2.467< 5.51< 2.68< 1.804< 3.376 3.959 12.066<< 2.693.05 2.83BOD Loading (kg/d) << <
98.715< 95.088< 98.771< 98.425< 99.055< 98.235< 99.153< 99.333< 98.142 99.333<< 99.03899.308 98.753BOD5 Percent Removal <<
Carbonaceous Biochemical Oxygen Demand:84.0 51.6 71.5 36.75 129.4 130.75 74.25 108.0 70.75 89.396 175.0104.0108.0 103.75Raw: Avg. CBOD5 (mg/L)
4.0 5.0 4.0 4.0 5.0 4.0 4.0 5.0 4.0 53.05.05.0 4.0Raw: Number of Samples CBOD5
1.25< 1.8< 1.0< 1.25< 1.4< 2.75< 1.25< 1.0< 1.25 1.421 8.0 25.0<< 1.21.4 1.5Eff: Avg. CBOD5 (mg/L) << <
4.0 5.0 4.0 4.0 5.0 4.0 4.0 5.0 4.0 53.05.05.0 4.0Eff: Number of Samples CBOD5
4.899< 7.757< 2.345< 4.01< 2.467< 5.05< 3.35< 1.804< 2.813 3.69 7.757 117.5<< 2.694.27 2.83CBOD5 Loading (kg/d) << <
98.512< 96.512< 98.601< 96.599< 98.918< 97.897< 98.316< 99.074< 98.233 99.074<< 98.84698.704 98.554CBOD5 Percent Removal <<
Suspended Solids:125.0 102.0 157.25 269.0 210.2 161.25 310.5 296.2 119.25 194.417 791.0168.8249.8 163.75Raw: Avg. SS (mg/L)
4.0 5.0 4.0 4.0 5.0 4.0 4.0 5.0 4.0 53.05.05.0 4.0Raw: Number of Samples SS
1. The Total, Average, Max and Criteria summaries are not included in the wastewater XML files submitted to the MOE.Note:2. The annual average concentrations are calculated by taking the arithmatic mean of the monthly average concentration in the effluent calculated for any particular calendar year.
Tag group:
Legend:
EFF-Effluent,RAW-Raw Sewage
Total Phosphorus - Phosphorus, Unfiltered TotalOCWA PDC - MEWS
TKN - Nitrogen,Total Kjeldahl Unf. Tot; Nitrate as N - Nitrate, Unfiltered Reactive; Nitrite as N - Nitrite, Unfiltered Reactive; E coli - Escherichia Coli MFCBOD5 - Carbonaceous Biochemical Oxygen Demand 5 Day; BOD5 - Biochemical Oxygen Demand, 5 Day, Total Demand; Suspended Solids - Residue, Particulate; NH3 + NH4 as N - Ammonium + Ammonia, Total Unfil. Reac. ;
Parameters List:
Facility: [5678] - Mississippi Mills Wastewater[110000873] - Mississippi Mills WWTP (new)Works:
d_par_wwt_wwl_rptPage 2 of 3
Printed: 2/14/2014
From 01/01/2013 to 12/31/2013Performance Assessment Report Wastewater/Lagoon
Ontario Clean Water Agency
04/2013 05/2013 06/2013 07/2013 08/2013 09/2013 10/2013 11/201302/201301/2013 03/2013 12/2013 <-- Total --> <-- Avg. --> <-- Max. --> <-- Criteria-->
Suspended Solids:5.0 6.4< 3.25< 3.75< 11.0< 8.0 4.0 5.0< 8.25 6.446 42.0 15.0<< 18.02.2 2.5Eff: Avg. SS (mg/L) <
4.0 5.0 4.0 4.0 5.0 4.0 4.0 5.0 4.0 53.05.05.0 4.0Eff: Number of Samples SS
19.596 27.579< 7.621< 12.031< 19.382< 14.692 10.72 9.02< 18.567 15.916 40.357 70.5<< 40.3576.71 4.716SS Loading (kg/d) <
96.0 93.725< 97.933< 98.606< 94.767< 95.039 98.712 98.312< 93.082 99.119<< 89.33699.119 98.473SS Percent Removal
Phosphorus:2.878 1.882 3.093 4.693 5.288 6.548 6.89 6.718 2.818 4.53 19.43.6966.106 3.75Raw: Avg. Phos (mg/L)
4.0 5.0 4.0 4.0 5.0 4.0 4.0 5.0 4.0 53.05.05.0 4.0Raw: Number of Samples Phos
0.218 0.168 0.22 0.168 0.07 0.1 0.065 0.082 0.093 0.133 0.38 0.30.1760.088 0.15Eff: Avg. Phos (mg/L)
4.0 5.0 4.0 4.0 5.0 4.0 4.0 5.0 4.0 53.05.05.0 4.0Eff: Number of Samples Phos
0.852 0.724 0.516 0.537 0.123 0.184 0.174 0.148 0.208 0.368 0.852 0.940.3950.268 0.283Phos. Loading (kg/d)
92.441 91.073 92.886 96.43 98.676 98.473 99.057 98.779 96.717 99.05795.23898.559 96.0Total Phos Percent Removal
Nitrogen Series:14.428 11.08 14.5 12.04 24.58 24.35 16.825 21.84 17.775 18.406 36.720.6221.858 20.975Raw: Avg. NH3 + NH4 (mg/L)
4.0 5.0 4.0 4.0 5.0 4.0 4.0 5.0 4.0 53.05.05.0 4.0Raw: Number of Samples NH3 + NH4
0.028< 0.02< 0.078 0.02< 0.02< 0.02< 0.02< 0.02< 0.02 0.026 0.12 15.0<< 0.020.02 0.023Eff: Avg. NH3 + NH4 (mg/L) << <
4.0 5.0 4.0 4.0 5.0 4.0 4.0 5.0 4.0 55.05.07.0 4.0Eff: Number of Samples NH3 + NH4
0.108< 0.086< 0.182 0.064< 0.035< 0.037< 0.054< 0.036< 0.045 0.066 0.182 23.5<< 0.0450.061 0.042NH3 + NH4 Loading (kg/d) << <
30.925 16.22 20.95 23.99 38.24 38.2 29.825 36.88 25.9 29.718 63.629.3633.52 32.6Raw: Avg. TKN (mg/L)
4.0 5.0 4.0 4.0 5.0 4.0 4.0 5.0 4.0 53.05.05.0 4.0Raw: # of SamplesTKN
26.2 26.2 026.2Eff: Avg. Nitrate (mg/L)
1.01.0Eff: Number of Samples Nitrate
0.1 0.1 0< 0.1Eff: Avg. Nitrite (mg/L) < <
1.01.0Eff: Number of Samples Nitrite
1. The Total, Average, Max and Criteria summaries are not included in the wastewater XML files submitted to the MOE.Note:2. The annual average concentrations are calculated by taking the arithmatic mean of the monthly average concentration in the effluent calculated for any particular calendar year.
Tag group:
Legend:
EFF-Effluent,RAW-Raw Sewage
Total Phosphorus - Phosphorus, Unfiltered TotalOCWA PDC - MEWS
TKN - Nitrogen,Total Kjeldahl Unf. Tot; Nitrate as N - Nitrate, Unfiltered Reactive; Nitrite as N - Nitrite, Unfiltered Reactive; E coli - Escherichia Coli MFCBOD5 - Carbonaceous Biochemical Oxygen Demand 5 Day; BOD5 - Biochemical Oxygen Demand, 5 Day, Total Demand; Suspended Solids - Residue, Particulate; NH3 + NH4 as N - Ammonium + Ammonia, Total Unfil. Reac. ;
Parameters List:
Facility: [5678] - Mississippi Mills Wastewater[110000873] - Mississippi Mills WWTP (new)Works:
d_par_wwt_wwl_rptPage 3 of 3
Printed: 2/14/2014
From 01/01/2013 to 12/31/2013Performance Assessment Report Wastewater/Lagoon
Ontario Clean Water Agency
04/2013 05/2013 06/2013 07/2013 08/2013 09/2013 10/2013 11/201302/201301/2013 03/2013 12/2013 <-- Total --> <-- Avg. --> <-- Max. --> <-- Criteria-->
Disinfection:10.0< 10.0< 10.0< 6.687< 10.0< 10.0< 10.0< 10.0< 10.0 9.701 10.0 200.0<< 10.010.0 10.0Eff: Geometric Mean E. Coli per 100 ml << < <
4.0 5.0 4.0 4.0 5.0 4.0 4.0 5.0 4.0 5.05.0 4.0Eff: Number of Samples E. Coli per 100 ml
1. The Total, Average, Max and Criteria summaries are not included in the wastewater XML files submitted to the MOE.Note:2. The annual average concentrations are calculated by taking the arithmatic mean of the monthly average concentration in the effluent calculated for any particular calendar year.
Tag group:
Legend:
EFF-Effluent,RAW-Raw Sewage
Total Phosphorus - Phosphorus, Unfiltered TotalOCWA PDC - MEWS
TKN - Nitrogen,Total Kjeldahl Unf. Tot; Nitrate as N - Nitrate, Unfiltered Reactive; Nitrite as N - Nitrite, Unfiltered Reactive; E coli - Escherichia Coli MFCBOD5 - Carbonaceous Biochemical Oxygen Demand 5 Day; BOD5 - Biochemical Oxygen Demand, 5 Day, Total Demand; Suspended Solids - Residue, Particulate; NH3 + NH4 as N - Ammonium + Ammonia, Total Unfil. Reac. ;
Parameters List:
Ontario Clean Water Agency
Municipality:Facility:
Monthly Process Data Report
Works:Classification:Receiver:
Class 3 Wastewater TreatmentMississippi River
Town of Almonte[5678] - Mississippi Mills Wastewater[110000873] - Mississippi Mills WWTP (new)
Period:Serviced Population:Total Design Capacity(m³/day): 0
4,91012/31/201301/01/2013 to
Printed on: 2/14/2014Page 1 of 1
d_monthlyprocessrep
Sep/2013 Oct/2013 Nov/2013Mar/2013 Apr/2013 Dec/2013May/2013 Jun/2013 Jul/2013 Aug/2013Feb/2013 <-- Summary -->Jan/2013
Final Effluent\Effluent - EffluentUn-ionized Ammonia (NH3) (mg/L)
Cnt 4.0 2.0 5.0 4.0 4.0 5.0 4.0 4.0 5.0 4.06.0 5.0 52.0
Max 0.0 0.0 0.0 0.002 0.0 0.0 0.0 0.001 0.001 0.0010.0 0.0 0.002
Min 0.0 0.0 0.0 0.0 0.0 0.0 0.0 0.0 0.0 0.00.0 0.0 0.0
pHCnt 15.0 15.0 16.0 15.0 13.0 16.0 18.0 16.0 22.0 16.016.0 16.0 194.0
Max 7.83 7.81 7.83 7.87 7.63 7.63 7.79 8.18 8.22 8.117.69 7.63 8.22
Min 7.56 7.45 7.61 7.42 7.26 7.02 7.38 7.76 7.43 7.497.47 6.99 6.99
Temperature (C)Cnt 15.0 15.0 16.0 15.0 12.0 16.0 18.0 16.0 22.0 16.016.0 16.0 193.0
Max 10.2 10.8 12.3 17.3 19.1 22.0 22.8 19.0 17.8 14.610.8 11.6 22.8
Min 6.2 6.8 7.0 12.2 14.5 17.0 19.5 16.0 13.5 9.76.1 8.1 6.1
? Calculation not verifiable. At least one result reported as < and at least one result reported >.Note:
Ontario Clean Water Agency
Municipality:Facility:
Monthly Process Data Report
Works:Classification:Receiver:
Class 3 Wastewater TreatmentMississippi River
Town of Almonte[5678] - Mississippi Mills Wastewater[110000873] - Mississippi Mills WWTP (new)
Period:Serviced Population:Total Design Capacity(m³/day): 0
4,91012/31/201301/01/2013 to
Printed on: 2/14/2014Page 1 of 1
d_monthlyprocessrep
Sep/2013 Oct/2013 Nov/2013Mar/2013 Apr/2013 Dec/2013May/2013 Jun/2013 Jul/2013 Aug/2013Feb/2013 <-- Summary -->Jan/2013
Final Effluent\Effluent - EffluentDM (%mortality @100% effl. conc)
Max 0 0 00 0
Min 0 0 00 0
RBT (% Mortality @ 100% eff)Max 0 0 020.0 20.0
Min 0 0 020.0 0
? Calculation not verifiable. At least one result reported as < and at least one result reported >.Note:

Ottawa Valley Hub
122 Patterson Crescent
Calibration / Inspection Check Carleton Place, ON, K7C 4P3
Tel: 613 257 4990 Fax:613 257 5727
Project: MISSISSIPPI MILLS WWTP Description METER FLOW LAGOON EFFLUENTProject: MISSISSIPPI MILLS WWTP Description METER FLOW LAGOON EFFLUENT
Equipment ID: 0000190024 Make: MILL Technician: Tom K.
Model# : OCMIII Type: Parshall Flume
Serial# : 31955459 Project Org.: 5678 Signature: _
INT.DIA: 12 " Work Order Ref.: _
Cal. FS: _ liter/s Range: 0-21554.57 m^3/d Date: 10/4/2013
Customer FS: _ liter/s Sensor Factors: _
No. V. Setting (m/sec) P(psi)Head (cm) Head (m/w.c)
Flow (m^3/D)
CAL. Standard
Display Before
Display After
Display error (%)
O/P. Theo (mAdc)
O/P. Before CAL.(mAdc)
O/P. After CAL.(mAdc)
O/P Bef. %Err (%F.S)
O/P Aft. %Err (%F.S)
1 0.00 0.00 ##### 4.00 4.00 4.00 0.00% 0.00%
2 20.92 5388 ##### 8.00 8.06 8.06 0.38% 0.38%2 20.92 5388 ##### 8.00 8.06 8.06 0.38% 0.38%
3 32.98 10777 ##### 12.00 12.08 12.08 0.50% 0.50%
4 43.05 16165 ##### 16.00 16.25 16.25 1.56% 1.56%
5 51.20 21554 ##### 20.00 20.06 20.06 0.37% 0.37%
Calibration Characteristic
0 00%
0.50%
1.00%
1.50%
2.00%
rro
r
Calibration Characteristic
O/P Aft. %Err (%F.S)
O/P Bef. %Err (%F.S)
-2.00%
-1.50%
-1.00%
-0.50%
0.00%
0.50%
0% 25% 50% 75% 100%
% E
rro
r
O/P Bef. %Err (%F.S)
Display error (%)
Comments:
-2.00%
-1.50%
0% 25% 50% 75% 100%
Output, Display (% F.S)

Ontario Clean Water Agency
Municipality:Facility:
Monthly Process Data Report
Works:Classification:Receiver:
Class 3 Wastewater TreatmentMississippi River
Town of Almonte[5678] - Mississippi Mills Wastewater[110000873] - Mississippi Mills WWTP (new)
Period:Serviced Population:Total Design Capacity(m³/day): 0
4,91012/31/201301/01/2013 to
Printed on: 2/8/2014Page 1 of 2
d_monthlyprocessrep
Sep/2013 Oct/2013 Nov/2013Mar/2013 Apr/2013 Dec/2013May/2013 Jun/2013 Jul/2013 Aug/2013Feb/2013 <-- Summary -->Jan/2013
Biosolids Utilization\Thickening - Dewatered Sludge CakeHauled Mass Off Site (kg)
Cnt 2.0 2.0
Sum 388,000.0 388,000.0
Biosolids Utilization\Biosolids quality - Dewatered - Dewatered Sludge CakeTotal Solids
Avg 166,000.0 164,500.0 106,333.333 175,000.0 183,000.0 183,500.0 174,666.667 179,500.0 112,666.667 155,900.0
Cnt 1.0 2.0 3.0 2.0 2.0 2.0 3.0 2.0 3.0 20.0
Total Volatile SolidsAvg 91,500.0 90,200.0 58,200.0 93,100.0 95,650.0 98,900.0 90,300.0 96,250.0 62,200.0 83,590.0
Cnt 1.0 2.0 3.0 2.0 2.0 2.0 3.0 2.0 3.0 20.0
Total Phosphorus (ug/g)Avg 35,200.0 38,450.0 33,600.0 33,500.0 27,850.0 34,650.0 21,770.0 33,100.0 31,350.0 31,417.222
Cnt 1.0 2.0 2.0 2.0 2.0 2.0 3.0 2.0 2.0 18.0
pHAvg 6.25 6.655 6.94 7.01 6.985 6.955 7.127 6.99 6.91 6.918
Cnt 1.0 2.0 2.0 2.0 2.0 2.0 3.0 2.0 2.0 18.0
Moisture (%)Avg 83.5 83.6 44.0 81.5 81.025 81.875 82.517 83.8 83.775 79.743
Cnt 1.0 1.0 2.0 3.0 4.0 4.0 6.0 3.0 4.0 28.0
E Coli (cfu/g)Avg < < < < < <61.0 61.0 1,250.0 89.667 133.25 270.75 65.5 60.0 < 182.5 < 207.5
Cnt 1.0 1.0 2.0 3.0 4.0 4.0 6.0 3.0 4.0 28.0
Aluminum, Al (ug/g)Avg 81,700.0 80,300.0 77,900.0 74,400.0 75,050.0 45,945.0 78,766.667 77,650.0 78,750.0 74,332.778
Cnt 1.0 2.0 2.0 2.0 2.0 2.0 3.0 2.0 2.0 18.0
Arsenic, As (ug/g)Avg 3.0 3.0 2.0 2.5 2.5 2.5 2.0 2.0 2.0 2.333
Cnt 1.0 2.0 2.0 2.0 2.0 2.0 3.0 2.0 2.0 18.0
Cadmium, Cd (ug/g)Avg 1.6 1.65 1.25 1.2 1.0 1.3 1.533 1.15 1.05 1.3
Cnt 1.0 2.0 2.0 2.0 2.0 2.0 3.0 2.0 2.0 18.0
Cobalt, Co (ug/g)Avg 2.0 2.5 2.5 2.5 2.0 3.0 2.0 2.5 2.0 2.333
Cnt 1.0 2.0 2.0 2.0 2.0 2.0 3.0 2.0 2.0 18.0

Ontario Clean Water Agency
Municipality:Facility:
Monthly Process Data Report
Works:Classification:Receiver:
Class 3 Wastewater TreatmentMississippi River
Town of Almonte[5678] - Mississippi Mills Wastewater[110000873] - Mississippi Mills WWTP (new)
Period:Serviced Population:Total Design Capacity(m³/day): 0
4,91012/31/201301/01/2013 to
Printed on: 2/8/2014Page 2 of 2
d_monthlyprocessrep
Sep/2013 Oct/2013 Nov/2013Mar/2013 Apr/2013 Dec/2013May/2013 Jun/2013 Jul/2013 Aug/2013Feb/2013 <-- Summary -->Jan/2013
Biosolids Utilization\Biosolids quality - Dewatered - Dewatered Sludge CakeCopper, Cu (ug/g)
Avg 511.0 599.5 474.0 480.5 481.0 515.5 477.667 488.5 457.5 496.5
Cnt 1.0 2.0 2.0 2.0 2.0 2.0 3.0 2.0 2.0 18.0
Chromium, Cr (ug/g)Avg 14.0 16.5 15.5 17.0 17.0 22.5 17.667 19.0 17.0 17.556
Cnt 1.0 2.0 2.0 2.0 2.0 2.0 3.0 2.0 2.0 18.0
Potassium, K (ug/g)Avg 900.0 1,050.0 1,050.0 900.0 1,100.0 1,150.0 1,066.667 800.0 900.0 1,000.0
Cnt 1.0 2.0 2.0 2.0 2.0 2.0 3.0 2.0 2.0 18.0
Molybdenum, Mo (ug/g)Avg 4.0 4.5 3.5 3.0 3.0 4.0 3.0 3.0 3.5 3.444
Cnt 1.0 2.0 2.0 2.0 2.0 2.0 3.0 2.0 2.0 18.0
Sodium, Na (ug/g)Avg 1,400.0 1,850.0 1,800.0 1,550.0 1,300.0 1,600.0 1,406.667 1,250.0 1,300.0 1,495.556
Cnt 1.0 2.0 2.0 2.0 2.0 2.0 3.0 2.0 2.0 18.0
Nickel, Ni (ug/g)Avg 15.0 18.5 16.0 15.5 15.5 18.0 14.333 14.0 13.5 15.556
Cnt 1.0 2.0 2.0 2.0 2.0 2.0 3.0 2.0 2.0 18.0
Lead, Pb (ug/g)Avg 19.0 19.5 18.0 18.5 18.0 22.0 19.0 18.5 15.0 18.611
Cnt 1.0 2.0 2.0 2.0 2.0 2.0 3.0 2.0 2.0 18.0
Mercury, Hg (ug/g)Avg 0.4 0.4 0.4 0.5 0.4 0.45 0.4 0.5 0.45 0.433
Cnt 1.0 2.0 2.0 2.0 2.0 2.0 3.0 2.0 2.0 18.0
Selenium, Se (ug/g)Avg 3.0 3.5 2.5 3.0 3.0 3.0 3.0 2.5 2.5 2.889
Cnt 1.0 2.0 2.0 2.0 2.0 2.0 3.0 2.0 2.0 18.0
Zinc, Zn (ug/g)Avg 530.0 578.5 468.5 472.0 510.0 570.5 494.333 517.5 483.5 511.889
Cnt 1.0 2.0 2.0 2.0 2.0 2.0 3.0 2.0 2.0 18.0
? Calculation not verifiable. At least one result reported as < and at least one result reported >.Note:
Ontario Clean Water AgencyRecording of Bypassing Daily Report
Facility:
Year:Works:
2013
Page 1 of 12/8/2014
[5678] - Mississippi Mills Wastewater[110000873] - Mississippi Mills WWTP (new)
d_bpr_daily
Date Location Type StationStart Time
(hh:mm) HoursVolume
m3 Disinfect ReasonDuration BOD5
(mg/L) (mg/L) (# / 100mL)TP E.ColiSS
(mg/L)
10/20/2013 SPS PRBYPrimary 02:58 3.0 Yes Equipment Failure205.00 14.00 9.00 0.62 390,000
Primary Effluent - The discharge of raw sewage subject to no treatment except grit removal and/or chlorination.
Legend:Station:
Definitions:
Secondary Effluent - The discharge of sewage that has undergone solids removal and bypassed the secondary treatment process.
PRBY - Overflow: Gemmills Bay SPS

2013
Facility:Works:Year:
[110000873] - Mississippi Mills WWTP (new)[5678] - Mississippi Mills Wastewater
Primary Bypass >>> <<< Secondary Bypass >>> <<< Tertiary Bypasses >>><<<
d_bpr_monthly2/8/2014
Page 1 of 1
Recording of ByPassing Monthly ReportOntario Clean Water Agency
# of Events Duration (hours) Volume (m³) # of Events Duration (hours) # of Events Duration (hours) Volume (m³)Volume (m³)Month
JAN
FEB
MAR
APR
MAY
JUN
JUL
AUG
SEP
1 3.0 205.00OCT
NOV
DEC
1 3.0 205.00Total:
0.02Volume of bypass as %of Average Flow
%
2,657.20
% = (Volume of Bypass/365)/Average Daily Flow*100
Average Daily Flow: