Embed Size (px)
Citation preview
1
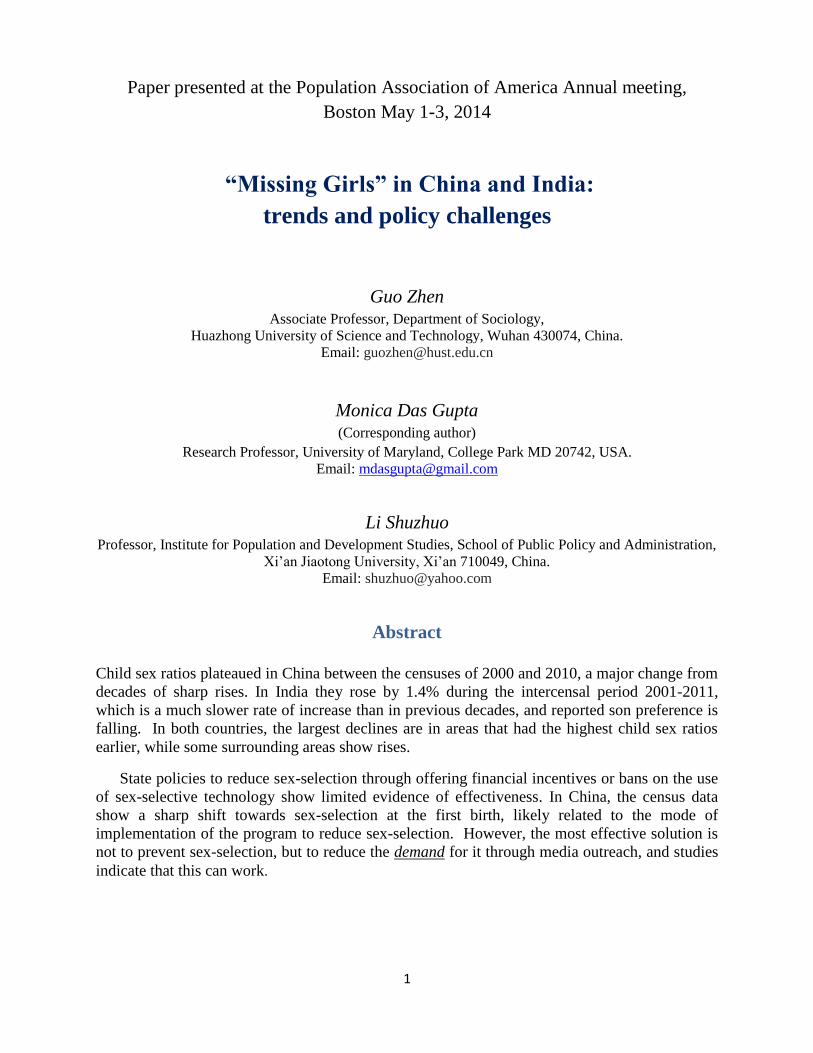
Paper presented at the Population Association of America Annual meeting,
Boston May 1-3, 2014
“Missing Girls” in China and India:
trends and policy challenges
Guo Zhen Associate Professor, Department of Sociology,
Huazhong University of Science and Technology, Wuhan 430074, China.
Email: [email protected]
Monica Das Gupta (Corresponding author)
Research Professor, University of Maryland, College Park MD 20742, USA.
Email: [email protected]
Li Shuzhuo Professor, Institute for Population and Development Studies, School of Public Policy and Administration,
Xi’an Jiaotong University, Xi’an 710049, China.
Email: [email protected]
Abstract
Child sex ratios plateaued in China between the censuses of 2000 and 2010, a major change from
decades of sharp rises. In India they rose by 1.4% during the intercensal period 2001-2011,
which is a much slower rate of increase than in previous decades, and reported son preference is
falling. In both countries, the largest declines are in areas that had the highest child sex ratios
earlier, while some surrounding areas show rises.
State policies to reduce sex-selection through offering financial incentives or bans on the use
of sex-selective technology show limited evidence of effectiveness. In China, the census data
show a sharp shift towards sex-selection at the first birth, likely related to the mode of
implementation of the program to reduce sex-selection. However, the most effective solution is
not to prevent sex-selection, but to reduce the demand for it through media outreach, and studies
indicate that this can work.
1
1. Introduction
Sex-selection to raise sons rather than daughters has attracted much attention because it is one of
the most striking manifestations of gender inequality. The phenomenon raises especial concern
in China and India, since with their huge populations they account for the overwhelming
majority of “missing girls”, and face potential social problems arising from having large numbers
of young men with little prospect of finding a bride. The scale of the problem makes it important
to examine the trends in sex-selection in these two countries, and what impact state policies have
had in mitigating it.
In studies done before the censuses of 2010 in China and 2011 in India, some argued that
sex-selection may be trending downwards in these countries (Das Gupta et al 2009, Guilmoto
2009). The new census data analyzed in Section 2 confirm that child sex ratios in China have
turned around from a rapid rise to a small decline, and a sharp decline in the Northwestern states
of Punjab and Haryana, which have been huge outliers in India in levels of sex-selection for over
a century. For India overall, the child sex ratios are still rising, though at a considerably slower
pace than before.
Both countries have sought to ban prenatal sex determination and/or sex-selective abortion,
offer incentives to parents to raise girls, and conduct advocacy to reduce son preference. There
are only a few rigorous evaluations of these programs, largely because of data limitations.
Section 3 summarizes the approaches used in the two countries, and the available evidence on
their impact. Studies in India indicate at most a modest impact of the financial incentives and
perhaps also the ban, but show a clear impact of media exposure in reducing son preference. For
China, the census data show that the mode of implementation of the ban on sex-selection has had
a strong impact on patterns of sex-selection. Section 4 concludes.
2. Trends in “missing girls” in China and India during the 2000s
This analysis focuses largely on trends in child sex ratios, rather than on sex ratios at birth, for
two reasons. First, child sex ratios reflect both prenatal as well as postnatal sex-selection which
was high earlier in both countries and persists today. Second, in both countries the data on child
sex ratios are much more robust than those on sex ratios at birth, as discussed in the Appendix.
2.1 Trends in China
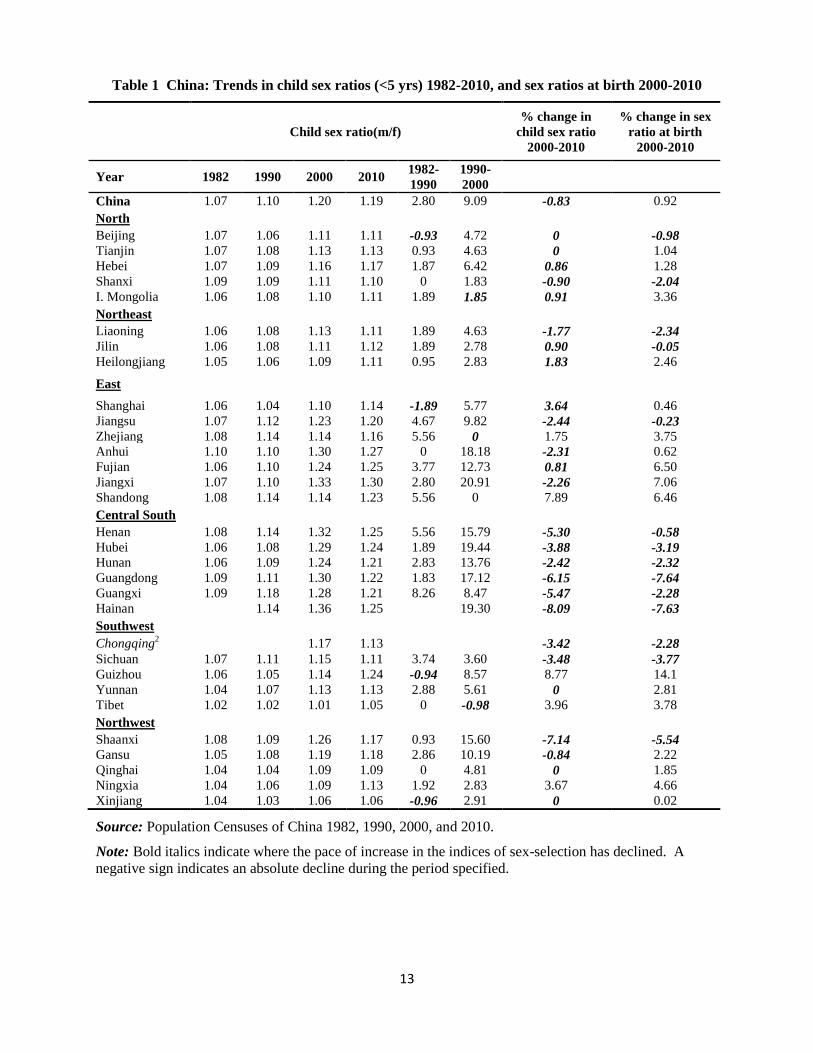
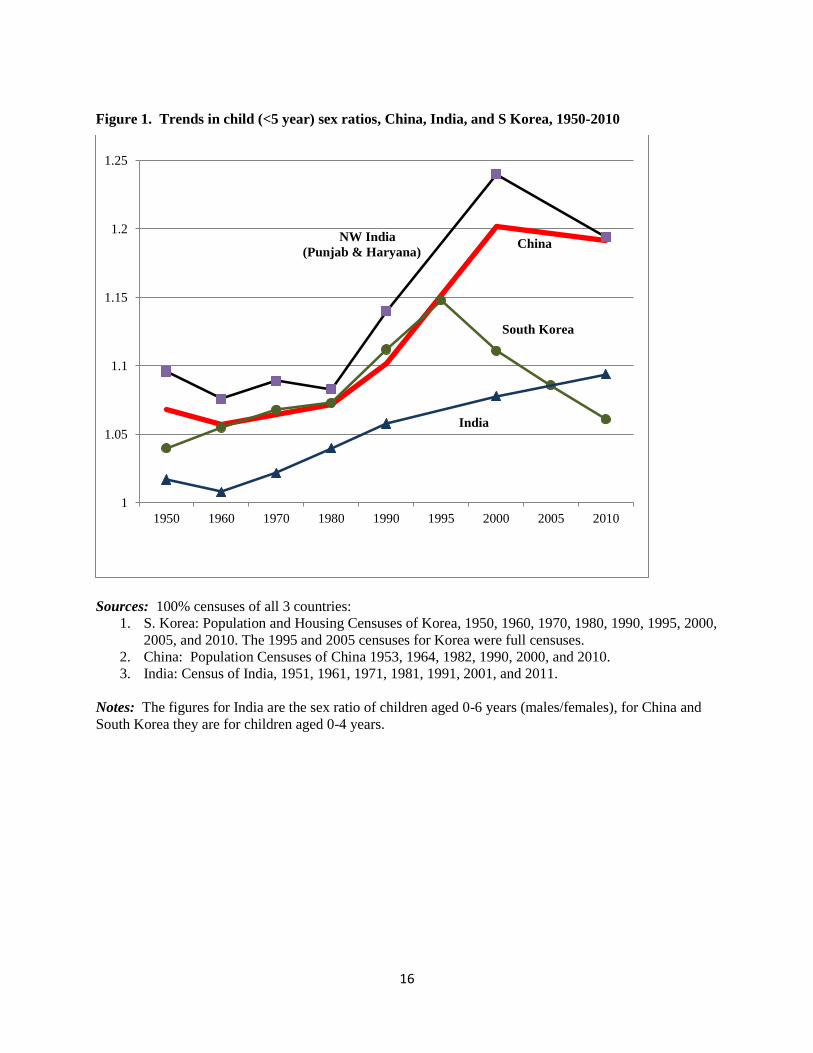
In China, child sex ratios plateaued between 2000 and 2010, with a decline of 0.8% (Table 1,
Figure 1). There has been a decline in sex-selection in all provinces in the Central South region
that comprised 28% of China's population in 2010, and in other provinces that comprised another
31% of the population. The latter include parts of the Southwest region (Chongqing, Sichuan),
the East (Anhui, Jiangsu and Jiangxi), Shaanxi and Gansu in the Northwest, Liaoning in the
Northeast, and Shanxi in the North.
In most of the other provinces, child sex ratios have continued to rise during the 2000s, but
more slowly than in the 1990s. Only in a few provinces (Shandong, Guizhou, Ningxia and
Zhejiang) has the rate of increase in child sex ratios increased during the 2000s.1
1 It has also risen in Tibet, but the ratios there are very low.
2
For the most part, it is those provinces that showed the most masculine child sex ratios in the
earlier censuses, which have shown a decline in these ratios. Provinces which had earlier shown
less elevated child sex ratios show a continuing rise, but in most cases at a reduced pace of
increase.
The census data show a small rise in sex ratios at birth between 2000 and 2010,2 while the
child sex ratios show a decline. This discrepancy is at least partly explained by the fact that
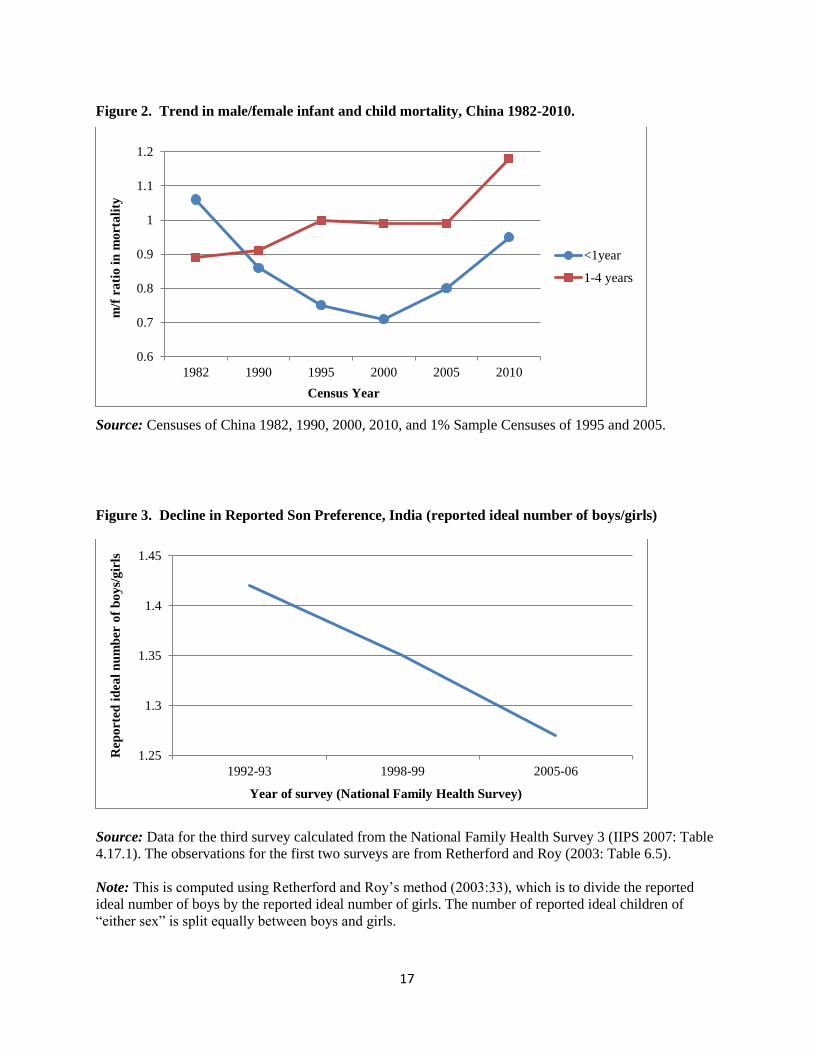
excess female postnatal mortality declined sharply between 2000 and 2010 (Figure 2), making
for larger numbers of surviving girls.
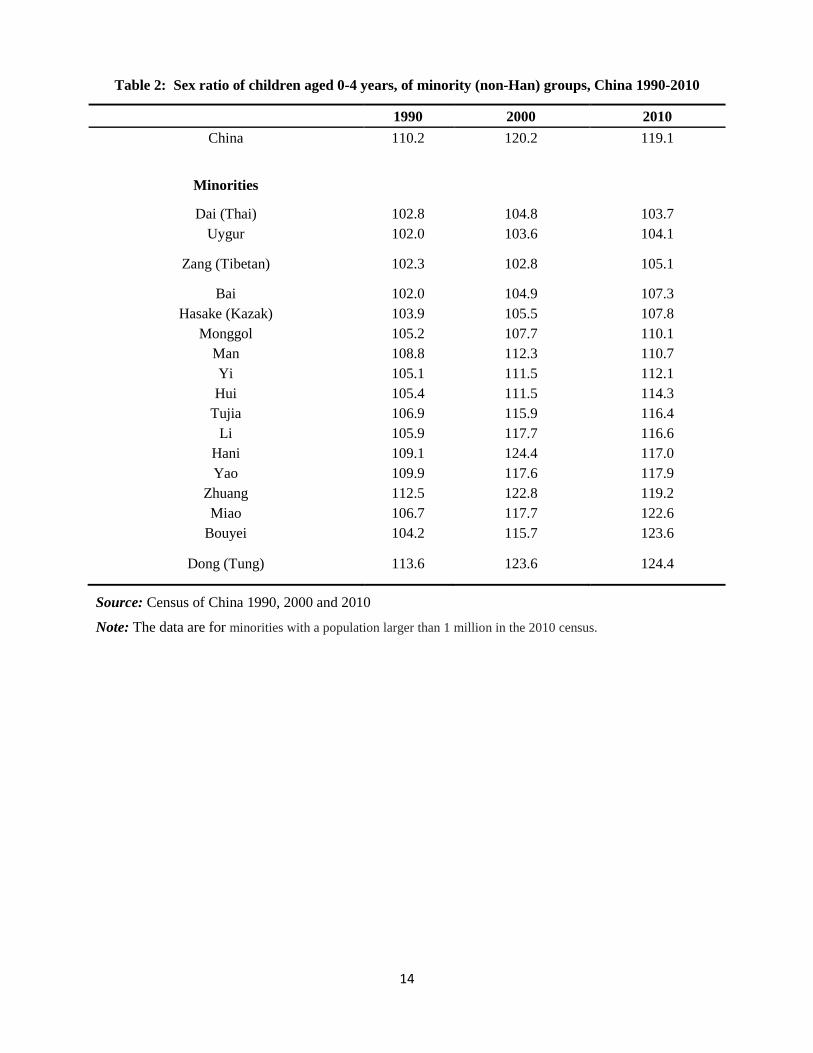
Several ethnic minority groups living in the peripheral regions of the Southwest and
Northwest show much lower child sex ratios, especially those living in Yunnan, Xinjiang, and
Tibet (Table 2). By contrast, several ethnic minorities living elsewhere, such as Guizhou
province, show patterns close to the majority Han population.
2.2 Trends in India
In India overall, child sex ratios continued to rise between 2001 and 2011, but at a notably
slower pace than in previous decades (Table 3). There is a sharp downward trend in child sex
ratios during 2001-2011 in the Northwestern states of Punjab and Haryana (Figure 1) --- the
states which have had by far the highest sex ratios since the censuses of the late nineteenth
century, and the only states in India that had child sex ratios comparable to the national averages
for China.
Most of the Northwestern region shows absolute declines in child sex ratios during 2001-
2011, while Delhi showed a leveling off (Table 3). This is despite the fact that Total Fertility has
declined to 2.3 in Haryana in 2011, and to below replacement levels in the rest of the region
(Registrar-General of India 2011d: Statement 25).3
The Western region also shows improvements. Gujarat shows an absolute decline in child
sex ratios, while Maharashtra shows a decline in the pace of increase in these ratios. This is
important, since both these states had reached high sex ratios. Moreover, these states have fairly
low fertility (Figure 3), so will be subject to less pressure to sex-select. Rajasthan is a notable
exception, with an accelerating pace of increase. In the North-Central region, Uttar Pradesh and
Madhya Pradesh show an accelerating pace of increase in child sex ratios during 2001-11.
Uttar Pradesh, Madhya Pradesh and Rajasthan account for over 28% of the population of
India in 2011, and contribute much to the overall rise in child sex ratios at national level.
Fortunately, censuses over the past century show that their sex ratios were far lower than Punjab
and Haryana, implying lower underlying son preference. Nevertheless, there is real potential for
levels of sex-selection to rise further in these states, as their fertility levels are still far higher than
other states. In 2011, Total Fertility in Uttar Pradesh was 3.4, and around 3.0 in Madhya Pradesh
and Rajasthan (Registrar-General of India 2011d: Statement 25). Even at these high fertility
2 The “short form” records a sex ratio at birth of 116.9 in 2000 and 117.9 in 2010, while the “long form”
administered to 10% of the population records 119.9 for 2000 and 121.2 for 2010.
3 The data for Jammu & Kashmir in 2011 are clearly out of line with past trends (Table 3), and analysis by the
Registrar-General’s office indicates that this is due to under-enumeration of girls in the districts that fall in
Kashmir (Registrar-General of India 2011a) --- possibly because the political conditions there hindered accurate
enumeration.
3
levels, their child sex ratios are significantly elevated (Figure 3), and with continuing fertility
decline the pressure to sex-select could rise. Bihar could potentially show similar changes. Given
their huge populations, these states could generate a rise in overall child sex ratios in India over
the coming decade.
In the rest of India, child sex ratios are lower (Table 3, Figure 3). It is especially striking that
these ratios are low across the Southern states and West Bengal despite their having below
replacement fertility, while the Eastern region in general has low child sex ratios
Child sex ratios for India overall may continue to rise as fertility declines further in the
populous Northern states. However, the underlying preference for sons is declining in India, as
indicated by a drop in the ideal sex ratio of children from 1.42 to 1.27 boys per girl between
1992-93 and 2005-06 (Figure 4). In South Korea, reported son preference declined several years
before a drop in sex ratios at birth (Chung and Das Gupta 2007).
3. National programs to reduce sex-selection
In both China and India, there have been several types of policies to enhance gender equality and
reduce sex-selection. These include long-standing efforts to assure women equality under the
law − for example in property ownership and access to employment − and advocacy to
encourage greater gender equality in social norms. A range of such measures was passed in both
China and India from the 1950s onwards. However, these measures are broad in their range, and
it is difficult to rigorously evaluate their impact on son preference.
With the rise in sex-selection since the 1980s, efforts have been stepped up to counter the
trend. Efforts include three main approaches: (1) advocacy and media outreach to encourage
parents to perceive girls to be as valuable as boys; (2) financial incentives for parents to raise
daughters; and (3) bans on the use of technology for sex-selective abortion for non-medical
purposes. The impact of these programs is often difficult to evaluate rigorously, but we discuss
here some evidence on the impact of these policies.
3.1 Policies in India
In India, a variety of policies to reduce sex-selection have been tried by the central and the state
governments. A few of these efforts have been evaluated, and we discuss these below.
3.1.1 Advocacy
Advocacy to encourage parents to perceive girls to be as valuable as boys has been carried out
through various channels, but these efforts have not been rigorously evaluated. Using a “natural
experiment” generated by different timing of the introduction of cable television, Jensen and
Oster (2009) found access to these media to be associated with reduced son preference. The
authors argue that this has much to do with the values of the characters typically portrayed on
television, pointing out that in India many female characters in popular soap operas work outside
the home, sometimes as professionals, running businesses or in other positions of authority –
accelerating the spread of new ideas among people. Analyzing cross-sectional data from India,
Pande and Astone (2007) also find that media exposure reduces son preference.
4
3.1.2 Financial incentives
As early as 1994, Haryana state started the Apni Beti Apna Dhan (Our Daughter, Our Wealth)
program. It offers poor households who give birth to daughters an immediate cash grant and a
long-term savings bond redeemable at the girl’s eighteenth birthday provided she is unmarried,
with additional incentives for increasing educational attainment. This was given to parents for
girls born amongst the first three children of either gender. In 1995, higher maturity amounts
were offered to girls willing to defer redemption of their bonds by up to four years, along with a
credit subsidy for entrepreneurship loans (Sinha and Joong 2009). Given the numbers of eligible
households, the cash transfers are necessarily small relative to the actual cost of raising
daughters, and may be significant only to the poorest families.
A careful evaluation of the early effects of the Haryana program (Sinha and Joong 2009).
indicates that the program was associated with a significant if modest improvement in child sex
ratios amongst the poorer households, and greater investment by households in their daughters’
health. However, another evaluation by Holla et al (2007) does not find even this modest
improvement in child survivorship. As child sex ratios rose in other states, the central and some
more state governments adopted similar programs from the late 1990s onwards.4
These
programs are often targeted to low-income households, offering cash rewards which increase as
the girl completes successive levels of schooling.
Sekher (2010) summarizes the information for many of these programs, and points to some
of their drawbacks. These include low cash incentives; an intimidating volume of paperwork
that parents need to complete at regular intervals to qualify for the benefits (such as
immunization certificates and school records); and that several programs target only the poorest
households whereas sex-selection is hardly confined to them. Some programs are linked to
having small families and getting sterilized. There is also the risk inherent in the long waiting
period to collect the main cash benefits, in that programs may change before the parents receive
the promised benefits. He mentions the case of Rajasthan’s Rajalakshmi scheme which started
in 1992 and ended in 2000. Although it set aside some funds for paying those in the program,
some parents did not receive their benefits.
3.1.3 Bans on sex-selection
In India a law was passed in 1978 banning public healthcare facilities from providing sex
determination during pregnancy except for sex linked genetic conditions. In 1994, the law was
broadened (effective from 1996) to include sex determination by ultrasound and made applicable
to both public and private healthcare providers. In 2002, the law was revised to include sex-
selection at the time of conception.5 Maharashtra state passed an Act in 1988, banning sex-
selection by both public and private healthcare providers, 8 years before such a law applied to
the rest of the country.
Bans on sex-selection are difficult to implement in settings where abortion is legal and
prenatal diagnostic techniques widely used. Even if a ban against prenatal sex detection is in
place, it is frequently reported that doctors find euphemisms to indicate the child’s gender to the
4 See Sekher (2010) for a summary of some of these programs. One central government program is the
Balika Samriddhi Yojana, started in 1997 http://wcd.nic.in/BSY.htm (accessed 27 April 2013). 5
http://www.medindia.net/indian_health_act/pre-natal-diagnostic-techniques-amendment-act-2002-
definitions.htm
5
parents. Moreover, an ultrasound may be performed in one location and an abortion obtained in
another, where a woman can provide alternative reasons for the procedure, thus making it
difficult to prove that a sex-selective abortion took place.
Vigorous efforts have been made to inform health providers about the ban, and some doctors
and clinics have been sanctioned. However, child sex ratios kept climbing (Table 3), and the ban
on sex-selective abortion has been viewed as having had little if any impact on child sex ratios
(Arnold et al 2002). Indeed, despite the early ban imposed in Marashtra state, its child sex ratios
have climbed steadily, and more steeply than any other state during 2001-2011.
In a recent paper, Nandi and Deolalikar (2013) argue that the Act averted further worsening
of child sex ratios in India. Their analysis exploits the difference in the timing of Maharashtra
and the national ban. They conclude that the Act accounts for 14-26 points improvement in the
child sex ratio (female/male) in the areas of neighboring states contiguous to Maharashtra.
However, they caution that child sex ratios reflect both sex ratios at birth (which could be
influenced by the ban) and postnatal sex-selection. However, the authors assume that the
Maharashtra ban and the national ban were equally well implemented, which is difficult to
establish.
3.2 China’s Care for Girls Campaign: combination of advocacy, financial incentives,
rigorous implementation of the ban on sex-selection, and program monitoring
In China, a ban on sex-selective abortion was passed in 1994, and further tightened periodically
from 2001 onwards (Li 2007).6 As in India, abortion is legal and prenatal diagnostic techniques
widely used, and doctors found ways to indicate the child’s gender to the parents. Despite the
ban, sex ratios at birth rose steadily to 120 by the late 1990s, and fluctuated around there through
the 2000s (Li 2007), and child sex ratios rose alongside (Table 1).
From 2000, an intensive program to reduce sex-selection was developed − called the Care for
Girls Campaign − to be implemented rigorously and backed up with sanctions (Li 2007; Zhao
2006). Starting with a pilot program in one city in 2000, pilots for a national program were tried
in one county with high sex ratios in each of 24 provinces in 2003-2005. In 2005, the State
Council issued an Action Plan for expanding this program across the country.
A national office for this program was set up, and a national plan developed for the design of
this campaign, along with plans for careful training, management, and evaluation of
implementation. The provinces issued their own statements in 2006, which followed the main
activities in the national statements, and the prefectures and counties followed suit by issuing
their own statements.
The program was implemented nationally from 2006. Several government departments were
given responsibilities in implementing the campaign, including the departments of family
planning, health, education, and police, and organizations such as the Women’s Federation.
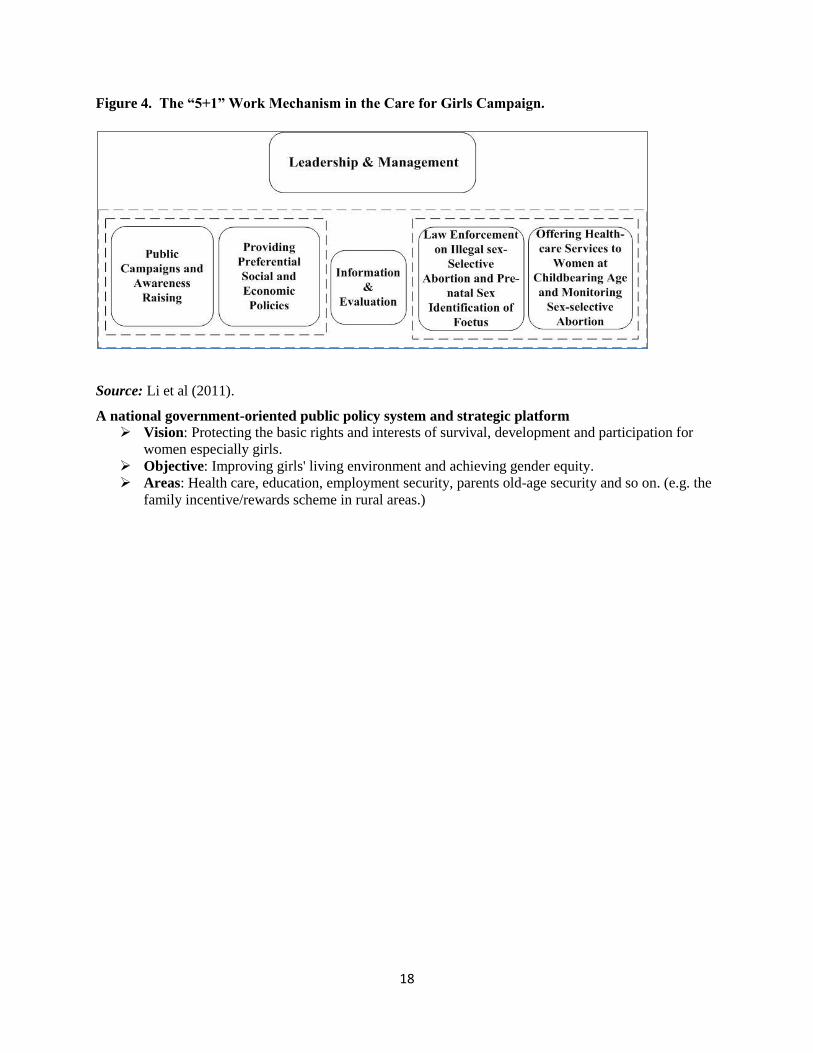
The components of this nation-wide program (Figure 5) consist of advocacy; financial and
other benefits for parents who only have girls; the provision of reproductive health services;
stringent implementation of the ban on sex selection; and program monitoring and evaluation.
The extra costs incurred for the program are shared between the central, provincial, and local
6 Several provinces have their own additional laws, regulations, sanctions, etc

6
governments, with central subsidies varying by the wealth of the province. However, the costs
of the financial and other benefits are covered by local governments.
3.2.1 Advocacy
This focused on changing social norms on son preference. It included publicity on gender
equality provided through various channels, including at the local-level “population schools”
where the government teaches people about reproductive health.
3.2.2 Financial benefits
The financial and other benefits provided under the Care for Girls Campaign to parents with only
girls vary by locality. These may include lowered scores for school entrance, funds to support
girls’ education and job training, some old-age income support for their parents, and priority for
accessing other social protection programs for the poor such as the Di Bao program. However,
these benefits are often sparse since local governments in many areas are chronically short on
revenues (Li 2007, World Bank 2009).
Regardless of the gender of the children born, the family planning program has since the
early 2000s offered some income support after age 60 to parents who have complied with the
family planning policy. The maximum support was raised in 2009 to 720 yuan annually per
parent, about USD 114. These costs are shared between the central and local governments, with
larger central subsidies to poorer provinces. The gradual increases in the coverage and benefits
provided by social protection systems in China also offer a growing safety net for old people.
3.2.3 Reproductive health services and ban on sex selection
These were piggy-backed onto the family planning program, including the care of pregnant
women and infants, and preventing sex-selection. The Action Plan statement specified that “in
terms of the pregnant, especially for the second birth, regular monitoring and antenatal care need
to be implemented strictly, to prevent the occurrence of sex-selection” (State Council of China
2005, cited in Zhao 2006).
Women pregnant with their second child were specially monitored by local family planning
workers, to reduce prenatal sex-selection and infanticide. These were mostly women whose first
child was a daughter, since they constitute the vast majority of those allowed a second child
under the family planning policy − only some minority ethnic groups are allowed more. In areas
which permit a second birth, couples found to be conducting sex-selection would be denied
permission to try again for a second child.
Stringent sanctions were put in place for doctors providing sex-selection. Private clinics
found doing this would have their equipment confiscated and be imposed a penalty, and the
whistle-blower rewarded. Doctors in public hospitals would lose their job.
3.2.4 Program monitoring and evaluation
Local officials provide data on program implementation. If they do not meet their
responsibilities in reducing sex-selection, they are subject to sanctions. At the same time, a
national competition rewards those who perform well.
The Care for Girls Campaign has not yet been rigorously evaluated, but the recorded sex
ratio at birth in the 24 pilot counties fell from an average of 133.8 in 2000 to 119.6 in 2005 (Li
7
2007). Li (2007) also notes that this is largely due to the rigorous implementation of the ban on
sex-selection and the more focused provision of reproductive health services, and that a longer-
term perspective requires advocacy and incentives to reduce son preference. However, the
census data offer some insights into program efficacy.
3.2.5 Program impact as seen from the census data
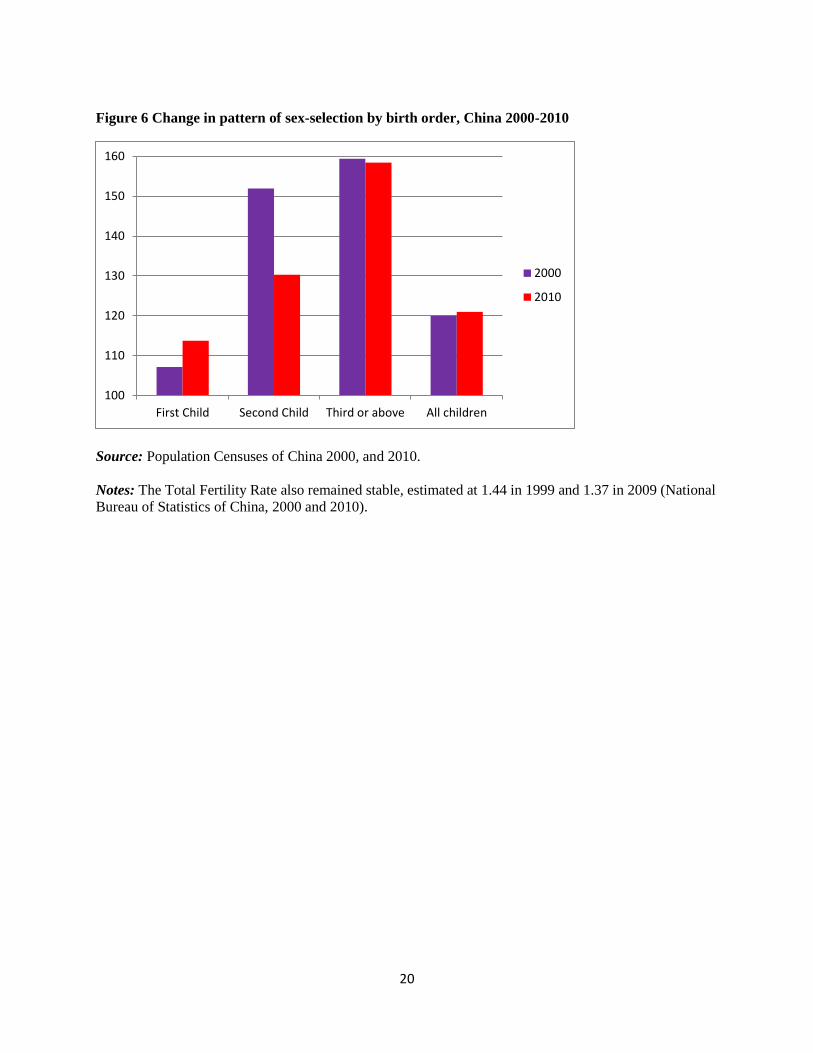
The census data show some interesting patterns that shed light on program impact. There is no
decline in the sex ratio at birth between the 2000 and 2010 censuses (Table 1, Figure 6). The sex
ratio at birth has hovered around 1.2 boys per girl since 1999. This suggests that access to sex-
selection remained despite the ban on health providers’ offering these services.
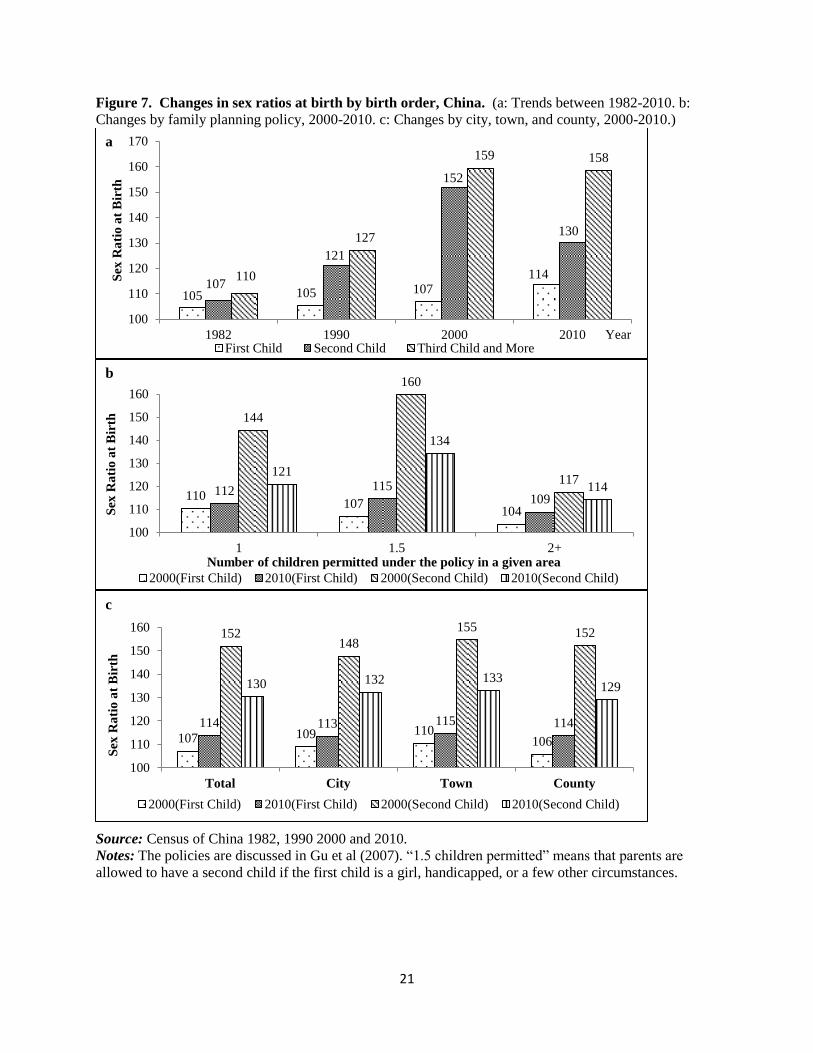
However, there was a sharp shift between 2000 and 2010 towards sex-selection at first birth –
away from the previous pattern of relatively normal sex ratios at birth for the first birth followed
by a sharp rise at the second birth (Figures 6, 7(a)). There is little change in the sex ratio at birth
for third and higher order births, but these form only 5% of births in the 2000 census. The rise in
sex-selection amongst first births cannot be attributed to tighter implementation of the family
planning policy, as the estimated Total Fertility Rate remained at similarly low levels during this
period: 1.44 in 1999 and 1.37 in 2009 (National Bureau of Statistics of China 1999, 2009).
This indicates a clear impact of the especial attention paid to monitoring women expecting
their second child, to reduce sex-selection − as Li (2007) had noted in discussing the impact of
the pilot studies. This policy was logical, given that before the 2010 census, the data showed that
most of the sex-selection took place after the first birth. It also reduced the workload of the
implementers, since only a quarter of births in the 2000 census were second births.
Looking at differentials by the number of births permitted under the prevailing family
planning policy (Figure 7(b)), the decline in sex-selection of the second child was sharp in both
the 1-child and 1.5 child areas (where parents were allowed a second child if the first was a girl).
As expected, the effect was muted in the ethnic minority areas where 2 or more children are
allowed. Similarly, the shift in the pattern of sex-selection is stronger in “towns” and “counties”
(Figure 7(c)), where people have typically been allowed a second child if the first was a girl.
After the 2010 census, the government has taken further steps to reduce sex-selection. In
2011 it devised a National Special Action for cracking down on sex-selection, with joint action
involving 6 Ministries and Commissions: The National Population and Family Planning
Commission, the Ministry of Health (combined into one ministry named the National Health
and Family Planning Commission in 2013), the Ministry of Public Security, the State Food and
Drug Administration, the Ministry of Health in General Logistics Department of the People’s
Liberation Army, and the National Women’s Federation (NPFPC, 2011). The family planning
department and the Women’s Federation have grassroots presence throughout the country. Birth
registration has also been stepped up across the country, in a joint effort by the departments of
family planning, and the Ministries of Health and Public Security.
4. Conclusions
Child sex ratios plateaued and fell by 0.8 percent in China between 2000 and 2010, declining in
provinces comprising 60 percent of the population. They declined in all the provinces where
they had reached 120 or more by 2000, but they rose in several provinces where they had been
8
lower. This muted the overall decline in the ratios during this decade. The ratios are normal or
low amongst some non-Han minorities living in the peripheral regions of Southwest and
Northwest China.
In India, child sex ratios rose by 1.4 percent during 2001-2011, but the pace of increase is
much slower than in preceding decades. The ratios fell sharply in the Northwestern states of
Punjab and Haryana, where they had historically been far higher than in the rest of the country.
Parts of the Western region also show improvement. However, there was an increase in some
populous surrounding states, which made for the national rise. These populous states still have
high fertility, so sex-selection may increase as fertility declines − slowing the normalization of
overall child sex ratios in the country. The states in the South, East, and Northeast regions
continue to have fairly normal child sex ratios despite low fertility levels.
In sum, in both countries the steepest declines in child sex ratios are seen in provinces/states
that had reached very high child sex ratios by 2000/1. Some provinces/states that had earlier
shown less elevated child sex ratios show a continuing rise, but in most cases at a reduced pace
of increase. And some groups continue to show relatively normal child sex ratios.
Turning to the state policies pursued in China and India to reduce sex-selection, similar
approaches have been used in both countries, but with different program design. Financial
incentives have been tried, though they are very small compared to the costs of raising a child.
Of two evaluations of a longstanding program in India, one shows a significant though modest
impact on child sex ratios, while the other does not. These findings do not seem to justify the
financial and administrative costs of these programs.
There is also little evidence that the bans on providing prenatal sex-selection had much
impact on overall levels of sex-selection in either country, despite active efforts to inform health
providers and the public about the bans and the sanctions involved. However, the approach used
in China had visible impact. The focus was on monitoring the second pregnancies of women
whose first child was a daughter. That this approach can work is indicated by the shift in sex-
selection from the second to the first birth, as people sought to side-step the program. The
program has been intensified after the 2010 Census results. If it focuses on monitoring all
pregnancies, it could reduce the sex ratio at birth. The 2002 revision of China’s sex-selection
ban also prohibits maltreatment of baby girls, and of women who give birth to them (Li 2007).
However, the simplest and most effective solution is not to prevent sex-selection, but to
reduce the demand for it by changing social norms as to the relative value of girls and boys. The
South Korean example shows that intense son preference is far from immutable, especially in a
small homogeneous country that underwent very rapid development and modernization (Chung
and Das Gupta 2007). China and India are large heterogeneous countries, so advocacy is an
especially important tool for accelerating normative change across their populations. Both
countries have long sought to promote gender equality through legislation, advocacy, and other
measures. They also have advocacy affirming the value of girl children, but the messaging could
be focused more specifically on showing that married daughters can help their aging parents.
Rigorous impact evaluations of the effect of media outreach have shown that they can radically
alter norms and behaviors in diverse settings on a wide range of issues − including son
preference in India. This approach can help China and India effect a permanent shift away from
son preference.
9
Appendix on Data Sources:
Why focus on child sex ratios, instead of sex ratios at birth?
The Chinese census data offer two kinds of information on levels of sex-selection: child sex
ratios and the sex ratio at birth. However, sex ratios at birth estimated from Chinese census and
survey data have a serious problem of under-reporting of infants. For example, Zhang and Zhao
(2006:315) note that children born close to the time of enumeration tend to be under-reported in
all major sources of fertility data in China. China’s fertility policies provide a powerful incentive
for both parents and officials to underreport births, in particular out-of-quota births. The under-
reporting of infants (of both sexes) has considerable implications for estimates derived from
births in the past year (Zhang and Zhao 2006; Zhai and Tao 2010; Goodkind 2011).7 In the
2010 census, the number of children rose smoothly with each successive birth year, from 15.2
million aged 4 to 15.7 million aged 1, but then dropped by 12% to 13.8 million at age 0 (<1 year)
− both boys and girls were under-reported. Child sex ratios offer more robust estimates than
births in the past year, since children aged 1-4 are far better enumerated and constitute most of
the children in the child sex ratio.
Second, sex ratios at birth may include some sex-selection done immediately after birth
(infanticide), but child sex ratios capture the net effect of prenatal and postnatal sex-selection in
early childhood. There is a gender gap in infant and child mortality in China (Figure 2), beyond
cases of infanticide captured in sex ratios at birth.
The data from China’s 1% sample censuses are not directly comparable to the full censuses.
The quinquennial trends show that the 1% sample census of 1995 substantially over-estimated
child sex ratios compared with the full decadal censuses (Figure A1). Child sex ratios shot up
between 1990 and 1995, and only modestly more by 2000. This effect is evident, though
perhaps more muted, in the 1% sample census of 2005.
India only conducts decadal censuses of the whole population, avoiding the complexities
introduced by sample censuses. However, Indian census data have a problem in that the pattern
of age-misreporting differs for girls and boys. By age 7, these differences cancel each other out,
so the child sex ratio in India is calculated for the age-group 0-6, in contrast with the Chinese
(and global) norm of calculating it for ages 0-4.
It is in the nature of censuses that their coverage varies between censuses. This applies also
to sex ratios estimated from the censuses.8 Nevertheless, for analyzing trends in “missing girls”
full population censuses have strong advantages over surveys, with their relatively small sample
sizes. And vital registration systems are still a work in progress in both China and India (Li et al
2010, Tiwari 2011). The Indian Sample Registration System offers some estimates of birth and
death rates and sex ratios at birth, but fluctuations due to sample size require that estimates such
as that of the sex ratio at birth are presented as moving 3-year averages.
For all these reasons, the child sex ratios from the full decadal censuses of China and India
offer the most robust data for assessing trends in sex-selection.
7 For broader discussions of under-reporting, see also Zhang (2005) and Chen, Wei and Zhai (2007).
8 See for example Dyson (2001) and Guillot (2002).
10
References
Arnold, F., Kishor, S., and Roy, T. K. (2002). Sex-Selective Abortions in India. Population and
Development Review, 28, 759-785. doi: 10.1111/j.1728-4457.2002.00759.x
Chen, W., and Zhai, Z. (2007). “Sex Ratio at Birth in China in the 1990s: How High Did It Really
Climb?,” Population research 31(5): 1-8. In Chinese
Chung, W., and Das Gupta, M. (2007). The Decline of Son Preference in South Korea: The Roles of
Development and Public Policy. Population and Development Review, 33, 757-783. doi: 10.1111/j.1728-
4457.2007.00196.x
Das Gupta, M, Chung, W., and Li, S. (2009). Evidence for an incipient decline in numbers of missing
girls in China and India. Population and development review, 35, 401-416. doi: 10.1111/j.1728-
4457.2009.00285.x
Dyson, T. (2001). The preliminary demography of the 2001 census of India. Population and Development
Review, 27, 341-356. doi: 10.1111/j.1728-4457.2001.00341.x
Ganatra, B. (2008). Maintaining Access to Safe Abortion and Reducing Sex Ratio Imbalances in Asia.
Reproductive Health Matters 16(31 Supplement):90–98, Retrieved April 25, 2013, from
http://www.ipas.org/~/media/Files/Ipas%20Publications/GanatraRHM2008.ashx
Goodkind, D. (2011). Child Underreporting, Fertility, and Sex Ratio Imbalance in China. Demography,
48(1), 291-316. doi: 10.1007/s13524-010-0007-y
Government of India. 2011. Family Welfare Statistics in India 2011 (Delhi: Ministry of Health and
Family Welfare)
Gu, B., Wang, F., Guo, Z., and Zhang, E. (2007). China's Local and National Fertility Policies at the End
of the Twentieth Century. Population and Development Review, 33(1), 129-147. doi: 10.1111/j.1728-
4457.2007.00161.x
Guillot, M. (2002). The dynamics of the population sex ratio in India, 1971-96. Population studies, 56(1),
51-63. doi: 10.1080/00324720213795
Guilmoto, C. Z. (2009). The sex ratio transition in Asia. Population and development review, 35, 519-549.
doi: 10.1111/j.1728-4457.2009.00295.x
Holla, A., Robert, J., and Emily, O. (2007). Daughters as Wealth? The effect of cash incentives on sex
ratios. Brown University. Working Paper.
Jensen, R., and Oster, E. (2009). The Power of TV: Cable Television and Women's Status in India. The
Quarterly Journal of Economics, 124, 1057-1094. doi: 10.1162/qjec.2009.124.3.1057
Kaur, R. (2011). Changing contours of gender imbalance in India: Does the middle class play a role?
Paper presented at Jiaotong University, Xi'an, China.
Li, S. (2007). Imbalanced sex ratio at birth and comprehensive intervention in China. Paper presented at
the 4th Asia Pacific Conference on Reproductive and Sexual Health and Rights, Hyderabad, India.
Li, S., Zhang, Y., and Feldman, M. W. (2010). Birth Registration in China: Practices, Problems and
Policies. Population Research and Policy Review, 29, 297-317. doi: 10.1007/s11113-009-9141-x
Li, S., Zheng, Z., Yang, J., and Luo, M. (2011, October). Gender Imbalance and Policy Responses:
China’s Experience. Paper presented at the UNFPA International Workshop on Skewed Sex Ratios,
Hanoi, Vietnam.
Nandi, A., and Deolalikar, A. B. (2013). Does a legal ban on sex-selective abortions improve child sex
ratios? Evidence from a policy change in India. Journal of Development Economics, 103, 216-228. doi:
http://dx.doi.org/10.1016/j.jdeveco.2013.02.007
National Bureau of Statistics. (1982). 1982 population census of China. Beijing: China Statistics Press.
National Bureau of Statistics. (1993). Tabulations on the 1990 population census of the People’s Republic
of China. Beijing: China Statistics Press.
11
National Bureau of Statistics. (1995). Results of the 1995 national 1% population sample census. Beijing:
China Statistics Press.
National Bureau of Statistics. (2000) China Population Statistics Yearbook. Beijing: China Statistics
Press
National Bureau of Statistics. (2002). Tabulations on the 2000 population census of the People’s Republic
of China. Beijing: China Statistics Press.
National Bureau of Statistics. (2007). Results of the 2005 national 1% population sample census. Beijing:
China Statistics Press.
National Bureau of Statistics. (2010) China Population and Employment Statistics Yearbook. Beijing:
China Statistics Press
National Bureau of Statistics. (2012). Tabulations on the 2010 population census of the People’s Republic
of China. Beijing: China Statistics Press.
NPFPC (National Population and Family Planning Commission of P.R.China). (2011). National Special
Action for Cracking down the “Two Illegalities” in 2011. Beijing. Retrieved Oct 7, 2013, from
http://www.chinapop.gov.cn/rdzt/zzlfzxxd/zhxx/201108/t20110816_363529.html
NPFPC (National Population and Family Planning Commission of P.R.China). (2012). National Work
Conference on the Year of Addressing the Issue of Abnormally High Sex Ratio at Birth. Beijing.
Retrieved Oct 7, 2013, from
http://www.chinapop.gov.cn/rdzt/zzlfzxxd/zhxx/201205/t20120525_388381.html
Pande, R. P., and Astone, N. M. (2007). Explaining Son Preference in Rural India: The Independent Role
of Structural versus Individual Factors. Population Research and Policy Review, 26(1), 1-29. doi:
10.1007/s11113-006-9017-2
Registrar General of India. (1992). Census of India, 1991 India: Final Population Totals. New Delhi:
Registrar General of India.
Registrar General of India. (2001). Census of India 2001, Series 1, India, Paper 1 of 2001, Chapter 6 Sex
Composition of the Population, New Delhi: Registrar General of India.
Registrar General of India. (2011a). Census of India 2011, Provisional Population Totals Paper 1 of 2011:
Jammu & Kashmir, New Delhi: Registrar General of India.
Registrar General of India. (2011b). Census of India 2011, Series 1, India, Paper 1 of 2001, Chapter 3
Size, Growth Rate, and Distribution of Population, New Delhi: Registrar General of India.
Registrar General of India. (2011c). Census of India 2011, Series 1, India, Paper 1 of 2001, Chapter 5
Gender Composition of the Population, New Delhi: Registrar General of India.
Registrar-General of India. (2011d). Sample Registration System Report 2011, New Delhi: Registrar
General of India
Retherford, R. D. and Roy, T. K. (2003). “Factors affecting sex-selective abortion in India and 17 major
states,” National Family and Health Survey Subject Report No 21. Mumbai: International Institute for
Population Sciences.
Sekher, T.V. (2010). “Special Financial Incentive Schemes for the Girl Child In India: a review of select
schemes”, paper prepared for the Planning Commission Govt of India, and the UN Population Fund
(UNFPA). Retrieved May 12, 2013, from
http://www.unfpa.org/gender/docs/sexselection/UNFPA_Publication-39772.pdf
Sinha, N., and Joanne, Y. (2009). Long-Term Financial Incentives And Investment In Daughters:
Evidence From Conditional Cash Transfers In North India. Washington DC: The World Bank, Policy
Research Working Paper # 4860.
Tiwari, Dhrijesh K. (2011, March). “Civil Registration System in India”. Paper presented at the ESCAP
session on vital statistics, Bangkok.

12
World Bank. (2009). From poor areas to poor people: China’s evolving poverty reduction agenda,
Washington DC: The World Bank, East Asia and Pacific Region, Poverty Reduction and Economic
Management Department.
Zhai Zhengwu and Taotao. (2010). “Evaluation and Analysis of Quality of Low-age,” Population Data
Chinese Journal of Population Science (1): 28–35. In Chinese.
Zhang, Q. (2005). The Underreporting and Sex Ratio of Lower Age Group in the Fifth Census:
Investigating School Enrollment Data. Chinese Journal of Population Science (3): 21–29. In Chinese.
Zhang, G., and Zhao, Z. (2006). Reexamining China's Fertility Puzzle: Data Collection and Quality over
the Last Two Decades. Population and Development Review, 32, 293-321. doi: 10.1111/j.1728-
4457.2006.00119.x
Zhao, B. (2006). Handbook for the Action of the Care for Girls Campaign, Beijing: China Population
Press . In Chinese.
13
Table 1 China: Trends in child sex ratios (<5 yrs) 1982-2010, and sex ratios at birth 2000-2010
Child sex ratio(m/f)
% change in
child sex ratio
2000-2010
% change in sex
ratio at birth
2000-2010
Year 1982 1990 2000 2010 1982-
1990
1990-
2000
China 1.07 1.10 1.20 1.19 2.80 9.09 -0.83 0.92
North
Beijing 1.07 1.06 1.11 1.11 -0.93 4.72 0 -0.98
Tianjin 1.07 1.08 1.13 1.13 0.93 4.63 0 1.04
Hebei 1.07 1.09 1.16 1.17 1.87 6.42 0.86 1.28
Shanxi 1.09 1.09 1.11 1.10 0 1.83 -0.90 -2.04
I. Mongolia 1.06 1.08 1.10 1.11 1.89 1.85 0.91 3.36
Northeast
Liaoning 1.06 1.08 1.13 1.11 1.89 4.63 -1.77 -2.34
Jilin 1.06 1.08 1.11 1.12 1.89 2.78 0.90 -0.05
Heilongjiang 1.05 1.06 1.09 1.11 0.95 2.83 1.83 2.46
East
Shanghai 1.06 1.04 1.10 1.14 -1.89 5.77 3.64 0.46
Jiangsu 1.07 1.12 1.23 1.20 4.67 9.82 -2.44 -0.23
Zhejiang 1.08 1.14 1.14 1.16 5.56 0 1.75 3.75
Anhui 1.10 1.10 1.30 1.27 0 18.18 -2.31 0.62
Fujian 1.06 1.10 1.24 1.25 3.77 12.73 0.81 6.50
Jiangxi 1.07 1.10 1.33 1.30 2.80 20.91 -2.26 7.06
Shandong 1.08 1.14 1.14 1.23 5.56 0 7.89 6.46
Central South
Henan 1.08 1.14 1.32 1.25 5.56 15.79 -5.30 -0.58
Hubei 1.06 1.08 1.29 1.24 1.89 19.44 -3.88 -3.19
Hunan 1.06 1.09 1.24 1.21 2.83 13.76 -2.42 -2.32
Guangdong 1.09 1.11 1.30 1.22 1.83 17.12 -6.15 -7.64
Guangxi 1.09 1.18 1.28 1.21 8.26 8.47 -5.47 -2.28
Hainan
1.14 1.36 1.25
19.30 -8.09 -7.63
Southwest
Chongqing2
1.17 1.13
-3.42 -2.28
Sichuan 1.07 1.11 1.15 1.11 3.74 3.60 -3.48 -3.77
Guizhou 1.06 1.05 1.14 1.24 -0.94 8.57 8.77 14.1
Yunnan 1.04 1.07 1.13 1.13 2.88 5.61 0 2.81
Tibet 1.02 1.02 1.01 1.05 0 -0.98 3.96 3.78
Northwest
Shaanxi 1.08 1.09 1.26 1.17 0.93 15.60 -7.14 -5.54
Gansu 1.05 1.08 1.19 1.18 2.86 10.19 -0.84 2.22
Qinghai 1.04 1.04 1.09 1.09 0 4.81 0 1.85
Ningxia 1.04 1.06 1.09 1.13 1.92 2.83 3.67 4.66
Xinjiang 1.04 1.03 1.06 1.06 -0.96 2.91 0 0.02
Source: Population Censuses of China 1982, 1990, 2000, and 2010.
Note: Bold italics indicate where the pace of increase in the indices of sex-selection has declined. A
negative sign indicates an absolute decline during the period specified.
14
Table 2: Sex ratio of children aged 0-4 years, of minority (non-Han) groups, China 1990-2010
1990 2000 2010
China 110.2 120.2 119.1
Minorities
Dai (Thai) 102.8 104.8 103.7
Uygur 102.0 103.6 104.1
Zang (Tibetan) 102.3 102.8 105.1
Bai 102.0 104.9 107.3
Hasake (Kazak) 103.9 105.5 107.8
Monggol 105.2 107.7 110.1
Man 108.8 112.3 110.7
Yi 105.1 111.5 112.1
Hui 105.4 111.5 114.3
Tujia 106.9 115.9 116.4
Li 105.9 117.7 116.6
Hani 109.1 124.4 117.0
Yao 109.9 117.6 117.9
Zhuang 112.5 122.8 119.2
Miao 106.7 117.7 122.6
Bouyei 104.2 115.7 123.6
Dong (Tung) 113.6 123.6 124.4
Source: Census of China 1990, 2000 and 2010
Note: The data are for minorities with a population larger than 1 million in the 2010 census.
15
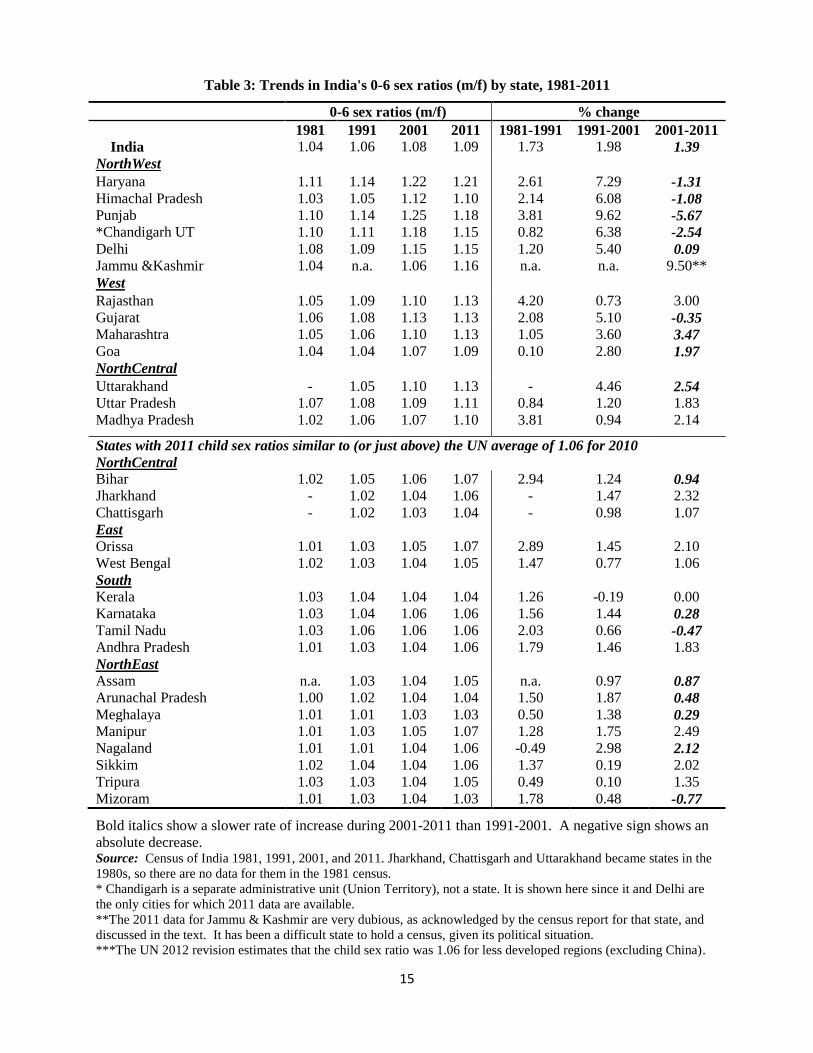
Table 3: Trends in India's 0-6 sex ratios (m/f) by state, 1981-2011
0-6 sex ratios (m/f) % change
1981 1991 2001 2011 1981-1991 1991-2001 2001-2011
India 1.04 1.06 1.08 1.09 1.73 1.98 1.39
NorthWest
Haryana 1.11 1.14 1.22 1.21 2.61 7.29 -1.31
Himachal Pradesh 1.03 1.05 1.12 1.10 2.14 6.08 -1.08
Punjab 1.10 1.14 1.25 1.18 3.81 9.62 -5.67
*Chandigarh UT 1.10 1.11 1.18 1.15 0.82 6.38 -2.54
Delhi 1.08 1.09 1.15 1.15 1.20 5.40 0.09
Jammu &Kashmir 1.04 n.a. 1.06 1.16 n.a. n.a. 9.50**
West
Rajasthan 1.05 1.09 1.10 1.13 4.20 0.73 3.00
Gujarat 1.06 1.08 1.13 1.13 2.08 5.10 -0.35
Maharashtra 1.05 1.06 1.10 1.13 1.05 3.60 3.47
Goa 1.04 1.04 1.07 1.09 0.10 2.80 1.97
NorthCentral
Uttarakhand - 1.05 1.10 1.13 - 4.46 2.54
Uttar Pradesh 1.07 1.08 1.09 1.11 0.84 1.20 1.83
Madhya Pradesh 1.02 1.06 1.07 1.10 3.81 0.94 2.14
States with 2011 child sex ratios similar to (or just above) the UN average of 1.06 for 2010
NorthCentral
Bihar 1.02 1.05 1.06 1.07 2.94 1.24 0.94
Jharkhand - 1.02 1.04 1.06 - 1.47 2.32
Chattisgarh - 1.02 1.03 1.04 - 0.98 1.07
East
Orissa 1.01 1.03 1.05 1.07 2.89 1.45 2.10
West Bengal 1.02 1.03 1.04 1.05 1.47 0.77 1.06
South
Kerala 1.03 1.04 1.04 1.04 1.26 -0.19 0.00
Karnataka 1.03 1.04 1.06 1.06 1.56 1.44 0.28
Tamil Nadu 1.03 1.06 1.06 1.06 2.03 0.66 -0.47
Andhra Pradesh 1.01 1.03 1.04 1.06 1.79 1.46 1.83
NorthEast
Assam n.a. 1.03 1.04 1.05 n.a. 0.97 0.87
Arunachal Pradesh 1.00 1.02 1.04 1.04 1.50 1.87 0.48
Meghalaya 1.01 1.01 1.03 1.03 0.50 1.38 0.29
Manipur 1.01 1.03 1.05 1.07 1.28 1.75 2.49
Nagaland 1.01 1.01 1.04 1.06 -0.49 2.98 2.12
Sikkim 1.02 1.04 1.04 1.06 1.37 0.19 2.02
Tripura 1.03 1.03 1.04 1.05 0.49 0.10 1.35
Mizoram 1.01 1.03 1.04 1.03 1.78 0.48 -0.77
Bold italics show a slower rate of increase during 2001-2011 than 1991-2001. A negative sign shows an
absolute decrease. Source: Census of India 1981, 1991, 2001, and 2011. Jharkhand, Chattisgarh and Uttarakhand became states in the
1980s, so there are no data for them in the 1981 census.
* Chandigarh is a separate administrative unit (Union Territory), not a state. It is shown here since it and Delhi are
the only cities for which 2011 data are available.
**The 2011 data for Jammu & Kashmir are very dubious, as acknowledged by the census report for that state, and
discussed in the text. It has been a difficult state to hold a census, given its political situation.
***The UN 2012 revision estimates that the child sex ratio was 1.06 for less developed regions (excluding China).
16
Figure 1. Trends in child (<5 year) sex ratios, China, India, and S Korea, 1950-2010
Sources: 100% censuses of all 3 countries:
1. S. Korea: Population and Housing Censuses of Korea, 1950, 1960, 1970, 1980, 1990, 1995, 2000,
2005, and 2010. The 1995 and 2005 censuses for Korea were full censuses.
2. China: Population Censuses of China 1953, 1964, 1982, 1990, 2000, and 2010.
3. India: Census of India, 1951, 1961, 1971, 1981, 1991, 2001, and 2011.
Notes: The figures for India are the sex ratio of children aged 0-6 years (males/females), for China and
South Korea they are for children aged 0-4 years.
1
1.05
1.1
1.15
1.2
1.25
1950 1960 1970 1980 1990 1995 2000 2005 2010
India
South Korea
China NW India
(Punjab & Haryana)
17
Figure 2. Trend in male/female infant and child mortality, China 1982-2010.
Source: Censuses of China 1982, 1990, 2000, 2010, and 1% Sample Censuses of 1995 and 2005.
Figure 3. Decline in Reported Son Preference, India (reported ideal number of boys/girls)
Source: Data for the third survey calculated from the National Family Health Survey 3 (IIPS 2007: Table
4.17.1). The observations for the first two surveys are from Retherford and Roy (2003: Table 6.5).
Note: This is computed using Retherford and Roy’s method (2003:33), which is to divide the reported
ideal number of boys by the reported ideal number of girls. The number of reported ideal children of
“either sex” is split equally between boys and girls.
0.6
0.7
0.8
0.9
1
1.1
1.2
1982 1990 1995 2000 2005 2010
m/f
ra
tio
in
mo
rta
lity
Census Year
<1year
1-4 years
1.25
1.3
1.35
1.4
1.45
1992-93 1998-99 2005-06
Rep
ort
ed i
dea
l n
um
ber
of
bo
ys/
gir
ls
Year of survey (National Family Health Survey)
18
Figure 4. The “5+1” Work Mechanism in the Care for Girls Campaign.
Source: Li et al (2011).
A national government-oriented public policy system and strategic platform Vision: Protecting the basic rights and interests of survival, development and participation for
women especially girls.
Objective: Improving girls' living environment and achieving gender equity.
Areas: Health care, education, employment security, parents old-age security and so on. (e.g. the
family incentive/rewards scheme in rural areas.)
19
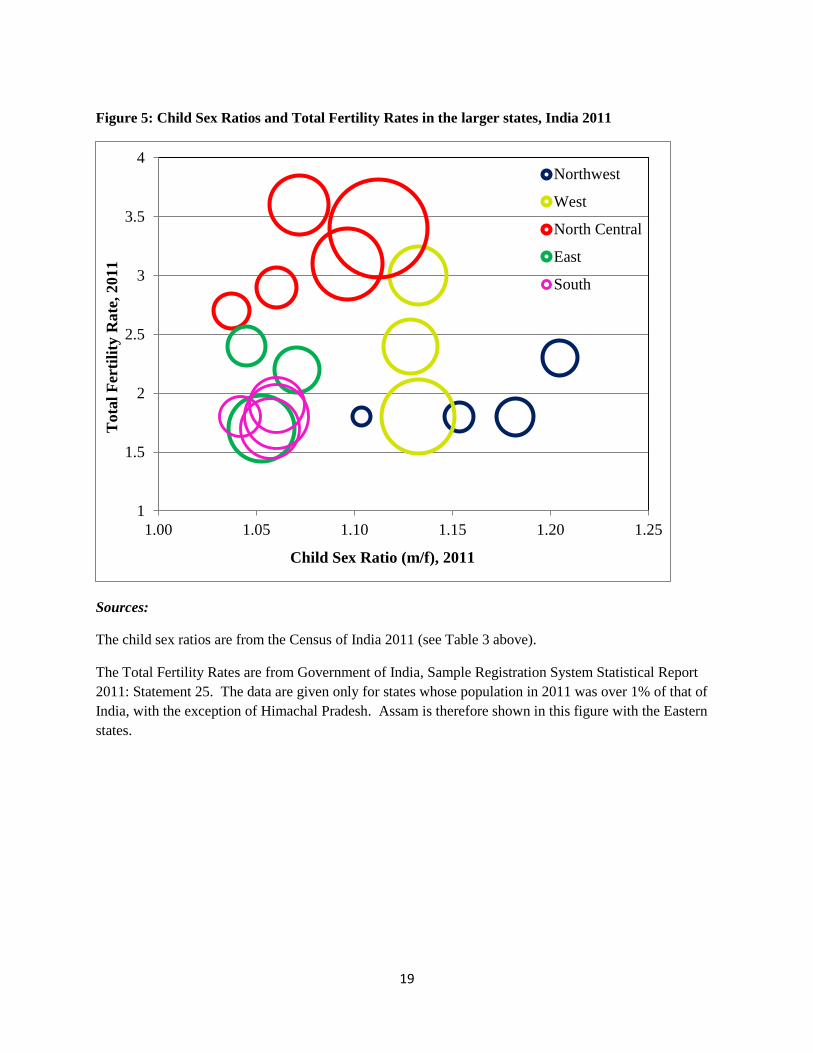
Figure 5: Child Sex Ratios and Total Fertility Rates in the larger states, India 2011
Sources:
The child sex ratios are from the Census of India 2011 (see Table 3 above).
The Total Fertility Rates are from Government of India, Sample Registration System Statistical Report
2011: Statement 25. The data are given only for states whose population in 2011 was over 1% of that of
India, with the exception of Himachal Pradesh. Assam is therefore shown in this figure with the Eastern
states.
1
1.5
2
2.5
3
3.5
4
1.00 1.05 1.10 1.15 1.20 1.25
Northwest
West
North Central
East
South
Tota
l F
erti
lity
Rate
, 2011
Child Sex Ratio (m/f), 2011
20
Figure 6 Change in pattern of sex-selection by birth order, China 2000-2010
Source: Population Censuses of China 2000, and 2010.
Notes: The Total Fertility Rate also remained stable, estimated at 1.44 in 1999 and 1.37 in 2009 (National
Bureau of Statistics of China, 2000 and 2010).
100
110
120
130
140
150
160
First Child Second Child Third or above All children
2000
2010
21
Figure 7. Changes in sex ratios at birth by birth order, China. (a: Trends between 1982-2010. b:
Changes by family planning policy, 2000-2010. c: Changes by city, town, and county, 2000-2010.)
Source: Census of China 1982, 1990 2000 and 2010.
Notes: The policies are discussed in Gu et al (2007). “1.5 children permitted” means that parents are
allowed to have a second child if the first child is a girl, handicapped, or a few other circumstances.
105 105 107 114
107
121
152
130
110
127
159 158
100
110
120
130
140
150
160
170
1982 1990 2000 2010
Sex
Ra
tio
at
Bir
th
First Child Second Child Third Child and MoreYear
a
110 107
104
112 115 109
144
160
117 121
134
114
100
110
120
130
140
150
160
1 1.5 2+Number of children permitted under the policy in a given area
2000(First Child) 2010(First Child) 2000(Second Child) 2010(Second Child)
Sex
Ra
tio
at
Bir
th
b
107 109 110 106
114 113 115 114
152 148
155 152
130 132 133 129
100
110
120
130
140
150
160
Total City Town County
2000(First Child) 2010(First Child) 2000(Second Child) 2010(Second Child)
Sex
Ra
tio
at
Bir
th
c