Embed Size (px)
Citation preview
International Journal of ChemTech Research CODEN (USA): IJCRGG ISSN : 0974-4290 Vol.6, No.7, pp 3589-3601, Sept-Oct 2014
Miscibility studies of Starch and Poly(4-styrene sulfonic acid)blend system
Y. N. Sudhakar1, D. Krishna Bhat2, M. Selvakumar1*1Department of Chemistry, Manipal Institute of Technology, Manipal University,
Karnataka, India.2Department of Chemistry, National Institute of Technology, Surathkal,
Karnataka, India.
*Corres.author: [email protected] Tel.: +91 820-2571060
Abstract: Polymeric solutions were prepared using blends of starch with poly(4-styrene sulfonic acid) (PSSA)in water and their miscibility was determined by viscosity studies at 30 °C, 40 °C and 50 °C. Using interactionparameters such as Krigbaum’s (Δb), Hong’s (ΔkAB), Chee’s (µ), Sun’s (α), polymer-polymer, blend-solventand heat of mixing there was the existence of positive interactions in the blend polymer solutions only up to80% PSSA content. A significant variation of miscibility was observed with increase in temperature in thesample containing 70% PSSA content. Polymer blend films obtained by solution casting showed hydrogenbonding in Fourier transform infrared (FTIR) studies. Differential thermal analysis (DTA) andthermogravimetric analysis (TGA) studies also supported the results. A uniform surface of the miscible blendfilms were observed in scanning electron microscopy images, whereas segregation was observed for theimmiscible blends.Keywords: Polymer blends, miscibility, interaction parameters, solution properties, thermal gravimetricanalysis, scanning electron microscopy.
Introduction and Experimental
Synthesis and preparation of new polymeric materials with improved mechanical properties,biocompatibility, and conductivity has been increasing for the last three decades. Usually, a polymer whichmay, perhaps, crystallize has been considered miscible with those polymers which are miscible with itsamorphous fraction. There are many techniques1-4 which determines the miscibility, but in complicated cases inwhich several amorphous phases with different compositions are present, they may not be predicted as miscibleusing these techniques. In such cases viscosity studies, along with temperature variation, are useful to justifywhether blends are actually miscible or simply compatible.5-9 Viscometry has been used widely to investigatepolymer–polymer interactions and miscibility. From the viscometric measurements, reduced viscosities ofhomopolymers and their blends can be determined.10 Using these solution viscosity data, various interactionparameters can be obtained. The Krigbaum and Wall [11] interaction parameter, Δb, of the blends, for instance, isobtained from the difference between the experimental interaction parameter (b12) and theoretical interactionparameter (b*
12) values. Interaction parameter Δb can be calculated as follows:
mmm)(m
m)sp(Cb
C+= h
h
(1)
M. Selvakumar et al /Int.J. ChemTech Res.2014,6(7),pp 3589-3601. 3590
where Cm is the total concentration of polymers, C1 + C2, (η)m is the intrinsic viscosity of the blend and bm is theoverall interaction between two polymeric species. The values of bm and (η)m can be determined from the slopeand intercept of the reduced viscosity versus concentration plots using linear fits. b12 can be obtainedexperimentally from Eq. (2)
2222122111
21m 2 bwbwwbwb ++= (2)
where w1 and w2 are the mass fractions of the two components, respectively, and b11 and b22 are the respectiveindividual interaction parameters which can be obtained from the slope of the plots of the reduced viscosityversus concentration. The theoretical interaction parameter b*
12 was calculated from Eq. (3)
2/1221112 )( bbb =*
(3)
The difference in the theoretical b*12 from Eq. (3) and the experimental b12 with Eq. (2) gives the Δb interaction
parameter, i.e., Eq. (4)
)( 1212*-=D bbb (4)
If Δb≥0, it signifies miscibility, and Δb<0 indicates phase separation. If the intrinsic viscosity of the individualpolymers, i.e., η1 and η2, are sufficiently apart, Chee’s5 interaction parameter µ can be more effectively used topredict miscibility. The relation is given in Eq. (5).
2)12(bhh
m-
D=
(5)
If µ≥0, blend is miscible and when µ<0 it is immiscible.
Sun et al.9 have recommended another formula [Eq (6)] for the determination of polymer miscibility forblends in which hydrodynamic interactions are present in the system. The blend miscibility is predicted basedon the α value, i.e., when α≥0 is miscible and immiscible when α< 0:
22211
21212122
222
21
211
m }][]{[][][2][][
wwwwKKwKwK
Khh
hhhha
+++
-=(6)
where, K1, K2, and Km are the Huggins’s constants for individual components 1, 2 and the blend, respectively.Based on Hong’s extension12 of Huggin’s mutual interaction parameter ΔkAB, we have further carried outcalculations to identify the miscibility between the unlike polymers in the blends. The difference ΔkAB betweenthe theoretical interaction parameter value kAB,t and the experimental interaction parameter kAB value providesinformation about the interaction between two polymers. The experimental kAB value is related to b12 as per Eq.(7); hence, the kAB value can be calculated using Eq. (8).
21AB12 ][][ hhkb = (7)
2121
2222
2111m
AB ][][2)(
wwηηwbwbbk +-
=(8)
The theoretical value of the factor kAB,t is derived from the geometric means of K1 and K2 as
5021tAB,
.)K(Kk = (9)
Thus, the difference between theoretical kAB,t and experimental kAB gives ΔkAB [Eq. (10)]
M. Selvakumar et al /Int.J. ChemTech Res.2014,6(7),pp 3589-3601. 3591
tAB,ABABΔ -kkk = (10)
The blend is miscible if ΔkAB ≥0 and immiscible if ΔkAB < 0.
The chemical structures of the polymeric components play an important role in order to enhanceinteractions which can promote miscibility. Starch is an abundant and low cost natural polymer which is anattractive raw material for use as oxygen and grease barriers, either by coating or as an additive in packagingmaterials. Starch consists of micro-scale granulates that contain crystalline regions of amylopectin due to itshelical structures and amorphous regions of amylose and amylopectin branch units. When a starch solution inwater is heated, the granules swell and rupture, the semi-crystalline structure is lost and the smaller amylosemolecules start leaching out of the granule, forming a network that holds water and increases the mixture'sviscosity. At this stage, other polymers are usually blended to form intermolecular bonding. During cooling orprolonged storage, semi-crystalline regions partially recovers, while the interaction between other polymers isvia hydrogen bonding formed by the hydroxyl groups on the granule surface.13 The hydrophilic starch, however,is incompatible with hydrophobic synthetic polymers, and simple mixing of these tends to result in phaseseparation.
The use of functionalized polymers represents a good way to obtain interacting polymers which canproduce a single-phase material with enhanced properties, including their film forming properties. Poly(styrenesulfonic acid) (PSSA) is an often used model compound in polyelectrolyte chemistry and can be prepared fromwell defined, commercially available polystyrene samples.14 Due to low product cost, applications of PSSA asproton conducting membranes in various electrochemical devices are also interesting.15,16 However, theapplication of PSSA is problematic, due to poor mechanical properties. Similar to this work, Atanu et al.17 havereported that the two component system of starch and poly (acrylic acid) (PAA) in a 5% aqueous solutionformed a synergistic mixture at 60:40 ratio and showed interaction between the acid groups of the PAA and theOH groups of starch. With the SO3
-H+ group in PSSA, which can function as a proton donor, and starch with its–OH groups functioning as a weak proton acceptor, one would expect hydrogen bonding interactions leading tomiscibility in PSSA/starch blends.
In the present work, as a part of our ongoing research on biodegradable polymers,8,18 we have studiedthe miscibility behavior of the PSSA and starch using viscometry studies and further polymer blend films werecharacterized using scanning electron microscopy (SEM), Fourier transform infrared spectroscopy (FTIR) andthermal gravimetric analysis (TGA) techniques. The effects of molecular interactions of the relationshipbetween polymer-polymer and blend-solvent interaction parameters and heat of mixing were also determined atvarious temperatures.
Preparation of polymer solutions
1% (v/v) of PSSA based on 18% solution from Sigma-Aldrich, USA, was prepared in water. 1% (w/v)potato starch (Merck, India) stock solution was prepared in distilled water and stirred at 353K until dissolutionof the granules. PSSA/starch blend compositions, namely, 100/0, 90/10, 80/20, 70/30, 60/40, 50/50, 40/60,30/70, 20/80, 10/90 and 0/100 were prepared by mixing appropriate amounts of the 1% individual polymerstock solutions. The solutions were used for viscosity studies.
Preparation of blend films
PSSA/starch blend compositions, namely, 80/20, 50/50 and 20/80, were prepared by mixing appropriateamounts of the 1% individual polymer stock solutions. 20 ml of the prepared blend solutions and pure polymersolutions were taken in five petri dishes having a diameter 6 cm and kept in a hot air oven at 60 °C for 24 hoursuntil non-sticky and pale yellow films (colorless for starch film) were obtained. The films were dried undervacuum at 50 °C for 5 hours. The thickness of the obtained films ranged between ~0.8 mm and ~0.9 mm.
Viscosity studies
Viscosity measurements were done at 30, 40, and 50 °C, using a suspended level Ubbelohde viscometerwith flow time of 95 s for distilled water. The prepared polymer solutions were further diluted [0.5, 0.4, 0.3,0.2, and 0.1, (v/v)] using distilled water, along with the pure polymer solutions, and viscosity measurementswere carried out. Solution viscosities at different temperatures were determined in a thermostated bath, withthermal stability of ±0.1 °C.

M. Selvakumar et al /Int.J. ChemTech Res.2014,6(7),pp 3589-3601. 3592
FTIR, DTA-TGA and SEM studies
FTIR measurements of the polymer films were carried out using 20 scans at 1 scan/s and 4 cm-1
resolution at room temperature using a Shimadzu FTIR-8400S spectrophotometer (Japan). The DTA and TGA,measurements were done on a Shimadzu TGA-60 (Japan). Thermal studies were performed over a temperaturerange 25-400 °C at a heating rate of 10 °C/min under nitrogen atmosphere. Surfaces of the pure and blendpolymer films were sputtered with gold and SEM studies were carried out in a JEOL JSM-6380LA SEM(Japan).
Results and Discussion
Solution property studies
0.1 0.2 0.3 0.4 0.5
5
10
15
20
25
30
h sp/C
(dL/
g)
Concentration (g/dL)
PSSA 90/10 80/20 70/30 60/40 50/50 40/60 30/70 20/80 10/90 starch
(a)
0.1 0.2 0.3 0.4 0.50
5
10
15
20
25
Concentration (g/dL)
hsp
/C (d
L/g)
PSSA 90/10 80/20 70/30 60/40 50/50 40/60 30/70 20/80 10/90 starch
(b)
M. Selvakumar et al /Int.J. ChemTech Res.2014,6(7),pp 3589-3601. 3593
0 .1 0 .2 0 .3 0 .4 0 .50
5
1 0
1 5
2 0
C o n c en tra tio n (g /d L )
hsp
/C (d
L/g)
P S SA 9 0 /1 0 8 0 /2 0 7 0 /3 0 6 0 /4 0 5 0 /5 0 4 0 /6 0 3 0 /7 0 2 0 /8 0 1 0 /9 0 s ta rch
(c )
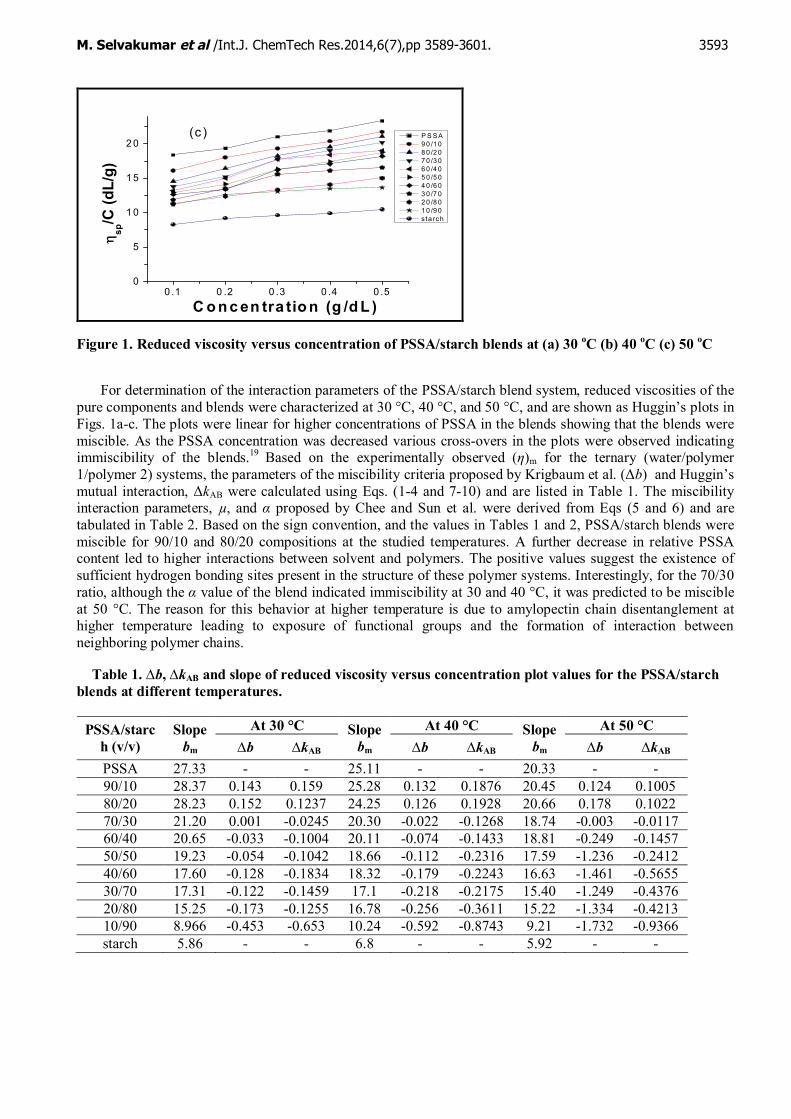
Figure 1. Reduced viscosity versus concentration of PSSA/starch blends at (a) 30 oC (b) 40 oC (c) 50 oC
For determination of the interaction parameters of the PSSA/starch blend system, reduced viscosities of thepure components and blends were characterized at 30 °C, 40 °C, and 50 °C, and are shown as Huggin’s plots inFigs. 1a-c. The plots were linear for higher concentrations of PSSA in the blends showing that the blends weremiscible. As the PSSA concentration was decreased various cross-overs in the plots were observed indicatingimmiscibility of the blends.19 Based on the experimentally observed (η)m for the ternary (water/polymer1/polymer 2) systems, the parameters of the miscibility criteria proposed by Krigbaum et al. (Δb) and Huggin’smutual interaction, ΔkAB were calculated using Eqs. (1-4 and 7-10) and are listed in Table 1. The miscibilityinteraction parameters, µ, and α proposed by Chee and Sun et al. were derived from Eqs (5 and 6) and aretabulated in Table 2. Based on the sign convention, and the values in Tables 1 and 2, PSSA/starch blends weremiscible for 90/10 and 80/20 compositions at the studied temperatures. A further decrease in relative PSSAcontent led to higher interactions between solvent and polymers. The positive values suggest the existence ofsufficient hydrogen bonding sites present in the structure of these polymer systems. Interestingly, for the 70/30ratio, although the α value of the blend indicated immiscibility at 30 and 40 °C, it was predicted to be miscibleat 50 °C. The reason for this behavior at higher temperature is due to amylopectin chain disentanglement athigher temperature leading to exposure of functional groups and the formation of interaction betweenneighboring polymer chains.
Table 1. ∆b, ∆kAB and slope of reduced viscosity versus concentration plot values for the PSSA/starchblends at different temperatures.
At 30 °C At 40 °C At 50 °CPSSA/starch (v/v)
Slopebm ∆b ∆kAB
Slopebm ∆b ∆kAB
Slopebm ∆b ∆kAB
PSSA 27.33 - - 25.11 - - 20.33 - -90/10 28.37 0.143 0.159 25.28 0.132 0.1876 20.45 0.124 0.100580/20 28.23 0.152 0.1237 24.25 0.126 0.1928 20.66 0.178 0.102270/30 21.20 0.001 -0.0245 20.30 -0.022 -0.1268 18.74 -0.003 -0.011760/40 20.65 -0.033 -0.1004 20.11 -0.074 -0.1433 18.81 -0.249 -0.145750/50 19.23 -0.054 -0.1042 18.66 -0.112 -0.2316 17.59 -1.236 -0.241240/60 17.60 -0.128 -0.1834 18.32 -0.179 -0.2243 16.63 -1.461 -0.565530/70 17.31 -0.122 -0.1459 17.1 -0.218 -0.2175 15.40 -1.249 -0.437620/80 15.25 -0.173 -0.1255 16.78 -0.256 -0.3611 15.22 -1.334 -0.421310/90 8.966 -0.453 -0.653 10.24 -0.592 -0.8743 9.21 -1.732 -0.9366starch 5.86 - - 6.8 - - 5.92 - -
M. Selvakumar et al /Int.J. ChemTech Res.2014,6(7),pp 3589-3601. 3594
Table 2. µ, and α values for the PSSA/starch blends at different temperatures.
At 30 °C At 40 °C At 50 °CPSSA/starch(v/v) µ α µ α µ α90/10 0.0423 0.0124 0.0401 0.0248 0.0371 0.022080/20 0.0319 0.0160 0.0276 0.0158 0.0201 0.016570/30 -0.0068 -0.0008 -0.0211 -0.0004 0.0121 0.000160/40 -0.0101 -0.0088 -0.0045 -0.0023 -0.0132 -0.005850/50 -0.0280 -0.0102 -0.0152 -0.0104 -0.0142 -0.018140/60 -0.0273 -0.0168 -0.0127 -0.0054 -0.0172 -0.028730/70 -0.0372 -0.0185 -0.0180 -0.0027 -0.0193 -0.036520/80 -0.0538 -0.0222 -0.0224 -0.0266 -0.0227 -0.041810/90 -0.0877 -0.0236 -0.0245 -0.0125 -0.0254 -0.0495
Analysis of the viscosity data with all the corresponding proposed interaction parameters brings forth thefact that not all the criteria may simultaneously satisfy the condition for the miscibility. Schneier20 suggestedusing the heat of mixing (ΔHm) as a factor 21-22 for studying the miscibility of blends using the solubilityparameters, δ, of the sample polymers and Eq. 11. The values of δ are PSSA [~18 (J/cm3)1/2] and starch [~34.0(J/cm3)1/2]. 23
1/22
111222
2221111m 11 ïþ
ïýü
ïî
ïíì
úû
ùêë
é-+-
=ρ)Mw(ρ)Mw(
w)-δ(δρMwΔH (11)
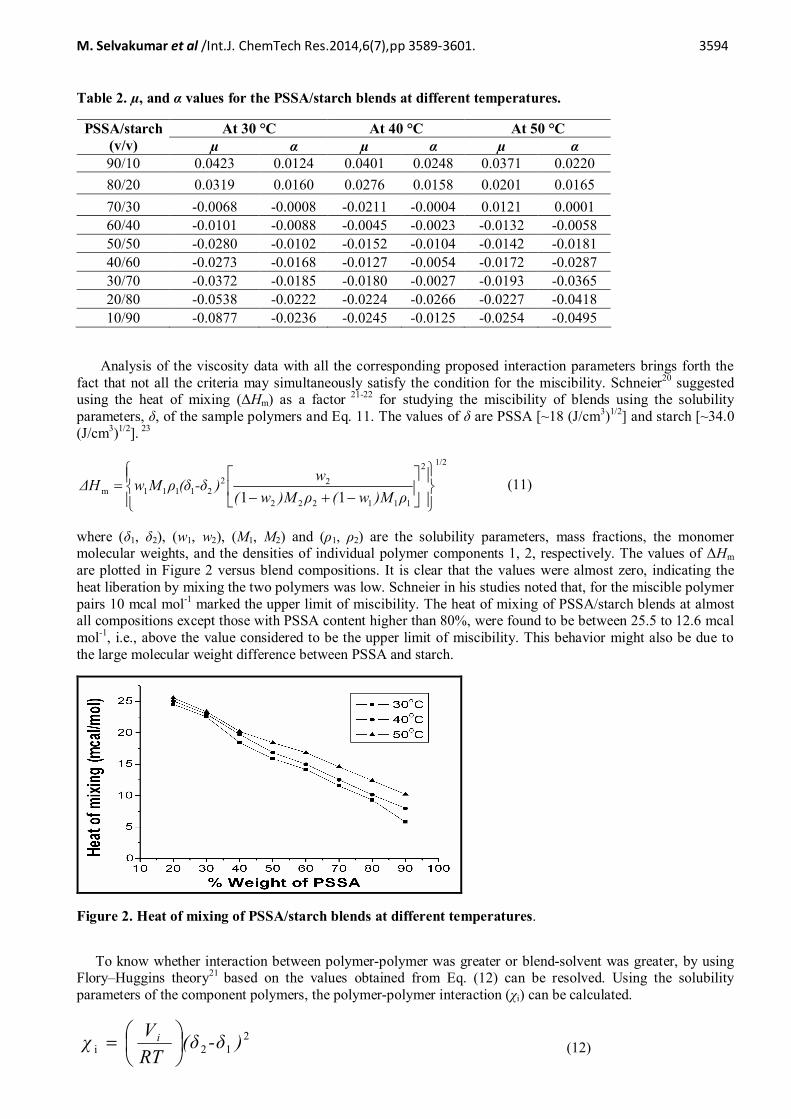
where (δ1, δ2), (w1, w2), (M1, M2) and (ρ1, ρ2) are the solubility parameters, mass fractions, the monomermolecular weights, and the densities of individual polymer components 1, 2, respectively. The values of ΔHmare plotted in Figure 2 versus blend compositions. It is clear that the values were almost zero, indicating theheat liberation by mixing the two polymers was low. Schneier in his studies noted that, for the miscible polymerpairs 10 mcal mol-1 marked the upper limit of miscibility. The heat of mixing of PSSA/starch blends at almostall compositions except those with PSSA content higher than 80%, were found to be between 25.5 to 12.6 mcalmol-1, i.e., above the value considered to be the upper limit of miscibility. This behavior might also be due tothe large molecular weight difference between PSSA and starch.
Figure 2. Heat of mixing of PSSA/starch blends at different temperatures.
To know whether interaction between polymer-polymer was greater or blend-solvent was greater, by usingFlory–Huggins theory21 based on the values obtained from Eq. (12) can be resolved. Using the solubilityparameters of the component polymers, the polymer-polymer interaction (χi) can be calculated.
212i )-δ(δ
RTVχ i ÷
øö
çèæ= (12)

M. Selvakumar et al /Int.J. ChemTech Res.2014,6(7),pp 3589-3601. 3595
where Vi, R, and T are the molar volume of the water, universal gas constant, and temperature (K),respectively.24,25 The blend-solvent interaction parameters were calculated according to the method adopted bySingh and Singh.26 The solubility parameters of the blend (δ) were calculated from the additive relationship:
2211 δwδwδ += (13)
Tables 3 and 4 list the interaction parameters of the polymer–polymer blend systems and blend–solventinteraction parameters, respectively. From these data, we observed that the net polymer–polymer interactionswere lower than those observed for blend-solvent interactions for the studied blend compositions (50/50 and20/80 blend ratio) at three different temperatures. Based on the similar miscibility observation found in theliteratures27-29, the lower values indicate that the blends were miscible when the PSSA content was above 80%in the blend.
Table 3. Polymer-polymer interaction parameters for the PSSA/starch in the blend.
Temperature (°C) Polymer χi calculated fromEq. (12)
30 starch 0.0252PSSA 0.6532
40 starch 0.0233PSSA 0.6604
50 starch 0.0210PSSA 0.6872
Table 4. Blend-solvent interaction parameters at different temperatures.
Temperature(°C)
PSSA/starch(v/v)
δ calculatedfrom Eq. (13)
χi calculatedfrom Eq. (12)
30 80/20 9.545 0.021850/50 9.452 0.561020/80 9.325 0.6452
40 80/20 9.545 0.022050/50 9.452 0.562520/80 9.325 0.6235
50 80/20 9.545 0.022550/50 9.452 0.562320/80 9.325 0.6985
So, the present study indicates the existence of miscibility when the PSSA content was more than 80%in the blend and below this composition, there was no interaction between the polymer segments, which led toimmiscibility of the polymer blends. The interactions range from the strong, chemical type interactions such ashydrogen bonding between PSSA and starch, to merely physical entanglements between them. Starch ispreferably high molecular weight, substantially linear chain molecules. The highly branched structure of theamylopectin molecule favors the branches to interact intramolecularly, due to the proximity of the brancheswithin a single molecule. The existence of PSSA/starch miscibility leads to poor or ineffective amylopectinmolecule entanglements/interactions with other starch molecules, particularly other amylopectin molecules.Figure 3 represents the most probable schematic interactions between the two polymers with hydrogen bonding.The disentanglement of the starch molecules at lower concentration enables the PSSA to be chemicallyinteracting and/or physically entangle with the branched amylopectin molecules such that the OH groupsassociate with one another via the sulphonate groups of the PSSA polymer chain.
Figure 3. Schematic interactions between PSSA/starch polymers with hydrogen bonding.

M. Selvakumar et al /Int.J. ChemTech Res.2014,6(7),pp 3589-3601. 3596
FTIR spectroscopic studies
Figure 4. FTIR spectra of films consisting of pure components and different PSSA/starch blend ratios.
Figure 4 shows the FTIR spectra of the pure polymers and their blends. In the spectrum of the pure starchfilm, a broad band at 3300 cm-1 was observed due to the hydrogen-bonded hydroxyl groups that contribute tothe complex vibrational stretches associated with free inter- and intra-molecular bound hydroxyl groups. Asharp band at 2910 cm-1, which is characteristic of C-H stretches associated with the ring methane hydrogenatoms, was observed. The bands at 1644 cm-1 and 1466 cm-1 were assigned to the O-H bending of water andCH2, respectively. The bands from 764 to 1157 cm-1 were attributed to the C-O bond stretching.31 A strongabsorption band centered at 1204 cm-1 was the asymmetric stretching vibration of the O=S=O unit of PSSA.The peak at 1003 cm-1 results from the vibrations of the phenyl ring substituted with a sulfonic group.32 Thebroadening of this peak and overlapping with the phenyl ring attached to the sulfonic anion peak located at1126 cm-1 indicates the deprotonation of the sulfonic acid peak in 80/20 PSSA/starch blend ratio. In the sameway, the region of 1160 and 1040 cm-1 of the IR spectra that corresponds to the vibration of the sulphonategroups, showed displacements to 1180 cm-1 and 1033 cm-1 when compared with pure PSSA. This would beattributed to the interactions between the sulphonate group of the PSSA and –OH group of starch. As the starchcontent was increased, the spectra of 50/50 and 20/80 PSSA/starch blend ratios show no characteristic shift inthe peaks. The –OH groups of starch strongly interacting, by hydrogen bonds, with -SO3
- in the blend. Thiscould be the reason of the displacements of the peaks observed in the IR spectra and allows us to assumemiscibility in 80/20 PSSA/starch blend ratio.
Thermal studies

M. Selvakumar et al /Int.J. ChemTech Res.2014,6(7),pp 3589-3601. 3597
Figure 5a-5e. TGA and DTA traces obtained by heating samples from 25 °C to 400 °C at a heating rate of10 °C/min under nitrogen atmosphere for (a) pure PSSA, (b) 80/20, (c) 50/50, (d) 20/80 and (e) purestarch.
Figures 5a-e shows the results of TGA and DTA analysis of PSSA/starch blend ratios and purecomponents. The TGA and DTA curves of pure PSSA film (Figure 5a) showed three stages in which firstweight loss was up to 17% with maximum rate at 58.56 °C and a broad peak in DTA curve in this temperatureregion can be related to the evaporation of unbound water from the polymer blend matrix. The second weightloss starts at 125 °C and ends at 152 °C with 12% weight loss, wherein the glass transition temperature of thePSSA was observed33 and this transition led to the evaporation of the bound water molecules in the PSSAmatrix. This was supported by sharp peak in the DTA curve. Third weight loss starts at 275 °C with maximumrate of 316 °C and it can be related to depolymerisation of PSSA chains. The pure starch (Figure 5e) showedtwo weight loss events centered at 49 °C, which can be related to unbound water. The second thermal event wasobserved at about 274 °C with a maximum rate of 329 °C and was related to the degradation of starch, whichincludes the parallel process of dehydration and demethoxylation33 as also supported in the corresponding DTAcurve.
The thermograms of the blends containing 50% and 20% of the PSSA (Figure 5c and 5d) showedweight loss events similar to the pristine PSSA and starch indicating their immiscibility in the blend system.Nevertheless, the weight loss pattern of the blend containing 80% of PSSA showed (Figure 5b) only eventscharacteristic for pure starch as there is an absence of the thermal event distinctive of pure PSSA at 136-151 °Cand moreover the shift in the degradation thermal event starting at 274 °C with maximum rate at 355 °C. Thisprovides some evidence of interactions between the polymers.[35] Comparatively, this study is supporting theFTIR analysis.
M. Selvakumar et al /Int.J. ChemTech Res.2014,6(7),pp 3589-3601. 3598
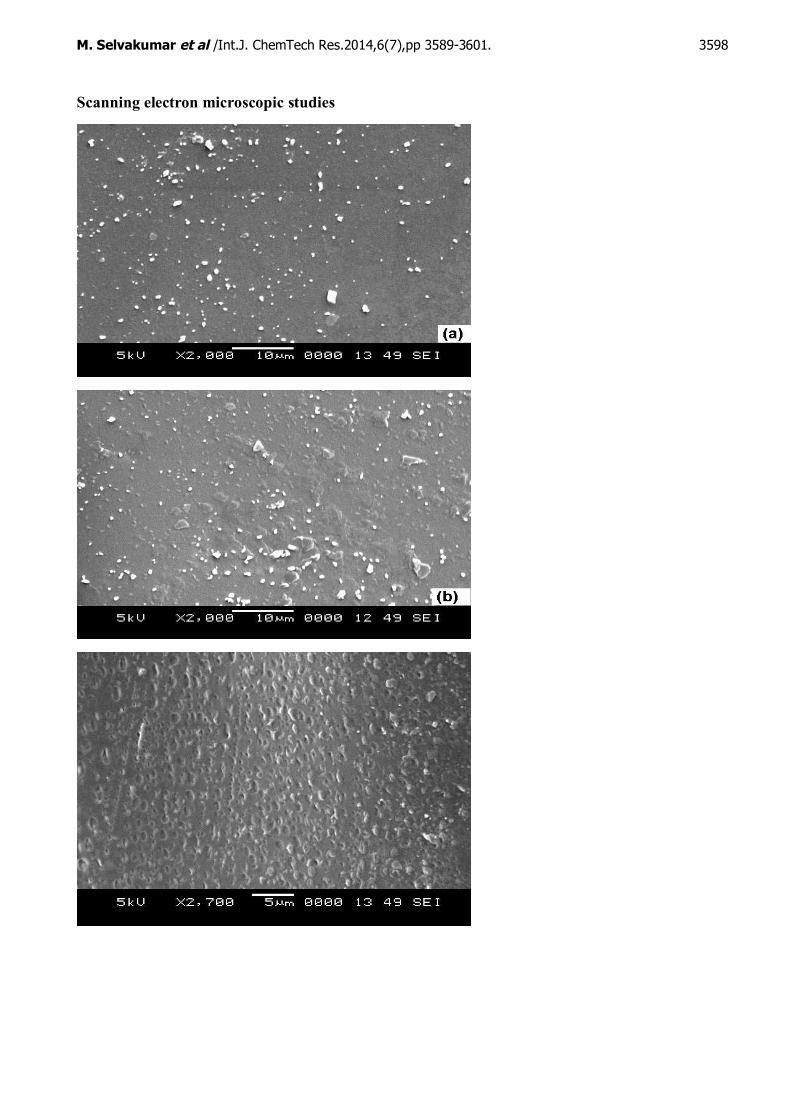
Scanning electron microscopic studies
M. Selvakumar et al /Int.J. ChemTech Res.2014,6(7),pp 3589-3601. 3599
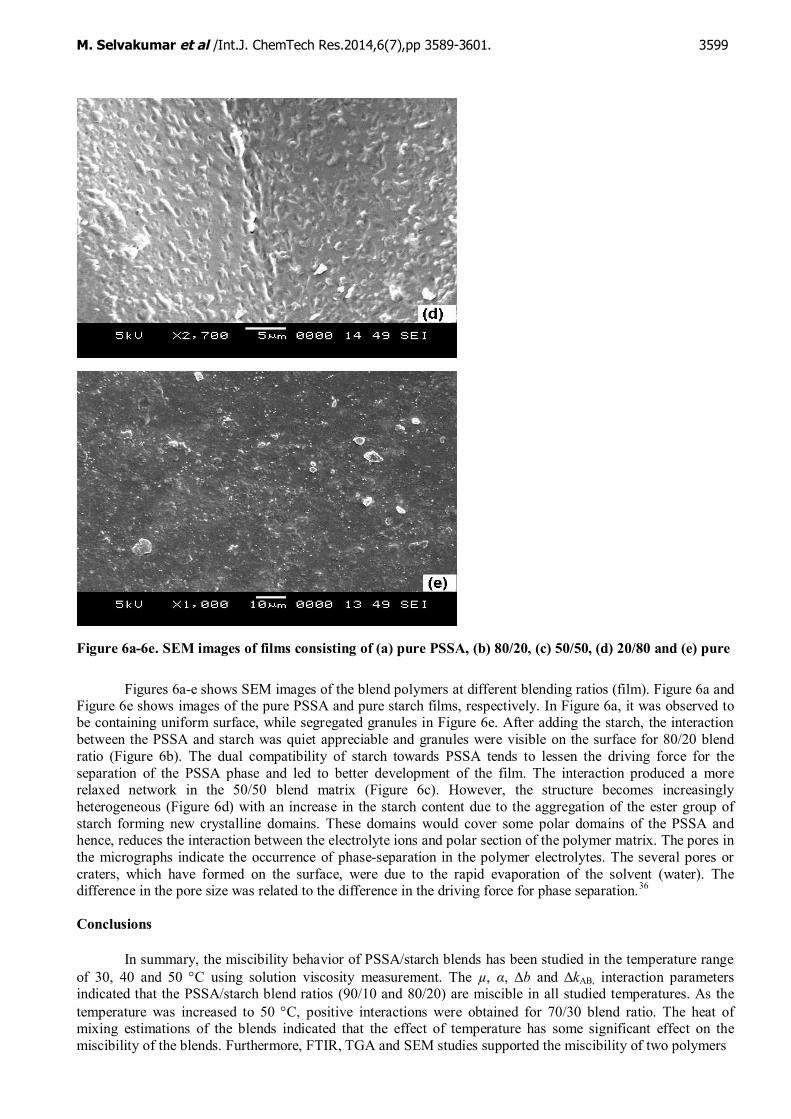
Figure 6a-6e. SEM images of films consisting of (a) pure PSSA, (b) 80/20, (c) 50/50, (d) 20/80 and (e) pure
Figures 6a-e shows SEM images of the blend polymers at different blending ratios (film). Figure 6a andFigure 6e shows images of the pure PSSA and pure starch films, respectively. In Figure 6a, it was observed tobe containing uniform surface, while segregated granules in Figure 6e. After adding the starch, the interactionbetween the PSSA and starch was quiet appreciable and granules were visible on the surface for 80/20 blendratio (Figure 6b). The dual compatibility of starch towards PSSA tends to lessen the driving force for theseparation of the PSSA phase and led to better development of the film. The interaction produced a morerelaxed network in the 50/50 blend matrix (Figure 6c). However, the structure becomes increasinglyheterogeneous (Figure 6d) with an increase in the starch content due to the aggregation of the ester group ofstarch forming new crystalline domains. These domains would cover some polar domains of the PSSA andhence, reduces the interaction between the electrolyte ions and polar section of the polymer matrix. The pores inthe micrographs indicate the occurrence of phase-separation in the polymer electrolytes. The several pores orcraters, which have formed on the surface, were due to the rapid evaporation of the solvent (water). Thedifference in the pore size was related to the difference in the driving force for phase separation.36
Conclusions
In summary, the miscibility behavior of PSSA/starch blends has been studied in the temperature rangeof 30, 40 and 50 °C using solution viscosity measurement. The µ, α, ∆b and ∆kAB, interaction parametersindicated that the PSSA/starch blend ratios (90/10 and 80/20) are miscible in all studied temperatures. As thetemperature was increased to 50 °C, positive interactions were obtained for 70/30 blend ratio. The heat ofmixing estimations of the blends indicated that the effect of temperature has some significant effect on themiscibility of the blends. Furthermore, FTIR, TGA and SEM studies supported the miscibility of two polymers
M. Selvakumar et al /Int.J. ChemTech Res.2014,6(7),pp 3589-3601. 3600
at 80/20 PSSA/starch blend ratio, whilst, another blend samples maintained their individual characteristicfeatures in the blend system.
Acknowledgment
The authors acknowledge with thanks the financial support received from the Defense and ResearchDevelopment Organization (DRDO), Govt. of India, New Delhi.
References
1. Sarasam, A.R., Krishnaswamy, R.K. and Madihally, S.V., Blending chitosan with polycaprolactone:effects on physicochemical and antibacterial properties, Biomacromolecules, 2006, 7, 1131-1138.
2. Wan, Y., Wu, H., Yu, A.X. and Wen, D.J., Biodegradable polylactide/chitosan blendmembranes, Biomacromolecules, 2006, 7, 1362-1372.
3. Liu, Y. and Messmer, M.C., Surface Structures and Segregation of Polystyrene/Poly(methylmethacrylate) Blends Studied by Sum-Frequency (SF) Spectroscopy, Journal of Physics and ChemistryB, 2003, 107, 9774-9779.
4. Zhang, X., Kale, D.M. and Jenekhe, S.A., Electroluminescence of Multicomponent ConjugatedPolymers. 2. Photophysics and Enhancement of Electroluminescence from Blends of Polyquinolines,Macromolecules, 2002, 35, 382-393.
5. Chee, K.K., Determination of polymer-polymer miscibility by viscometry, European Polymer Material,1990, 26, 423-426.
6. Palladhi, R. and Singh, R.P., Ultrasonic and rheological investigations on Interacting blend solutions ofpoly (acrylicacid) with poly (vinylpyrrolidone) or poly(vinylalcohol), European Polymer Journal, 1994,30, 251-257.
7. Toti, U.S. and Aminabhavi, T.M., Different viscosity grade sodium alginate and modified sodiumalginate membranes in pervaporation separation of water + acetic acid and water + isopropanolmixtures, Journal Membrane Science, 2004, 228, 199-208.
8. Kumar, M.S., Bhat, D.K. and Renganathan, N.G., Miscibility of polymethylmethacrylate andpolyethyleneglycol blends in tetrahydrofuran, Journal of Applied Polymer Science, 2009, 111, 452–460.
9. Sun, Z., Wang, W. and Fung, Z., Criterion of polymer-polymer miscibility determined by viscometry,European Polymer Material, 1992, 28, 1259-1261
10. Huggins, M.L., The viscosity of dilute solutions of long-chain molecules. IV. Dependence onconcentration, Journal of American Chemical Society, 1942, 64, 2716-2718.
11. Krigbaum, W. and Wall, F.J., Viscosities of binary polymeric mixtures, Journal of Polymer Science,1950, 5, 505-514
12. Hong, P.D., Huang, H.T. and Chou, C.M., Study of the solvent effect on miscibility betweenpoly(vinyl chloride) and poly(methyl methacrylate) in the solution state – viscometric measurements,Polymer International, 2000, 49, 407-411.
13. Shanks, R.A. and Gunaratne, L.M.W.K., Gelatinization and retrogradation of thermoplastic starchcharacterized using modulated temperature differential scanning calorimetry, Journal of ThermalAnalysis and Calorimetry, 2011, 106, 93-99.
14. Vink, H., A new convenient method for the synthesis of poly(styrenesulfonic acid), MacromolecularChemistry, 1981, 182, 279-281.
15. Sun, J., Jordan, L.R., Forsyth, M. and MacFarlane, D.R., Acid–Organic base swollen polymermembranes, Electrochimica Acta, 2001, 46, 1703-1708.
16. Yu, J., Yi, B., Xing, D., Liu, F., Shao, Z., Fu, Y. and Zhang, H., Degradation mechanism of polystyrenesulfonic acid membrane and application of its composite membranes in fuel cells, Chemical Physics,2003, 5, 611-615.
17. Atanu, B., Willet, J.L., Gordon ,H.S., Finkenstadt, V.L. and Cheng, H.N., Complexation and blendingof starch, poly(acrylic acid), and poly(N-vinyl pyrrolidone), Carbohydrate Polymer, 2006, 65, 397–403.
18. Sudhakar, Y.N., Sowmya, Selvakumar, M. and Krishna Bhat D., Miscibility studies of chitosan andstarch blends in buffer solution, Journal of Macromolecular Science, Part A. Pure Applied Chemistry,2012, 49:12, 1099-1105.

M. Selvakumar et al /Int.J. ChemTech Res.2014,6(7),pp 3589-3601. 3601
19. Dondos, A., Skondras, P., Pierri, E. and Benoit, H., Hydrodynamic crossover in two-polymer mixturesfrom viscosity measurements, Macromolecular. Chemistry, 1983, 184, 2153-2158.
20. Schneier, B.O., Polymer compatibility, Journal of Applied Polymer Science, 1973, 17, 3175-3185.21. Flory, P.J., Principles of Polymer Chemistry, Cornell University Press, New York, 1953.22. Krause, S., Crystal structures and morphology of thin-film, melt-crystallized, and polymerized poly
(ethylene naphthalene), Journal of Macromolecular Science Part C, 1972, 7, 251-255.23. Brandrup, J., Immergut, E. H. and Grurlke, E.A. Polymer hand book, Wiley Interscience: New York,
1999.24. Kern, R.J., Component effects in phase separation of polymer-polymer-solvent systems, Journal of
Polymer Science, 1956, 21, 19-2525. Hildebrand, J.H., Scott, R.L, The Solubility of Non-electrolytes, 3rd ed.; Princeton, NJ:Van Nostrand
Reinhold, 1950.26. Singh, Y.P. and Singh, R.P., Compatibility studies on solutions of polymer blends by viscometric and
ultrasonic techniques, European Polymer Material, 1983, 19, 535-541.27. Varada, R.A., Siddaramaiah and Reddy, R.L., Ultrasonic, refractometric, and viscosity studies of some
polymer blends in solution, Journal of Applied Polymer Science, 1998, 70, 1823-1827.28. Jayaraju, J., Raviprakash, S.D., Keshavayya, J. and Rai, S.K., Miscibility studies on
chitosan/hydroxypropylmethyl cellulose blend in solution by viscosity, ultrasonic velocity, density, andrefractive index methods, Journal of Applied Polymer Science, 2006, 102, 2738-2742.
29. Kumar, M.S. and Bhat, D.K., Miscibility of poly(methylmethacrelate) and cellulose acetate butyrateblends in dimethyl formamide, Indian Journal of Chemical Technology, 2008, 15, 547-554.
30. Kolhe, P. and Kannan, R.M., Improvement in Ductility of Chitosan through Blending andCopolymerization with PEG: FTIR Investigation of Molecular Interactions, Biomacromolecules, 2003,4, 173-180.
31. Mano, J.F., Koniarova, D. and Reis, R.L., Thermal properties of thermoplastic starch/synthetic polymerblends with potential biomedical applicability, Journal of Material Science: Materials in Medicine,2003, 14, 127-135.
32. Mokrini, A. and Acosta, J.L., New ion conducting systems based on star branched block copolymer,Polymer, 2001, 42, 8817-8824.
33. Bozkurt, A., Anhydrous proton conductive polystyrene sulfonic acid membranes, Turkish Journal ofChemistry, 2005, 29, 117-123.
34. Ling-hao, H., Rui, X., De-bin, Y., Ying, L. and Rui, S., Effects of blending chitosan with peg onsurface morphology, crystallization and thermal properties, Chinese Journal of Polymer Science, 2009,27, 501−510.
35. Jingbo Y., Kun L., Xuesi C. and Vitaliy V.K., Miscibility studies of the blends of chitosan with somecellulose ethers, Carbohydrate Polymer, 2006, 63, 238–244.
36. Rhoo, H.J., Kim, H.T., Park, J.K. and Hwang, T.S., Ionic conduction in plasticized PVCPMMA blendpolymer electrolytes, Electrochimica Acta, 1997, 42, 1571-1579.
*****

M. Selvakumar et al /Int.J. ChemTech Res.2014,6(7),pp 3589-3601. 3602
International Journal of ChemTech Research
(Oldest & Original) [www.sphinxsai.com]
CODEN (USA): IJCRGG, ISSN: 0974-4290 [www.sphinxsai.com]
Subject areas: Chemistry, Chemical Technology.
International Journal of ChemTech Research is selected by -
CABI, CAS(USA), SCOPUS, MAPA (India), ISA(India),DOAJ(USA),Index Copernicus, Embasedatabase, EVISA, DATA BASE(Europe), Birmingham Public Library, Birmingham,Alabama, RGATE Databases/organizations for Indexing and Abstracting.
[www.sphinxsai.com]
*****