Embed Size (px)
Citation preview
MIS 420:Big Data, BI, Business Analytics, & Intro to Data Visualization
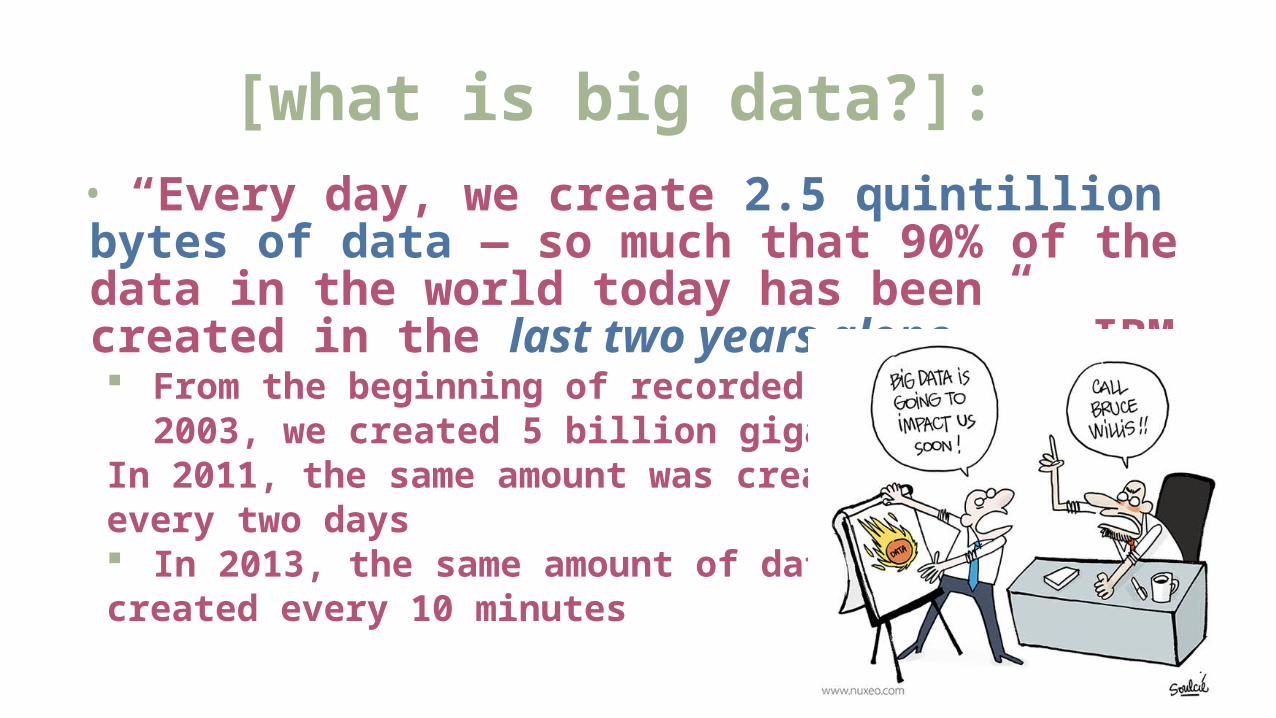
[what is big data?]: • “Every day, we create 2.5 quintillion bytes of data — so much that 90% of the data in the world today has been created in the last two years alone.” – IBM From the beginning of recorded time until 2003, we created 5 billion gigabytes In 2011, the same amount was created
every two days In 2013, the same amount of data was
created every 10 minutes
[the data deluge]: • The Data Deluge: “As the amount of available data grows, the problem of managing the information becomes more difficult.”
• Read The Economist, “The Data Deluge.” http://www.economist.com/node/15579717
• What can we do??
[need for students]: • By 2015, 4.4 million IT jobs globally will be created to support big data, generating 1.9 million IT jobs in the United States• 70% of data is created by individuals – but enterprises are responsible for storing and managing 80% of it.• 1.5 million more data-savvy managers are needed to take full advantage of big data in the United States• BI, Business Analytics, and Data Visualization lie at the heart of the data deluge problem
[what is business intelligence?]:
• CIO.com: “A variety of software applications used to analyze an organization’s raw data. BI as a discipline is made up of several related activities, including data mining, online analytical processing (OLAP), querying and reporting.”• “An umbrella term that combines architectures, tools, databases, analytical tools, applications, and methodologies.” •“Transform raw data into meaningful and useful information for business purposes”
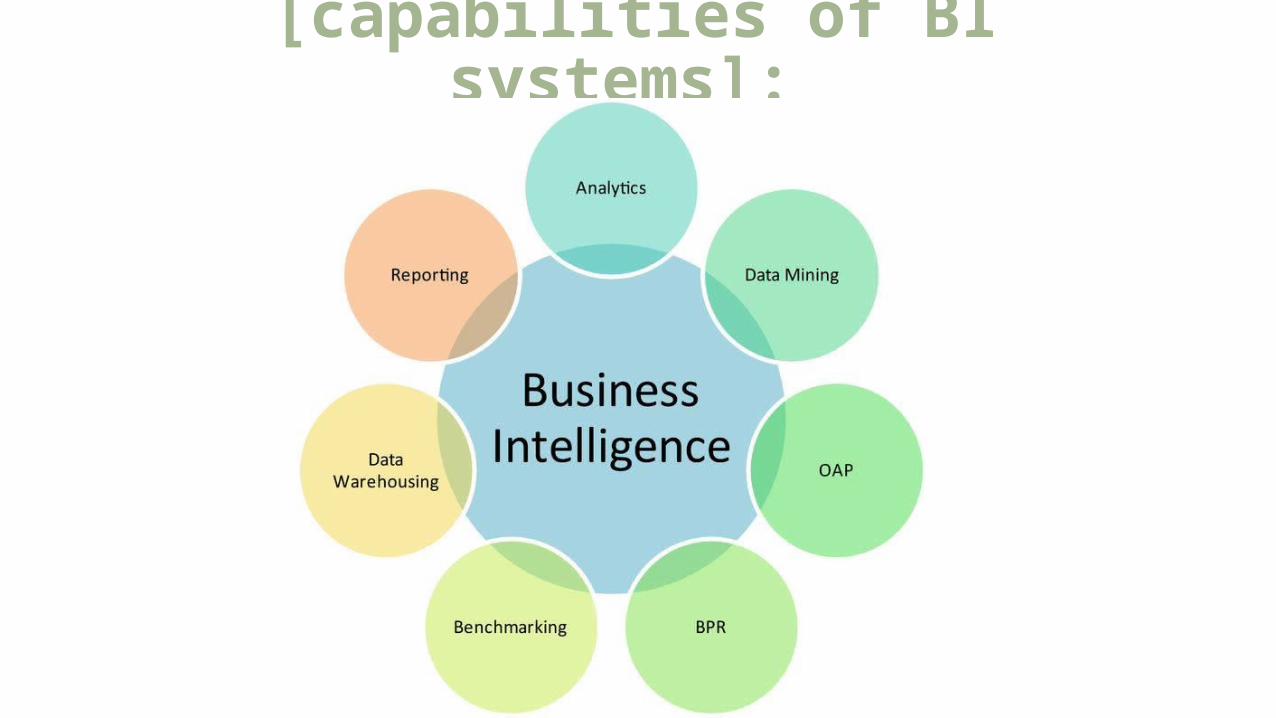
[capabilities of BI systems]:
[who uses BI systems]:
• TONS OF INDUSTRIES• Think about how some of these sectors uses BI systems:
Restaurant chains Grocery Stories Retail News Media Breweries Blogs
• Any more??• Good article: http://www.informationweek.com/how-three-midsize-companies-use-business-intelligence-to-their-advantage/d/d-id/1032629?
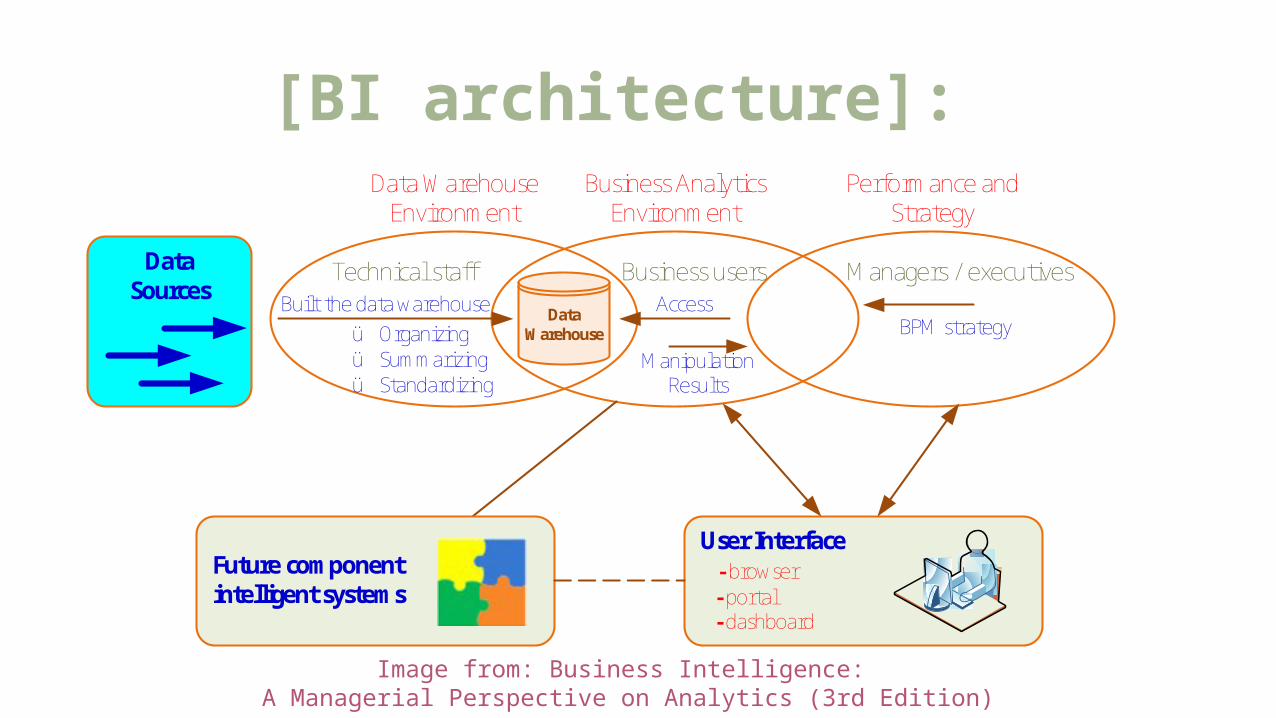
[BI architecture]:
Data Warehouse
Technical staff
Data Warehouse Environment
DataSources
Business Analytics Environment
Performance and Strategy
Business users Managers / executivesBuilt the data warehouse Access
ManipulationResults
BPM strategyü Organizingü Summarizingü Standardizing
Future component intelligent systems
User Interface - browser - portal - dashboard
Image from: Business Intelligence: A Managerial Perspective on Analytics (3rd Edition)
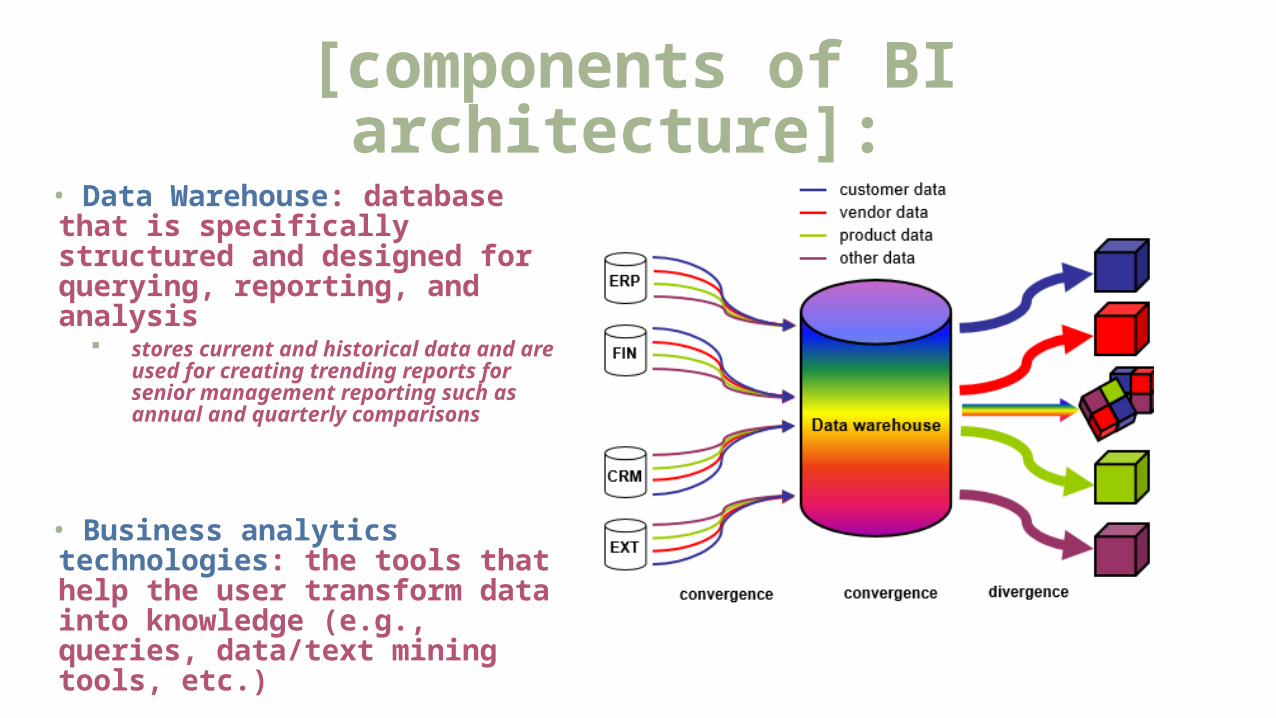
[components of BI architecture]:
• Data Warehouse: database that is specifically structured and designed for querying, reporting, and analysis
stores current and historical data and are used for creating trending reports for senior management reporting such as annual and quarterly comparisons
• Business analytics technologies: the tools that help the user transform data into knowledge (e.g., queries, data/text mining tools, etc.)
[components of BI architecture cont’d]:
• Business performance measurement: (i.e., managing business performance) emerging portfolio of applications within the BI framework that provides enterprises tools they need to better manage their operationso Examples (http://
www.icaew.com/en/technical/business-performance-management-community/tools-and-models/10-bpm-tools-every-manager-needs-to-know):
Planning and budgeting Key Performance Indicators (KPIs) Benchmarking
• User interface: (i.e., dashboards) provide a comprehensive graphical/pictorial view of corporate performance measures, trends, and exceptions.
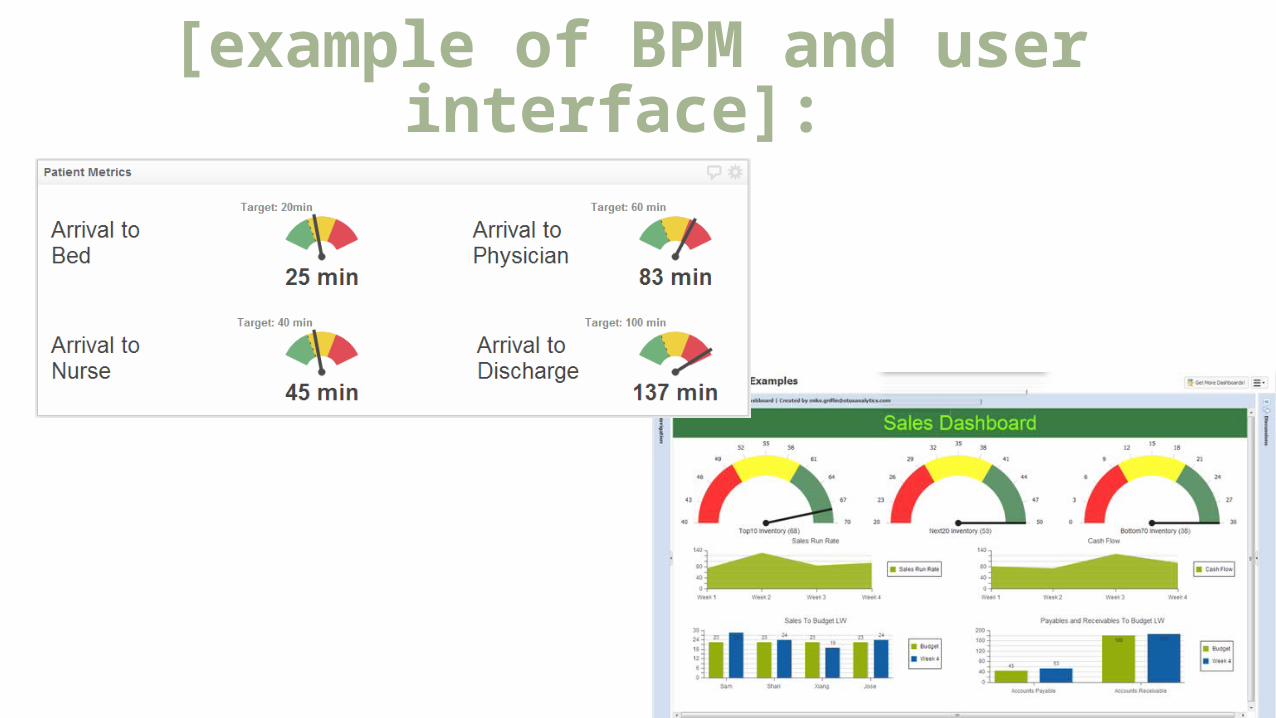
[example of BPM and user interface]:
•
[why is BI important?]:
• Improve decision making, cut costs and identify new business opportunities• Identify inefficient business processes that are ripe for re-engineering• Analyze data quickly • Transforming decision making to a more data/fact/information driven activity• Should help execute the business strategy and not be an impediment for it!
[potential barriers to BI system success]:
• Inaccurate data• Tools not user-friendly• Do not understand company’s business processes• Cultural challenge • Data privacy concerns (ethical issues)
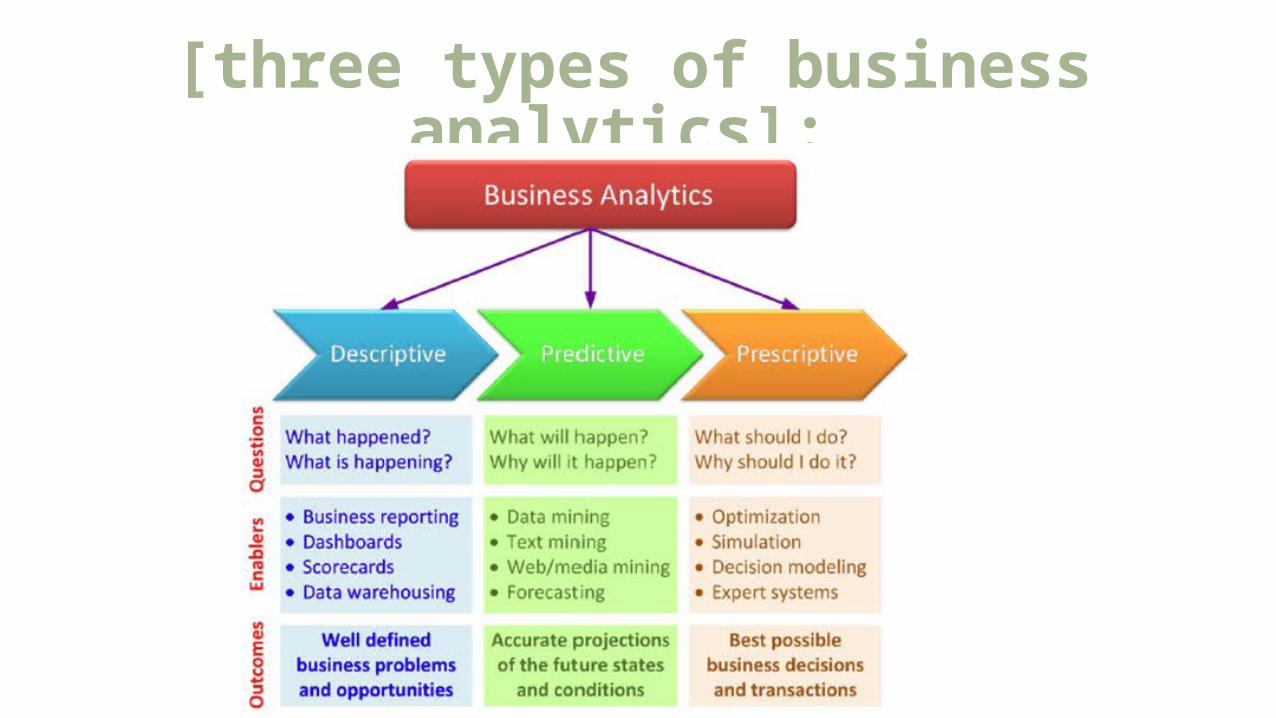
[three types of business analytics]:
[data visualization]: • Data visualization: presentation of data in a pictorial or graphical format• Faster for people to grasp the meaning of many data points when they are displayed in charts and graphs rather than poring over piles of spreadsheets or reading pages and pages of reports.• Why is data visualization important?• Some cool visualizations: http://visualization.geblogs.com/
[to wrap up]:
How can BI, business analytics, and data
visualization help to curb the data deluge?