Embed Size (px)
Citation preview
8/3/2019 Minority Squeeze Final
http://slidepdf.com/reader/full/minority-squeeze-final 1/37
EQ UITY DERIVATIVE
GLO BA
Un d e r s ta n d in g Min o r ity
S q u e e z e - O u t s
We review different minority squeeze-out transaction structures and the legal
sta nda rds ap plica ble in Delawa re la w to these situa tions. W e then present nine
case studies of minority squeeze-outs, review their general characteristics, and
discuss some de scriptive statistics ba sed o n these ca ses. Finally, we de scribe a
methodology for calculating the probability of a bump in deal terms for minority
sque ez e-outs. W e app ly this methodology to a number of pa st dea ls to discuss its
implications.
n The a cquirer may cond uct a tende r offer ra ther tha n ta ke its offer directly to the
target board so as to exert some timing and pricing discipline on the evaluation
process.
n It a pp ea rs tha t a cquirers were a ble to a fford large r premiums in recent transa ctions
partly because of the large decline in target prices over the three-month period
preceding deal announcements.
n As long as the expected upside from a bump in the terms more than compensates
investors for the opp ortunity cost of their ca pital, lowe r (or more ne ga tive) a rbitrag e
spreads imply higher probabilities of a bump, with all else being equal.
n In a typica l minority squee ze -out situation in which the initia l sprea d is nega tive (or
positive, but narrow) a nd risk a rbitrag eurs sta nd to incur losses upon dea l
termination, a lower expected bump implies a higher probability of a bump, all
else being equal.
n As long as the expected upside from a bump in the terms more than compensates
investors for the op portunity cost of their ca pital, the g rea ter the e xpected loss upon
deal termination, the more positive (or less negative) the spread needs to be for
investors to be willing to put on a risk arbitrage position, with all else being equal.
Evren Ergin, Ph.D.
1.201.524.4212
Christian Correa
1.201.524. 4212
U.S. Risk Arbitrage Research
Andrew T. W hittaker
Evren Ergin, Ph.D.
Sugun V. Kapoor
Christian Correa
1.201.524.4212
January 3, 20 02
http:/ / www.lehman.com
8/3/2019 Minority Squeeze Final
http://slidepdf.com/reader/full/minority-squeeze-final 2/37
Understa nding Minority Squeeze -O uts
2 January 3 , 2 0 0 2
Ta b l e o f Co n t e n t s
Introduction..................................................... .............................................. 3
Transaction Structures and Lega l Issues. ... ... ... ... ... ... ... ... ... ... ... ... ... ... ... ... ... ... ... ... .. 5
Transaction Structures and Dea l Outcomes.... ... ... ... ... ... ... ... ... ... ... ... ... ... ... ... ... ... . 5
Legal Standards in Delawa re Law for Minority Squeeze -Outs.. .. .. .. .. .. .. .. .. .. .. .. .. .. .. .. 5
Cha racteristics of Nine Minority Squeeze -Outs and Their Descriptive Statistics.. .. .. .. .. .. . 8
Deal Background and Summaries ..... ...... ...... ..... ...... ..... ...... ...... ..... ...... ..... ...... 8
Q ualitative Characteristics..... ...... ..... ..... ...... ..... ...... ..... ...... ...... ..... ...... ..... .... 13
Descriptive Statistics..... ...... ...... ..... ...... ..... ...... ...... ..... ...... ..... ..... ...... ..... ...... 15
Future Minority Squeeze-O uts?.. ..... ...... ..... ...... ..... ..... ...... ..... ...... ..... ...... ...... . 19
W hat is the Proba bility of a Bump? Probability Analysis in Minority Squeeze -Outs.. .. .. 20
Synopsis of Framework and Main Assumptions.... ... ... ... ... ... ... ... ... ... ... ... ... ... ... .. 20
Results......................................................... ............................................ 21
Conclusion..................................................... ............................................ 30
Appendix.................................................................................. ................. 33 Probab ility Framework........ ...... ..... ...... ..... ...... ...... ..... ...... ..... ..... ...... ..... ...... 33
Trading Considerations...... ..... ..... ...... ..... ...... ..... ...... ...... ..... ...... ..... ...... ...... . 35
8/3/2019 Minority Squeeze Final
http://slidepdf.com/reader/full/minority-squeeze-final 3/37
Understa nding Minority Squeeze -O uts
January 3 , 2 0 02 3
In t roduc t i on
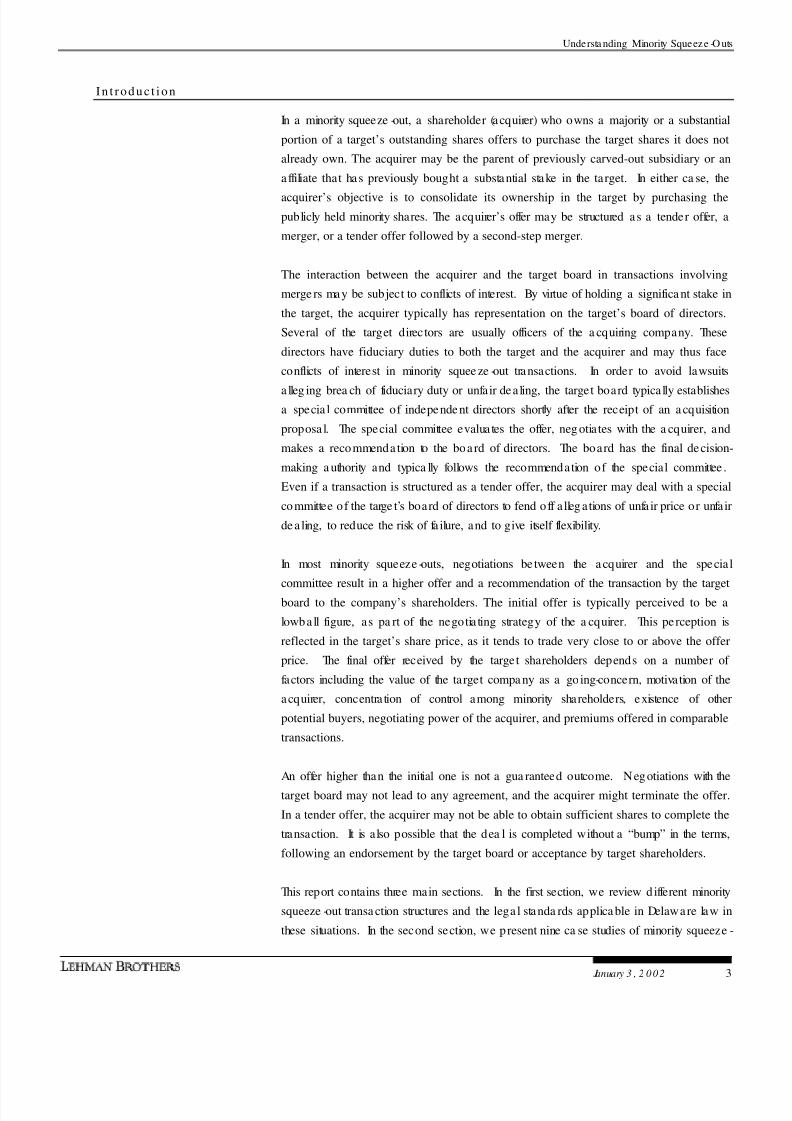
In a minority squeeze -out, a shareholder (acquirer) who owns a majority or a substantial
portion of a target’s outstanding shares offers to purchase the target shares it does not
already own. The acquirer may be the parent of previously carved-out subsidiary or an
affiliate that has previously bought a substantial stake in the target. In either ca se, the
acquirer’s objective is to consolidate its ownership in the target by purchasing the
publicly held minority shares. The acquirer’s offer may be structured as a tender offer, a
merger, or a tender offer followed by a second-step merger.
The interaction between the acquirer and the target board in transactions involving
merge rs may be subject to conflicts of interest. By virtue of holding a significa nt stake in
the target, the acquirer typically has representation on the target’s board of directors.
Several of the target directors are usually officers of the a cquiring company. These
directors have fiduciary duties to both the target and the acquirer and may thus face
conflicts of interest in minority squee ze -out transactions. In order to avoid lawsuits
a lleg ing brea ch of fiduciary duty or unfair dealing, the target board typically establishesa specia l committee of independent directors shortly after the receipt of an a cquisition
proposa l. The special committee evalua tes the offer, neg otiates with the a cquirer, and
makes a recommendation to the board of directors. The board has the final decision-
making a uthority and typica lly follows the recommendation of the special committee .
Even if a transaction is structured as a tender offer, the acquirer may deal with a special
committee o f the targe t’s board of directors to fend off a lleg ations of unfa ir price or unfair
de a ling, to reduce the risk of fa ilure, and to give itself flexibility.
In most minority squeeze -outs, negotiations be tween the a cquirer and the special
committee result in a higher offer and a recommendation of the transaction by the targetboard to the company’s shareholders. The initial offer is typically perceived to be a
lowball figure, as pa rt of the negotia ting strategy of the a cquirer. This perception is
reflected in the target’s share price, as it tends to trade very close to or above the offer
price. The final offer received by the target shareholders depends on a number of
factors including the value of the target compa ny as a go ing-concern, motivation of the
acquirer, concentra tion of control among minority shareholders, existence of other
potential buyers, negotiating power of the acquirer, and premiums offered in comparable
transactions.
An offer higher than the initial one is not a gua ranteed outcome. Negotiations with the
target board may not lead to any agreement, and the acquirer might terminate the offer.
In a tender offer, the acquirer may not be able to obtain sufficient shares to complete the
transaction. It is also possible that the dea l is completed without a “bump” in the terms,
following an endorsement by the target board or acceptance by target shareholders.
This report contains three main sections. In the first section, we review d ifferent minority
squeeze -out transa ction structures and the lega l standa rds applica ble in Delaware law in
these situations. In the second section, we present nine ca se studies of minority squeeze -
8/3/2019 Minority Squeeze Final
http://slidepdf.com/reader/full/minority-squeeze-final 4/37
Understa nding Minority Squeeze -O uts
4 January 3 , 2 0 0 2
outs, review their general characteristics, and discuss some descriptive statistics based on
these ca ses. At the end of the second section, we also list a number of potential minority
squeeze -out situations ba sed on the implica tions of our ana lysis. In the last section, we
describe a methodology for calculating the probability of a bump in dea l terms for
minority squee ze -outs. W e a pply this methodology to a number of pa st dea ls to discuss
its implica tions. In the a ppendix, we present the deriva tion of our methodology and a lsodiscuss trading considerations.
8/3/2019 Minority Squeeze Final
http://slidepdf.com/reader/full/minority-squeeze-final 5/37
Understa nding Minority Squeeze -O uts
January 3 , 2 0 02 5
Tr a n s a ct io n S tr u c tu r e s a n d Le g a l Is s u e s
Tra nsa c tion S t ructures a nd Dea l Outcom es
The timing a nd value of the final offer in a minority squeeze -out may depend on the
transaction structure. The minority squeeze -out may be in the form of proposed merger or
a tender offer made to target shareholders. A structure that involves a me rger may
require the approva l of the targe t board of directors. A tender offer by itself does not
require target board approval, and the acquirer may take the offer directly to target
shareholders.1 In situa tions involving proposed mergers, the actions of target directors
a re subject to the “entire fa irness” standa rd in Delaware courts. In contrast, this standa rd
is not app lica ble to tender offers made directly to target shareholders by controlling
shareholders. The target directors do not have a duty to de monstrate entire fairness in
these tender situations.2 The ina pplica bility of the “entire fa irness” standa rd is likely to
limit the extent of shareholder litiga tion.
Taking the offer directly to sha reholders may also facilita te negotiations with the special
committee, since the acquirer’s decision to initially bypa ss the boa rd could g ive the
board an incentive to become involved in the process. Moreover, in direct tender offers,
the special committee may have less bargaining leverage than it would in a proposed
merger because the target’s decision-making authority is delegated to the target
shareholders ra ther than to the directors.
The acquirer is not obliged to interact with a special committee in direct tender offers.
Completely circumventing the target board, however, is likely to incite greater
shareholder opposition. In addition, the acquirer would have to rely on obtaining
sufficient ta rget shares (90 %) to be able to conduct a short-form merger.3 Rea ching a
compromise with the target’s special committee may serve the a cquirer’s interests byreducing the proba bility of fa ilure in the tender offer.
Leg a l St an da rds i n De l aw a re La w fo r Mino r i ty Sque eze -Ou t s
Squeeze -outs have built-in conflicts of duties a nd high risk of litiga tion. The boa rd of the
target is usually made up of a majority of appointees from the controlling corporation.
These directors have conflicting duties: a duty to the shareholders of the ta rget to
maximize the price pa id and a duty to the sha reholders of the controlling corporation to
minimize the price pa id. In light of this conflict, the decisions of directors a re not
1 Note that the acquirer typically has a control position, and therefore poison pills and change of control
statutes are generally not applicable.
2In Re Siliconix Incorporated Shareholders Litiga tion, Delawa re Cha ncery Court, Consolida ted C. A. No.
18 70 0, John W. N oble, V.C. , Memorandum Opinion (June 1 9, 20 01 ).
3The short-form merger does not require target board or shareholder votes.
8/3/2019 Minority Squeeze Final
http://slidepdf.com/reader/full/minority-squeeze-final 6/37
Understa nding Minority Squeeze -O uts
6 January 3 , 2 0 0 2
reviewed by Delaware courts under the “business judgment rule.”4 Instead, a Delaware
court will app ly the “entire fairness” test.
Entire Fa irness. The “entire fairness” test req uires that the proponents of the transa ction—
not the p la intiffs—b e a ble to show that the transaction was arrived at through “fair
dea ling” and is a t a “fa ir price. ” This standa rd is broad in scope and very demanding.
Fair dealing is a broad standard which looks at the deal timing, the process by which it
was initiated, negotiated, and structured, and how the approval of directors and
shareholde rs wa s obta ined. Full disclosure of materia l information, p articularly to outside
directors, is crucial. This includes information which would ordinarily never be disclosed,
like interna l financial analysis of the de al va luation.
Fair price standards have been set by appraisal cases, even though appraisal rights are
not technica lly invoked. The appraisal laws look a t all relevant factors, including asset
values, market values, comparable transactions, historical earnings, discounted cash
flows, and future prospects. Expert advice and a n opinion from an investment ba nker
that the value is fair are often used to establish a fair price. Fa ir value may exclude
“specula tive elements” and merger synergies or cost savings. Fa ir value does not include
a minority discount reflecting the lack of control.
A fa ir price does not necessa rily imply fair dea ling and vice versa. Broadly speaking,
both elements of the test must be satisfied a nd court precedents exist where a fair price
was found yet plaintiffs won the case on fair dealing grounds as well as the converse.
Howe ver, in a squeeze -out the dominant concern is fair price, followe d by disclosure of
materia l information. Broader indica tions of fa ir dea ling beyond d isclosure are not
weighed as hea vily.
Role o f the Specia l Co mmittee . The most common technique for sa tisfying the court’s
entire fairness standa rd is the appointment of a special committee. A committee of
outside directors who are disinterested may be appointed by the target’s board of
directors to a pprove the transaction. This committee negotia tes on be half of the e ntire
board, representing the interests of minority shareholders and protecting the controlling
compa ny from leg al liability.
A special committee must be disinterested a nd ca pa ble of performing its task. This
involves being informed, having appropriate incentives and having access to good,
independent lega l and financial advice. W ith this support a special committee should
see k the best possible price without rejecting a transaction that is in the interest of
minority shareholders. A concomitant of this is tha t the controlling corporation is limited
4 The business judgment rule shields directors from being second-guessed by courts. A court app lying the
rule will de fer to the business judgment of the direc tors. A director ca n still be liable for gross negligence
under the business judgment rule.
8/3/2019 Minority Squeeze Final
http://slidepdf.com/reader/full/minority-squeeze-final 7/37
Understa nding Minority Squeeze -O uts
January 3 , 2 0 02 7
in its ability to withhold information from the specia l committee or use certa in tactics,
including “take-it-or-lea ve-it” offers. Note that the specia l committee does not necessarily
have the power to “shop” the company to other buyers, and the controlling company is
not obliged to follow through on its offer. A controlling company can withdraw in light
of unfavorable negotiations before a definitive agreement is signed.
A squeeze -out may proceed over the op position of the spe cial committee . Techniques
which may be used to a void viola ting entire fairness include granting appraisal rights to
a ll minority shareholders, a llowing the minority shareholders to receive sha res in the
controlling corporation as consideration, thus participating in merger synergies, or
conditioning the transaction on a vote of the minority shareholders.
8/3/2019 Minority Squeeze Final
http://slidepdf.com/reader/full/minority-squeeze-final 8/37
Understa nding Minority Squeeze -O uts
8 January 3 , 2 0 0 2
Cha ra c te r i s t ic s o f N ine Mino r it y Squ ee ze -Ou t s a nd The ir Desc r ip t i ve S t a t is t ic s
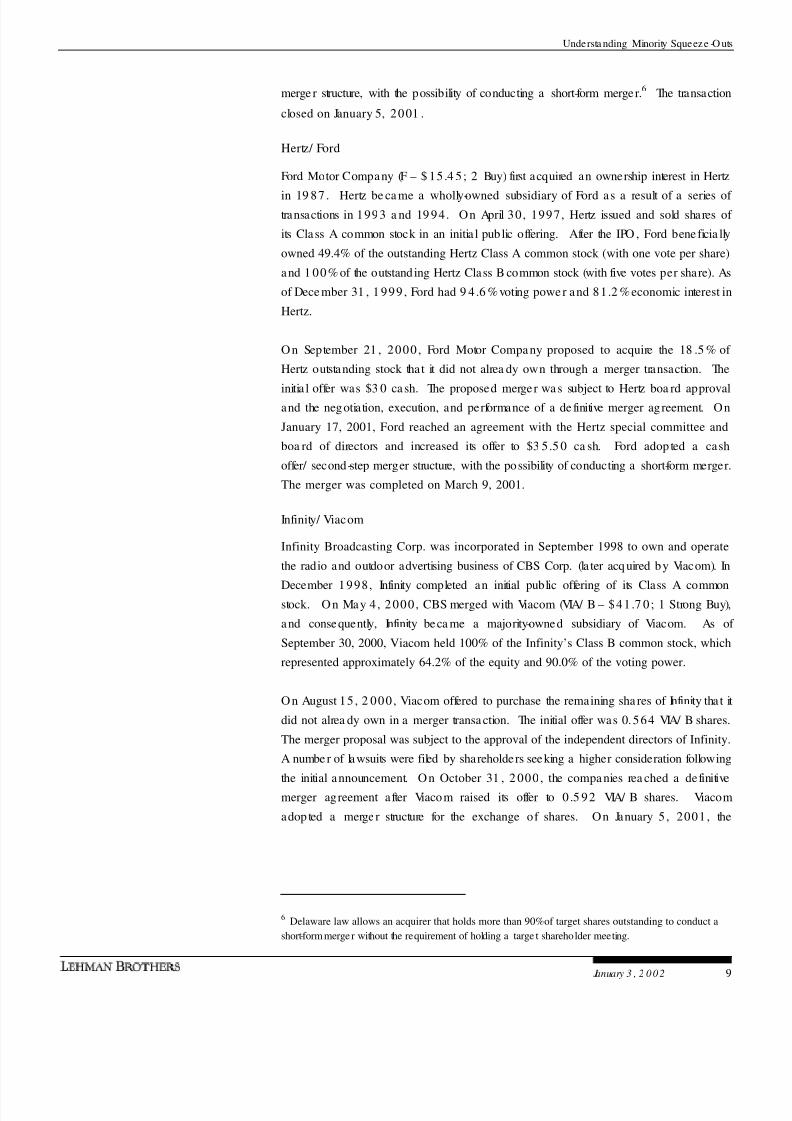
In this section, we highlight nine minority squeeze -out transactions. These dea ls as well
as their initial and final terms are listed in Figure 1 . Six of these transactions (la te
2000/ ea rly 20 01) are fa irly high-profile dea ls that took place in a bull market and
a ttracted considerable a rbitrage interest. The remaining three transactions took place
recently in a bea r market and were resolved quickly. Figure 2 9 a t the end of the report
includes additiona l information about the timing, p remiums, values a nd market conditions
with respe ct to each squeeze -out. Below, we first provide a brief background and
synopsis for ea ch of the transactions. Following the summaries, we discuss their general
characteristics and any statistical patterns that emerge from the case studies.
Figure 1: Initia l a nd Final Dea l Considera tions in Highlighted Transa ctions
Deal Ann. Date Bump Date Closing Date Initial Ca sh Final Ca sh Initial Stock Fina l Stock
AXA Financial / AXA 3 0-Aug-00 18 -Oct-00 5-Jan-0 1 $32 .10 $3 5.7 5 0. 27 1 0. 29 5
Hertz / Ford 2 1 -Sep-0 0 1 7 -Jan-0 1 9 -Mar-01 $3 0.00 $3 5.50 -- --
Infinity Broad ca sting / Viacom 1 5-Aug-00 31 -Oct-00 2 3 -Feb-0 1 -- -- 0 .5 64 0 .5 92Delhaize America / Delhaize Le Lion 7 -Se p-00 1 7 -Nov-00 26 -Apr-01 -- -- 0 .3 5 0.4
Avis Group / Cenda nt 1 5 -Aug-00 1 3 -Nov-00 1 -Mar-01 $2 9.00 $3 3.00 -- --
Sodexho Marriott Services / Sodexho Alliance 2 5 -Jan-0 1 2 -May-01 2 1 -Jun-0 1 $2 7.00 $3 2.00 -- --
TyCom / Tyco 4 -Oct-0 1 19 -Oct-01 1 8 -Dec-01 -- -- 0 .299 7 0.31 33
Prodigy Communications / SBC 2 4-Sep-0 1 18 -Oct-01 7 -Nov-01 $5 .4 5 $6 .6 0 -- --
TD W aterhouse / Toronto-Dominion Bank 1 0-Oct-0 1 30 -Oct-01 27 -Nov-0 1 $9 .0 0 $9 .5 0 -- --
Source: Lehman Brothers, Bloomb erg
Dea l Ba ckg round a nd Summ a r ie s
AXA Fina ncia l/ AXA
AXA Group (AXA – $ 20 .1 5 ; N ot ra ted)5 made an investment in Equitable Companies(subsequently AXA Financial) in July 19 91 . On July 22 , 1 992 , Equitable Companies
completed a n initia l public offering of common shares. After the IPO, AXA owned 48%
of Equitab le common stock. As of the time of the minority squeeze -out, AXA owned
60.3 % of AXA Financial shares outstanding.
O n August 30 , 2 000 , AXA Group proposed to acquire the 3 9.7 % of AXA Financial
shares outstanding that it did not a lready own. The proposa l wa s subject to the
approval of AXA Financial board of directors. The initial offer consisted of 0.271 AXA
shares and $ 32.1 0 cash. AXA Financial formed a special committee o f independent
directors to review the offer. O n Octobe r 18 , 2 000 , the special committee approvedthe sweetened offer of 0 .2 95 AXA shares and $ 35 .7 5 cash, and the companies a lso
signed a definitive merger agreement. AXA adopted a n exchange offer/ second-step
5 All prices are a s of the December 21 , 2 001 market close.
8/3/2019 Minority Squeeze Final
http://slidepdf.com/reader/full/minority-squeeze-final 9/37
Understa nding Minority Squeeze -O uts
January 3 , 2 0 02 9
merge r structure, with the possibility of conducting a short-form merger.6 The transaction
closed on January 5, 2001 .
Hertz/ Ford
Ford Motor Company (F – $ 15 .4 5 ; 2 Buy) first acquired an ownership interest in Hertz
in 19 87 . Hertz be ca me a wholly-owned subsidiary of Ford as a result of a series of transactions in 1993 a nd 19 94. On April 30, 1997, Hertz issued and sold shares of
its Class A common stock in an initia l public offering. After the IPO , Ford bene ficia lly
owned 49.4% of the outstanding Hertz Class A common stock (with one vote per share)
and 1 00% of the outstanding Hertz Class B common stock (with five votes per share). As
of Dece mber 31 , 1 999 , Ford had 9 4 .6 % voting powe r and 81.2 % economic interest in
Hertz.
O n September 21 , 2000 , Ford Motor Compa ny proposed to acquire the 18 .5 % of
Hertz outstanding stock that it did not alrea dy own through a merger transaction. The
initia l offer was $3 0 ca sh. The proposed merger wa s subject to Hertz boa rd approvaland the negotiation, execution, and performance of a de finitive merger agreement. On
January 17, 2001, Ford reached an agreement with the Hertz special committee and
boa rd of directors and increased its offer to $3 5.5 0 ca sh. Ford adop ted a cash
offer/ second-step merger structure, with the possibility of conducting a short-form merger.
The merger was completed on March 9, 2001.
Infinity/ Viacom
Infinity Broadcasting Corp. was incorporated in September 1998 to own and operate
the radio and outdoor advertising business of CBS Corp. (la ter acq uired by Viacom). In
December 1 998, Infinity completed an initial public offering of its Class A commonstock. O n May 4 , 2 000 , CBS merged with Viacom (VIA/ B – $41 .7 0 ; 1 Strong Buy),
and consequently, Infinity beca me a majority-owned subsidiary of Viacom. As of
September 30, 2000, Viacom held 100% of the Infinity’s Class B common stock, which
represented approximately 64.2% of the equity and 90.0% of the voting power.
O n August 15 , 2 000 , Viacom offered to purchase the remaining sha res of Infinity tha t it
did not alrea dy own in a merger transa ction. The initial offer was 0. 564 VIA/ B shares.
The merger proposal was subject to the approval of the independent directors of Infinity.
A numbe r of lawsuits were filed by shareholders seeking a higher consideration following
the initial announcement. O n October 31 , 2 000 , the compa nies rea ched a definitive
merger agreement after Viacom raised its offer to 0 .5 92 VIA/ B shares. Viacom
adop ted a merger structure for the exchange of shares. On January 5 , 2001 , the
6 Delaware law allows an acquirer that holds more than 90%of target shares outstanding to conduct a
short-form merger without the requirement of holding a targe t shareholder meeting.
8/3/2019 Minority Squeeze Final
http://slidepdf.com/reader/full/minority-squeeze-final 10/37
Understa nding Minority Squeeze -O uts
10 January 3 , 2 0 0 2
companies announced that Infinity would hold a shareholder meeting to seek approval
on the merger.7 The transaction closed on February 23, 2001.
Delhaize America/ Delhaize Le Lion
Delha ize America , Inc. was incorpora ted in North Carolina in 195 7 . As of 200 0 , it
wa s the la rgest operating compa ny in the globa l supermarkets group of Delhaize Le Lion(Brusse ls: DELB – e58.7 0 ; 2 Buy). Before the minority squeeze -out transaction, the
Delhaize Group owned approximately 37% of Delhaize America's Class A (non-voting)
common stock and a pp roximately 56% of its Class B (voting) common stock, or
approximately 45% of Delhaize America 's total shares outstanding.
O n September 9 , 2 000 , Delhaize Le Lion proposed to acquire, contingent on the
approval of Delhaize America’s boa rd and independent directors, 55 % of Delhaize
America ’s tota l shares outstanding that it did not a lrea dy own. The initial offer was 0.35
DELB shares for every share of Delhaize America. The companies rea ched an
agreement for a statutory share exchange under North Ca rolina Corporation Law onNovember 1 7 , 2 000 a t a fina l offer of 0 .4 0 DELB shares. The share exchange was
completed on April 26, 2001.
Avis Group/ Cendant
On October 17, 1996, Cendant (CD – $19.60; 1 Strong Buy) purchased Avis, Inc.
and its subsidiaries (subsequently Avis Group Holdings). O n September 24 , 1 997 , Avis
completed an initia l public offering of its common stock. Before the minority squeeze -out
transaction, Cendant owned approximately 18% of Avis' outstanding common shares
and also owned preferred stock of an Avis subsidiary that was convertible into Avis
shares. These p referred shares were convertible into a combination of non-voting a ndvoting Avis Group common shares that would have resulted in Cendant having up to a
20% voting interest in Avis Group and a pproximately a 3 3% economic interest.
O n August 15 , 2000 , C enda nt Corporation made a preliminary and non-binding
proposal to acquire all of the outstanding shares of Avis Group that it did not already
own for $2 9 per share in cash. Avis appointed a special committee of independent
directors to evaluate the proposal. Some Avis shareholders filed class action complaints
at the Delaware Chancery Court, cla iming that the Cenda nt offer was inadequa te. The
companies reached a definitive merger agreement on November 13, 2000, after
Cendant increased the offer to $3 3 pe r share. Cendant adopted a ca sh merger
structure for the transa ction. The merger was conditioned upon a pproval of a majority of
the votes ca st by Avis Group stockholders who were unaffiliated with Cendant. The
merger closed on March 1, 2001.
7 The decision to hold a shareholder meeting came after a Delaware Chancery court decision regarding
Digex created uncertainty ab out whether such a vote might be required for Delawa re corporations.
8/3/2019 Minority Squeeze Final
http://slidepdf.com/reader/full/minority-squeeze-final 11/37
Understa nding Minority Squeeze -O uts
January 3 , 2 0 02 11
Sodexho Marriott Services/ Sodexho Alliance
O n March 27 , 1998 , Sodexho Ma rriott Services (Marriott a t the time) consummated a
series of transa ctions that, among o thers, resulted in the acquisition of the North
America n operations of Sodexho Alliance, S.A. (Paris: SW – -e46.76; 3 Market
Perform). Concurrent to this transaction, a ll busine sses of Marriott other than food
services and the facilities mana ge ment business were spun off to Marriott’s shareholdersthrough a special dividend of stock in a ne w company—Marriott Internationa l, Inc.
Following the transactions, the former Ma rriott wa s rena med Sodexho Marriott Services,
Inc. As part of the transactions, Sodexho Marriott Services and Sodexho entered into
arrangements under which Sodexho provided Sodexho Marriott Services with a variety
of consulting and advisory services and guaranteed a portion of its indebtedness.
Sodexho Alliance has owned an approximate 48% stake in Sodexho Marriott Services
ever since the formation of the company.
O n January 25, 2 001, Sode xho Alliance proposed to acquire a ll the Sodexho Marriott
Services shares tha t it did not alrea dy own for $2 7 in ca sh per share. This offer wasconditional on due diligence and negotiation and execution of a definitive merger
agreement. Following the a nnouncement, a number of class action compla ints were filed
in the Dela wa re Chancery Court a lleg ing tha t the Sodexho Alliance offer did not provide
adequate value to Sodexho Marriott shareholders and that the defendants were
breaching their fiducia ry duties.
On May 2, 2001, the companies reached a definitive merger agreement after Sodexho
Alliance increa sed its offer to $ 3 2 and the Sodexho Ma rriott Services board of directors
received the recommendation of its specia l committee . Sodexho Alliance adopted a
ca sh offer/ second-step merger structure, with the possibility of conducting a short-form
merger. The transaction was completed on June 2 1 , 2 001 .
TyCom/ Tyco
TyCom was incorporated on March 8, 2000 as a wholly-owned subsidiary of Tyco
(TYC – $ 58 .2 0 ; 1 Strong Buy) to serve a s the holding company for its undersea fiber
optic cable communica tions business. On July 27 , 2 000, TyCom sold approximately
14% of its common shares in an initial public offering. Before the minority squeeze -out,
Tyco he ld 8 9% of TyCom common shares.
O n October 4 , 2 001 , Tyco International offered to a cquire the outstanding 11 %minority
interest in TyCom to bring TyCom back into the Tyco corporate structure as a wholly-
owned subsidia ry. The initial offer was 0.2 997 Tyco shares. The offer was conditional
on the negotia tion a nd execution of a definitive merge r agreement. The transaction was
cha lleng ed in an investor lawsuit a lleg ing that Tyco was using its majority control of
TyCom to reach an agreement that did not give TyCom's minority shareholders an
ade qua te or fa ir price for their stock. The companies rea ched a de finitive a greement on
O ctober 19 , 200 1 , after Tyco increa sed its offer to 0.3 133 TYC shares. The
transaction closed on December 18, 2001.

8/3/2019 Minority Squeeze Final
http://slidepdf.com/reader/full/minority-squeeze-final 12/37
Understa nding Minority Squeeze -O uts
12 January 3 , 2 0 0 2
Prodigy/ SBC
O n February 11 , 1 999 , Prodigy completed an initial public offering of its stock. In May
2000, Prodigy and SBC (SBC – $39.30; 1 Strong Buy) established a strategic
operating partnership in which SBC acquired an initial indirect interest in Prodigy of
approximately 43%. Per the terms of the partnership, SBC ha d the right to exchange its
units in the ope rating partnership for shares of Class A common stock. Direct ownershipof Class A shares was concentrated among Carlos Slim Helu, Carso Global Telecom
and Telmex, whose collective ownership of Prodigy Class A common stock represented
approximately 34 .3 % of the voting power of a ll outstanding securities of Prodigy.
O n September 24 , 2 001 , SBC announced a tender offer for the shares of Prodigy that it
did not a lready own for $5 .4 5 p er share. SBC indicated that it would commence the
offer a s soon a s practica ble. A number of class action compla ints were filed in the
Delaware Chancery Court, alleging that the SBC offer did not provide sufficient value to
Prodigy shareholders, Prodigy directors faced conflicts of interest, a nd that certain
directors were acting to better SBC interests at the expense of Prodigy publicshareholders.
Prodigy formed a special committee of independent directors to review the offer and
advised its shareholders not to take any action until the board had a chance to complete
its review. In ea rly October, SBC representatives a nd a special committee of Prodigy
independent directors enga ged in discussions regarding the offer. O n October 1 5 ,
20 01 , the companies informed the p ublic that the special committee informally
suggested a tender offer price of $6.55, whereas SBC indicated the possibility of
increa sing the offer price to the $6 .0 0 to $6 .2 5 range. O n O ctober 18 , 2001 , the
companies reached a definitive agreement on a revised tender offer according to which
SBC would pa y $6 .6 0 per share. The transaction was structured a s a ca sh
tender/ second-step merge r, with the possibility of a short-form merger. The transa ction
closed on November 7 , 2 0 01 .
TD Wa terhouse Group/ Toronto-Dominion Bank
W aterhouse Investor Services, Inc. (now TD Waterhouse) was acquired in 1996 by
Toronto-Dominion Bank (TD – $ 25 .5 2 ; Not rated). O n June 23 , 1999 , TD Bank
conducted a n initia l public offering of TD W aterhouse stock.
O n October 10 , 2 001 , Toronto-Dominion Bank announced a ca sh tender offer for all of
the approximately 12% of the outstanding shares of TD Waterhouse tha t it (and its
subsidiaries) did not alrea dy own for $9 .0 0 per share. The offer was conditioned upon
the a cquisition of sufficient shares such that Toronto-Dominion Bank would own a t lea st
9 0 % of the outstanding TD W aterhouse Group common stock (so as to be a ble to do a
short-form merger). TD indica ted initia lly that the commencement and completion of the
tende r offer or the consummation of the merger did not require a ny approva l by the TD
W aterhouse boa rd of directors.
8/3/2019 Minority Squeeze Final
http://slidepdf.com/reader/full/minority-squeeze-final 13/37
Understa nding Minority Squeeze -O uts
January 3 , 2 0 02 13
Following announcement, severa l investors filed class a ction complaints in the Delawa re
Chancery Court po inting to existing conflicts of interest and a lleg ing that Toronto-
Dominion was acting in its self interest a t the expense of TD Waterhouse public
shareholders. O n October 30 , 2001 , Toronto-Dominion Bank increased the offer to
$9.50 per share in cash and revised the completion condition of the tender to require a
majority of the p ublicly-held sha res. The revision resulted from discussions be tweenToronto Dominion and the special committee of independent TD W aterhouse d irectors.
The non-tendered shares were a cquired through a short-form merger. The tender expired
on November 14, 2001 and the transaction closed on November 27, 2001.
Qu a lita t ive Cha ra cter is t ics
Minority Squeeze-Out Process and Structure
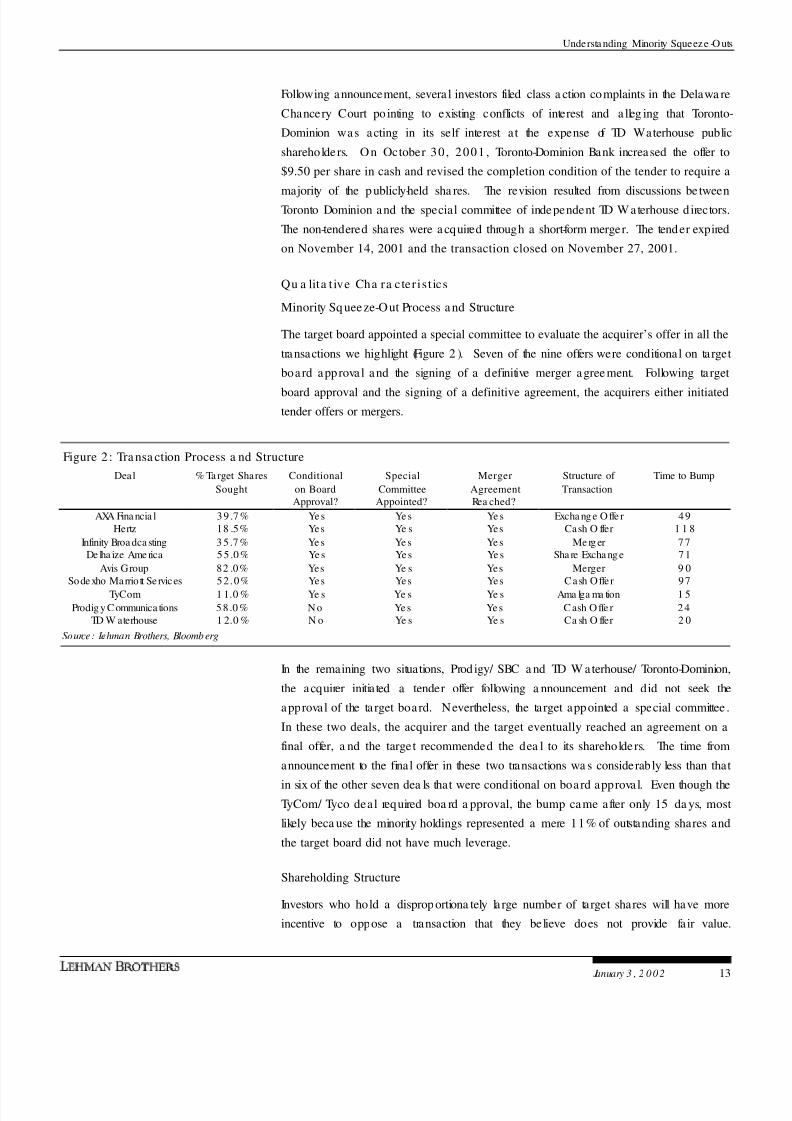
The target board appointed a special committee to evaluate the acquirer’s offer in all the
transactions we highlight (Figure 2 ). Seven of the nine offers were conditional on target
board approva l and the signing of a definitive merger agree ment. Following ta rget
board approval and the signing of a definitive agreement, the acquirers either initiatedtender offers or mergers.
Figure 2: Transa ction Process a nd Structure
Deal % Ta rget Shares
Sought
Conditional
on BoardApproval?
Special
CommitteeAppointed?
Merger
AgreementRea ched?
Structure of
Transaction
Time to Bump
AXA Fina ncia l 3 9 .7 % Ye s Ye s Ye s Excha ng e O ffe r 4 9Hertz 18 .5% Yes Ye s Yes Cash O ffer 1 1 8
Infinity Broa dca sting 3 5 .7 % Ye s Ye s Ye s Me rg er 7 7De lha ize Ame rica 5 5 .0 % Ye s Ye s Ye s Sha re Excha ng e 7 1
Avis Group 82 .0% Yes Ye s Yes Merger 9 0Sodexho Marrio tt Services 52 .0% Yes Yes Yes Cash Offer 97
TyCom 1 1.0 % Ye s Ye s Ye s Ama lga ma tion 1 5
Prodig y C ommunica tions 5 8 .0 % N o Ye s Ye s C ash O ffe r 2 4TD W aterhouse 1 2.0 % N o Ye s Ye s Ca sh O ffer 2 0
Source: Lehman Brothers, Bloomb erg
In the remaining two situations, Prod igy/ SBC a nd TD W aterhouse/ Toronto-Dominion,
the acquirer initia ted a tender offer following a nnouncement and did not seek the
approval of the ta rget board. Nevertheless, the target appointed a special committee .
In these two deals, the acquirer and the target eventually reached an agreement on a
final offer, a nd the target recommended the dea l to its shareholders. The time from
announcement to the final offer in these two transactions wa s considerably less than that
in six of the other seven dea ls that were conditional on board approva l. Even though theTyCom/ Tyco deal required boa rd a pproval, the bump came after only 15 da ys, most
likely beca use the minority holdings represented a mere 11% of outstanding shares and
the target board did not have much leverage.
Shareholding Structure
Investors who hold a disprop ortiona tely la rge number of target shares will have more
incentive to oppose a transaction that they believe does not provide fair value.
8/3/2019 Minority Squeeze Final
http://slidepdf.com/reader/full/minority-squeeze-final 14/37
Understa nding Minority Squeeze -O uts
14 January 3 , 2 0 0 2
Concentration of shareholdings will make it more difficult for an acquirer to obtain the
necessary vote in a merger or the necessary shares in a tender offer, if such investors are
not appea sed. In fact, large shareholders may a lso hold positions on the target boa rd.
Consequently, the acquirer may find it in its interest to negotiate with the target board
and revise its offer in the presence of more concentrated shareholdings.
It is interesting to note that the minority shareholdings in Prodigy and TD Waterhouse
were not concentrated. These two dea ls are a lso the ones where the a cquirers made
their offers directly to targe t shareholde rs.
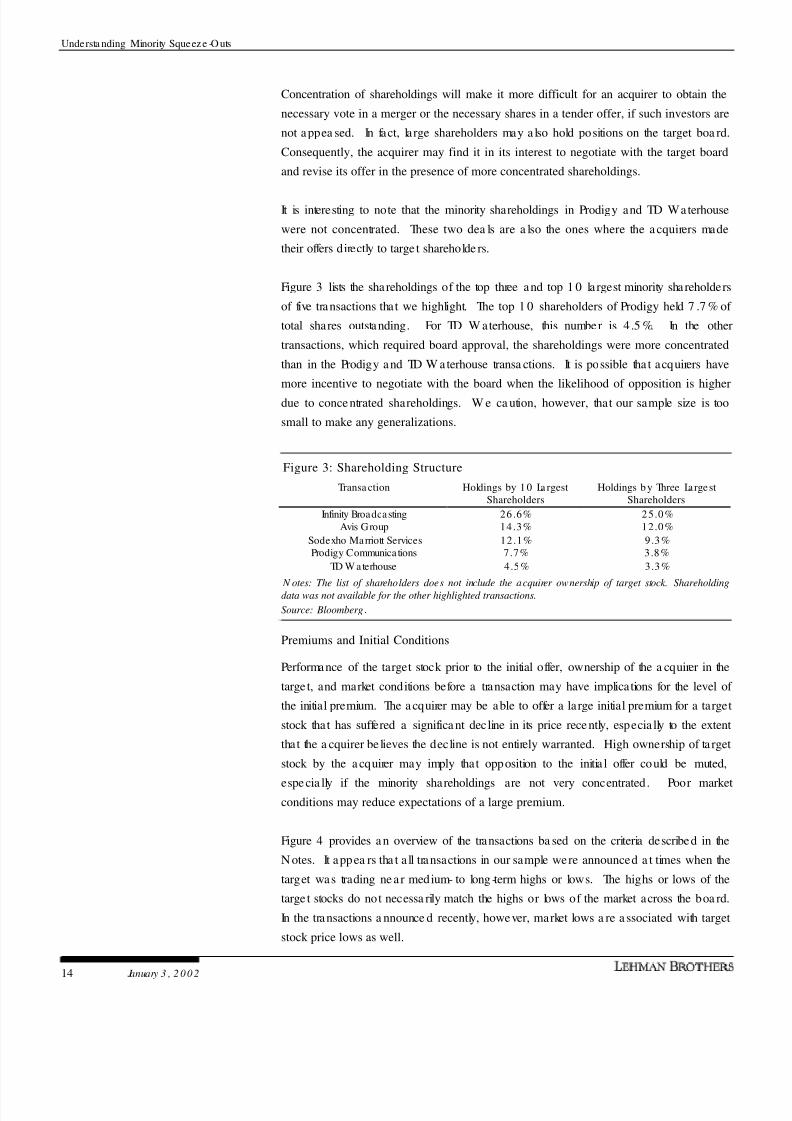
Figure 3 lists the shareholdings of the top three and top 1 0 la rgest minority shareholders
of five transactions that we highlight. The top 1 0 shareholders of Prodigy held 7 .7 % of
total shares outstanding. For TD W aterhouse, this number is 4 .5 %. In the other
transactions, which required board approval, the shareholdings were more concentrated
than in the Prodigy and TD W aterhouse transa ctions. It is possible tha t acquirers have
more incentive to negotiate with the board when the likelihood of opposition is higher
due to conce ntrated shareholdings. W e ca ution, however, that our sample size is too
small to make any generalizations.
Figure 3: Shareholding Structure
Transa ction Holdings by 1 0 La rgestShareholders
Holdings b y Three LargestShareholders
Infinity Broadcasting 26 .6% 25.0%Avis Group 14 .3% 12.0%
Sodexho Marriott Services 12 .1% 9.3%Prodigy Communica tions 7 .7% 3.8%
TD W aterhouse 4 .5% 3.3%
N otes: The list of shareholders does not include the acquirer ownership of target stock. Shareholding
data was not available for the other highlighted transactions.
Source: Bloomberg.
Premiums and Initial Conditions
Performance of the target stock prior to the initial offer, ownership of the a cquirer in the
targe t, and market conditions before a transaction may have implications for the level of
the initial premium. The a cquirer may be able to offer a large initial premium for a target
stock that has suffered a significa nt decline in its price rece ntly, especia lly to the extent
that the a cquirer be lieves the decline is not entirely warranted. High ownership of ta rget
stock by the a cquirer may imply that opposition to the initia l offer could be muted,
espe cia lly if the minority shareholdings are not very concentrated. Poor marketconditions may reduce expectations of a large premium.
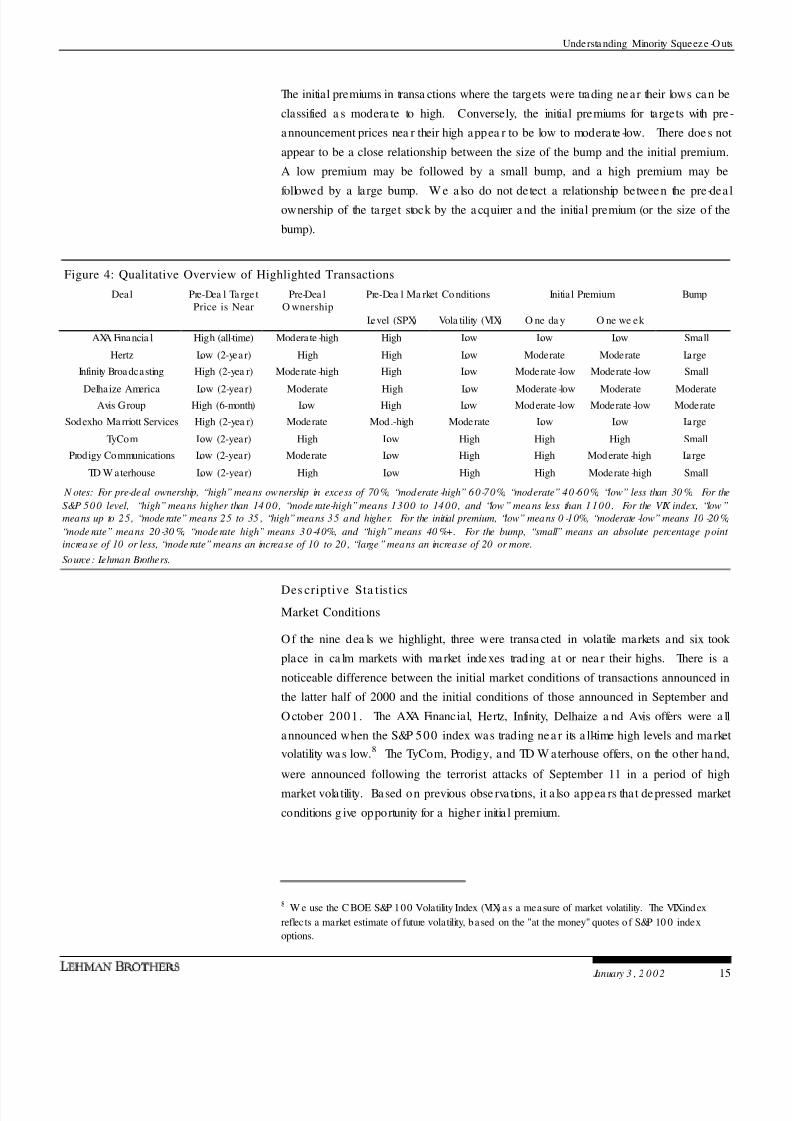
Figure 4 provides a n overview of the transactions ba sed on the criteria described in the
N otes. It appea rs tha t a ll transactions in our sample were announced a t times when the
target was trading ne ar medium- to long -term highs or lows. The highs or lows of the
targe t stocks do not necessa rily match the highs or lows of the market across the boa rd.
In the transactions a nnounce d recently, however, market lows a re a ssociated with target
stock price lows as well.
8/3/2019 Minority Squeeze Final
http://slidepdf.com/reader/full/minority-squeeze-final 15/37
Understa nding Minority Squeeze -O uts
January 3 , 2 0 02 15
The initial premiums in transa ctions where the targets were trading near their lows can be
classified a s modera te to high. Conversely, the initial premiums for ta rgets with pre -
announcement prices nea r their high appea r to be low to moderate -low. There doe s not
appear to be a close relationship between the size of the bump and the initial premium.
A low premium may be followed by a small bump, and a high premium may be
followed by a large bump. W e a lso do not detect a relationship between the pre-dea lownership of the ta rget stock by the a cquirer a nd the initial premium (or the size of the
bump).
Figure 4: Qualitative Overview of Highlighted Transactions
Deal Pre-Dea l Ta rge tPrice is Near
Pre-Dea lO wnership
Pre-Dea l Ma rket Co nditions Initial Premium Bump
Level (SPX) Vola tility (VIX) O ne -da y O ne -we ek
AXA Financia l High (all-time) Moderate -high High Low Low Low Small
Hertz Low (2-year) High High Low Moderate Moderate Large
Infinity Broadcasting High (2-yea r) Moderate -high High Low Moderate -low Moderate -low Small
Delhaize America Low (2-year) Moderate High Low Moderate -low Moderate ModerateAvis Group High (6-month) Low High Low Moderate -low Moderate -low Moderate
Sodexho Ma rriott Services High (2-yea r) Moderate Mod.-high Moderate Low Low Large
TyCom Low (2-year) High Low High High High Small
Prodigy Communications Low (2-year) Moderate Low High High Moderate -high Large
TD W aterhouse Low (2-year) High Low High High Moderate -high Small
N otes: For pre-deal ownership, “high” means ownership in excess of 70 %, “moderate -high” 60-70%, “moderate” 40-60%, “low” less than 30 %. For the
S&P 500 level, “high” means higher than 14 00, “mode rate-high”means 1300 to 14 00, and “low” means less than 1100 . For the VIX index, “low”
means up to 25, “mode rate” means 25 to 35 , “high”means 35 and higher. For the initial premium, “low” means 0 -10%, “moderate -low” means 10 -20 %,
“mode rate” means 20 -30 %, “moderate high” means 3 0-40%, and “high” means 40 %+. For the bump, “small” means an absolute percentage point
increase of 10 or less, “mode rate” means an increase of 10 to 20 , “large”means an increase of 20 or more.
Source: Lehman Brothers.
Des criptive Sta tistics
Market Conditions
O f the nine dea ls we highlight, three were transa cted in volatile markets and six took
place in ca lm markets with market indexes trad ing at or nea r their highs. There is a
noticeable difference between the initial market conditions of transactions announced in
the latter half of 2000 and the initial conditions of those announced in September and
O ctober 2001 . The AXA Financial, Hertz, Infinity, Delhaize a nd Avis offers were a ll
announced when the S&P 500 index was trading nea r its a ll-time high levels and market
volatility wa s low.8 The TyCom, Prodigy, and TD W aterhouse offers, on the other hand,
were announced following the terrorist attacks of September 11 in a period of high
market vola tility. Based on previous obse rva tions, it a lso appea rs that depressed market
conditions g ive opportunity for a higher initia l premium.
8 W e use the C BOE S&P 100 Volatility Index (VIX) as a measure of market volatility. The VIXindex
reflects a market estimate of future volatility, based on the "at the money" quotes o f S&P 10 0 index
options.
8/3/2019 Minority Squeeze Final
http://slidepdf.com/reader/full/minority-squeeze-final 16/37
Understa nding Minority Squeeze -O uts
16 January 3 , 2 0 0 2
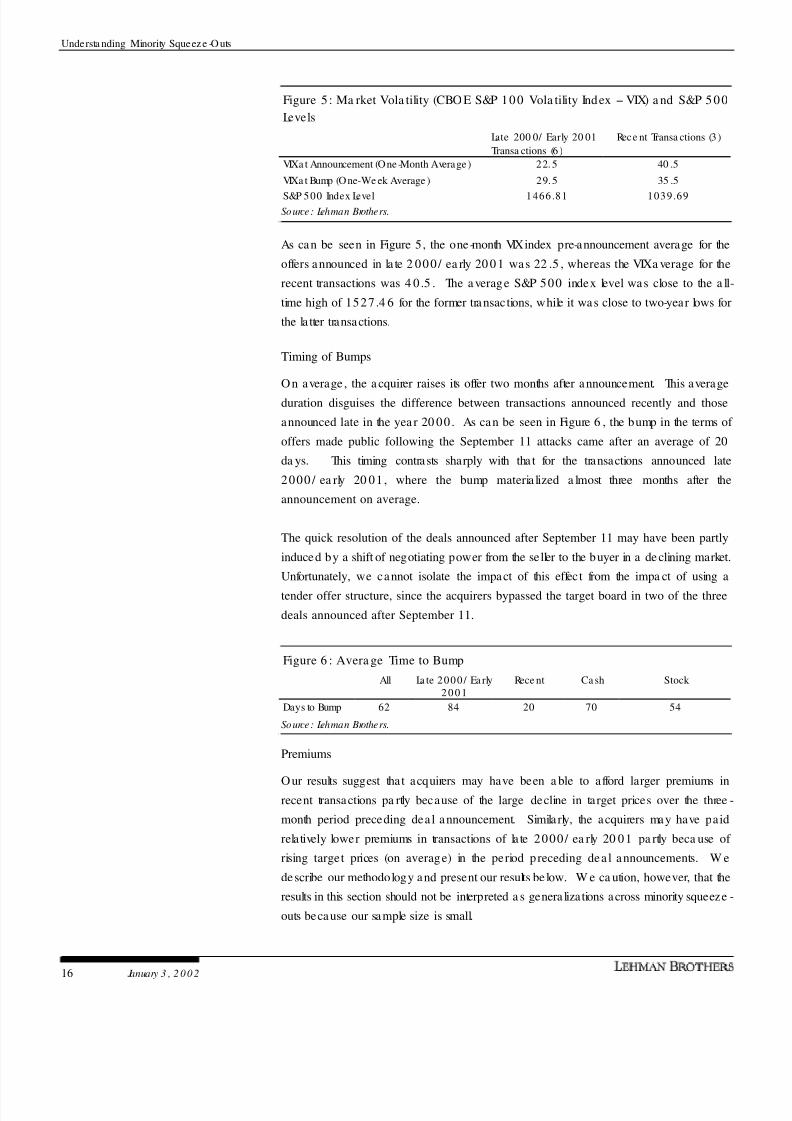
Figure 5: Ma rket Vola tility (CBO E S&P 100 Vola tility Index -- VIX) a nd S&P 500
Levels
Late 200 0/ Early 20 01
Transa ctions (6 )
Rece nt Transa ctions (3 )
VIXa t Announcement (One-Month Average) 22. 5 40 .5
VIXa t Bump (One-We ek Average ) 29. 5 35 .5
S&P 500 Index Level 1466 .81 1039.69Source: Lehman Brothers.
As can be seen in Figure 5, the one-month VIXindex pre-announcement average for the
offers announced in la te 2 00 0/ ea rly 20 0 1 was 22 .5 , whereas the VIXa verage for the
recent transactions was 4 0 .5 . The a verage S&P 500 index level was close to the a ll-
time high of 1527 .4 6 for the former transactions, while it was close to two-year lows for
the la tter transactions.
Timing of Bumps
O n average , the a cquirer raises its offer two months after announcement. This average
duration disguises the difference between transactions announced recently and those
announced late in the yea r 20 00 . As can be seen in Figure 6 , the bump in the terms of
offers made public following the September 11 attacks came after an average of 20
da ys. This timing contrasts sharply with tha t for the transactions announced late
2000 / ea rly 20 01 , where the bump materia lized a lmost three months after the
announcement on average.
The quick resolution of the deals announced after September 11 may have been partly
induced by a shift of negotiating power from the seller to the buyer in a de clining market.
Unfortunately, we cannot isolate the impact of this effect from the impa ct of using a
tender offer structure, since the acquirers bypassed the target board in two of the three
deals announced after September 11.
Figure 6 : Avera ge Time to Bump
All La te 2000 / Ea rly2 0 0 1
Rece nt Ca sh Stock
Days to Bump 62 84 20 70 54
Source: Lehman Brothers.
Premiums
O ur results suggest that acquirers may have been a ble to afford larger premiums inrecent transactions pa rtly because of the large decline in target prices over the three -
month period preceding dea l announcement. Simila rly, the acquirers may have paid
relatively lower premiums in transactions of la te 2000/ ea rly 20 01 pa rtly beca use of
rising target prices (on average) in the period preceding dea l announcements. W e
describe our methodology and present our results be low. W e ca ution, however, that the
results in this section should not be interpreted a s genera lizations across minority squeeze -
outs because our sample size is small.
8/3/2019 Minority Squeeze Final
http://slidepdf.com/reader/full/minority-squeeze-final 17/37
Understa nding Minority Squeeze -O uts
January 3 , 2 0 02 17
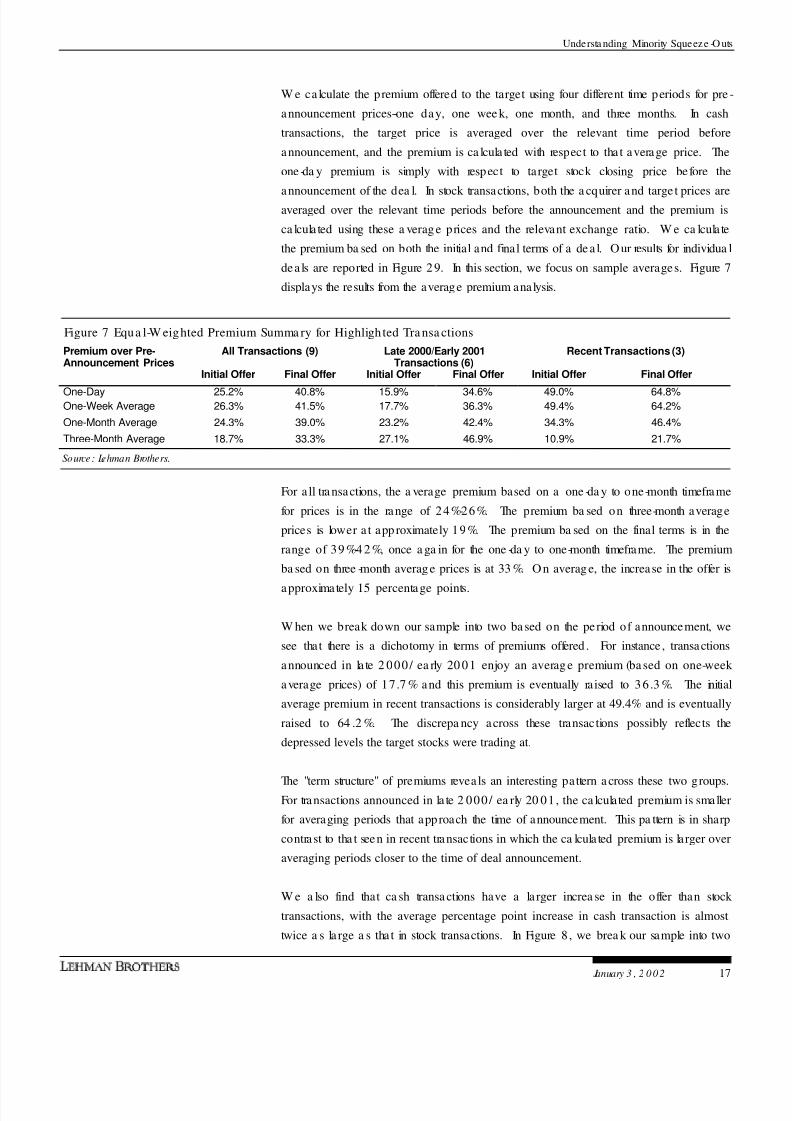
W e ca lculate the premium offered to the target using four different time periods for pre -
announcement prices--one day, one wee k, one month, and three months. In cash
transactions, the target price is averaged over the relevant time period before
announcement, and the premium is ca lcula ted with respect to tha t average price. The
one -da y premium is simply with respect to target stock closing price before the
announcement of the dea l. In stock transactions, both the a cquirer and targe t prices areaveraged over the relevant time periods before the announcement and the premium is
ca lcula ted using these a verag e prices and the relevant exchange ratio. W e ca lcula te
the premium ba sed on both the initial and final terms of a de a l. O ur results for individua l
dea ls are reported in Figure 2 9. In this section, we focus on sample averages. Figure 7
displays the results from the average premium analysis.
Figure 7 Equa l-W eighted Premium Summa ry for Highlighted Transa ctions
Premium over Pre-Announcement Prices
All Transactions (9) Late 2000/Early 2001Transactions (6)
Recent Transactions (3)
Initial Offer Final Offer Initial Offer Final Offer Initial Offer Final Offer
One-Day 25.2% 40.8% 15.9% 34.6% 49.0% 64.8%One-Week Average 26.3% 41.5% 17.7% 36.3% 49.4% 64.2%
One-Month Average 24.3% 39.0% 23.2% 42.4% 34.3% 46.4%
Three-Month Average 18.7% 33.3% 27.1% 46.9% 10.9% 21.7%
Source: Lehman Brothers.
For a ll tra nsactions, the a verage premium based on a one -da y to one-month timeframe
for prices is in the range of 24%-26%. The premium ba sed on three-month average
prices is lower a t app roximately 19%. The premium ba sed on the final terms is in the
range of 39 %-4 2 %, once a ga in for the one -da y to one-month timeframe. The premium
ba sed on three -month averag e prices is at 33 %. O n averag e, the increase in the offer is
approximately 15 percentage points.
W hen we break down our sample into two ba sed on the period of announcement, we
see that there is a dichotomy in terms of premiums offered . For instance , transactions
announced in la te 2 000/ ea rly 20 01 enjoy an averag e premium (ba sed on one-week
average prices) of 17.7 % and this premium is eventually raised to 3 6 .3 %. The initial
average premium in recent transactions is considerably larger at 49.4% and is eventually
raised to 64 .2 %. The discrepa ncy across these transactions possibly reflects the
depressed levels the target stocks were trading at.
The "term structure" of premiums revea ls an interesting pattern a cross these two groups.For transactions announced in la te 2 000/ ea rly 20 01 , the ca lculated premium is smaller
for averaging periods that approach the time of announcement. This pa ttern is in sharp
contrast to tha t seen in recent transactions in which the ca lcula ted premium is larger over
averaging periods closer to the time of deal announcement.
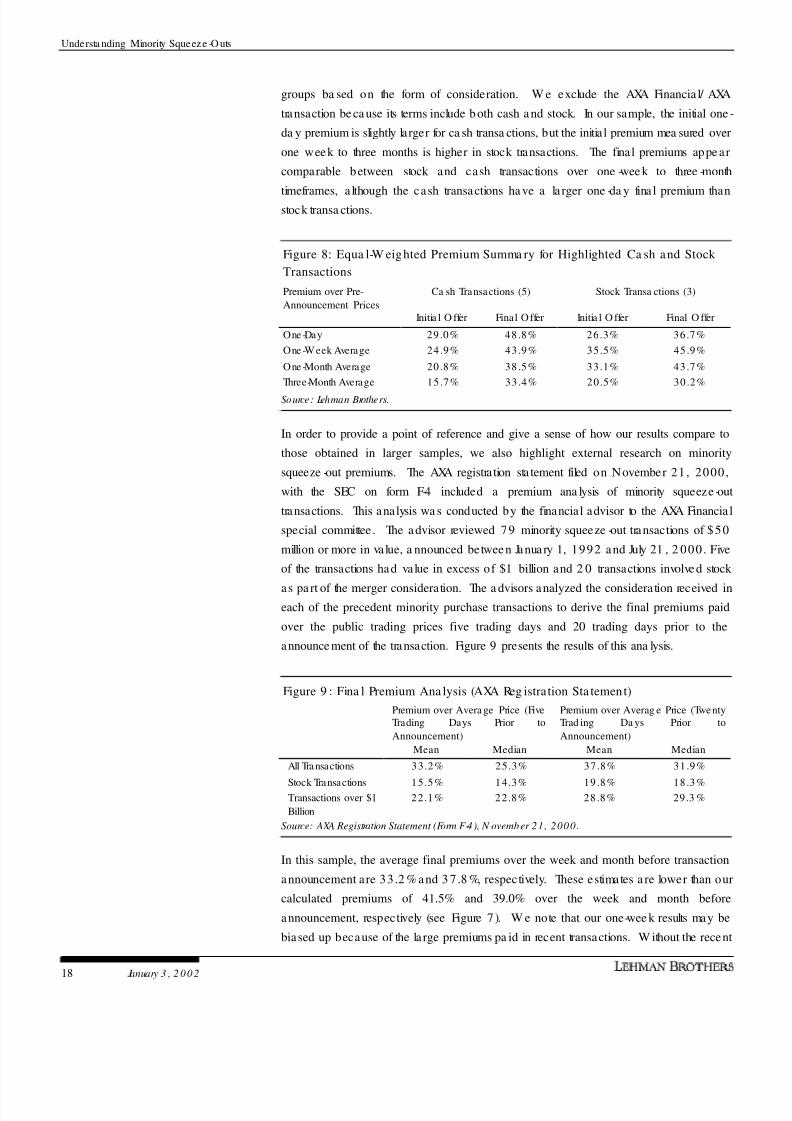
W e a lso find that ca sh transa ctions have a la rger increa se in the offer than stock
transactions, with the average percentage point increase in cash transaction is almost
twice a s la rge a s tha t in stock transactions. In Figure 8 , we brea k our sample into two
8/3/2019 Minority Squeeze Final
http://slidepdf.com/reader/full/minority-squeeze-final 18/37
Understa nding Minority Squeeze -O uts
18 January 3 , 2 0 0 2
groups ba sed on the form of consideration. W e exclude the AXA Financia l/ AXA
transaction be ca use its terms include b oth cash a nd stock. In our sample, the initial one -
da y premium is slightly larger for ca sh transa ctions, but the initia l premium mea sured over
one week to three months is higher in stock transactions. The final premiums appe ar
comparable between stock and cash transactions over one -wee k to three -month
timeframes, a lthough the cash transactions ha ve a la rger one -da y fina l premium thanstock transa ctions.
Figure 8: Equa l-W eighted Premium Summa ry for Highlighted Ca sh and Stock
Transactions
Premium over Pre-
Announcement Prices
Ca sh Transactions (5) Stock Transa ctions (3)
Initia l O ffer Final O ffer Initia l O ffer Final O ffer
One-Day 29 .0% 48 .8% 26.3% 36 .7%
One-W eek Average 24 .9% 43 .9% 35.5% 45 .9%
One-Month Average 20 .8% 38 .5% 33.1% 43 .7%
Three-Month Average 15 .7% 33 .4% 20.5% 30 .2%
Source: Lehman Brothers.
In order to provide a point of reference and give a sense of how our results compare to
those obtained in larger samples, we also highlight external research on minority
squeeze -out premiums. The AXA registration sta tement filed on November 21 , 2000 ,
with the SEC on form F-4 included a premium ana lysis of minority squeeze -out
transactions. This analysis wa s conducted by the financial advisor to the AXA Financia l
special committee . The a dvisor reviewed 79 minority squeeze -out transactions of $ 50
million or more in value, a nnounced between January 1, 1992 and July 21 , 2 000 . Five
of the transactions had value in excess of $1 billion and 2 0 transactions involve d stock
as pa rt of the merger consideration. The a dvisors analyzed the considera tion received ineach of the precedent minority purchase transactions to derive the final premiums paid
over the public trading prices five trading days and 20 trading days prior to the
announce ment of the transaction. Figure 9 presents the results of this ana lysis.
Figure 9 : Fina l Premium Ana lysis (AXA Reg istration Sta tement)
Premium over Avera ge Price (FiveTrading Days Prior to
Announcement)
Premium over Averag e Price (TwentyTrad ing Da ys Prior to
Announcement)
Mean Median Mean Median
All Transactions 33.2% 25.3% 37 .8% 31 .9%
Stock Transactions 15.5% 14.3% 19 .8% 18 .3%Transactions over $1
Billion
22.1% 22.8% 28 .8% 29.3 %
Source: AXA Registration Statement (Form F-4), N ovember 21, 2000.
In this sample, the average final premiums over the week and month before transaction
announcement are 33 .2 % and 3 7 .8 %, respectively. These estimates a re lower than our
calculated premiums of 41.5% and 39.0% over the week and month before
announcement, respectively (see Figure 7). W e note that our one-wee k results may be
biased up because of the la rge premiums pa id in recent transactions. W ithout the recent
8/3/2019 Minority Squeeze Final
http://slidepdf.com/reader/full/minority-squeeze-final 19/37
Understa nding Minority Squeeze -O uts
January 3 , 2 0 02 19
transactions, our average final premium decrea ses to 36 .3 % using one-week average
prices. For stock transactions, we believe that our sample is too small to make a
mea ningful compa rison. Overall, our findings do not diverge significantly from these
larger-sample results.
Future Mino r ity Sque eze -Ou ts?
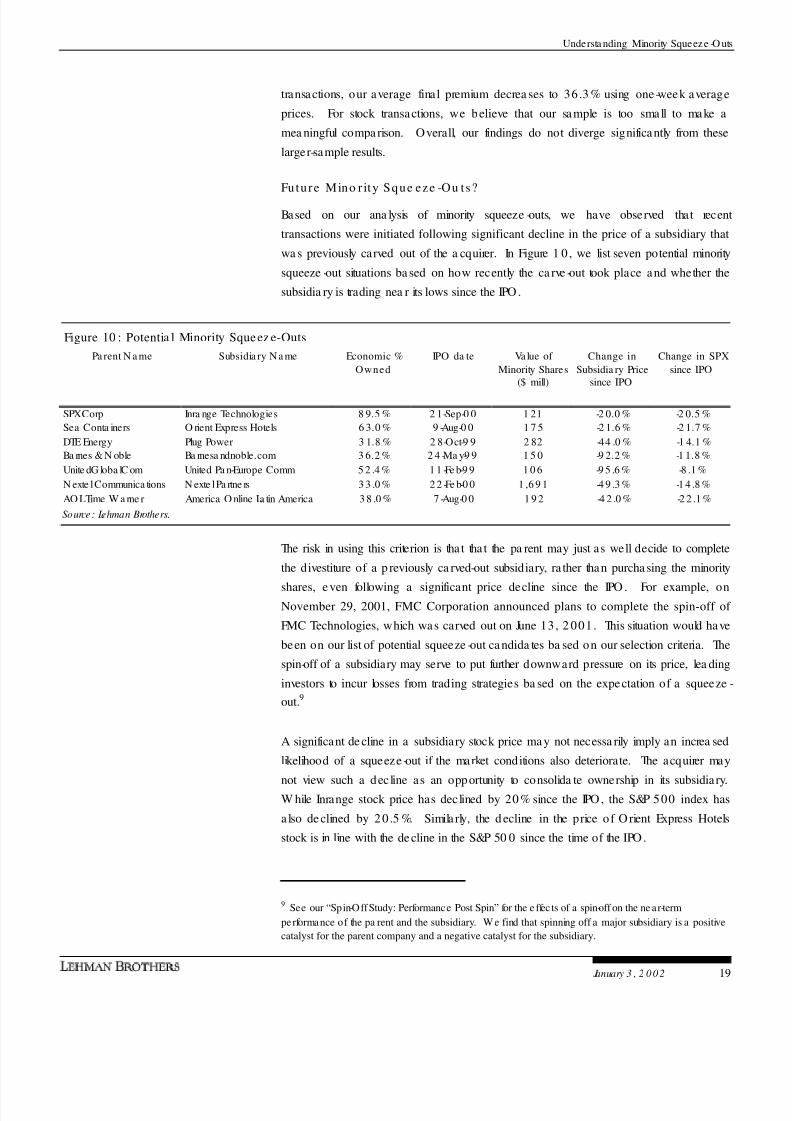
Based on our ana lysis of minority squeeze -outs, we have observed that recent
transactions were initiated following significant decline in the price of a subsidiary that
wa s previously carved out of the a cquirer. In Figure 1 0 , we list seven potential minority
squeeze -out situations ba sed on how recently the ca rve -out took place and whether the
subsidia ry is trading nea r its lows since the IPO .
Figure 10 : Potentia l Minority Squeez e-Outs
Pa rent N a me Subsidia ry N a me Economic %
Owned
IPO da te Value of
Minority Shares($ mill)
Change in
Subsidia ry Pricesince IPO
Change in SPX
since IPO
SPXCorp Inra nge Technologies 8 9.5 % 2 1-Sep-0 0 1 21 -2 0.0 % -2 0.5 %
Sea Conta iners O rient Express Hotels 6 3.0 % 9 -Aug-0 0 1 7 5 -2 1.6 % -2 1.7 %
DTE Energy Plug Power 3 1.8 % 2 8-Oct-9 9 2 82 -44 .0 % -1 4.1 %
Ba rnes & N oble Ba rnesa ndnoble.com 3 6.2 % 2 4 -Ma y-9 9 1 5 0 -9 2.2 % -1 1.8 %
Unite dG loba lC om United Pa n-Europe Comm 5 2 .4 % 1 1 -Fe b-9 9 1 0 6 -9 5 .6 % -8 .1 %
N exte l Communica tions N exte l Pa rtne rs 3 3 .0 % 2 2 -Fe b-0 0 1 ,6 9 1 -4 9 .3 % -1 4 .8 %
AO LTime W a rne r America O nline La tin America 3 8 .0 % 7 -Aug-0 0 1 9 2 -4 2 .0 % -2 2 .1 %
Source: Lehman Brothers.
The risk in using this criterion is tha t tha t the pa rent may just as well decide to complete
the divestiture of a p reviously ca rved-out subsidiary, ra ther than purcha sing the minority
shares, e ven following a significant price decline since the IPO . For example, onNovember 29, 2001, FMC Corporation announced plans to complete the spin-off of
FMC Technologies, which was carved out on June 13 , 2 001 . This situation would have
been on our list of potential squeeze -out ca ndida tes ba sed on our selection criteria. The
spin-off of a subsidiary may serve to put further downward pressure on its price, lea ding
investors to incur losses from trading strategies ba sed on the expectation of a squeeze -
out.9
A significant de cline in a subsidiary stock price ma y not necessa rily imply an increa sed
likelihood of a squeeze -out if the market conditions also deteriorate. The acquirer may
not view such a decline as an opportunity to consolida te ownership in its subsidia ry.W hile Inrange stock price has declined by 20% since the IPO , the S&P 500 index has
a lso de clined by 2 0 .5 %. Simila rly, the d ecline in the price o f O rient Express Hotels
stock is in line with the de cline in the S&P 50 0 since the time of the IPO .
9 See our “Spin-Off Study: Performance Post Spin” for the e ffec ts of a spin-off on the ne ar-term
performance of the pa rent and the subsidiary. W e find that spinning off a major subsidiary is a positive
catalyst for the parent company and a negative catalyst for the subsidiary.
8/3/2019 Minority Squeeze Final
http://slidepdf.com/reader/full/minority-squeeze-final 20/37
Understa nding Minority Sque eze -O uts
20 January 3 , 2 0 0 2
W h a t is t h e P r o b a b i lit y o f a B u m p ? P r o b a b i lit y An a ly s i s in M in o r it y S q u e e z e - O u t s
Synops is o f Fr a me w ork a nd Ma in Assum pt ions
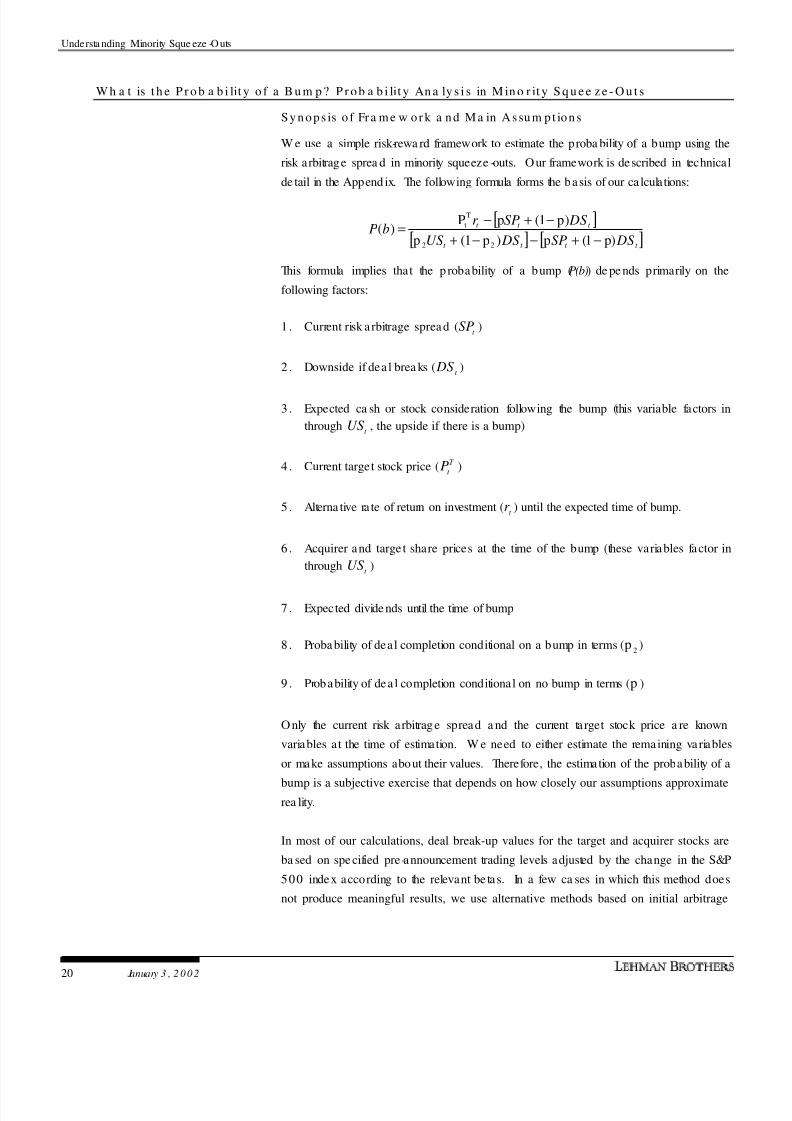
W e use a simple risk-rewa rd framework to estimate the proba bility of a bump using the
risk arbitrage sprea d in minority squeeze -outs. O ur framework is described in technical
de tail in the Append ix. The following formula forms the basis of our ca lculations:
[ ][ ] [ ]
t t t t
t t t
DSSP DSUS
DSSPr bP
)p1(p)p1(p
)p1(pP)(
22
T
t
−+−−+
−+−=
This formula implies that the p robability of a bump (P(b)) de pe nds primarily on the
following factors:
1 . Current risk a rbitrage sprea d (t
SP )
2 . Downside if dea l brea ks (t
DS )
3 . Expected ca sh or stock consideration following the bump (this variable factors in
throught
US , the upside if there is a bump)
4 . Current target stock price ( T
t P )
5 . Alterna tive ra te of return on investment (t r ) until the expected time of bump.
6 . Acquirer and targe t share prices at the time of the bump (these variables factor in
throught
US )
7 . Expected divide nds until the time of bump
8 . Proba bility of deal completion conditional on a bump in terms (2
p )
9 . Probability of dea l completion conditional on no bump in terms (p )
O nly the current risk arbitrag e spread a nd the current ta rget stock price a re known
variables at the time of estimation. W e need to either estimate the remaining variables
or make assumptions about their values. Therefore, the estimation of the probability of a
bump is a subjective exercise that depends on how closely our assumptions approximaterea lity.
In most of our calculations, deal break-up values for the target and acquirer stocks are
ba sed on spe cified pre-announcement trading levels adjusted by the change in the S&P
500 index according to the relevant be tas. In a few ca ses in which this method does
not produce meaningful results, we use alternative methods based on initial arbitrage
8/3/2019 Minority Squeeze Final
http://slidepdf.com/reader/full/minority-squeeze-final 21/37
Understa nding Minority Squeeze -O uts
January 3 , 2 0 02 21
impa ct. Given that the time to bump is relatively short in many transactions, we believe
that these methods a re sufficiently reliable.
W e a lso make the simplifying a ssumptions tha t the market’s expectation of the value of
the bump and its timing are in fact accurate ex post : the acquirer eventually raises its
offer to reflect the market’s expected va lue of a bump a t the time p redicted by themarket. Consequently, the probability tha t we e stimate should be interpreted a s the
probability of a bump of a given size.
W e assume that there is minimal regulatory risk such that the arbitrage sprea d essentially
collapses to zero at the time of the bump announcement. This assumption is quite
reasonable. In many ca ses, the ta rget and the a cquirer a re in different lines of business.
In other cases, the investment of the acquirer in the target has been in place for a long
period of time a nd likely has pa ssed regula tory muster. In rea lity, arbitrage sprea ds
narrow to unattractive levels following a bump, a nd we presume that arbitrageurs unwind
their positions to pursue investment opportunities elsewhere. The a cquirer prices at the
time of a bump are assumed to be equal to current levels adjusted for any dividend
payments.
Finally, we assume that the probability of deal completion conditional on a bump is one:
the dea l is certa in to go through following a b ump in the terms. This assumption is
consistent with the a ssumption of minimal regula tory risk and is predica ted on similar
reasoning. W e do not make assumptions about the proba bility of deal completion
conditiona l on the terms remaining the same, but rather display results for varying values
of this probability.1 0 If there is no bump in the terms, the boa rd of directors of the target
may find it in its shareholde rs’ be st interest to reject the offer. The boa rd’s proclivity to
reject the offer may depend on a number of factors such as the target’s business outlook
on a standalone basis, availability of alternative bidders, and the board’s negotiating
position.
Results
Nine of the following 18 figures (Figures 11-28) trace out the risk arbitrage spread
according to both the initial and final terms of dea ls. The sprea d using the fina l terms is
ca lcula ted from one month before the announcement until the a nnouncement of a bump.
At the time of the bump, the two spreads converge as we apply the final terms to both.
1 0 W e ha ve some preliminary information on conditional probabilities of dea l outcomes a nd bumps. W e
looked a t 34 a ll-cash all-U.S. minority squeeze -outs announced between 19 89 and 20 00. Of these, 21
(61.8%) were completed with a bump, six (17.6%) were completed without a bump, and seven (20.6%)were terminated without a bump. Two of the seven dea ls terminated without a bump had initial acquirer
ownership of ta rget shares of 80% or more. Two of the six deals completed with a bump had initial
acquirer ownership of target shares of 80 % or more. Based on this information: (i) conditional on nobump, sample probability of deal termination is 54%; (ii) conditional on a bump, sample probability of
deal completion is 10 0%; (iii) conditional on no bump and initia l ownership exceeding 8 0%, the sampleprobability of dea l termination is 50 %. These results suggest that dea l completion is a coin flip without a
bump and practica lly a certainty with a bump. But since our sample is not very large, we would not
generalize these results.
8/3/2019 Minority Squeeze Final
http://slidepdf.com/reader/full/minority-squeeze-final 22/37
Understa nding Minority Squeeze -O uts
22 January 3 , 2 0 0 2
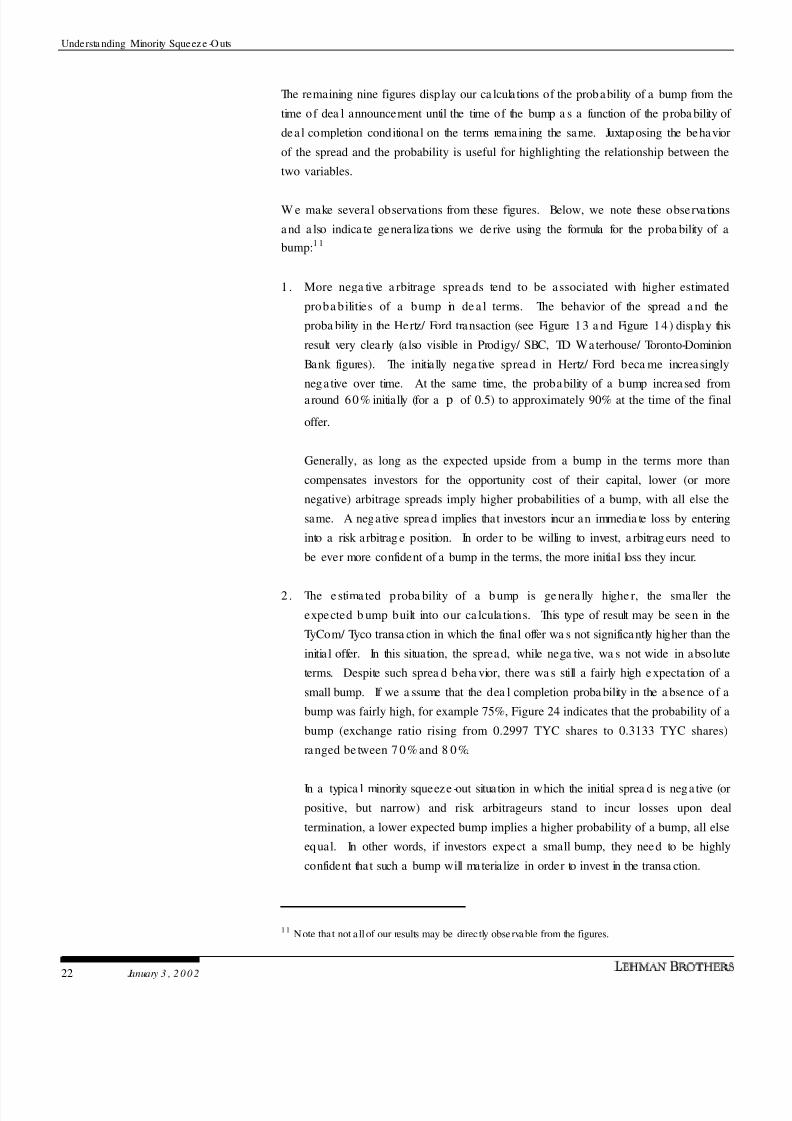
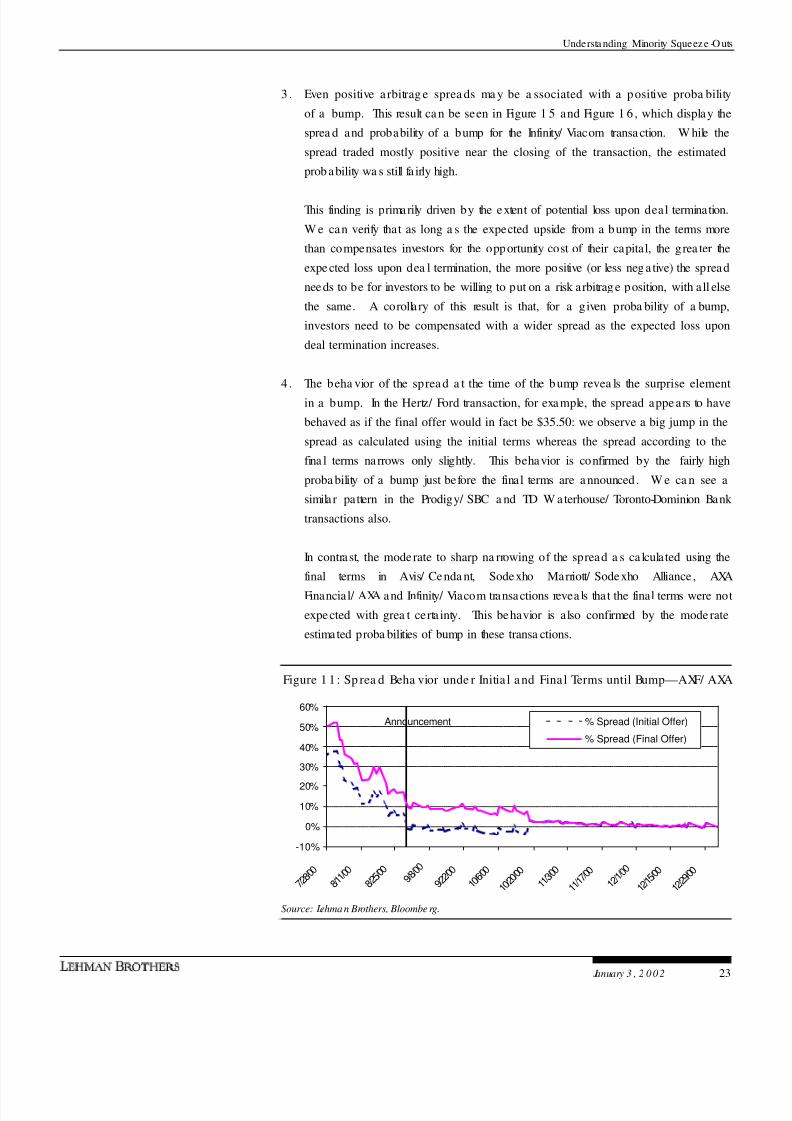
The remaining nine figures display our ca lcula tions of the probability of a bump from the
time of dea l announcement until the time of the bump a s a function of the proba bility of
dea l completion conditional on the terms rema ining the same. Juxtaposing the behavior
of the spread and the probability is useful for highlighting the relationship between the
two variables.
W e make several observations from these figures. Below, we note these observa tions
and a lso indica te generaliza tions we derive using the formula for the proba bility of a
bump:1 1
1 . More nega tive a rbitrage sprea ds tend to be associated with higher estimated
proba bilities of a bump in de a l terms. The behavior of the spread a nd the
proba bility in the Hertz/ Ford transaction (see Figure 13 a nd Figure 14 ) display this
result very clea rly (also visible in Prodigy/ SBC, TD Waterhouse/ Toronto-Dominion
Bank figures). The initia lly nega tive spread in Hertz/ Ford beca me increasingly
nega tive over time. At the same time, the probability of a bump increa sed from
around 60% initially (for a p of 0.5) to approximately 90% at the time of the final
offer.
Generally, as long as the expected upside from a bump in the terms more than
compensates investors for the opportunity cost of their capital, lower (or more
negative) arbitrage spreads imply higher probabilities of a bump, with all else the
same. A negative sprea d implies that investors incur an immedia te loss by entering
into a risk arbitrag e position. In order to be willing to invest, a rbitrag eurs need to
be ever more confident of a bump in the terms, the more initial loss they incur.
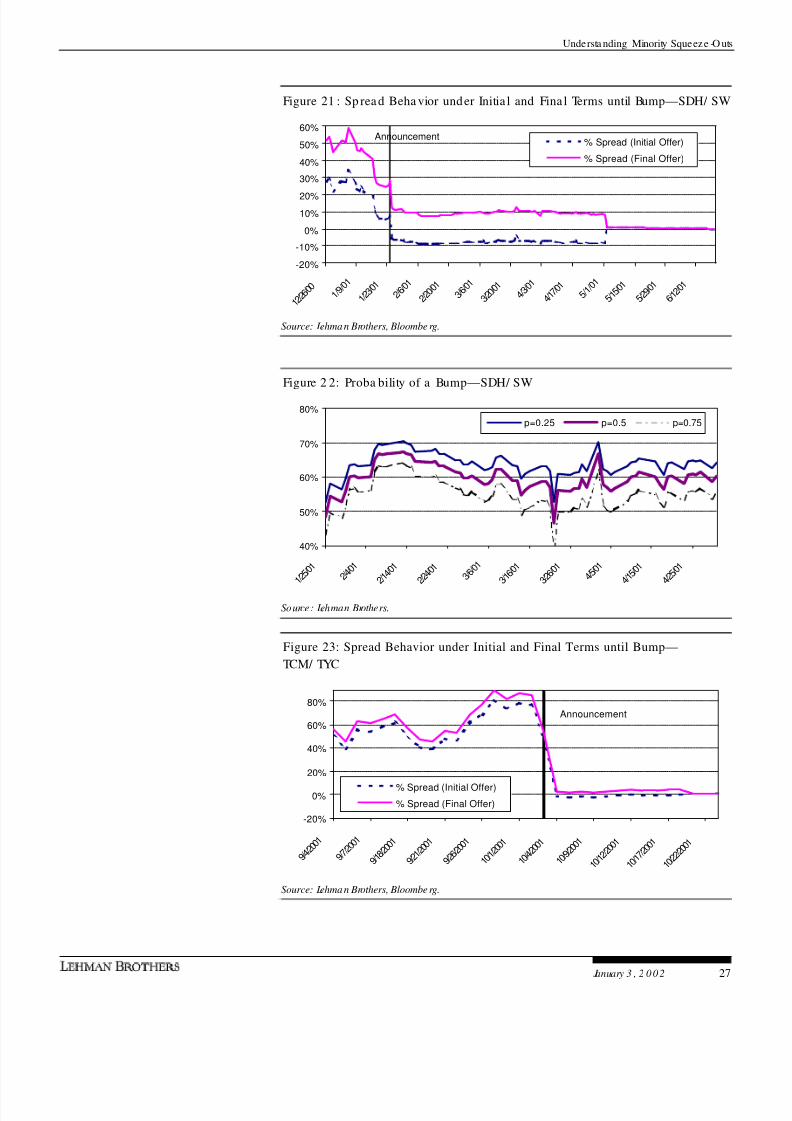
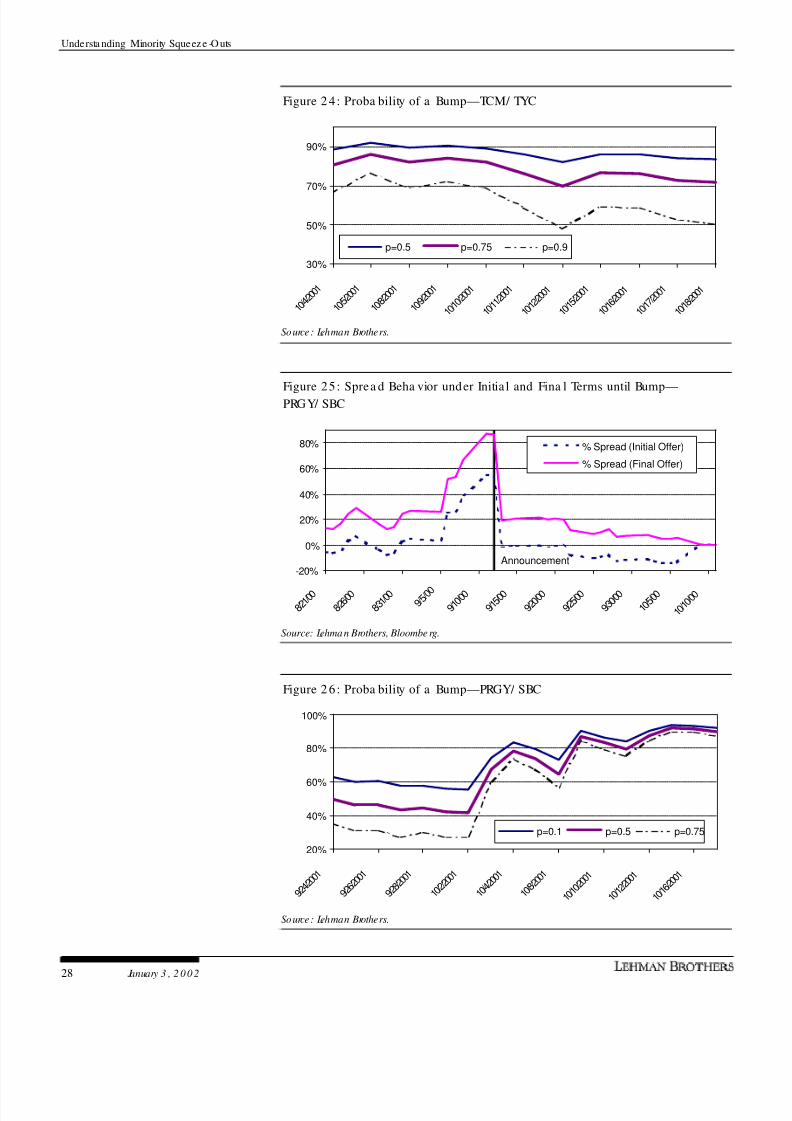
2 . The e stima ted proba bility of a b ump is ge nera lly highe r, the smaller the
expected b ump built into our ca lcula tions. This type of result may be seen in the
TyCom/ Tyco transa ction in which the final offer wa s not significantly higher than the
initia l offer. In this situation, the spread, while nega tive, wa s not wide in absolute
terms. Despite such sprea d beha vior, there wa s still a fairly high expectation of a
small bump. If we a ssume that the dea l completion proba bility in the a bsence of a
bump was fairly high, for example 75%, Figure 24 indicates that the probability of a
bump (exchange ratio rising from 0.2997 TYC shares to 0.3133 TYC shares)
ranged be tween 7 0% and 8 0%.
In a typica l minority squeeze -out situation in which the initial sprea d is nega tive (or
positive, but narrow) and risk arbitrageurs stand to incur losses upon deal
termination, a lower expected bump implies a higher probability of a bump, all else
equal. In other words, if investors expect a small bump, they need to be highly
confident that such a bump will materialize in order to invest in the transa ction.
1 1Note that not a ll of our results may be directly observable from the figures.
8/3/2019 Minority Squeeze Final
http://slidepdf.com/reader/full/minority-squeeze-final 23/37
Understa nding Minority Squeeze -O uts
January 3 , 2 0 02 23
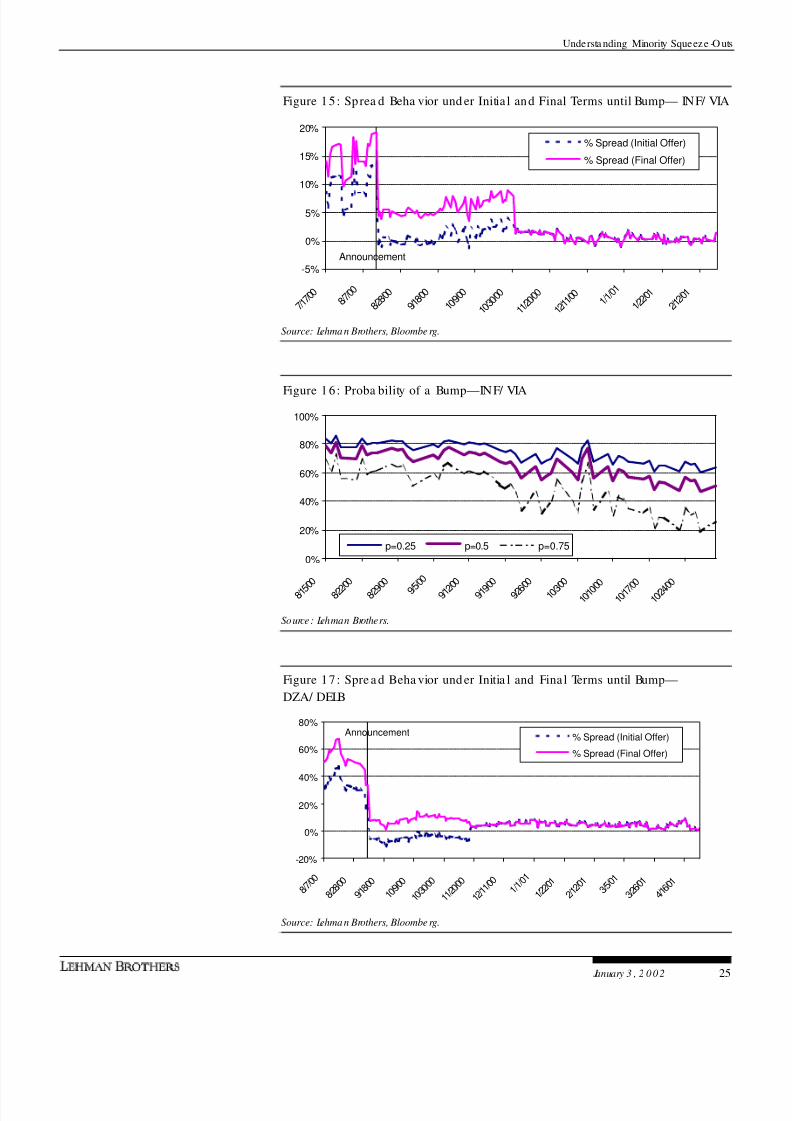
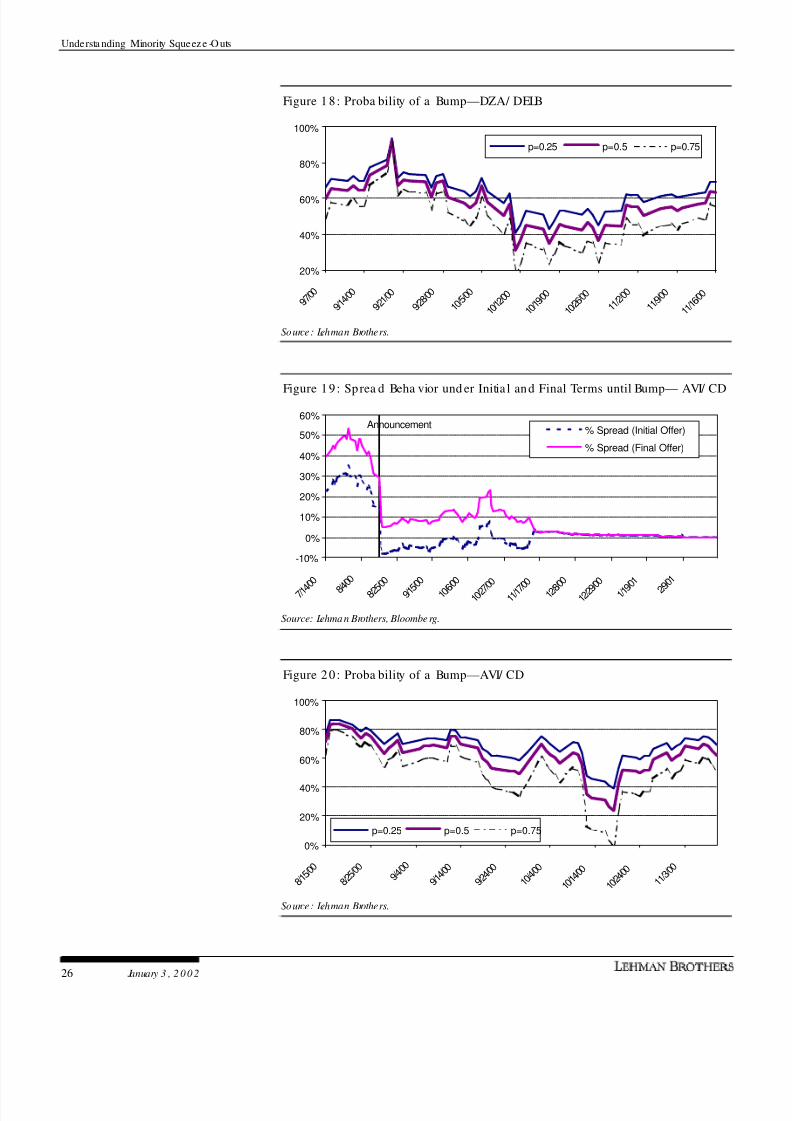
3 . Even positive a rbitrag e sprea ds ma y be a ssociated with a positive proba bility
of a bump. This result ca n be seen in Figure 1 5 and Figure 1 6 , which display the
sprea d and probability of a bump for the Infinity/ Viacom transa ction. W hile the
spread traded mostly positive near the closing of the transaction, the estimated
prob ability wa s still fa irly high.
This finding is primarily driven by the extent of potential loss upon deal termination.
W e can verify that as long a s the expected upside from a bump in the terms more
than compensates investors for the opportunity cost of their capital, the grea ter the
expe cted loss upon dea l termination, the more positive (or less neg a tive) the spread
needs to be for investors to be willing to put on a risk arbitrag e position, with all else
the same. A corolla ry of this result is that, for a given proba bility of a bump,
investors need to be compensated with a wider spread as the expected loss upon
deal termination increases.
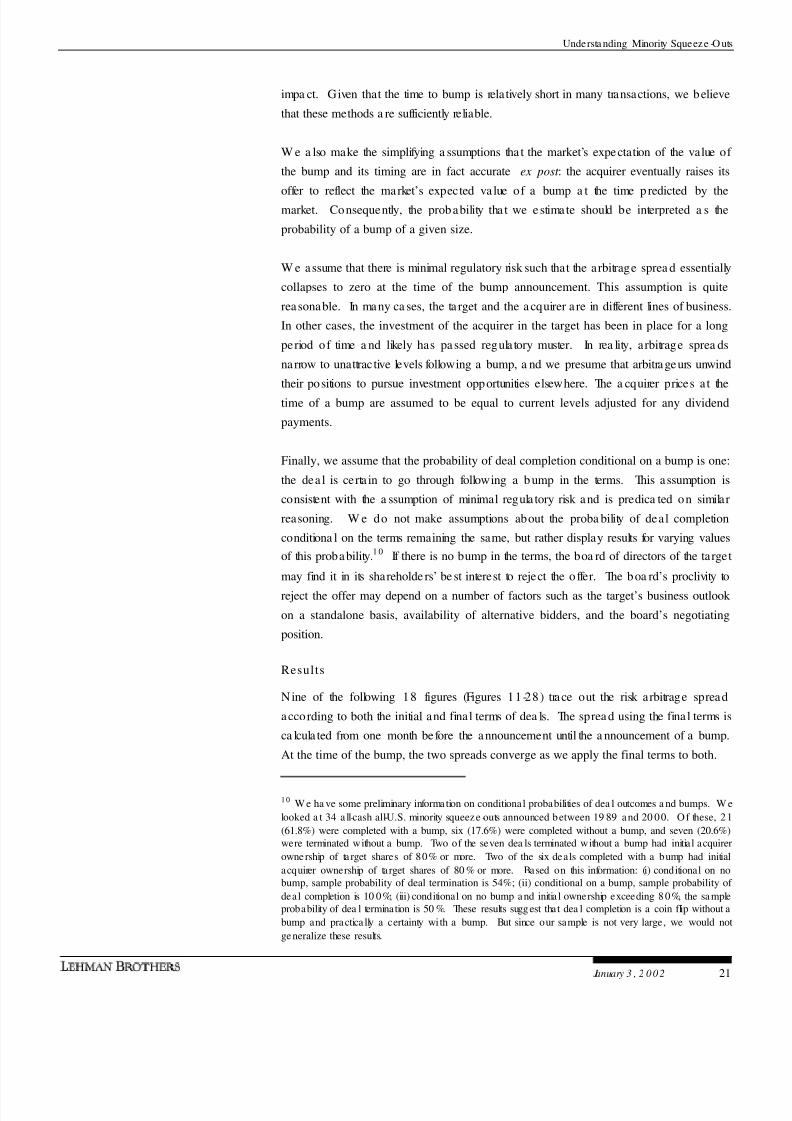
4 . The beha vior of the sprea d a t the time of the bump revea ls the surprise element
in a bump. In the Hertz/ Ford transaction, for example, the spread appe ars to have
behaved as if the final offer would in fact be $35.50: we observe a big jump in the
spread as calculated using the initial terms whereas the spread according to the
fina l terms narrows only slightly. This behavior is confirmed by the fairly high
proba bility of a bump just before the final terms are a nnounced . W e ca n see a
simila r pattern in the Prodigy/ SBC a nd TD W aterhouse/ Toronto-Dominion Bank
transactions also.
In contrast, the moderate to sharp na rrowing of the spread a s ca lculated using the
final terms in Avis/ Cenda nt, Sodexho Marriott/ Sodexho Alliance , AXA
Financial/ AXA and Infinity/ Viacom transactions revea ls that the final terms were not
expected with grea t certa inty. This behavior is also confirmed by the mode rate
estimated proba bilities of bump in these transa ctions.
Figure 1 1: Sp rea d Beha vior unde r Initia l and Final Terms until Bump—AXF/ AXA
-10%
0%
10%
20%
30%
40%
50%
60%
7 / 2 8 / 0 0
8 / 1 1 / 0 0
8 / 2 5 / 0 0
9 / 8 / 0 0
9 / 2 2 / 0 0
1 0 / 6 / 0 0
1 0 / 2 0 / 0 0
1 1 / 3 / 0 0
1 1 / 1 7 / 0 0
1 2 / 1 / 0 0
1 2 / 1 5 / 0 0
1 2 / 2 9 / 0 0
% Spread (Initial Offer)
% Spread (Final Offer)
Announcement
Source: Lehman Brothers, Bloombe rg.
8/3/2019 Minority Squeeze Final
http://slidepdf.com/reader/full/minority-squeeze-final 24/37
Understa nding Minority Squeeze -O uts
24 January 3 , 2 0 0 2
Figure 1 2: Proba bility of a Bump—AXF/ AXA
0%
20%
40%
60%
80%
100%
8 / 3 0 / 0 0
9 / 4 / 0 0
9 / 9 / 0 0
9 / 1 4 / 0 0
9 / 1 9 / 0 0
9 / 2 4 / 0 0
9 / 2 9 / 0 0
1 0 / 4 / 0 0
1 0 / 9 / 0 0
1 0 / 1 4 / 0 0
p=0.25 p=0.5 p=0.75
Source: Lehman Brothers.
Figure 13: Spre a d Beha vior under Initia l and Final Terms until Bump— HRZ/ F
-20%
-10%
0%
10%
20%
30%
40%
50%
8 / 2 1 / 0 0
9 / 4 / 0 0
9 / 1 8 / 0 0
1 0 / 2 / 0 0
1 0 / 1 6 / 0 0
1 0 / 3 0 / 0 0
1 1 / 1 3 / 0 0
1 1 / 2 7 / 0 0
1 2 / 1 1 / 0 0
1 2 / 2 5 / 0 0
1 / 8 / 0 1
1 / 2 2 / 0 1
2 / 5 / 0 1
2 / 1 9 / 0 1
3 / 5 / 0 1
% Spread (Initial Offer)
% Spread (Final Offer)
Announcement
Source: Lehman Brothers, Bloombe rg.
Figure 14 : Proba bility of a Bump—HRZ/ F
40%
50%
60%
70%
80%
90%
100%
9 / 2 1 / 0 0
1 0 / 1 / 0 0
1 0 / 1 1
/ 0 0
1 0 / 2 1
/ 0 0
1 0 / 3 1 / 0 0
1 1 / 1 0 / 0 0
1 1 / 2 0 / 0 0
1 1 / 3 0 / 0 0
1 2 / 1 0 / 0 0
1 2 / 2 0 / 0 0
1 2 / 3 0 / 0 0 1 / 9
/ 0 1
p=0.25 p=0.5 p=0.75
Source: Lehman Brothers.
8/3/2019 Minority Squeeze Final
http://slidepdf.com/reader/full/minority-squeeze-final 25/37
Understa nding Minority Squeeze -O uts
January 3 , 2 0 02 25
Figure 15: Sprea d Beha vior und er Initia l and Final Terms until Bump— INF/ VIA
-5%
0%
5%
10%
15%
20%
7 / 1 7 / 0 0
8 / 7 / 0 0
8 / 2 8 / 0 0
9 / 1 8 / 0 0
1 0 / 9 / 0 0
1 0 / 3 0 / 0 0
1 1 / 2 0 / 0 0
1 2 / 1 1 / 0 0 1 /
1 / 0 1
1 / 2 2 / 0
1
2 / 1 2 / 0
1
% Spread (Initial Offer)
% Spread (Final Offer)
Announcement
Source: Lehman Brothers, Bloombe rg.
Figure 16: Proba bility of a Bump—INF/ VIA
0%
20%
40%
60%
80%
100%
8 / 1 5 / 0 0
8 / 2 2 / 0 0
8 / 2 9 / 0 0
9 / 5 / 0 0
9 / 1 2 / 0 0
9 / 1 9 / 0 0
9 / 2 6 / 0 0
1 0 / 3 / 0 0
1 0 / 1 0 / 0
0
1 0 / 1 7 / 0 0
1 0 / 2 4 / 0 0
p=0.25 p=0.5 p=0.75
Source: Lehman Brothers.
Figure 17: Spre a d Beha vior under Initia l and Final Terms until Bump—
DZA/ DELB
-20%
0%
20%
40%
60%
80%
8 / 7 / 0 0
8 / 2 8 / 0 0
9 / 1 8 / 0 0
1 0 / 9 / 0 0
1 0 / 3 0 / 0 0
1 1 / 2 0 / 0 0
1 2 / 1 1
/ 0 0 1 / 1 / 0 1
1 / 2 2 / 0
1
2 / 1 2 / 0
1 3 / 5 / 0 1
3 / 2 6 / 0
1
4 / 1 6 / 0
1
% Spread (Initial Offer)
% Spread (Final Offer)
Announcement
Source: Lehman Brothers, Bloombe rg.
8/3/2019 Minority Squeeze Final
http://slidepdf.com/reader/full/minority-squeeze-final 26/37
Understa nding Minority Squeeze -O uts
26 January 3 , 2 0 0 2
Figure 1 8: Proba bility of a Bump—DZA/ DELB
20%
40%
60%
80%
100%
9 / 7 / 0 0
9 / 1 4 / 0 0
9 / 2 1 / 0 0
9 / 2 8 / 0
0
1 0 / 5 / 0 0
1 0 / 1 2 / 0 0
1 0 / 1 9 / 0 0
1 0 / 2 6 / 0 0
1 1 / 2 / 0 0
1 1 / 9 / 0 0
1 1 / 1 6 / 0 0
p=0.25 p=0.5 p=0.75
Source: Lehman Brothers.
Figure 19: Sprea d Beha vior und er Initia l and Final Terms until Bump— AVI/ CD
-10%
0%
10%
20%
30%
40%
50%
60%
7 / 1 4 / 0 0
8 / 4 / 0 0
8 / 2 5 / 0 0
9 / 1 5 / 0 0
1 0 / 6 / 0 0
1 0 / 2 7 / 0 0
1 1 / 1 7 / 0 0
1 2 / 8 / 0 0
1 2 / 2 9 / 0 0
1 / 1 9 / 0 1
2 / 9 / 0 1
% Spread (Initial Offer)
% Spread (Final Offer)
Announcement
Source: Lehman Brothers, Bloombe rg.
Figure 20: Proba bility of a Bump—AVI/ CD
0%
20%
40%
60%
80%
100%
8 / 1 5 / 0 0
8 / 2 5 / 0 0
9 / 4 / 0 0
9 / 1 4 / 0 0
9 / 2 4 / 0 0
1 0 / 4 / 0 0
1 0 / 1 4 / 0 0
1 0 / 2 4 / 0 0
1 1 / 3 / 0 0
p=0.25 p=0.5 p=0.75
Source: Lehman Brothers.
8/3/2019 Minority Squeeze Final
http://slidepdf.com/reader/full/minority-squeeze-final 27/37
Understa nding Minority Squeeze -O uts
January 3 , 2 0 02 27
Figure 21 : Sp read Beha vior under Initia l and Final Terms until Bump—SDH/ SW
-20%
-10%
0%
10%
20%
30%
40%
50%
60%
1 2 / 2 6 / 0 0
1 / 9 / 0 1
1 / 2 3 / 0
1 2 / 6 / 0 1
2 / 2 0 / 0
1 3 / 6 / 0 1
3 / 2 0 / 0
1 4 / 3 / 0 1
4 / 1 7 / 0
1 5 / 1 / 0 1
5 / 1 5 / 0
1
5 / 2 9 / 0
1
6 / 1 2 / 0
1
% Spread (Initial Offer)
% Spread (Final Offer)
Announcement
Source: Lehman Brothers, Bloombe rg.
Figure 2 2: Proba bility of a Bump—SDH/ SW
40%
50%
60%
70%
80%
1 / 2 5 / 0
1 2 / 4
/ 0 1
2 / 1 4 / 0
1
2 / 2 4 / 0 1
3 / 6 / 0 1
3 / 1 6 / 0
1
3 / 2 6 / 0
1 4 / 5 / 0 1
4 / 1 5 / 0
1
4 / 2 5 / 0
1
p=0.25 p=0.5 p=0.75
Source: Lehman Brothers.
Figure 23: Spread Behavior under Initial and Final Terms until Bump—
TCM/ TYC
-20%
0%
20%
40%
60%
80%
9 / 4 / 2 0 0 1
9 / 7 / 2 0 0 1
9 / 1 8 / 2
0 0 1
9 / 2 1 / 2 0 0
1
9 / 2 6 / 2
0 0 1
1 0 / 1 / 2 0 0 1
1 0 / 4 / 2 0 0 1
1 0 / 9 / 2 0 0 1
1 0 / 1 2
/ 2 0 0 1
1 0 / 1 7
/ 2 0 0 1
1 0 / 2 2 / 2 0 0 1
% Spread (Initial Offer)
% Spread (Final Offer)
Announcement
Source: Lehman Brothers, Bloombe rg.
8/3/2019 Minority Squeeze Final
http://slidepdf.com/reader/full/minority-squeeze-final 28/37
Understa nding Minority Squeeze -O uts
28 January 3 , 2 0 0 2
Figure 2 4: Proba bility of a Bump—TCM/ TYC
30%
50%
70%
90%
1 0 / 4 / 2 0 0 1
1 0 / 5 / 2 0 0 1
1 0 / 8 / 2 0 0 1
1 0 / 9 / 2 0 0 1
1 0 / 1 0 / 2 0 0 1
1 0 / 1 1 / 2 0 0 1
1 0 / 1 2 / 2 0 0 1
1 0 / 1 5 / 2 0 0 1
1 0 / 1 6 / 2 0 0 1
1 0 / 1 7 / 2 0 0 1
1 0 / 1 8 / 2 0 0 1
p=0.5 p=0.75 p=0.9
Source: Lehman Brothers.
Figure 25: Sprea d Beha vior under Initia l and Fina l Terms until Bump—PRGY/ SBC
-20%
0%
20%
40%
60%
80%
8 / 2 1 / 0 0
8 / 2 6 / 0 0
8 / 3 1 / 0 0
9 / 5 / 0 0
9 / 1 0 / 0 0
9 / 1 5 / 0 0
9 / 2 0 / 0 0
9 / 2 5 / 0 0
9 / 3 0 / 0 0
1 0 / 5 / 0 0
1 0 / 1 0 / 0 0
% Spread (Initial Offer)
% Spread (Final Offer)
Announcement
Source: Lehman Brothers, Bloombe rg.
Figure 2 6: Proba bility of a Bump—PRGY/ SBC
20%
40%
60%
80%
100%
9 / 2 4 / 2 0 0
1
9 / 2 6 / 2 0 0
1
9 / 2 8 / 2 0 0
1
1 0 / 2 / 2 0 0 1
1 0 / 4 / 2 0 0 1
1 0 / 8 / 2 0 0 1
1 0 / 1 0 / 2 0 0 1
1 0 / 1 2 / 2 0 0 1
1 0 / 1 6 / 2 0 0 1
p=0.1 p=0.5 p=0.75
Source: Lehman Brothers.
8/3/2019 Minority Squeeze Final
http://slidepdf.com/reader/full/minority-squeeze-final 29/37
Understa nding Minority Squeeze -O uts
January 3 , 2 0 02 29
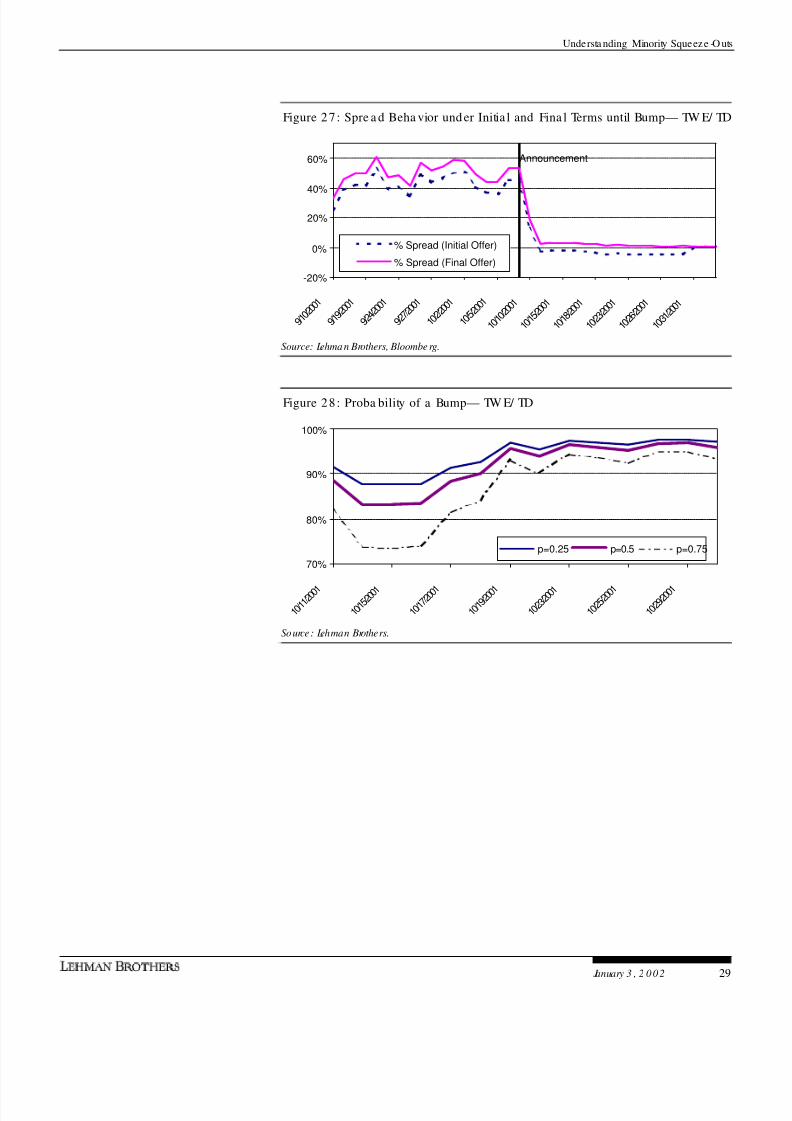
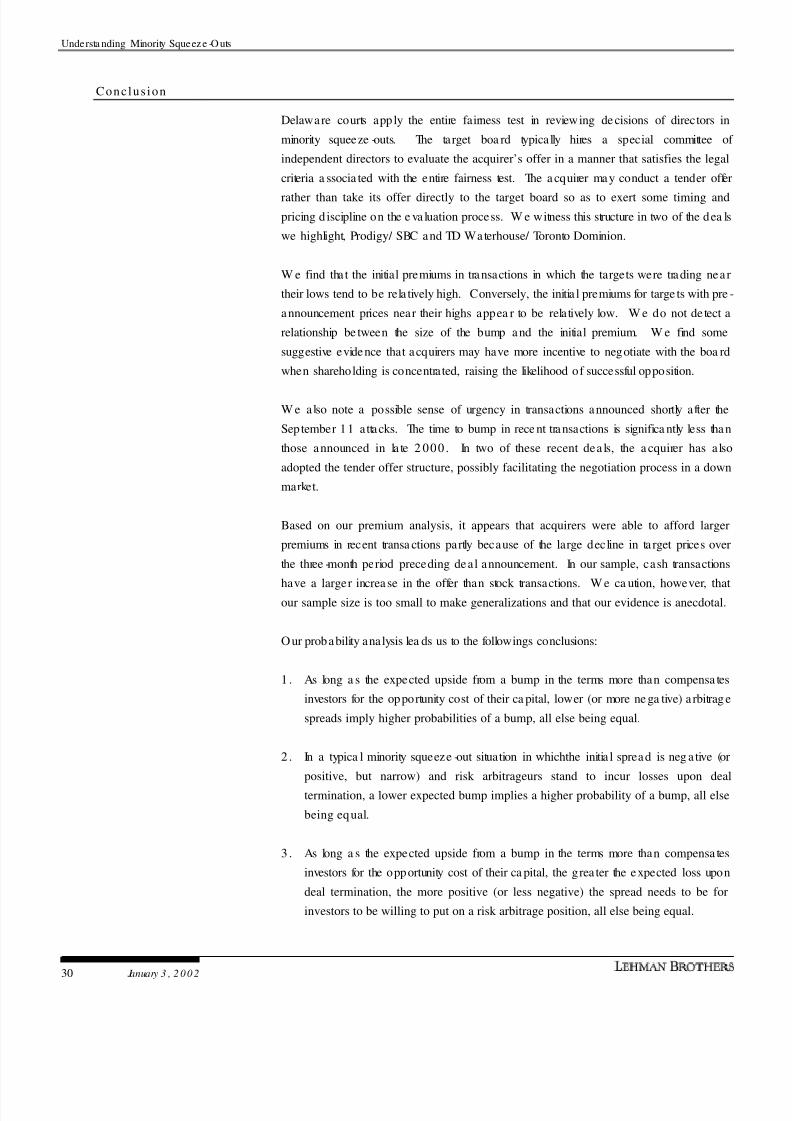
Figure 27: Spre a d Beha vior under Initia l and Fina l Terms until Bump— TW E/ TD
-20%
0%
20%
40%
60%
9 / 1 0 / 2 0 0
1
9 / 1 9 / 2 0 0
1
9 / 2 4 / 2 0 0
1
9 / 2 7 / 2 0 0
1
1 0 / 2 / 2 0 0 1
1 0 / 5 / 2 0 0 1
1 0 / 1 0 / 2 0 0 1
1 0 / 1 5 / 2 0 0 1
1 0 / 1 8 / 2 0 0 1
1 0 / 2 3 / 2 0 0 1
1 0 / 2 6 / 2 0 0 1
1 0 / 3 1 / 2 0 0 1
% Spread (Initial Offer)
% Spread (Final Offer)
Announcement
Source: Lehman Brothers, Bloombe rg.
Figure 28: Proba bility of a Bump— TW E/ TD
70%
80%
90%
100%
1 0 / 1 1 / 2 0 0 1
1 0 / 1 5 / 2 0 0 1
1 0 / 1 7 / 2 0 0 1
1 0 / 1 9 / 2 0 0 1
1 0 / 2 3 / 2 0 0 1
1 0 / 2 5 / 2 0 0 1
1 0 / 2 9 / 2 0 0 1
p=0.25 p=0.5 p=0.75
Source: Lehman Brothers.
8/3/2019 Minority Squeeze Final
http://slidepdf.com/reader/full/minority-squeeze-final 30/37
Understa nding Minority Squeeze -O uts
30 January 3 , 2 0 0 2
Conclus ion
Delaware courts app ly the entire fairness test in reviewing de cisions of directors in
minority squeeze -outs. The target boa rd typically hires a special committee of
independent directors to evaluate the acquirer’s offer in a manner that satisfies the legal
criteria a ssocia ted with the entire fairness test. The a cquirer may conduct a tender offer
rather than take its offer directly to the target board so as to exert some timing and
pricing d iscipline on the e va luation process. W e witness this structure in two of the dea ls
we highlight, Prodigy/ SBC and TD Waterhouse/ Toronto Dominion.
W e find tha t the initial premiums in transactions in which the targets were trading near
their lows tend to be rela tively high. Conversely, the initia l premiums for targe ts with pre -
announcement prices near their highs appea r to be relatively low. W e do not de tect a
relationship be tween the size of the bump and the initial premium. W e find some
suggestive evidence that acquirers may have more incentive to negotiate with the boa rd
when shareholding is concentrated, raising the likelihood of successful opposition.
W e also note a possible sense of urgency in transactions announced shortly after the
September 11 attacks. The time to bump in rece nt transactions is significa ntly less than
those announced in la te 2 000 . In two of these recent dea ls, the a cquirer has also
adopted the tender offer structure, possibly facilitating the negotiation process in a down
market.
Based on our premium analysis, it appears that acquirers were able to afford larger
premiums in recent transa ctions partly because of the large decline in ta rget prices over
the three -month period preceding deal announcement. In our sample, cash transactions
have a larger increa se in the offer than stock transactions. W e ca ution, however, thatour sample size is too small to make generalizations and that our evidence is anecdotal.
O ur probability analysis lea ds us to the followings conclusions:
1 . As long a s the expected upside from a bump in the terms more than compensa tes
investors for the opportunity cost of their ca pital, lower (or more ne ga tive) a rbitrag e
spreads imply higher probabilities of a bump, all else being equal.
2 . In a typica l minority squeeze -out situation in whichthe initia l spread is neg a tive (or
positive, but narrow) and risk arbitrageurs stand to incur losses upon deal
termination, a lower expected bump implies a higher probability of a bump, all else
being equal.
3 . As long a s the expected upside from a bump in the terms more than compensa tes
investors for the opportunity cost of their ca pital, the grea ter the expected loss upon
deal termination, the more positive (or less negative) the spread needs to be for
investors to be willing to put on a risk arbitrage position, all else being equal.
8/3/2019 Minority Squeeze Final
http://slidepdf.com/reader/full/minority-squeeze-final 31/37
Understa nding Minority Squeeze -O uts
January 3 , 2 0 02 31
These points highlight the inverse relationship between probability of a bump and the
spread, the inverse rela tionship be tween the probability of a bump a nd the level of the
expected bump, and the positive relationship between expected loss and the spread .
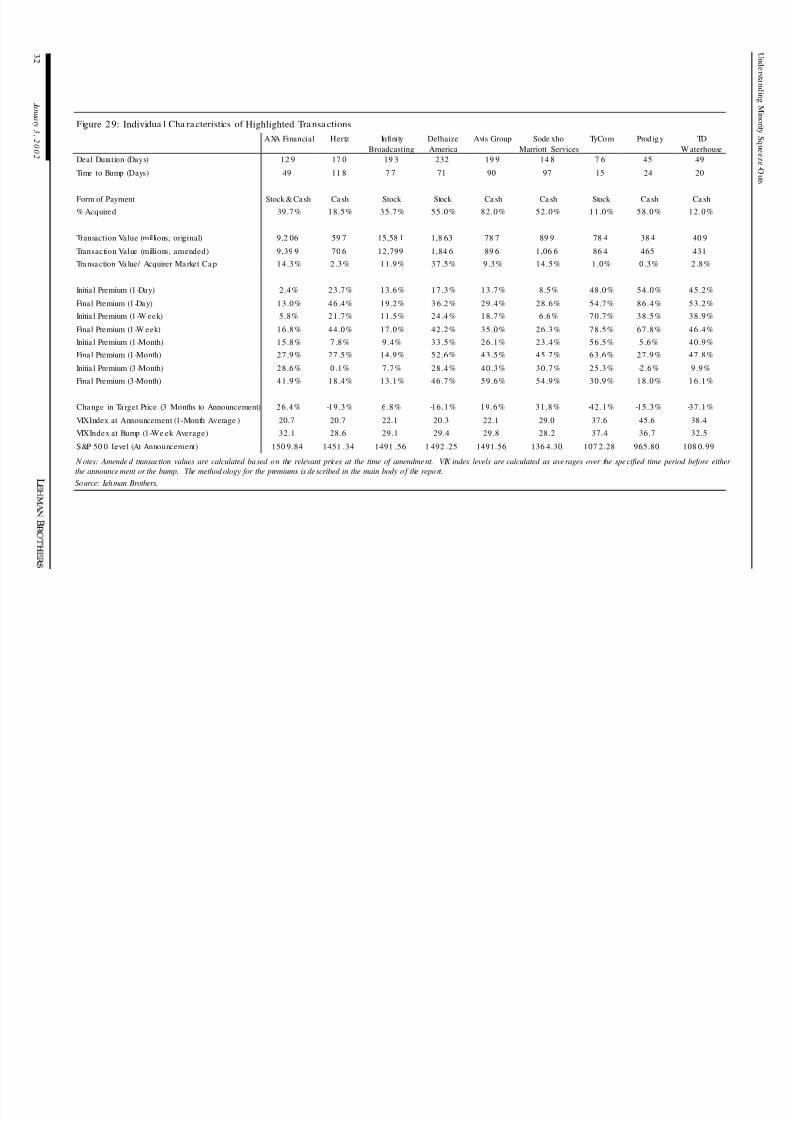
8/3/2019 Minority Squeeze Final
http://slidepdf.com/reader/full/minority-squeeze-final 32/37
3 2
J anuar y
3
,2
0
0
2
Figure 29: Individua l Cha racteristics of Highlighted Transa ctions
AXA Financial Hertz Infinity
Broadcasting
Delhaize
America
Avis Group Sode xho
Marriott Services
TyCom Prod igy TD
W aterhouse
Deal Duration (Days) 12 9 17 0 19 3 232 19 9 14 8 7 6 45 49
Time to Bump (Days) 49 11 8 7 7 71 90 97 15 24 20
Form of Payment Stock & Cash Cash Stock Stock Ca sh Cash Stock Ca sh Ca sh
% Acquired 39 .7% 18.5% 35.7% 55.0% 82.0% 52.0% 11.0% 58.0% 12.0%
Transaction Value (millions, original) 9,2 06 59 7 15,58 1 1,8 63 78 7 89 9 78 4 38 4 40 9
Transaction Value (millions, amended) 9,39 9 70 6 12,799 1,84 6 89 6 1,06 6 86 4 465 431
Transaction Va lue/ Acquirer Market Cap 14 .3% 2.3% 11.9% 37.5% 9.3% 14.5% 1.0% 0.3% 2.8%
Initia l Premium (1 -Day) 2.4% 23.7% 13.6% 17.3% 13.7% 8.5% 48.0% 54.0% 45.2%
Final Premium (1-Day) 13 .0% 46.4% 19.2% 3 6 .2% 29.4% 28.6% 54.7% 86.4% 53.2%
Initia l Premium (1 -W eek) 5.8% 21.7% 11.5% 24.4% 18.7% 6.6% 70.7% 38.5% 38.9%
Final Premium (1-W eek) 16 .8% 44.0% 17.0% 42.2% 35.0% 26.3% 78.5% 67.8% 46.4%
Initia l Premium (1 -Month) 15 .8% 7.8% 9.4% 33.5% 26.1% 23.4% 56.5% 5.6% 40.9%
Final Premium (1-Month) 27 .9% 27.5% 14.9% 52.6% 43.5% 45.7% 63.6% 27.9% 47.8%
Initia l Premium (3 -Month) 28 .6% 0.1% 7.7% 28.4% 40.3% 30.7% 25.3% -2.6% 9.9%
Final Premium (3-Month) 41 .9% 18.4% 13.1% 46.7% 59.6% 54.9% 30.9% 18.0% 16.1%
Change in Ta rget Price (3 Months to Announcement) 26 .4% -19.3% 6.8% -16.1% 19.6% 31.8% -42.1% -15.3% -37.1%
VIXIndex at Announcement (1-Month Average ) 20.7 20.7 22.1 20.3 22.1 29.0 37.6 45.6 38.4
VIXIndex at Bump (1-We ek Average) 32.1 28.6 29.1 29.4 29.8 28.2 37.4 36.7 32.5
S&P 50 0 Level (At Announcement) 150 9.84 1451 .34 1491 .56 1 492 .25 1491.56 136 4.30 107 2.28 965.80 108 0.99
N otes: Amende d transaction values are calculated based on the relevant prices at the time of amendment. VIX index levels are calculated as averages over the specified time period before either
the announcement or the bump. The method ology for the premiums is described in the main body of the report.
Source: Lehman Brothers.

8/3/2019 Minority Squeeze Final
http://slidepdf.com/reader/full/minority-squeeze-final 33/37
Understa nding Minority Squeeze -O uts
January 3 , 2 0 02 33
A p p e n d i x
Proba b i lit y Fr a m ew ork
In this app end ix, we lay out our framework for calculating the probability of a b ump. To
begin, we assume tha t there a re four possible outcomes of a minority squeeze -out:
1 . The terms are unchanged and the deal is completed. This event happens with joint
probability ),( nbcP .
2 . The terms are unchanged a nd the dea l is terminated. This event happens with joint
probability ),( nbt P .
3 . There is a bump and the dea l is completed. This event happens with joint proba bility
),( bcP . W e a ssume that the bump is of a given size for simplicity.
4 . There is a bump and the dea l is terminated. This event happens with joint proba bility
),( bt P .
Given these outcomes a nd the joint proba bilities, the following relationships must hold:
The proba bilities of the joint outcomes must sum to one.
1),(),(),(),( =+++ bt PbcPnbt PnbcP
Conditional proba bilities of de al completion/ termination must sum to one.
1)|()|(=+ nbt PnbcP
1)|()|( =+ bt PbcP
And finally, the proba bility of a bump a nd the probability of no bump must sum to one.
1)()( =+ bPnbP
W e a lso define the following terms:
Risk arbitrage spread:
C SPt
+−−−= )dP()dP( TT
t
AA
tγ
γ is the original exchange ratio.A
d andT
d a re p resent values of cumulative acquirer
and target dividends until the time of bump, respectively. C is the original cash
consideration. A
tP and T
tP are the current acquirer and target prices, respectively.
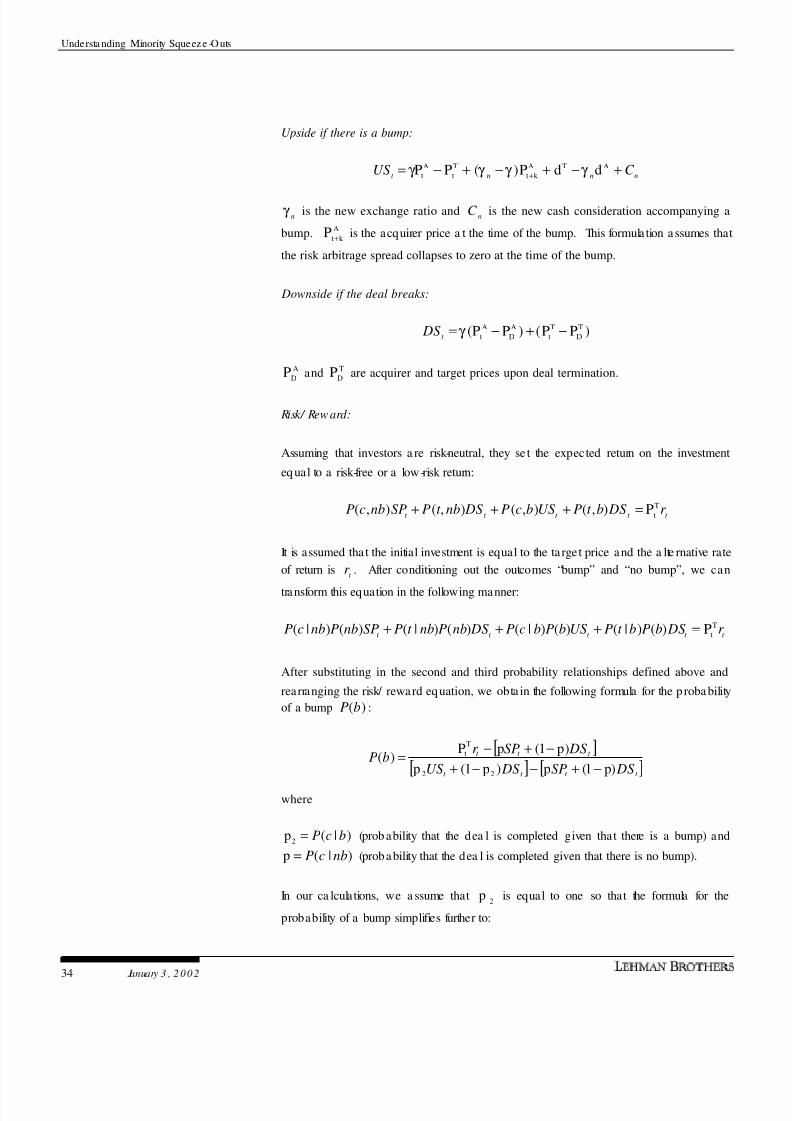
8/3/2019 Minority Squeeze Final
http://slidepdf.com/reader/full/minority-squeeze-final 34/37
Understa nding Minority Squeeze -O uts
34 January 3 , 2 0 0 2
Upside if there is a bump:
nnnt C US +−+−+−=
+
ATA
k t
T
t
A
tddP)(PP γ γ γ γ
nγ is the new exchange ratio and
nC is the new cash consideration accompanying a
bump. A
k tP
+is the acquirer price a t the time of the bump. This formula tion a ssumes that
the risk arbitrage spread collapses to zero at the time of the bump.
Downside if the deal breaks:
)PP()PP( T
D
T
t
A
D
A
t−+−=γ
t DS
A
DP and T
DP are acquirer and target prices upon deal termination.
Risk/ Reward:
Assuming that investors a re risk-neutral, they se t the expected return on the investment
eq ual to a risk-free or a low -risk return:
t t t t t r DSbt PUSbcP DSnbt PSPnbcP
T
tP),(),(),(),( =+++
It is assumed tha t the initial investment is equal to the ta rget price and the a lte rnative rate
of return ist r . After conditioning out the outcomes “bump” and “no bump”, we can
transform this equation in the following manner:
t t t t t r DSbPbt PUSbPbcP DSnbPnbt PSPnbPnbcP
T
tP)()|()()|()()|()()|( =+++
After substituting in the second and third probability relationships defined above and
rearranging the risk/ reward equation, we obta in the following formula for the proba bility
of a bump )(bP :
[ ][ ] [ ]
t t t t
t t t
DSSP DSUS
DSSPr bP
)p1(p)p1(p
)p1(pP)(
22
T
t
−+−−+
−+−=
where
)|(p2
bcP= (prob ability that the dea l is completed given that there is a bump) and
)|(p nbcP= (probability that the dea l is completed given that there is no bump).
In our ca lculations, we a ssume that2
p is equal to one so that the formula for the
probability of a bump simplifies further to:
8/3/2019 Minority Squeeze Final
http://slidepdf.com/reader/full/minority-squeeze-final 35/37
Understa nding Minority Squeeze -O uts
January 3 , 2 0 02 35
[ ][ ]
t t t
t t t
DSSPUS
DSSPr bP
)p1(p
)p1(pP)(
T
t
−+−
−+−=
Tra ding Con s ide ra t ion s
Squeeze -Out Announcement
In many minority squeeze -out situations, following the a nnouncement of the transaction,
the target price trade s through the offer in expectation of a b ump in the terms. Hence,
the risk a rbitrage spread is initia lly nega tive. Arbitrageurs are a ctive b uyers of the target
upon announcement of the offer if they expect the offer to be raised. This requires that
they put up capital, which is justified by the anticipation of a bump and its magnitude.
Fundamental accounts may also increase their holdings to the extent that they believe the
offer undervalues the company. Index accounts are not active in the market since the
target is not a pa rt of a major S&P index (beca use of its small float relative to shares
outstanding).
In stock transactions, the acquirer is typically subject to downward price pressure as
arbitrageurs set up positions. Figure 30 reports the acquirer price rea ctions to deal
announcements in our sample. O n averag e, the decline in the acquirer price 5 % over
the week following announcement.
Figure 30: Acquirer Price Reaction to Squeeze-Out Announcement
AXF/ AXA INF/ VIA DZA/ DELB TCM/ TYC Average
1 -Day -7 .7% -2.3% -6 .0% 1.6% -3.6%
1-W eek -9 .4% -3.7% -7 .2% 0.5% -5.0%
2-W eeks -9 .2% -4.4% -9 .2% 1.9% -5.2%
N otes: The w eight of the AXF/ AXA transaction in the average is based on the stock portion of thetransaction.
Source: Lehman Brothers.
Announcement of Bump
W hen a bump is announced , the price moves to a level that is less than the value of the
new offer. This may be be low or above its pre-bump level depending on the price
reaction of the a cquirer in a stock dea l. The risk arbitrage spread turns positive, but is
typically very narrow. Many arbitrageurs may unwind their positions because the sprea d
after the bump is gene rally not a ttractive enough to justify the commitment of capital for
the rest of the dea l. Fundamental accounts may or may not sell depending on their
willingness to hold the acquiring company (in stock exchange offers) and on tax
considerations. Index accounts are not active in the market.
From Bump to Dea l Closing
The sprea d continues to narrow until the dea l closes. The sprea d is typica lly not
a ttractive enough for arbitrageurs. At the time of dea l closing, there would be index-
related (S&P indexes) buying of acquirer shares if the number of acquirer shares to be

8/3/2019 Minority Squeeze Final
http://slidepdf.com/reader/full/minority-squeeze-final 36/37
Understa nding Minority Squeeze -O uts
36 January 3 , 2 0 0 2
issued exceed s 5% of those outstanding. There is typica lly no index activity on the targe t
side.
8/3/2019 Minority Squeeze Final
http://slidepdf.com/reader/full/minority-squeeze-final 37/37
This material has been prepared and/ or issued by Lehman Brothers Inc., member SIPC, and/ or one of its affiliate s (“ Lehman Brothers”) a nd has been approved
by Lehman Brothers International (Europe), regulated by the Securities and Futures Authority, in connection with its distribution in the European Economic Area.
This mate rial is distributed in Japan by Lehman Brothers Ja pan Inc., a nd in Hong Kong by Lehma n Brothers Asia. This mate rial is distributed in Austra lia byLehma n Brothers Austra lia Pty Limited, a nd in Singapore by Lehman Brothers Inc., Singa pore Branch. This document is for information purposes only and it should
not be regarded a s an offer to se ll or as a solicitation of an offer to buy the securities or other instruments mentioned in it. No part of this document may be
reproduced in any manner without the written permission of Lehman Brothers. We do not represent that t his information, including any third-party information, is
accurate or complete an d it should not be relied upon as such. It is provided with the understanding that Lehma n Brothers is not acting in a fiduciary capacity.
Opinions expressed he rein reflect the opinion of Lehman Brothers and a re subject to change without notice. The products mentioned in this document ma y not be
elig ible for sale in some stat es or countries, and they may not be suitable for all types of investors. If an investor has any doubts about product suitability, he
should consult his Lehman Brothers representa tive. The value and the income produced by products may fluctuate , so tha t an investor may ge t back less tha n he
invested. Value and income may be a dversely affected by exchange rates, interes t rates, or other factors. Past performance is not necessarily indicative of futureresults. If a product is income-producing, part of the capital invested ma y be used to pay tha t income. Lehman Brothers may make a market or deal as principal
in the securities mentioned in this document or in options, futures, or other derivatives base d thereon. In addition, Lehman Brothers, its shareholders, directors,
officers and/ or employees, ma y from time to time have long or short positions in such securities or in options, futures, or othe r derivative instruments bas ed
thereon One or more directors officers and/ or employees of Lehman Brothers may be a director of the issuer of the securities mentioned in this document
GLO BALEQUITY DERIVATIVE
New York
101 Hudson StreetJersey City, NJ0 73 02 USA
1.201.524.2568
Lond on
One Broadga te
London EC2 M 7HA England44.20.7256.4275
Tokyo
12 -32 Akasa ka 1 -chome
Minato-ku Tokyo 107 Japa n813.5571.7357
Hong Kong
One Pacific Place88 Queensway, Hong Kong
852.2869.3000
Equ ity Der iva t ives a nd Q ua nt ita t ive Rese a rch
Global Head of Derivatives and Quantitative Research Murali Ramaswa mi, Ph.D .............................. 1.201.524.2568 ............................. [email protected]
Ne w York Ga briela Bae z
Alex E. Budny Claire W. Chan Evren Ergin, Ph.D. James J. Hosker Sugun V. Kapoor Paul K. Lieb erma n Andrew Whittaker
London Head of Europ ea n Derivatives and Q uantitative Resea rch Andrew R. Harmstone ................................ 44.20.7256.4275 ................................ [email protected]
John Carson W illiam Hunter Nicolas Karageorgis Tai-Mey Lim Nicolas J. Mougeot, Ph.D. Roberto Torrese tti
Tokyo Lici W u ................................ ..................... 81.3 .5571.7468 ................................ . . . . . . . [email protected]
Equity Derivatives Sa les New York ................................ .................. 1.201.524.2565 Boston ................................ ....................... 1.617.330.5972 Chicago ................................ .................... 1.312.609.8174 Lond on ................................ .................... 44.20.7260.3070 Frankfurt……………………………………….49.69.15307.7100 Tokyo ................................ .............. 81 .3 .5571 .7330 / 7454 Zurich ................................ ......................... 41.1.287.8989