Embed Size (px)
Citation preview
Minority Population Growth— The New BoomAn Analysis of America’s Changing Demographics
2
Minority Population Growth— The New BoomAn Analysis of America’s Changing Demographics
The start of the twenty-first century has shown increased racial and ethnic diver-sity in music, television programming, advertising, and the American cultural landscape overall. Data from the 2010 Census reveals these changes aren’t just perception but reality. Groups traditionally classified as minorities are now the majority in many local markets and even states.
This significant demographic shift offers challenges as well as opportunities for US businesses large and small. Mainstream products and services sometimes don’t satisfy the culturally diverse preferences of all consumers. Nor will a single homog-enized marketing message resonate with the entire US population. Savvy compa-nies must adapt to ongoing changes to succeed in this diverse marketplace.
In discussing race and ethnicity throughout this brochure, we use the terminol-ogy and definitions provided by the US Census Bureau.
This is the second in a series of pieces exploring how America’s changing demo-graphics impact business. To view the other, titled Is ‘Seniors’ One Demographic Group?, visit esri.com/data-literature.
3
The Next Boom
The face of America is changing to one of many colors and combinations of races. The population that was once predominantly non-Hispanic white is now the melting pot that historians have talked about. Minorities are the majority in many areas of the country, and the number of multiracial people is also increas-ing dramatically.
The impact of the growing minority population is on par with—or greater than—the impact baby boomers have had on American business, consumerism, and culture. But this new demographic phenomenon is more complex due to the diversity of interests, languages, and cultures. Just as the postwar baby boomers have had an impact from their birth to the present, as they enter their retirement years, the effect of the new boom will be long lasting as well.
There truly is a “baby boom” within the new boom because of higher birth rates among most minorities than for non-Hispanic whites. In fact, in 2010, 110 metropolitan statistical areas (MSA)1 had child populations where minorities were the majority.
At some point, using the term minority will no longer make sense. Census figures tell the story.
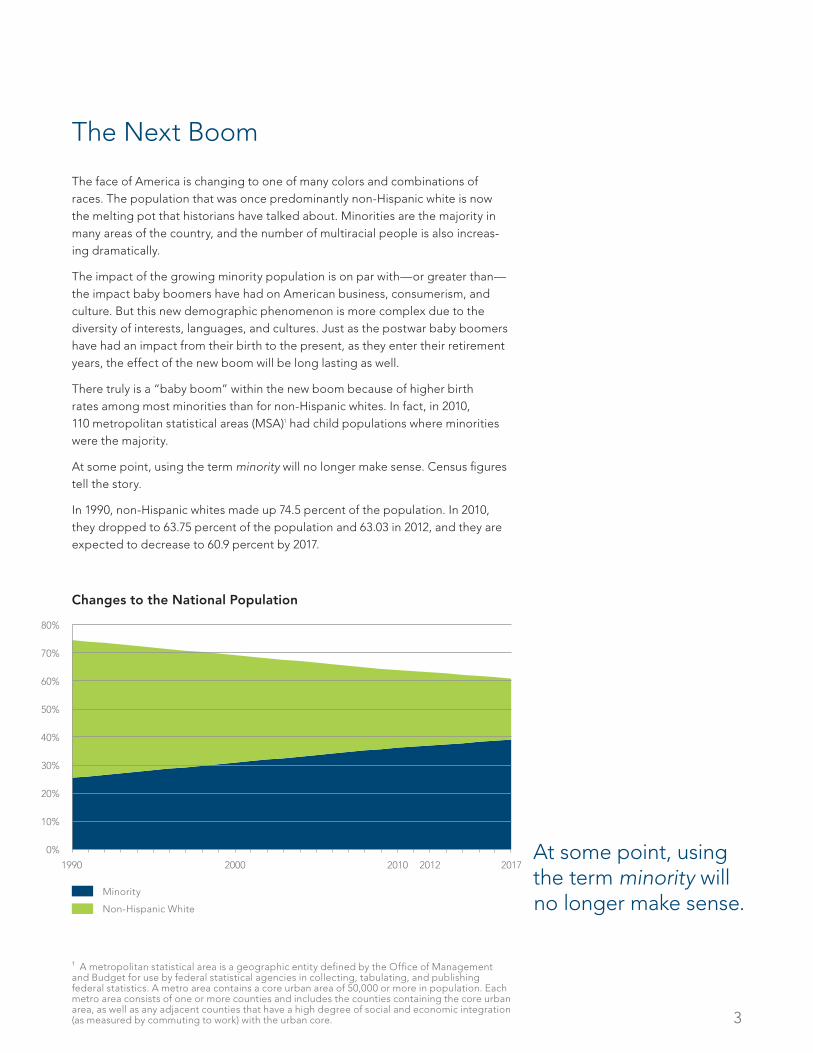
In 1990, non-Hispanic whites made up 74.5 percent of the population. In 2010, they dropped to 63.75 percent of the population and 63.03 in 2012, and they are expected to decrease to 60.9 percent by 2017.
Changes to the National Population
At some point, using the term minority will no longer make sense.
1 A metropolitan statistical area is a geographic entity defined by the Office of Management and Budget for use by federal statistical agencies in collecting, tabulating, and publishing federal statistics. A metro area contains a core urban area of 50,000 or more in population. Each metro area consists of one or more counties and includes the counties containing the core urban area, as well as any adjacent counties that have a high degree of social and economic integration (as measured by commuting to work) with the urban core.
80%
70%
60%
50%
40%
30%
20%
10%
0%
1990 2000 2010 2012 2017
Minority
Non-Hispanic White
4
If current rates of national population change trend as they have for the past 20 years, by 2035, non-Hispanic whites will be outnumbered by minorities. In fact, Hawaii, California, New Mexico, and Texas have minority non-Hispanic white populations today.
This minority-to-majority flip will happen much sooner among the demographic of children under age 18. Non-Hispanic white children are projected to be the minority among that group in less than five years.
Minorities, as defined by the US Census Bureau, are composed of several differ-ent race categories—Black, American Indian, Asian, Pacific Islander, Other, and Two or More races. Hispanics are also considered a minority, though Hispanic, or Latino, is defined by the US Census Bureau as an ethnicity rather than a race.
In the 2010 Census, individuals could identify themselves as either Hispanic or non-Hispanic in combination with one or several races. These classifications can be complex not only for the individuals defining themselves but also for busi-nesses targeting them.
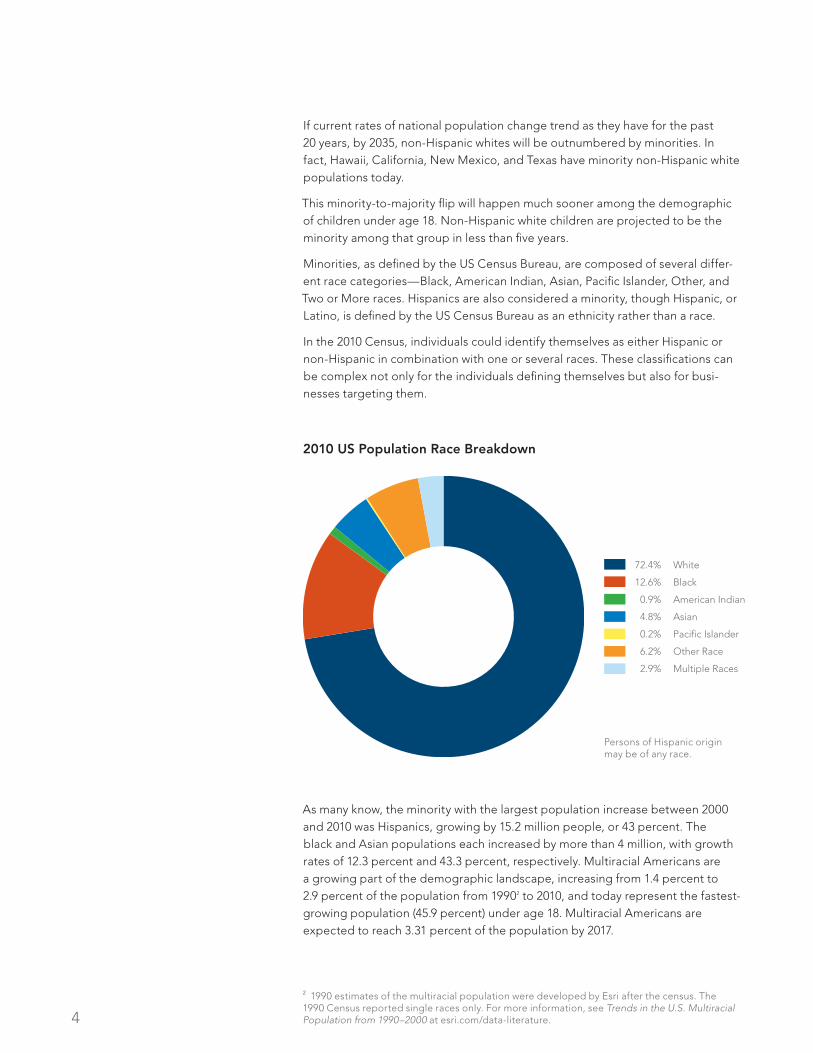
2010 US Population Race Breakdown
2 1990 estimates of the multiracial population were developed by Esri after the census. The 1990 Census reported single races only. For more information, see Trends in the U.S. Multiracial Population from 1990–2000 at esri.com/data-literature.
Persons of Hispanic origin may be of any race.
72.4% White
12.6% Black
0.9% American Indian
4.8% Asian
0.2% Pacific Islander
6.2% Other Race
2.9% Multiple Races
As many know, the minority with the largest population increase between 2000 and 2010 was Hispanics, growing by 15.2 million people, or 43 percent. The black and Asian populations each increased by more than 4 million, with growth rates of 12.3 percent and 43.3 percent, respectively. Multiracial Americans are a growing part of the demographic landscape, increasing from 1.4 percent to 2.9 percent of the population from 19902 to 2010, and today represent the fastest-growing population (45.9 percent) under age 18. Multiracial Americans are expected to reach 3.31 percent of the population by 2017.

5
Dispelling stigmas from the past, many celebrities talk about their diverse racial or ethnic backgrounds. Even our president is biracial. Tiger Woods created his own label to identify his racial composition, calling himself Cablinasian, meaning he’s Caucasian, black, American Indian, and Asian.
Not only is the country becoming a more diverse melting pot, but more and more individuals are melting pots themselves. This trend makes marketing even more complex. Consumers identifying themselves as multiracial may fit the cul-tural paradigms and consumer behaviors of several races or may reflect none.
This change in the demographic makeup of the United States has, and will con-tinue to have, a dramatic effect on American business including how business is conducted, workplace dynamics, languages, lifestyles, and cultural references in packaging and marketing—especially in the products and services offered.
The $2.6 trillion in disposable income from minority consumers3 is a significant and influential force in the American economy.
3 Selig Center Multicultural Economy Study
6
The Changing Dynamic of Metropolitan Areas
The demographic makeup of many metropolitan areas is drastically changing. Cities that were once predominantly non-Hispanic white are becoming more diverse. MSAs in California, New Mexico, and Texas are changing at a faster rate due to immigration and higher birth rates among many minorities in those areas. Non-Hispanic whites were the minority in 46 of the 366 MSAs in 2010, up from just 13 in 1990.
From 1990 to 2010, the Las Vegas, NV MSA experienced the largest decrease in the proportion of non-Hispanic whites, from 73 percent of the total population to 48 percent, a decline of 25 percentage points. Fourteen other MSAs experienced a decrease in the proportion of non-Hispanic whites by more than 20 percentage points. The average decrease in the share of non-Hispanic whites was 8.5 percent-age points. Between 1990 and 2010, only one metropolitan statistical area (Wilm-ington, NC) showed an increase in the non-Hispanic white share of the population.
The Laredo, TX MSA had the lowest proportion of non-Hispanic whites in 1990 (5.5 percent) and 2010 (3.3 percent). The Altoona, PA MSA had the highest proportion of non-Hispanic whites in 1990 (almost 98 percent) but slipped to the number two position in 2010 with a 95.6 percentage of non-Hispanic whites—replaced by the Parkersburg-Marietta-Vienna, WV-OH metropolitan statistical area at 96 percent.
It’s critical for businesses to know which minority populations reside in specific MSAs to effectively localize products, services, and marketing. Hispanics have increased greatly in many southwestern cities, while blacks are the majority in some MSAs in Georgia and South Carolina. American Indians are the predomi-nant minority in rural parts of New Mexico and Arizona. In Honolulu, Hawaii, and San Francisco, California, the largest minority is Asians. Companies need to look at local racial and ethnic mixes to come up with the right marketing campaigns and product strategies to best serve those markets.
Diversity IndexIncreased racial and ethnic diversity was a major trend in the US population between 2000 and 2010. View the Population Diversity Map at esri.com/diversitymap to see the changes. One method of measuring the changing landscape of the US population is through use of Esri’s proprietary Diversity Index, which measures the likelihood that two persons, chosen at random from the same area, belong to different racial or ethnic groups. The Diversity Index for the United States in 2010 was 60.6, up from 54.6 in 2000.
The 2010 Diversity Index varies from state to state, with a high of 81.5 in Hawaii to a low of 11.6 in Maine. By county, the Diversity Index doubled in 150 counties between 2000 and 2010.
The Fresno, CA MSA has a Diversity Index of 85.0, the nation’s highest in 2010. Conversely, the Parkersburg-Marietta-Vienna, WV-OH MSA is the lowest in the country, with a 2010 Diversity Index of 8.2.
The Diversity Index for the US in 2010 was 60.6, up from 54.6 in 2000.
7
Immigration, Fertility, and Household Size The majority population of non-Hispanic whites is the oldest, with a median age of 42 years (2010 Census). Children represent only 20 percent of this population. In the youngest minority, the multiracial population, 46 percent are under the age of 18 years, and their median age is less than 20 years. Among the minor-ity populations, Asian and Pacific Islanders are the oldest, with a median age of 35.5 years. Children represent an average of almost 32 percent of minority popu-lations. Although differences in fertility rates contribute to the widening gap in age, immigration also has a selective effect on the age differences. Immigrants tend to be younger than the US population on average.
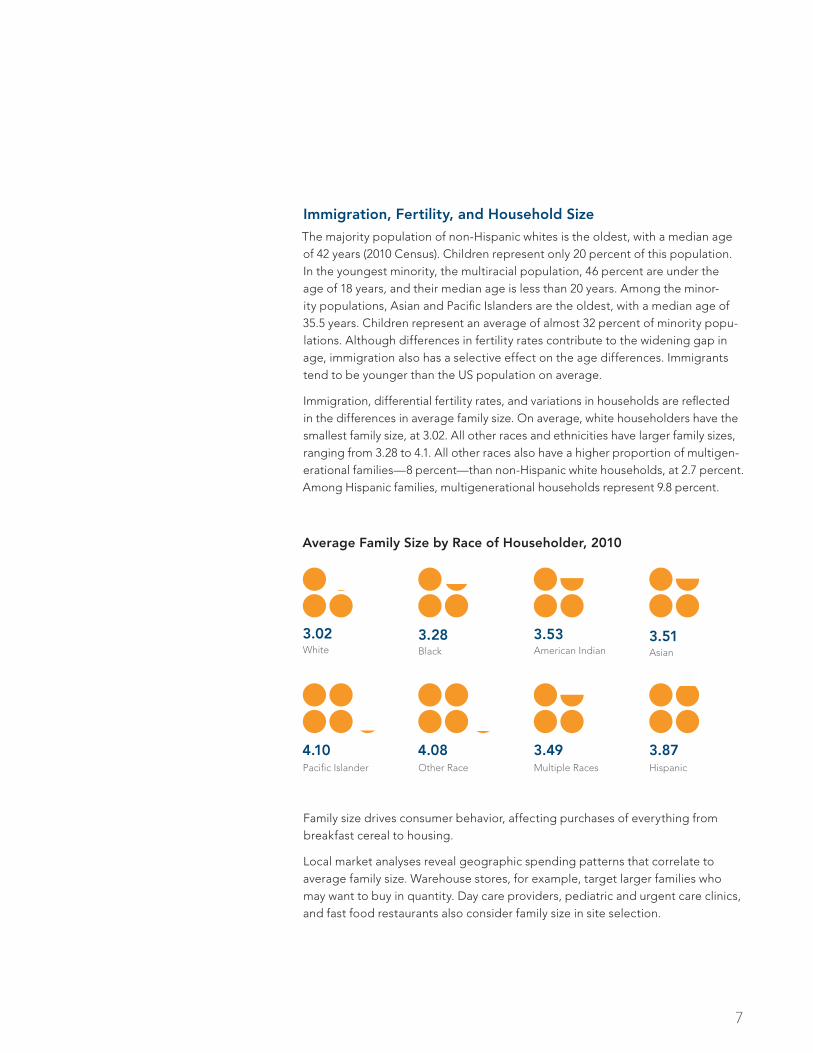
Immigration, differential fertility rates, and variations in households are reflected in the differences in average family size. On average, white householders have the smallest family size, at 3.02. All other races and ethnicities have larger family sizes, ranging from 3.28 to 4.1. All other races also have a higher proportion of multigen-erational families—8 percent—than non-Hispanic white households, at 2.7 percent. Among Hispanic families, multigenerational households represent 9.8 percent.
Average Family Size by Race of Householder, 2010
Family size drives consumer behavior, affecting purchases of everything from breakfast cereal to housing.
Local market analyses reveal geographic spending patterns that correlate to average family size. Warehouse stores, for example, target larger families who may want to buy in quantity. Day care providers, pediatric and urgent care clinics, and fast food restaurants also consider family size in site selection.
3.02White
3.53American Indian
4.10Pacific Islander
3.49Multiple Races
3.28Black
3.51Asian
4.08Other Race
3.87Hispanic
8
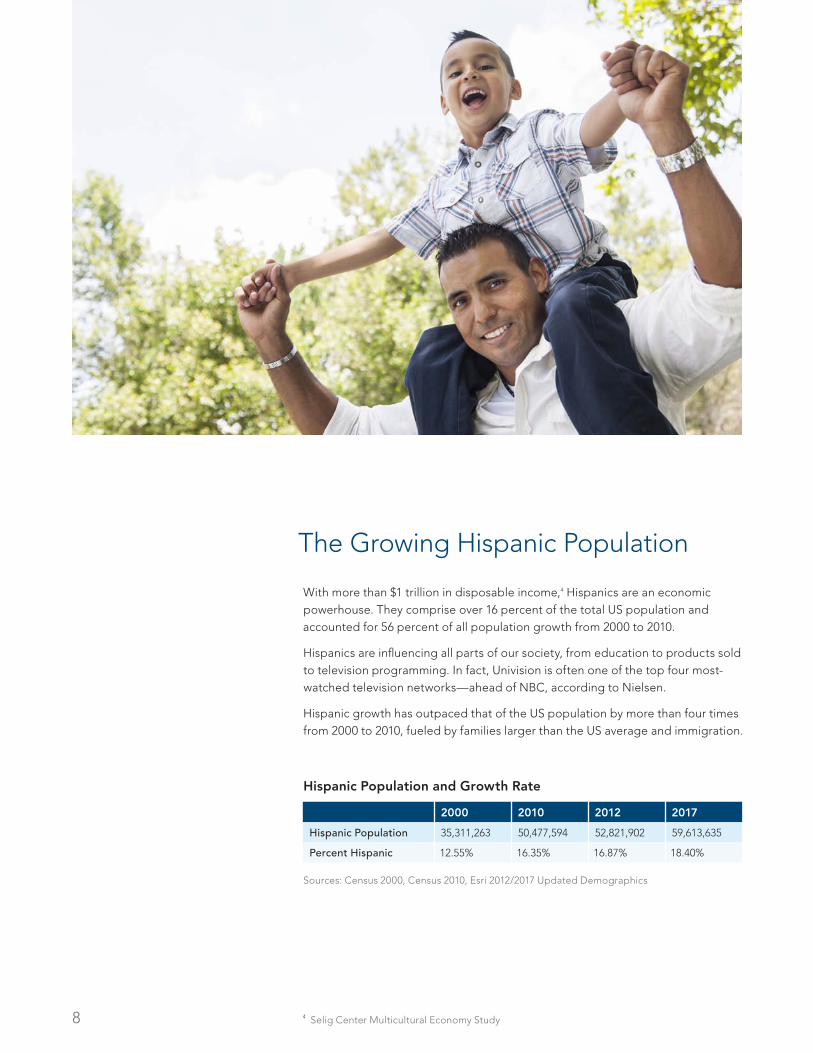
The Growing Hispanic Population
With more than $1 trillion in disposable income,4 Hispanics are an economic powerhouse. They comprise over 16 percent of the total US population and accounted for 56 percent of all population growth from 2000 to 2010.
Hispanics are influencing all parts of our society, from education to products sold to television programming. In fact, Univision is often one of the top four most-watched television networks—ahead of NBC, according to Nielsen.
Hispanic growth has outpaced that of the US population by more than four times from 2000 to 2010, fueled by families larger than the US average and immigration.
Hispanic Population and Growth Rate
2000 2010 2012 2017
Hispanic Population 35,311,263 50,477,594 52,821,902 59,613,635
Percent Hispanic 12.55% 16.35% 16.87% 18.40%
Sources: Census 2000, Census 2010, Esri 2012/2017 Updated Demographics
4 Selig Center Multicultural Economy Study
9
Where do they live? The metropolitan areas with the largest Hispanic populations are located in the largest cities, like Los Angeles, New York, and Miami. Border states and Florida have high concentrations of Hispanics; however, information from the 2010 Census shows growth of the Hispanic population across the country.
The higher fertility of the Hispanic population has contributed to the majority-minority flip nationwide and to the drastically changing demographics in specific markets.
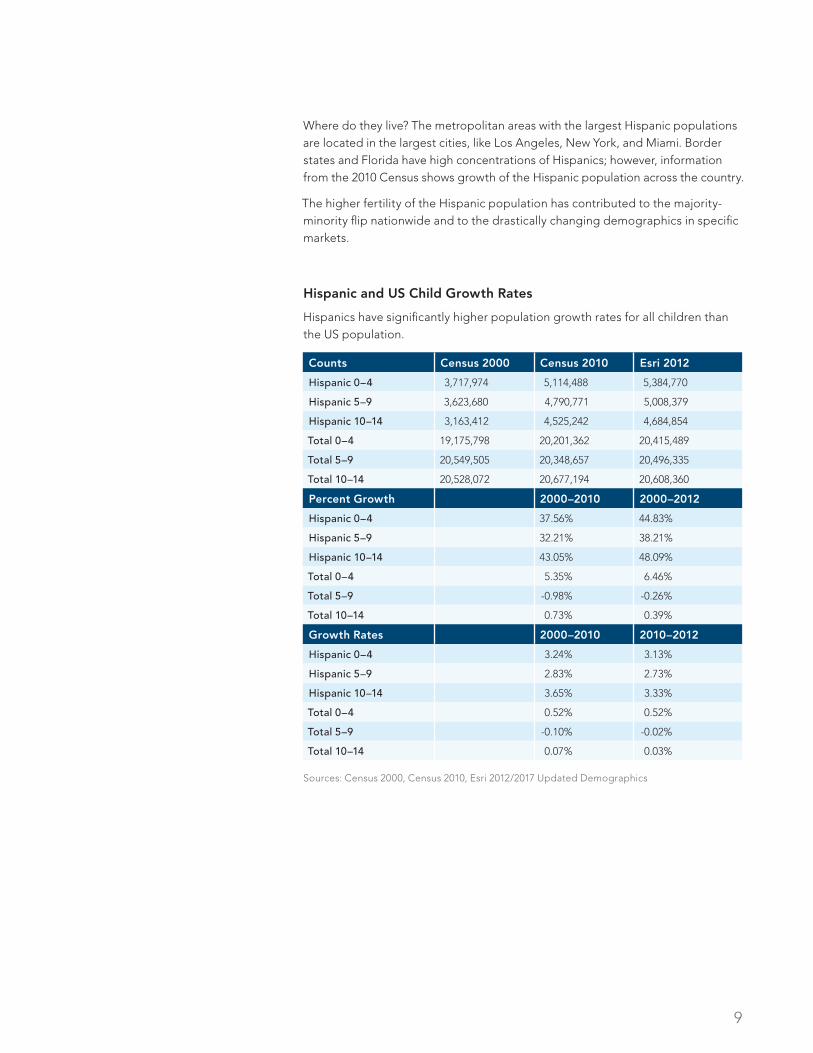
Hispanic and US Child Growth Rates
Hispanics have significantly higher population growth rates for all children than the US population.
Counts Census 2000 Census 2010 Esri 2012
Hispanic 0–4 3,717,974 5,114,488 5,384,770
Hispanic 5–9 3,623,680 4,790,771 5,008,379
Hispanic 10–14 3,163,412 4,525,242 4,684,854
Total 0–4 19,175,798 20,201,362 20,415,489
Total 5–9 20,549,505 20,348,657 20,496,335
Total 10–14 20,528,072 20,677,194 20,608,360
Percent Growth 2000–2010 2000–2012
Hispanic 0–4 37.56% 44.83%
Hispanic 5–9 32.21% 38.21%
Hispanic 10–14 43.05% 48.09%
Total 0–4 5.35% 6.46%
Total 5–9 -0.98% -0.26%
Total 10–14 0.73% 0.39%
Growth Rates 2000–2010 2010–2012
Hispanic 0–4 3.24% 3.13%
Hispanic 5–9 2.83% 2.73%
Hispanic 10–14 3.65% 3.33%
Total 0–4 0.52% 0.52%
Total 5–9 -0.10% -0.02%
Total 10–14 0.07% 0.03%
Sources: Census 2000, Census 2010, Esri 2012/2017 Updated Demographics
10
In Texas, for instance, from 2000 to 2010, more than 90 percent of growth in the population of children aged 0–14 years occurred among Hispanics.
Census 2010 shows that every metropolitan area had increases in Hispanic child populations except for one, which might be quite surprising—Los Angeles. The decrease in Los Angeles may be attributed to high housing costs followed by high unemployment during the Great Recession.
How can businesses succeed in capturing this growing multicultural market? As our culture becomes richer, communicating and interacting with different racial and ethnic groups present challenges and opportunities for businesses. Success-ful companies must accommodate increased population diversity by providing products and services in appropriate, easily understood languages that will appeal to these multicultural populations.
“The numbers are impressive,” says Jeff Humphreys, director of the Selig Center and author of the Selig Center’s annual Multicultural Economy report. “For exam-ple, in 2012, the $1.2 trillion Hispanic market is larger than the entire economies of all but 13 countries in the world.” This number is expected to increase as more young Hispanics enter the work force and others move up the career ladder.
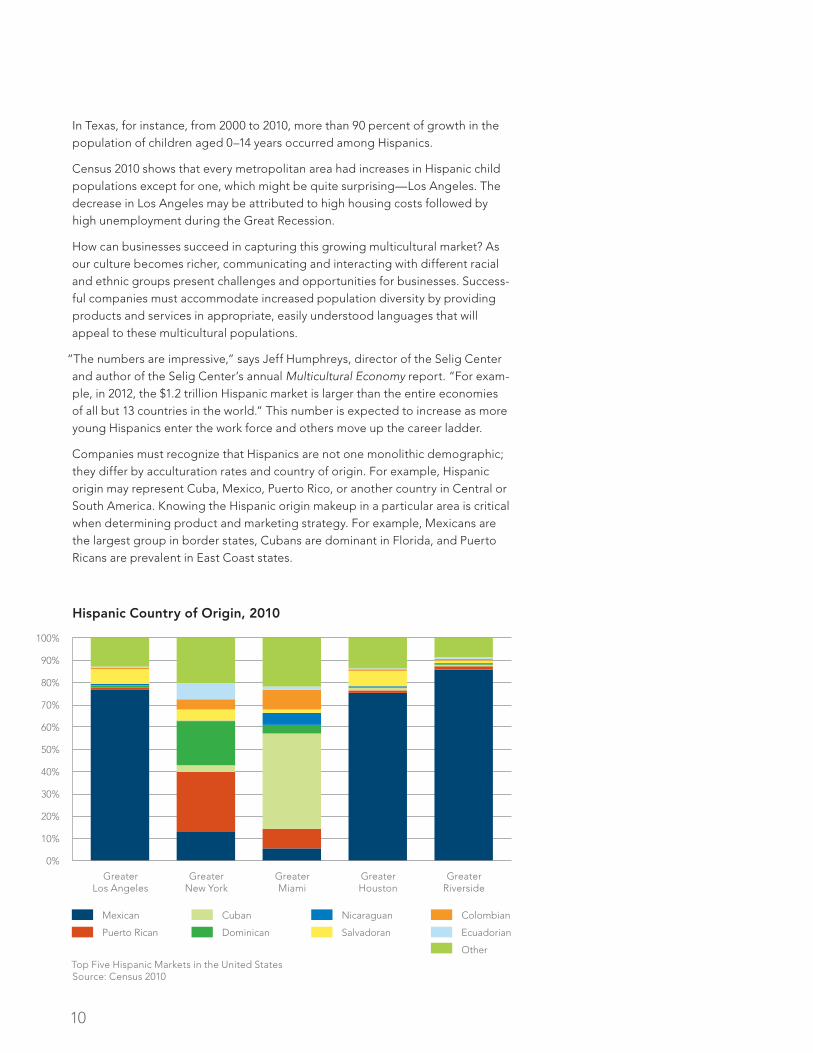
Companies must recognize that Hispanics are not one monolithic demographic; they differ by acculturation rates and country of origin. For example, Hispanic origin may represent Cuba, Mexico, Puerto Rico, or another country in Central or South America. Knowing the Hispanic origin makeup in a particular area is critical when determining product and marketing strategy. For example, Mexicans are the largest group in border states, Cubans are dominant in Florida, and Puerto Ricans are prevalent in East Coast states.
Hispanic Country of Origin, 2010
Top Five Hispanic Markets in the United States Source: Census 2010
Greater Los Angeles
Greater New York
Greater Houston
Greater Riverside
Greater Miami
100%
90%
80%
70%
60%
50%
40%
30%
20%
10%
0%
Mexican
Puerto Rican
Cuban
Dominican
Nicaraguan
Salvadoran
Colombian
Ecuadorian
Other
11
More than 88 percent of blacks live in major metropolitan areas.
Companies must also consider the impact of acculturation rates and language isolation, particularly in communities where many Hispanic households are multigenerational. Grandparents often remain at home to care for young chil-dren while the parents go out and work. School-aged children are often better assimilated, speaking English with ease and frequently acting as interpreters for less fluent family members. People in many households speak English at work and school but return to their origin country’s customs and languages at home. Younger people are assimilating more rapidly by adopting social media as a pri-mary method of communication; nearly everyone uses a cell phone to make calls, take photos, and send text messages to friends and family. This high cell phone usage provides businesses with multiple opportunities to send messages and promotions specifically tailored to attract Hispanic consumers.
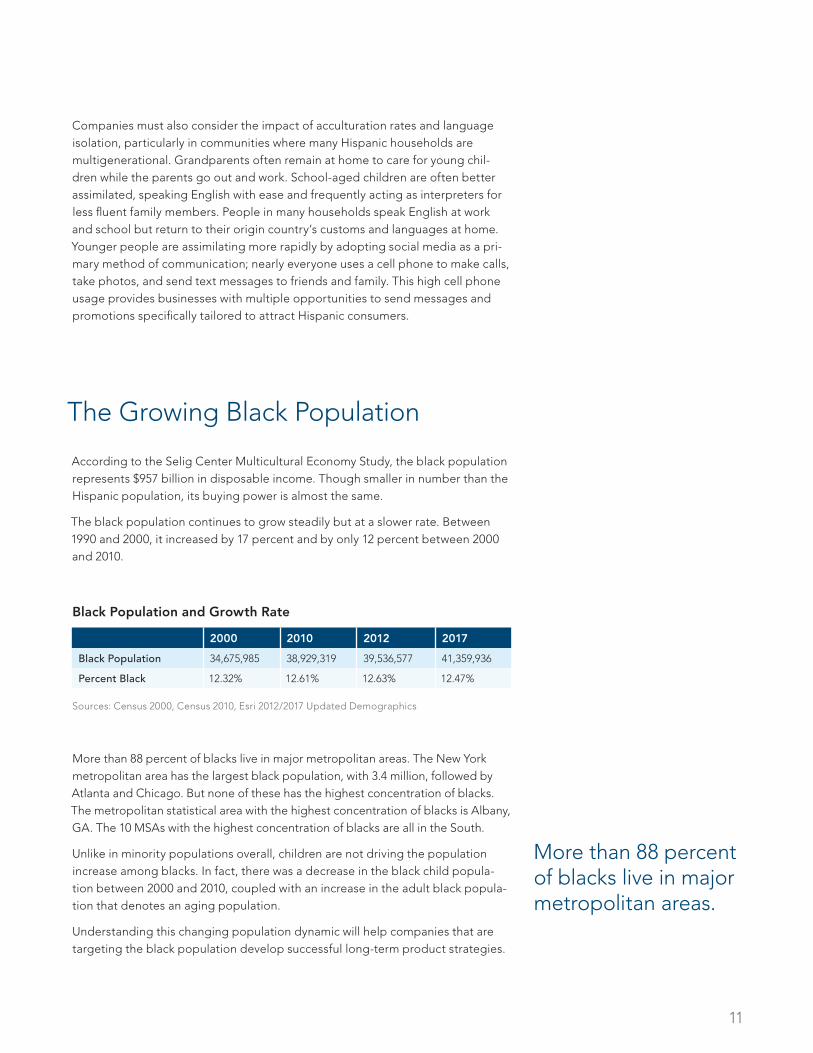
The Growing Black Population
According to the Selig Center Multicultural Economy Study, the black population represents $957 billion in disposable income. Though smaller in number than the Hispanic population, its buying power is almost the same.
The black population continues to grow steadily but at a slower rate. Between 1990 and 2000, it increased by 17 percent and by only 12 percent between 2000 and 2010.
Black Population and Growth Rate
2000 2010 2012 2017
Black Population 34,675,985 38,929,319 39,536,577 41,359,936
Percent Black 12.32% 12.61% 12.63% 12.47%
Sources: Census 2000, Census 2010, Esri 2012/2017 Updated Demographics
More than 88 percent of blacks live in major metropolitan areas. The New York metropolitan area has the largest black population, with 3.4 million, followed by Atlanta and Chicago. But none of these has the highest concentration of blacks. The metropolitan statistical area with the highest concentration of blacks is Albany, GA. The 10 MSAs with the highest concentration of blacks are all in the South.
Unlike in minority populations overall, children are not driving the population increase among blacks. In fact, there was a decrease in the black child popula-tion between 2000 and 2010, coupled with an increase in the adult black popula-tion that denotes an aging population.
Understanding this changing population dynamic will help companies that are targeting the black population develop successful long-term product strategies.
12
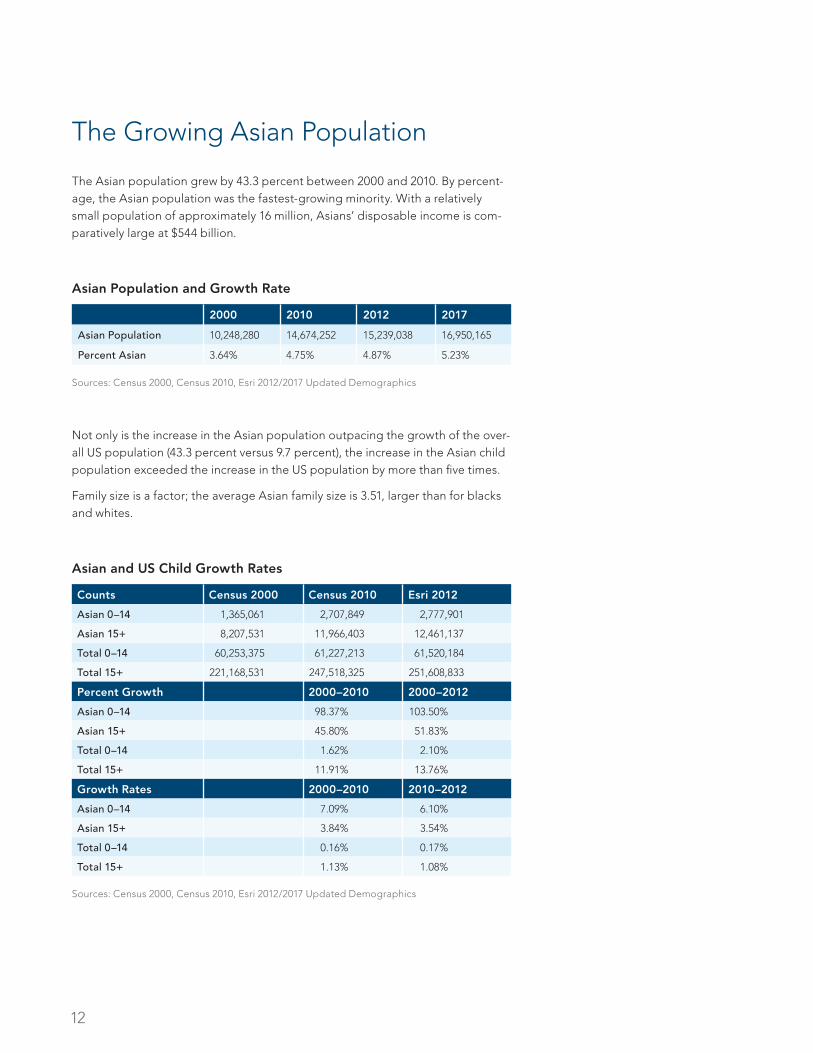
The Growing Asian Population
The Asian population grew by 43.3 percent between 2000 and 2010. By percent-age, the Asian population was the fastest-growing minority. With a relatively small population of approximately 16 million, Asians’ disposable income is com-paratively large at $544 billion.
Asian Population and Growth Rate
2000 2010 2012 2017
Asian Population 10,248,280 14,674,252 15,239,038 16,950,165
Percent Asian 3.64% 4.75% 4.87% 5.23%
Sources: Census 2000, Census 2010, Esri 2012/2017 Updated Demographics
Not only is the increase in the Asian population outpacing the growth of the over-all US population (43.3 percent versus 9.7 percent), the increase in the Asian child population exceeded the increase in the US population by more than five times.
Family size is a factor; the average Asian family size is 3.51, larger than for blacks and whites.
Asian and US Child Growth Rates
Counts Census 2000 Census 2010 Esri 2012
Asian 0–14 1,365,061 2,707,849 2,777,901
Asian 15+ 8,207,531 11,966,403 12,461,137
Total 0–14 60,253,375 61,227,213 61,520,184
Total 15+ 221,168,531 247,518,325 251,608,833
Percent Growth 2000–2010 2000–2012
Asian 0–14 98.37% 103.50%
Asian 15+ 45.80% 51.83%
Total 0–14 1.62% 2.10%
Total 15+ 11.91% 13.76%
Growth Rates 2000–2010 2010–2012
Asian 0–14 7.09% 6.10%
Asian 15+ 3.84% 3.54%
Total 0–14 0.16% 0.17%
Total 15+ 1.13% 1.08%
Sources: Census 2000, Census 2010, Esri 2012/2017 Updated Demographics

The rate of growth for Asians is expected to decrease in the future, according to Esri demographers.
Asians tend to cluster in large MSAs. The largest Asian populations are, as with other minorities, in the largest cities such as Los Angeles, New York, and Chi-cago. Concentration of the Asian population, though, tells a different story. Honolulu has the highest Asian concentration of any MSA in the United States. San Jose, California, and San Francisco also have high concentrations of Asians.
Asians are the most diverse minority, including populations of Chinese, Japa-nese, Indians, Thais, Filipinos, Koreans, Vietnamese, and more. Asians don’t have a common culture, heritage, or language but are all from Eastern, or Oriental, parts of the world, as defined by the US Census Bureau.
This diversity represents a significant challenge for businesses targeting Asians. For instance, in the city of San Francisco, the total population is 805,235. Asians number 267,915, or 33.3 percent of the total population. Within that figure, 64.3 percent is Chinese, 13.6 percent is Filipino, and 3.6 percent is Korean. Because of different languages and cultural differences, a single product won’t widely appeal. Nor will a single marketing campaign.
14
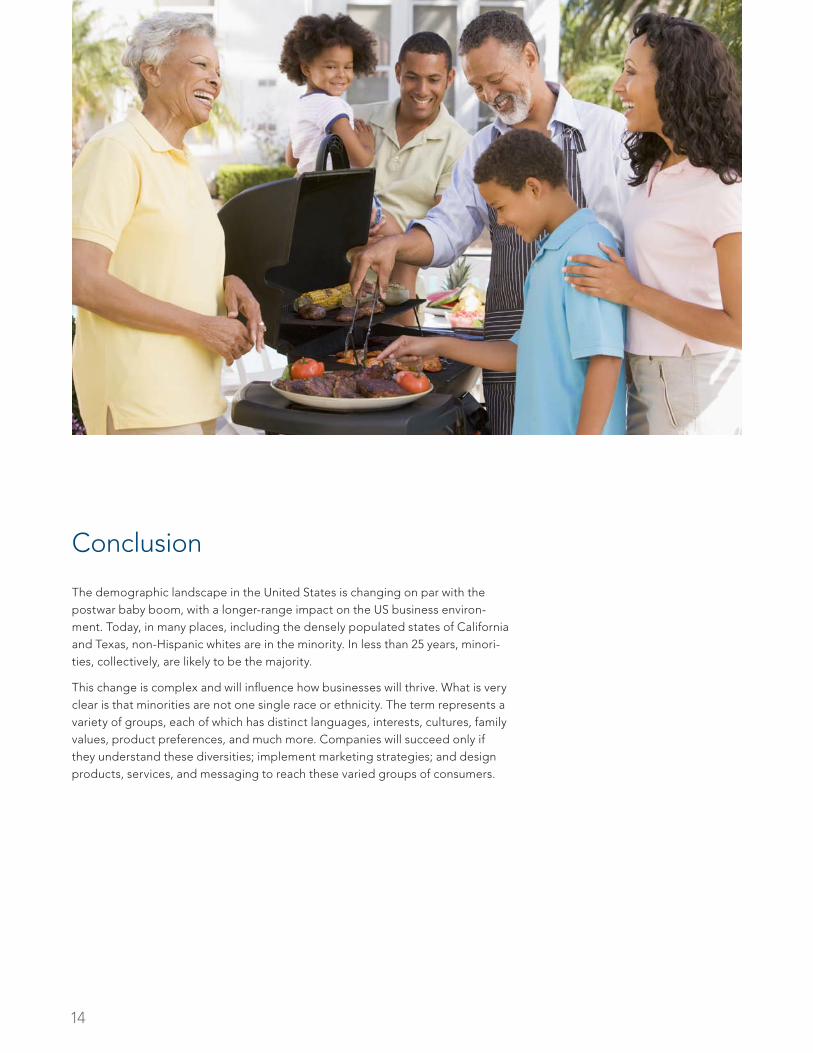
Conclusion
The demographic landscape in the United States is changing on par with the postwar baby boom, with a longer-range impact on the US business environ-ment. Today, in many places, including the densely populated states of California and Texas, non-Hispanic whites are in the minority. In less than 25 years, minori-ties, collectively, are likely to be the majority.
This change is complex and will influence how businesses will thrive. What is very clear is that minorities are not one single race or ethnicity. The term represents a variety of groups, each of which has distinct languages, interests, cultures, family values, product preferences, and much more. Companies will succeed only if they understand these diversities; implement marketing strategies; and design products, services, and messaging to reach these varied groups of consumers.
15
More information can be found at esri.com/data
About Esri Data
Esri provides the most accurate and comprehensive demographic, lifestyle seg-mentation, consumer spending, and business data to help you profile customers, analyze markets, evaluate competitors, and identify opportunities.
Esri’s data development team has a 30-year history of excellence in market intelligence, combining the expertise of economists, statisticians, demographers, geographers, and analysts. The team develops datasets, including demographic updates, Tapestry™ Segmentation, consumer spending, market potential, and Retail MarketPlace, that are now industry standards.
Other Resources
Demographic, Consumer, and Business Data Information about how Esri’s demographic, lifestyle segmentation, consumer spending, and business data helps businesses profile customers, analyze markets, evaluate competitors, and identify opportunities
esri.com/data
Tapestry Segmentation Classifies US residential neighborhoods into 65 unique market segments based on socioeconomic and demographic characteristics to help businesses understand and segment consumer lifestyles and lifestages
esri.com/tapestry
Esri® Business Analyst™ Enables analysis of demographic and business data in report or detailed, custom map formats
esri.com/ba
Esri Community Analyst Web-based service for analyzing demographic, community health, and crime data
esri.com/ca

Printed in USA
Contact Esri
380 New York Street Redlands, California 92373-8100 usa
1 800 447 9778 t 909 793 2853 f 909 793 5953 [email protected] esri.com
Offices worldwide esri.com/locations
Esri inspires and enables people to positively impact their future through a deeper, geographic understanding of the changing world around them.
Governments, industry leaders, academics, and nongovernmental
organizations trust us to connect them with the analytic knowledge
they need to make the critical decisions that shape the planet. For
more than 40 years, Esri has cultivated collaborative relationships
with partners who share our commitment to solving earth’s most
pressing challenges with geographic expertise and rational resolve.
Today, we believe that geography is at the heart of a more resilient
and sustainable future. Creating responsible products and solutions
drives our passion for improving quality of life everywhere.
Copyright © 2012 Esri. All rights reserved. Esri, the Esri globe logo, Business Analyst, Tapestry, @esri.com, and esri.com are trademarks, service marks, or registered marks of Esri in the United States, the European Community, or certain other jurisdictions. Other companies and products or services mentioned herein may be trademarks, service marks, or registered marks of their respective mark owners.
G55784ESRI12/12dh