Embed Size (px)
DESCRIPTION
Minnesota Wing Aircrew Training: Tasks P-2012, O-2013, O-2003. Controlled and Special Use Airspace Plot a Route on a Sectional Chart Grid Sectional Charts. Controlled and Special Use Airspace. Controlled and Special-Use Airspace. Military Operating Area (MOA) (Magenta hatched outline) - PowerPoint PPT Presentation
Citation preview
Scanner Course #4
Minnesota Wing Aircrew Training: Tasks P-2012, O-2013, O-2003
Controlled and Special Use Airspace
Plot a Route on a Sectional Chart
Grid Sectional Charts
Scanner Course #4
Controlled and Special Use Airspace
Scanner Course #4
Controlled and Special-Use Airspace
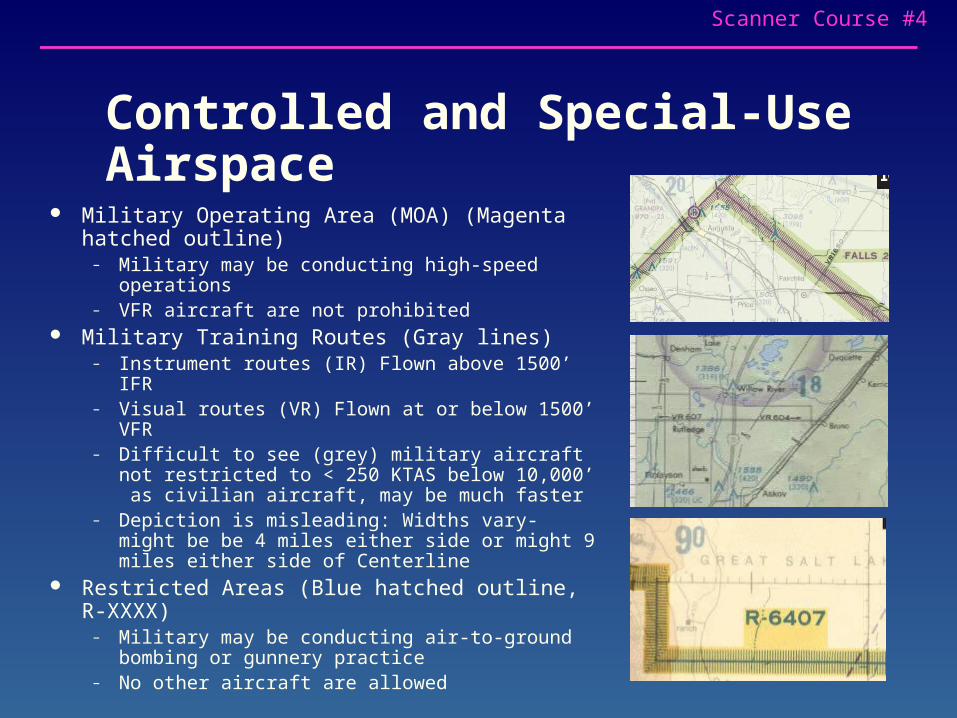
Military Operating Area (MOA) (Magenta hatched outline)
– Military may be conducting high-speed operations– VFR aircraft are not prohibited
Military Training Routes (Gray lines)– Instrument routes (IR) Flown above 1500’ IFR– Visual routes (VR) Flown at or below 1500’ VFR– Difficult to see (grey) military aircraft not restricted
to < 250 KTAS below 10,000’ as civilian aircraft, may be much faster
– Depiction is misleading: Widths vary- might be be 4 miles either side or might 9 miles either side of Centerline
Restricted Areas (Blue hatched outline, R-XXXX)
– Military may be conducting air-to-ground bombing or gunnery practice
– No other aircraft are allowed
Scanner Course #4
Controlled and Special-Use Airspace
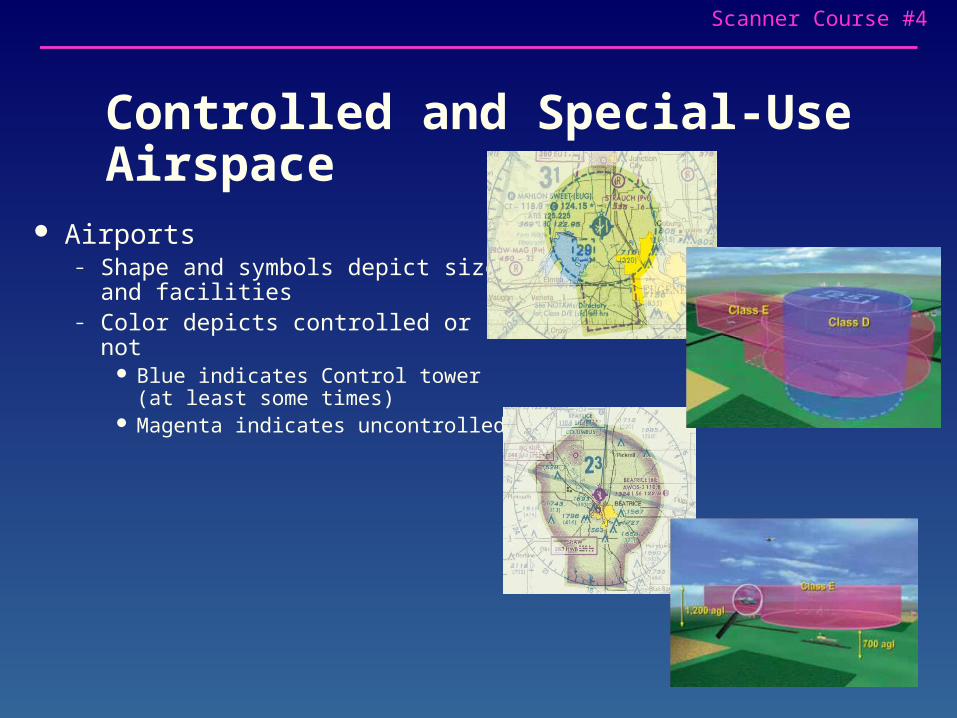
Airports– Shape and symbols depict size
and facilities– Color depicts controlled or not
Blue indicates Control tower (at least some times)
Magenta indicates uncontrolled
Scanner Course #4
Controlled and Special-Use Airspace
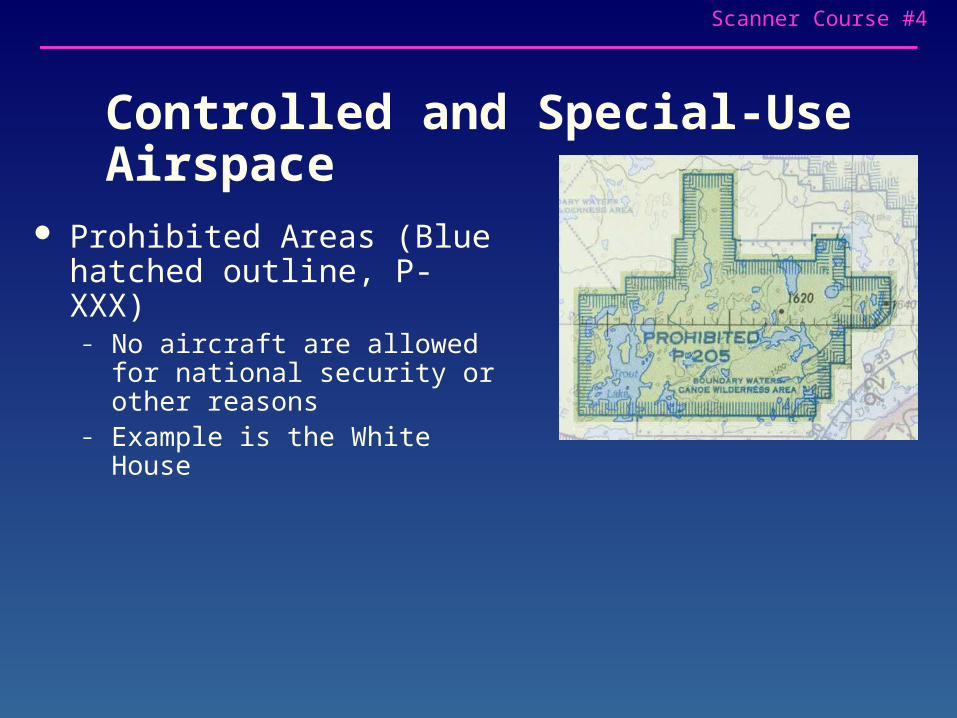
Prohibited Areas (Blue hatched outline, P-XXX)
– No aircraft are allowed for national security or other reasons
– Example is the White House
Scanner Course #4
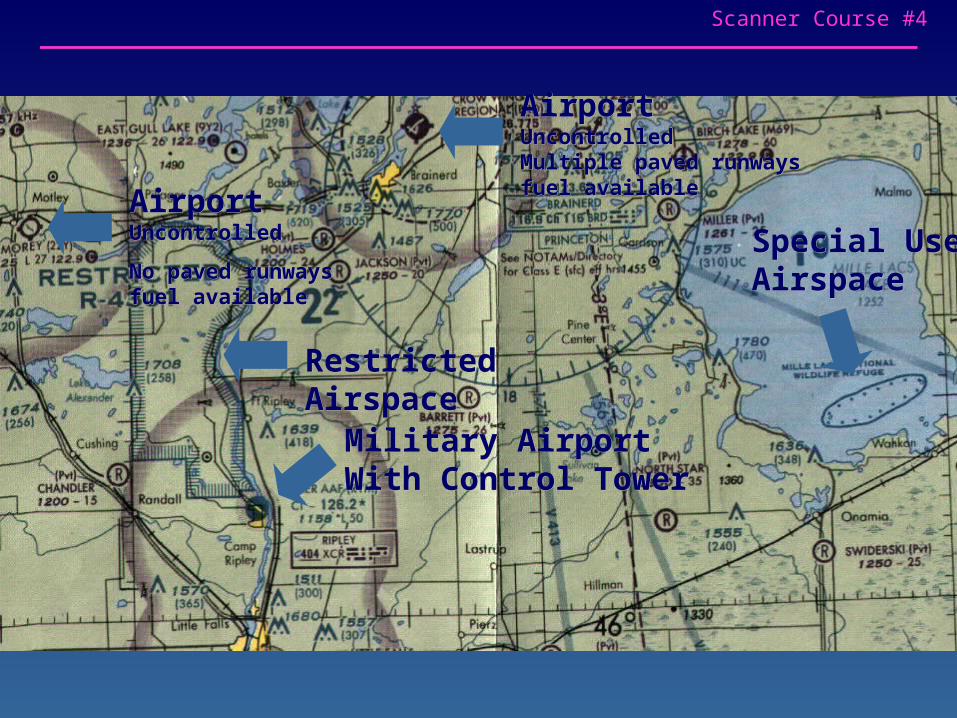
Military AirportMilitary AirportWith Control TowerWith Control Tower
Restricted AirspaceRestricted Airspace
Special Use Special Use AirspaceAirspace
AirportAirportUncontrolledUncontrolled
No paved runwaysNo paved runwaysfuel availablefuel available
AirportAirportUncontrolledUncontrolledMultiple paved runwaysMultiple paved runwaysfuel availablefuel available
Scanner Course #4
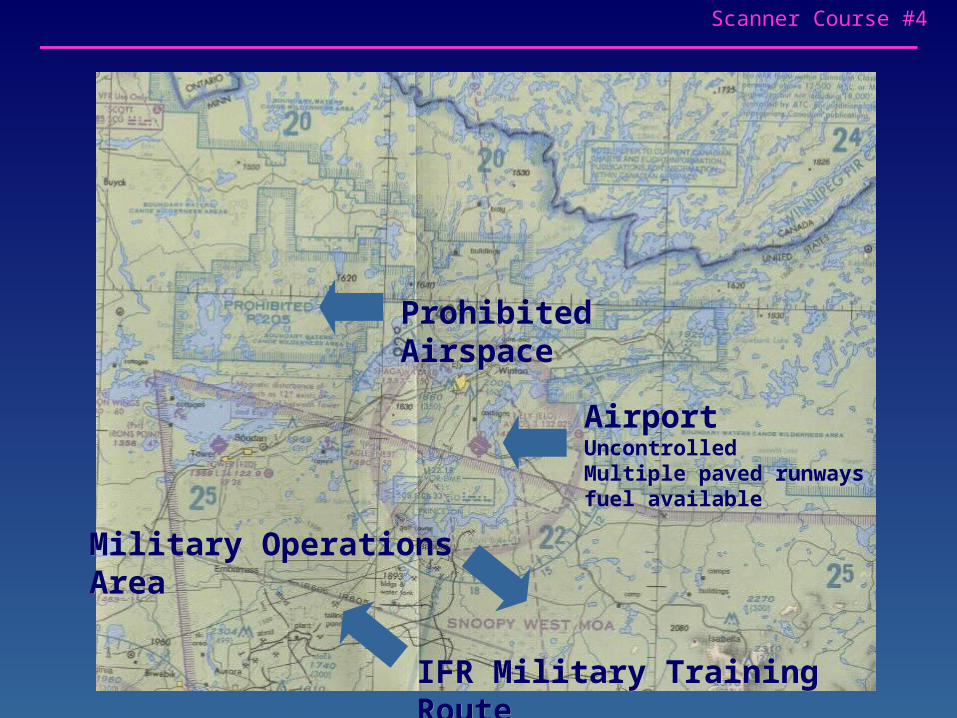
Military Operations AreaMilitary Operations Area
Prohibited AirspaceProhibited Airspace
AirportAirportUncontrolledUncontrolledMultiple paved runwaysMultiple paved runwaysfuel availablefuel available
IFR Military Training RouteIFR Military Training Route
Scanner Course #4
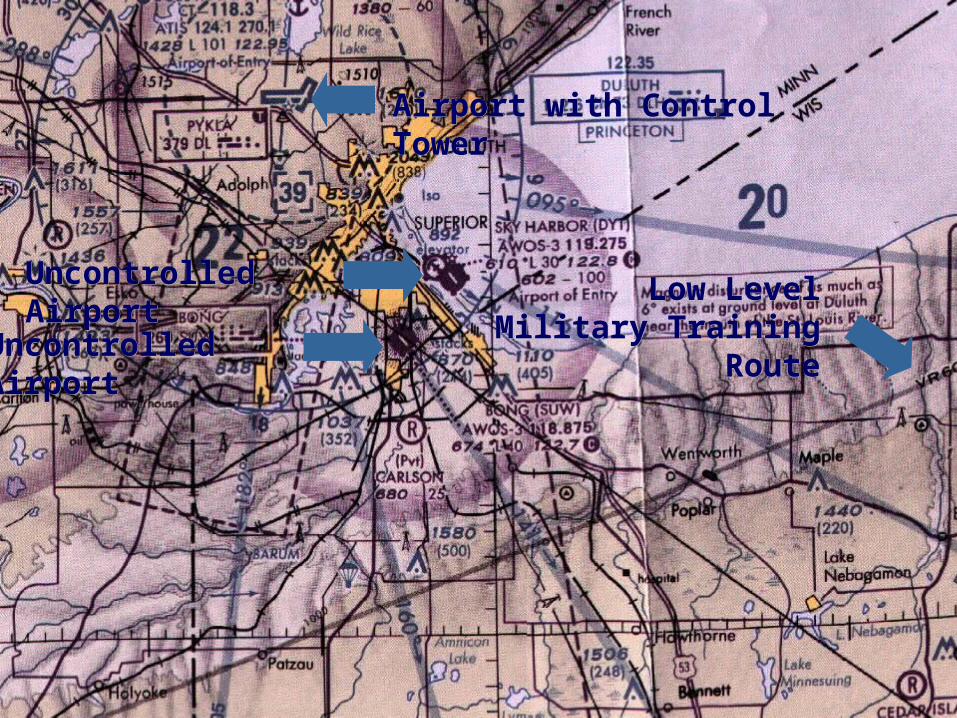
Airport with Control TowerAirport with Control Tower
Low LevelLow LevelMilitary Training RouteMilitary Training Route
Uncontrolled AirportUncontrolled Airport
Uncontrolled AirportUncontrolled Airport
Scanner Course #4
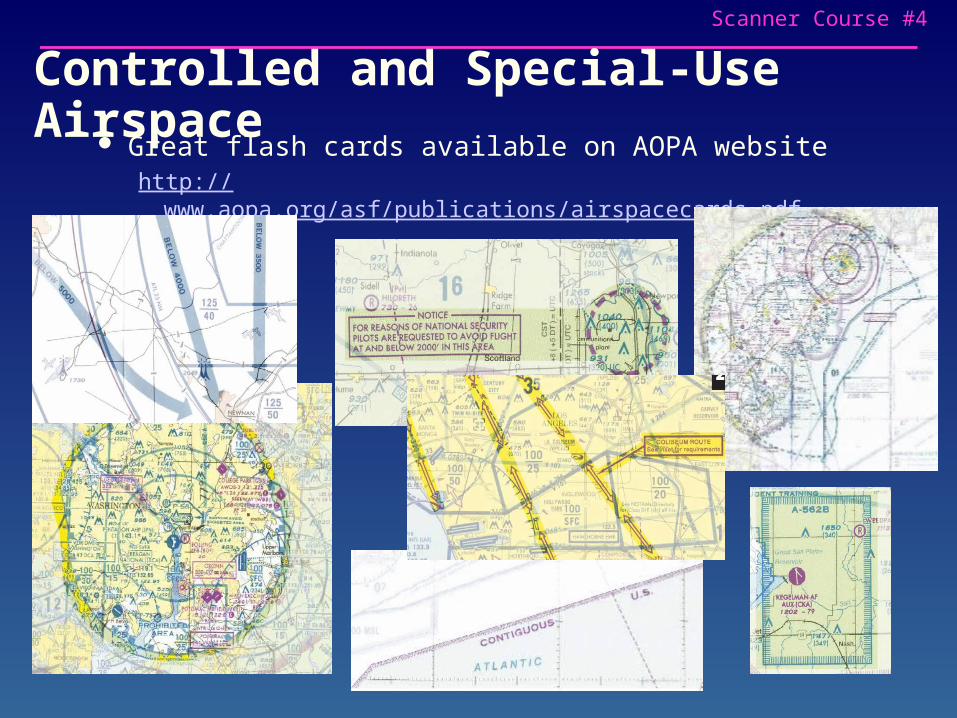
Controlled and Special-Use Airspace Great flash cards available on AOPA website
http://www.aopa.org/asf/publications/airspacecards.pdf
Scanner Course #4
Plot a Route on a Sectional Chart
Scanner Course #4
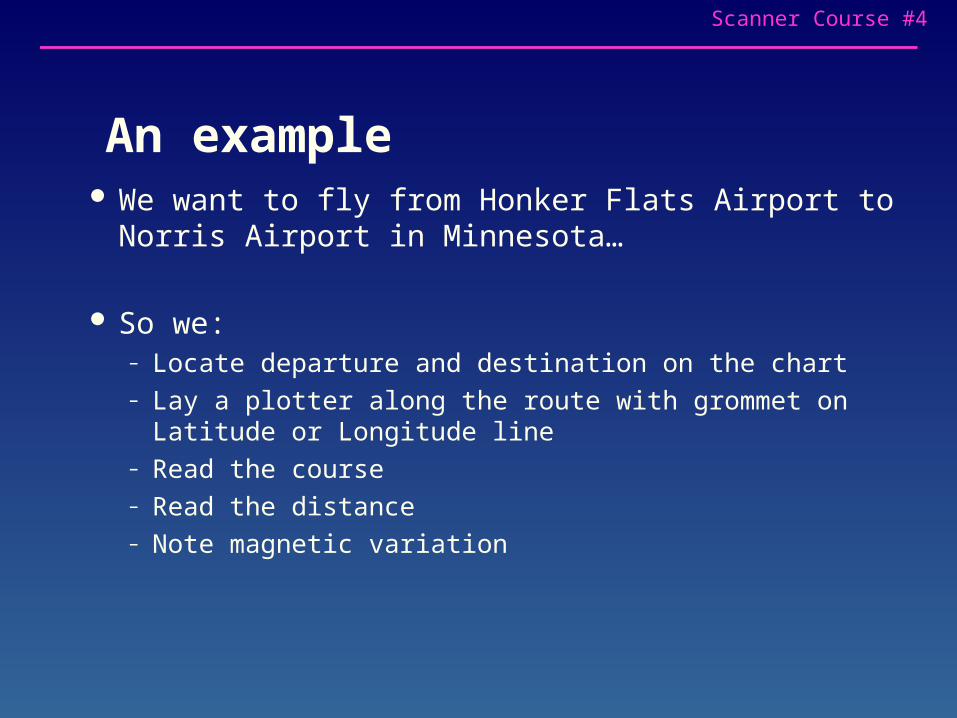
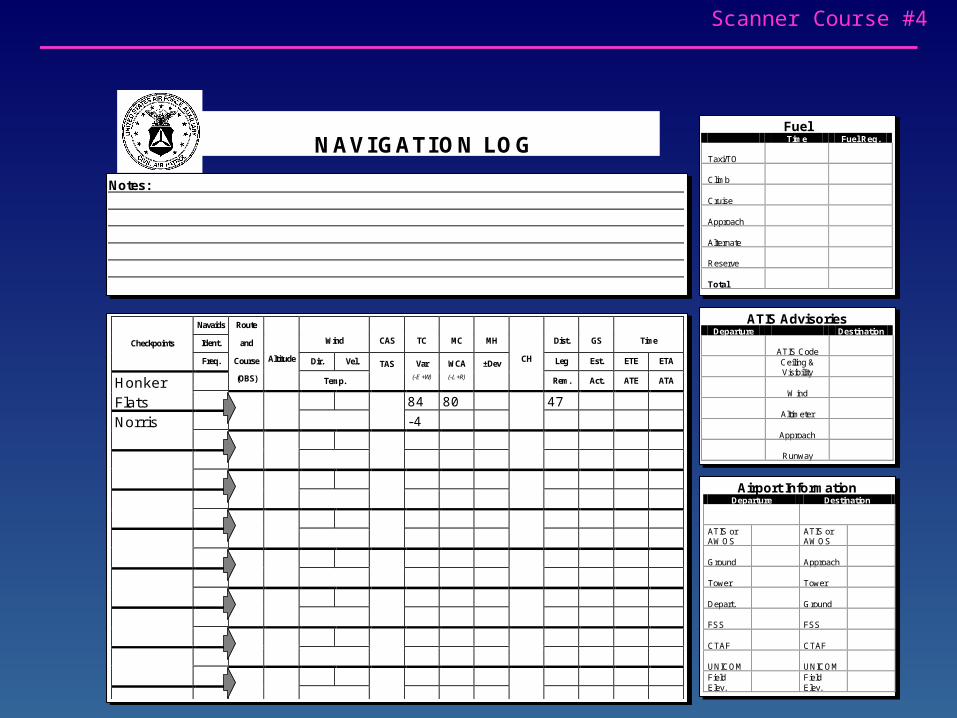
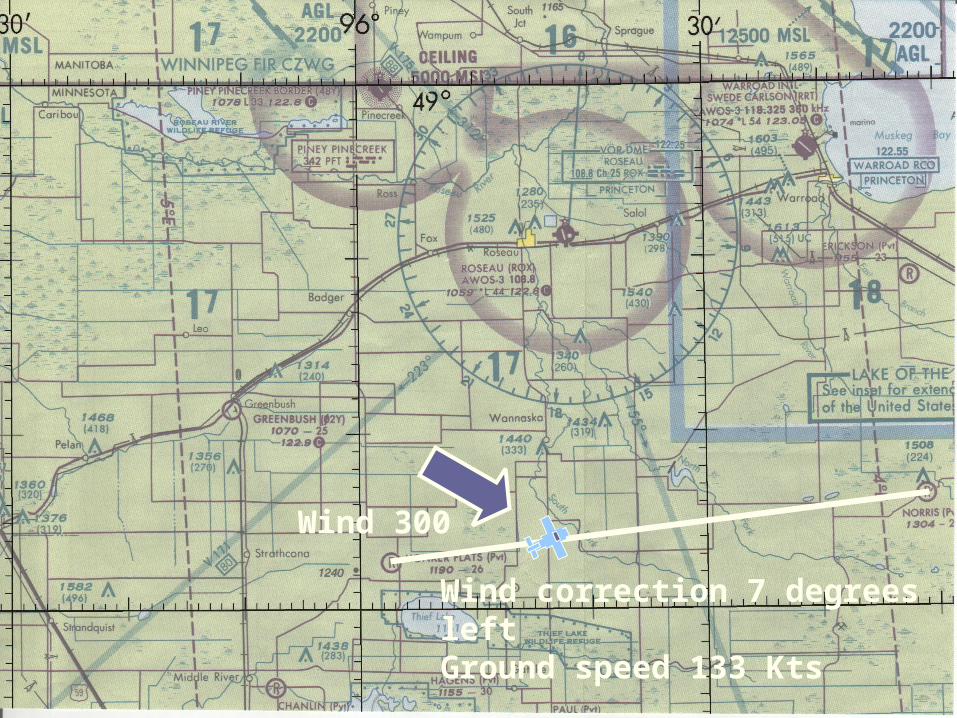
An example We want to fly from Honker Flats Airport to Norris Airport
in Minnesota…
So we:– Locate departure and destination on the chart– Lay a plotter along the route with grommet on Latitude or
Longitude line– Read the course– Read the distance– Note magnetic variation
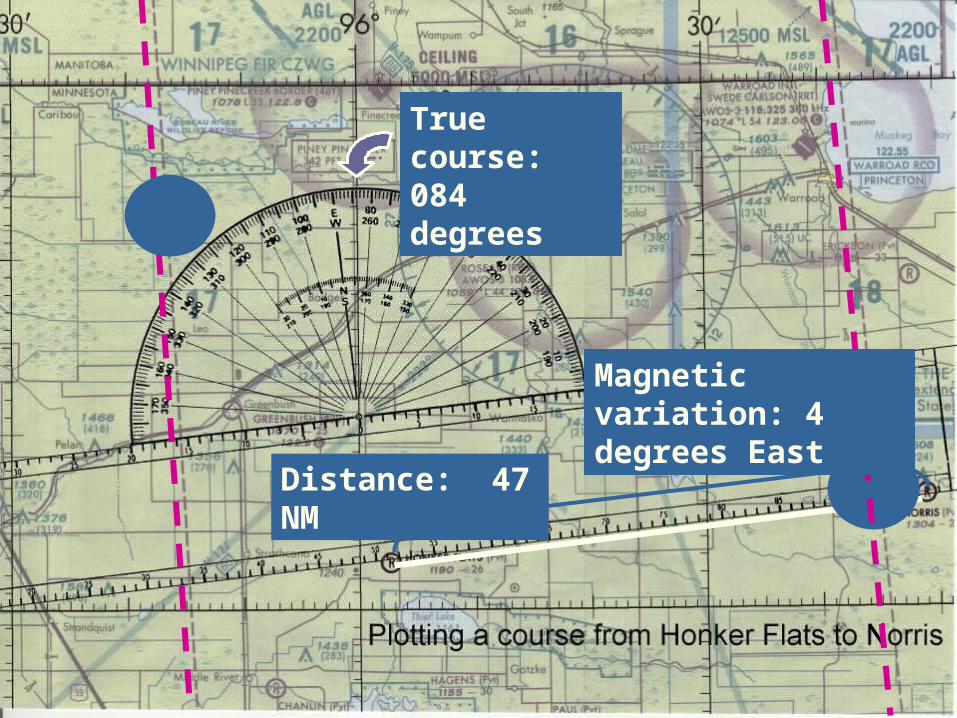
Scanner Course #4Plotting a course
True course:084 degrees
Distance: 47 NM
Magnetic variation: 4 degrees East
Scanner Course #4
Dead reckoning: The calculation, part one
True course
minus East magnetic variance
or plus West magnetic variance
equals magnetic course
Scanner Course #4
Fuel
Time Fuel Req. Taxi/TO
Climb
Cruise
Approach
Alternate
Reserve
Total
ATIS Advisories Departure Destination
ATIS Code
Ceiling & Visibility
Wind
Altimeter
Approach
Runway
Airport Information
Departure Destination
ATIS or AWOS
ATIS or AWOS
Ground
Approach
Tower
Tower
Depart.
Ground
FSS
FSS
CTAF
CTAF
UNICOM
UNICOM
Field Elev.
Field Elev.
Notes:
NAVIGATION LOG
Navaids
Route
Checkpoints
Ident.
and Wind CAS TC MC MH Dist. GS Time
Freq.
Course Altitude
Dir.
Vel.
TAS
Var
WCA
±Dev CH
Leg
Est.
ETE
ETA
Honker (OBS)
Temp. (-E +W) (-L +R)
Rem.
Act.
ATE
ATA
Flats 84 80 47
Norris -4
Scanner Course #4
Dead reckoning: The calculation, part 2
Magnetic course
minus left wind correction
or plus right wind correction
Equals magnetic heading
Distance divided by ground speed
Equals estimated time enroute (ETE)
Scanner Course #4
Additional information needed to compute wind correction angle and ground speed
True Airspeed 115 Kts– Determined from tables in the aircraft’s POH (pilot
operating handbook)– Depends on altitude and engine power setting
Wind 300 at 24 Kts– Determined from winds aloft forecast
Scanner Course #4
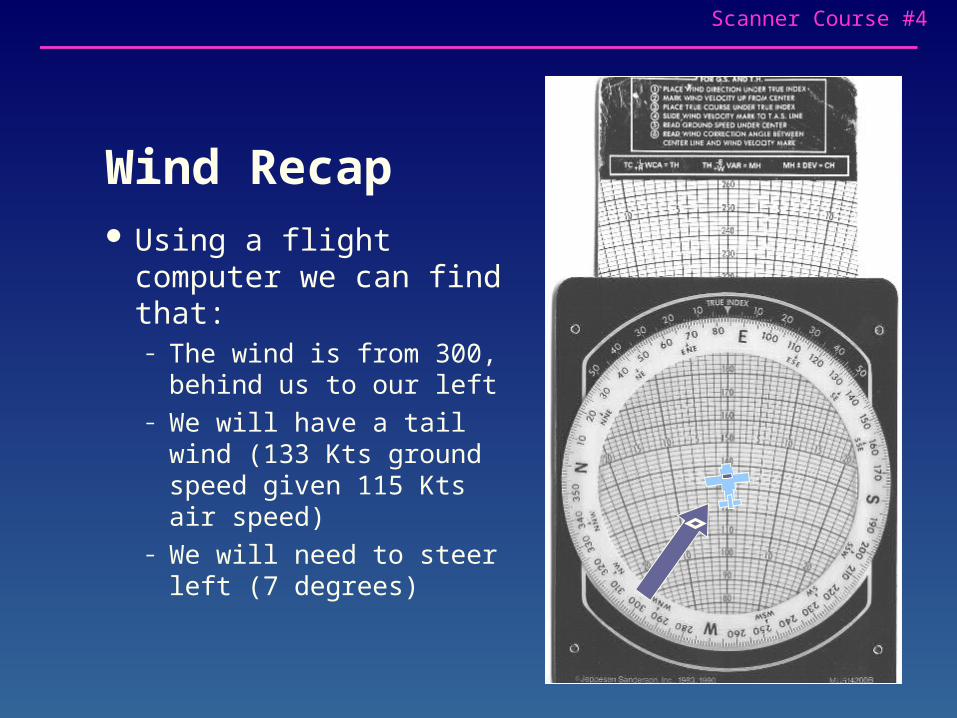
Wind Recap Using a flight computer
we can find that:– The wind is from 300,
behind us to our left– We will have a tail wind
(133 Kts ground speed given 115 Kts air speed)
– We will need to steer left (7 degrees)
Scanner Course #4
Wind 300
Wind correction 7 degrees leftGround speed 133 Kts
Scanner Course #4
Fuel
Time Fuel Req. Taxi/TO
Climb
Cruise
Approach
Alternate
Reserve
Total
ATIS Advisories Departure Destination
ATIS Code
Ceiling & Visibility
Wind
Altimeter
Approach
Runway
Airport Information
Departure Destination
ATIS or AWOS
ATIS or AWOS
Ground
Approach
Tower
Tower
Depart.
Ground
FSS
FSS
CTAF
CTAF
UNICOM
UNICOM
Field Elev.
Field Elev.
Notes:
NAVIGATION LOG
Navaids
Route
Checkpoints
Ident.
and Wind CAS TC MC MH Dist. GS Time
Freq.
Course Altitude
Dir.
Vel.
TAS
Var
WCA
±Dev CH
Leg
Est.
ETE
ETA
Honker (OBS)
Temp. (-E +W) (-L +R)
Rem.
Act.
ATE
ATA
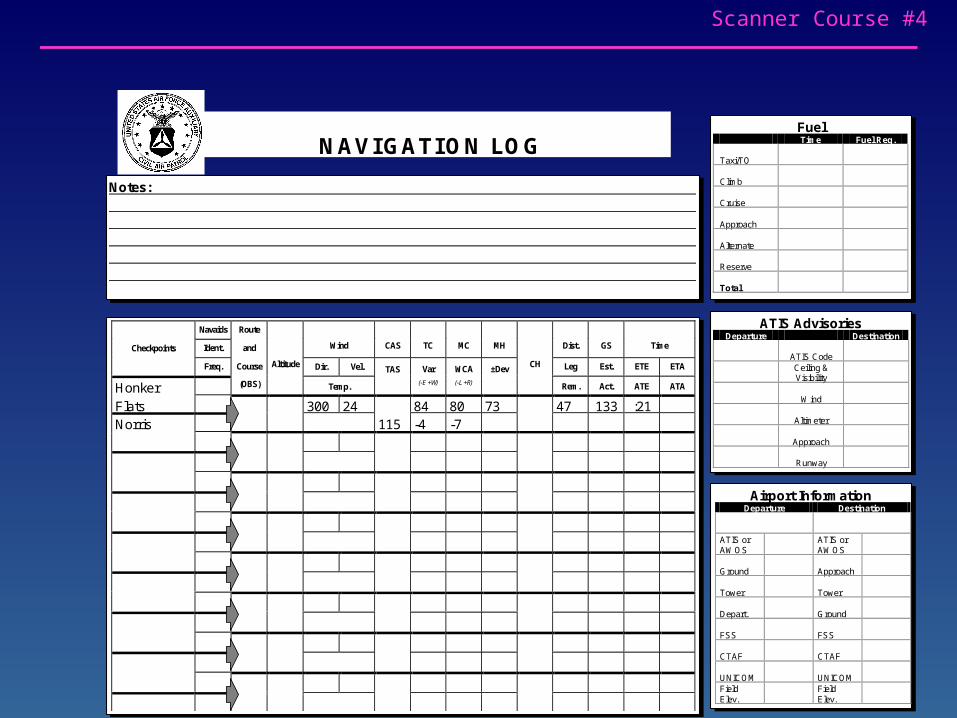
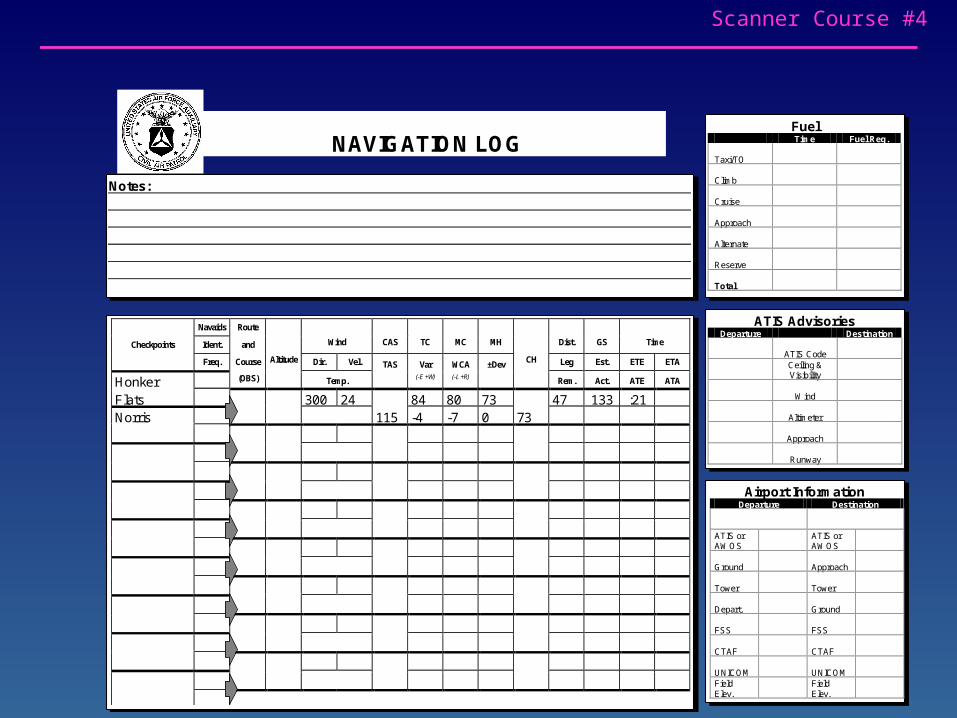
Flats 300 24 84 80 73 47 133 :21
Norris 115 -4 -7
Scanner Course #4
Dead reckoning: The calculation, part 3
Magnetic heading
plus or minus magnetic deviation
Equals compass heading
Scanner Course #4
Dead reckoning: magnetic deviation
Magnetic deviation is determined by looking at the ‘compass card’ inside the aircraft– Magnetic deviation is the effect of compass error
due to metal and magnetic fields inside the aircraft
For our example, we’ll say that the deviation is zero, so magnetic heading and compass heading are the same
Scanner Course #4
Fuel
Time Fuel Req. Taxi/TO
Climb
Cruise
Approach
Alternate
Reserve
Total
ATIS Advisories Departure Destination
ATIS Code
Ceiling & Visibility
Wind
Altimeter
Approach
Runway
Airport Information
Departure Destination
ATIS or AWOS
ATIS or AWOS
Ground
Approach
Tower
Tower
Depart.
Ground
FSS
FSS
CTAF
CTAF
UNICOM
UNICOM
Field Elev.
Field Elev.
Notes:
NAVIGATION LOG
Navaids
Route
Checkpoints
Ident.
and Wind CAS TC MC MH Dist. GS Time
Freq.
Course Altitude
Dir.
Vel.
TAS
Var
WCA
±Dev CH
Leg
Est.
ETE
ETA
Honker (OBS)
Temp. (-E +W) (-L +R)
Rem.
Act.
ATE
ATA
Flats 300 24 84 80 73 47 133 :21
Norris 115 -4 -7 0 73
Scanner Course #4
Dead Reckoning: recap
Primary navigation instruments are compass (or directional gyro) and clock
Predictive, mathematical, in nature Based, in part, on forecast information Primary limitation:
– Accuracy of forecast
Scanner Course #4
Checkpoints (Pilotage) Tick marks at 2, 4, 5, or 10 NM or other spacing can be used to
help keep track of position– At 120 kts, 4 NM tick marks represent 2 minutes of flight
Prominent features easily seen from the air (cites, towns, lakes, and rivers) make the best checkpoints
Can be circled before the flight for easy reference Takes practice
– Seasons make a difference, especially winter– Be careful using lakes – be sure of the shape and placement next to other
features– Difficult in sparse areas– Difficult at night
Scanner Course #4
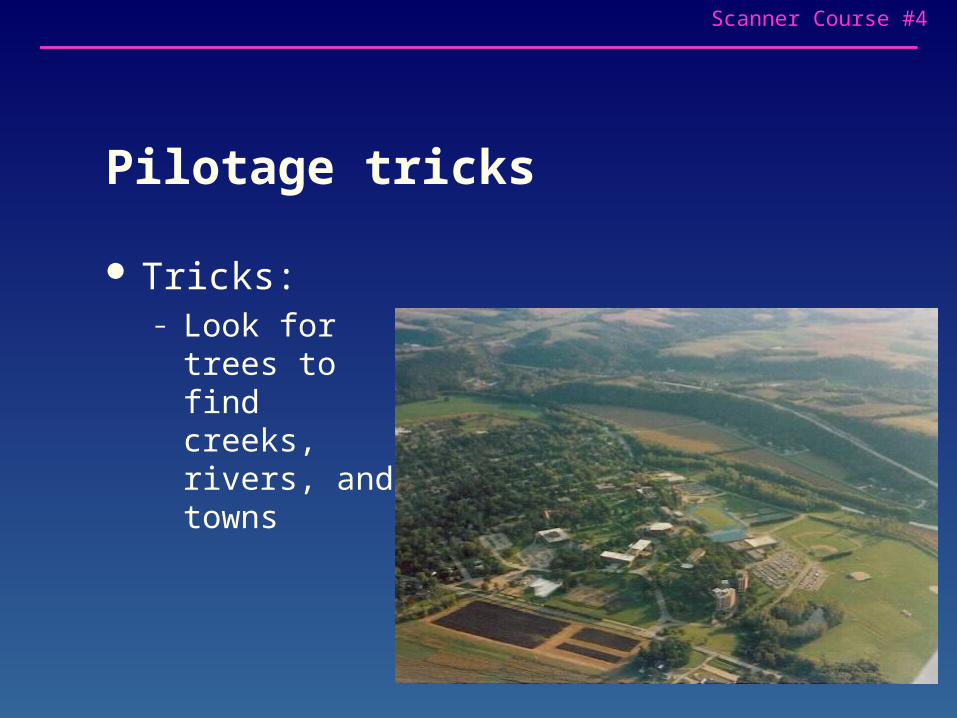
Pilotage tricks
Tricks:– Look for trees
to find creeks, rivers, and towns
Scanner Course #4
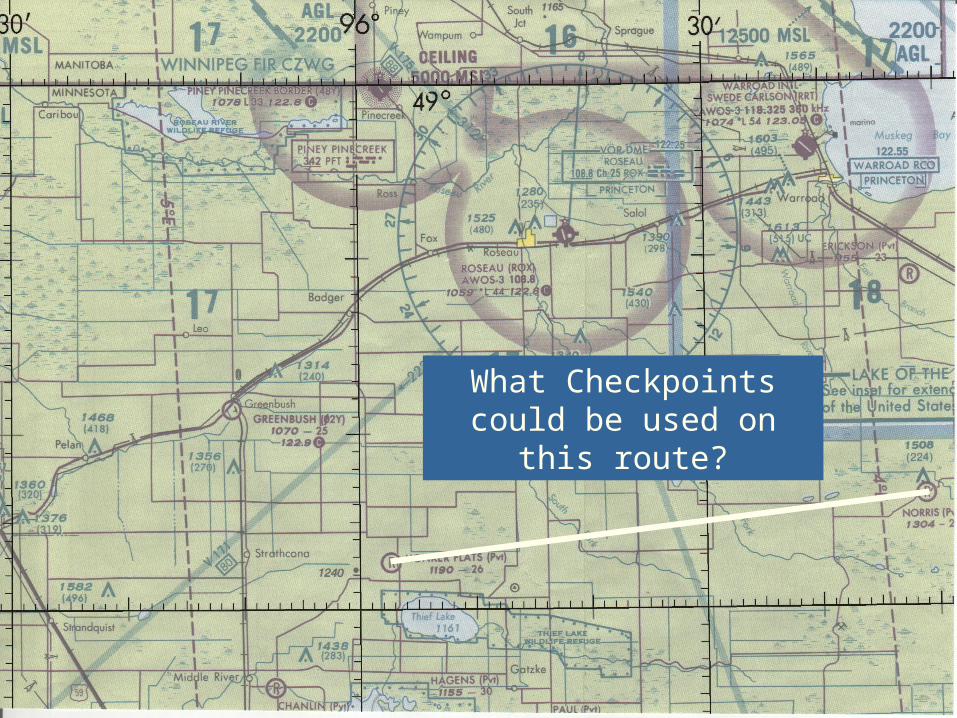
What Checkpoints could be used on this route?
Scanner Course #4
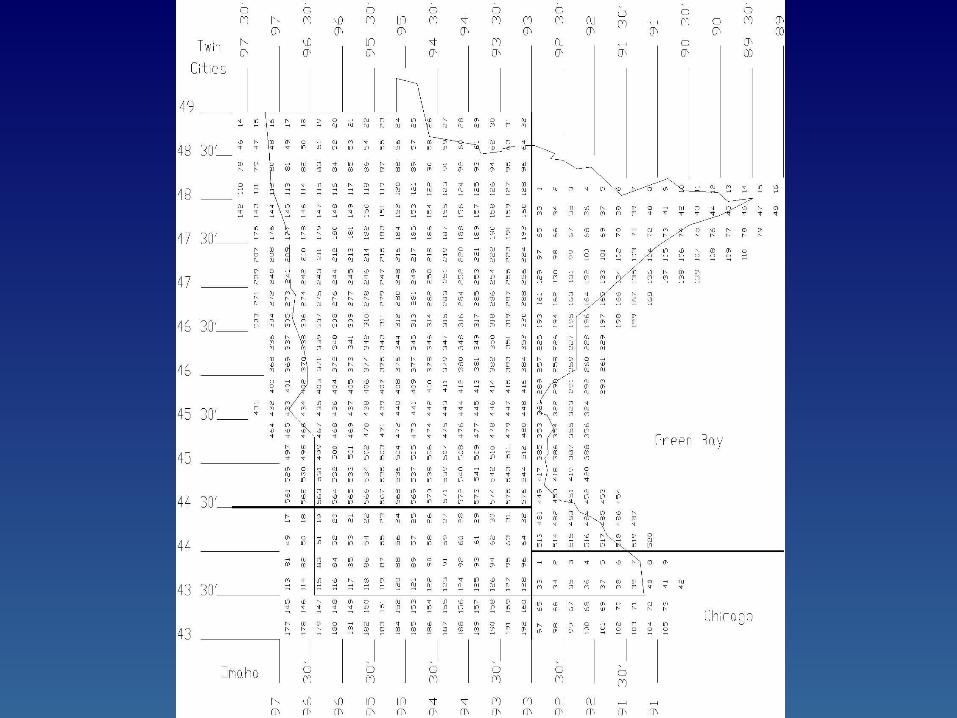
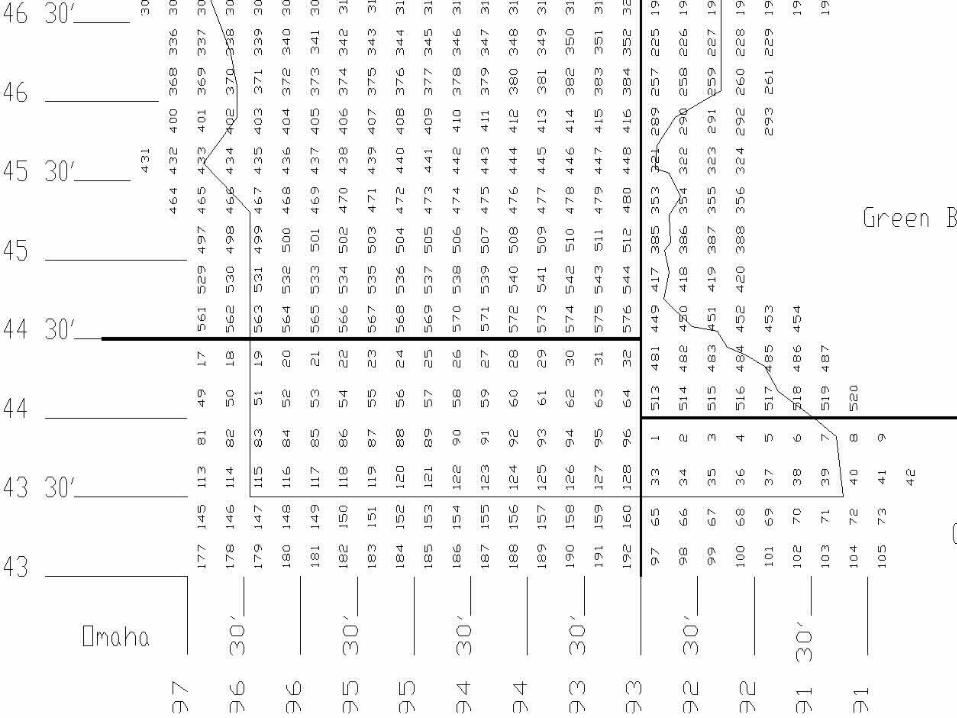
CAP Grid System
Scanner Course #4
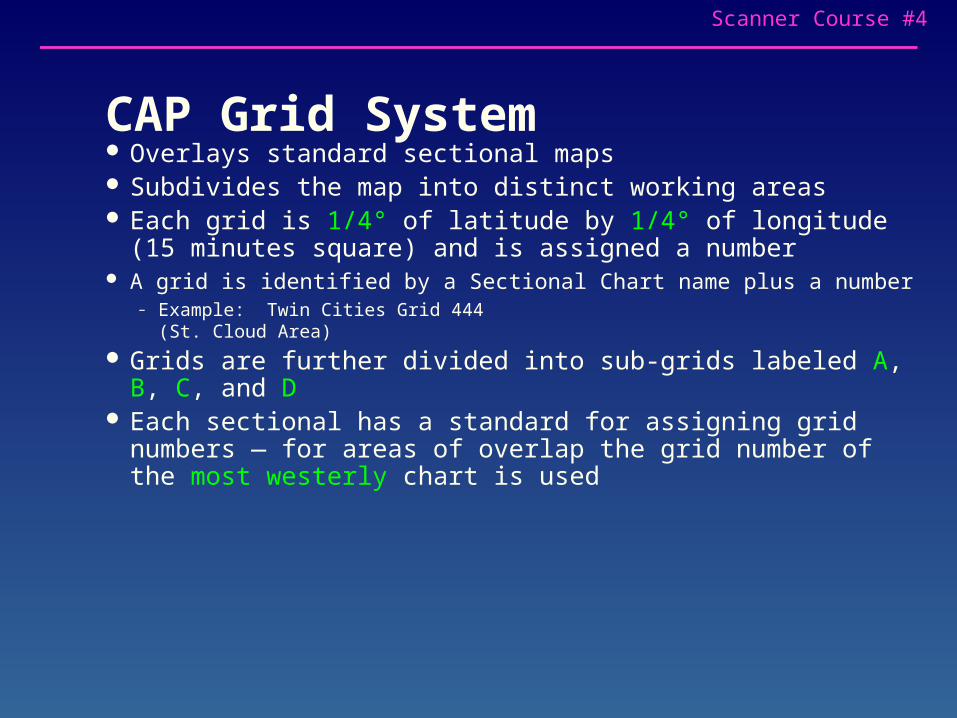
CAP Grid System Overlays standard sectional maps Subdivides the map into distinct working areas Each grid is 1/4° of latitude by 1/4° of longitude (15 minutes
square) and is assigned a number A grid is identified by a Sectional Chart name plus a number
– Example: Twin Cities Grid 444 (St. Cloud Area)
Grids are further divided into sub-grids labeled A, B, C, and D Each sectional has a standard for assigning grid numbers —
for areas of overlap the grid number of the most westerly chart is used
Scanner Course #4
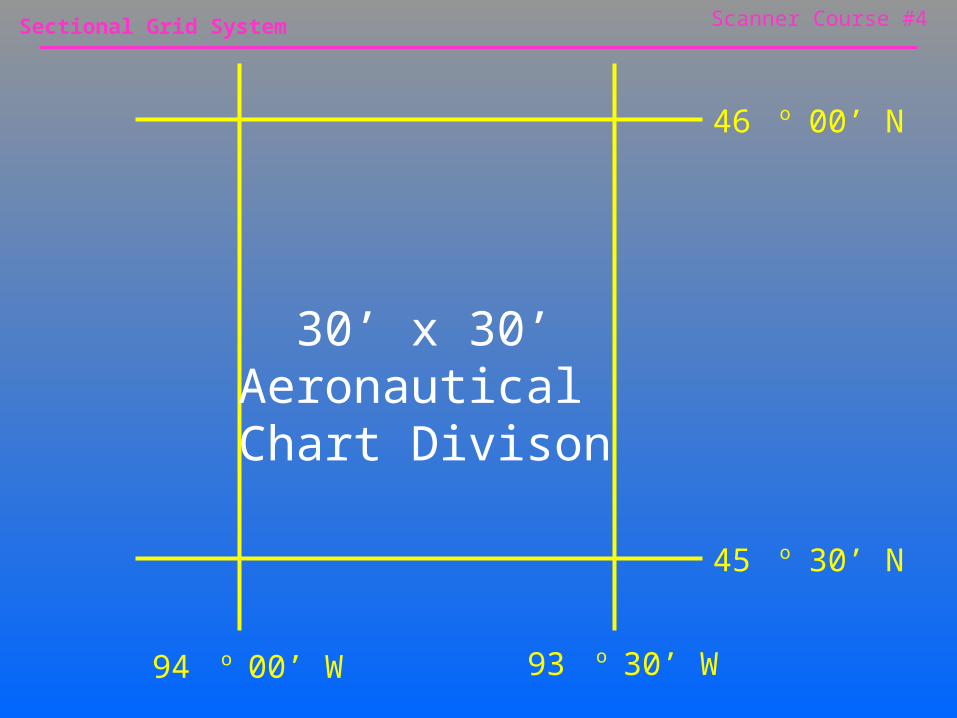
Sectional Grid System
94 00’ W o 93 30’ W o
45 30’ No
46 00’ No
30’ x 30’Aeronautical Chart Divison
Scanner Course #4
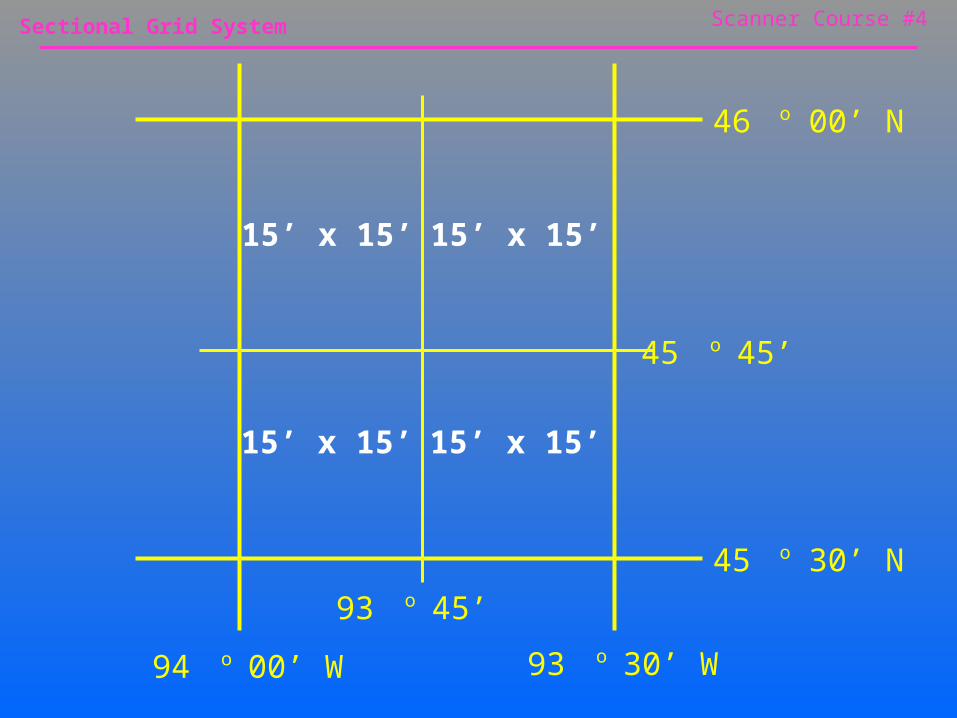
Sectional Grid System
93 45’ o
94 00’ W o 93 30’ W o
45 30’ No
46 00’ No
45 45’ o
15’ x 15’ 15’ x 15’
15’ x 15’ 15’ x 15’
Scanner Course #4
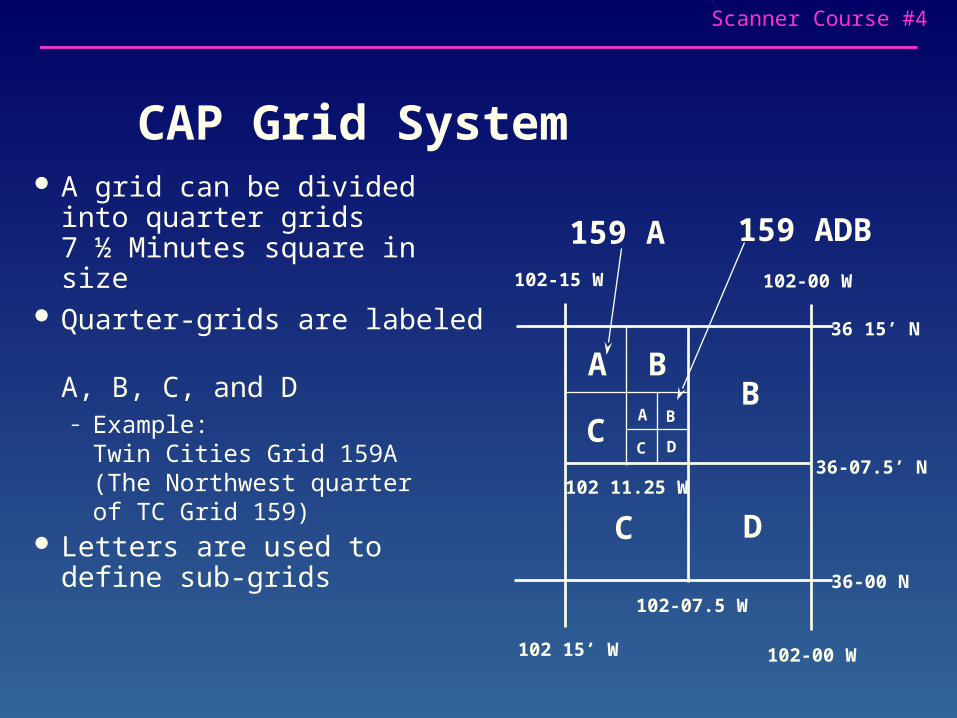
CAP Grid System A grid can be divided into
quarter grids 7 ½ Minutes square in size
Quarter-grids are labeled A, B, C, and D– Example:
Twin Cities Grid 159A(The Northwest quarter of TC Grid 159)
Letters are used to define sub-grids
102-15 W
102 15’ W
102-00 W
102-00 W
36-00 N
36 15’ N
A B
CB
C D
159 A
36-07.5’ N102 11.25 W
102-07.5 W
A B
C D
159 ADB
Scanner Course #4
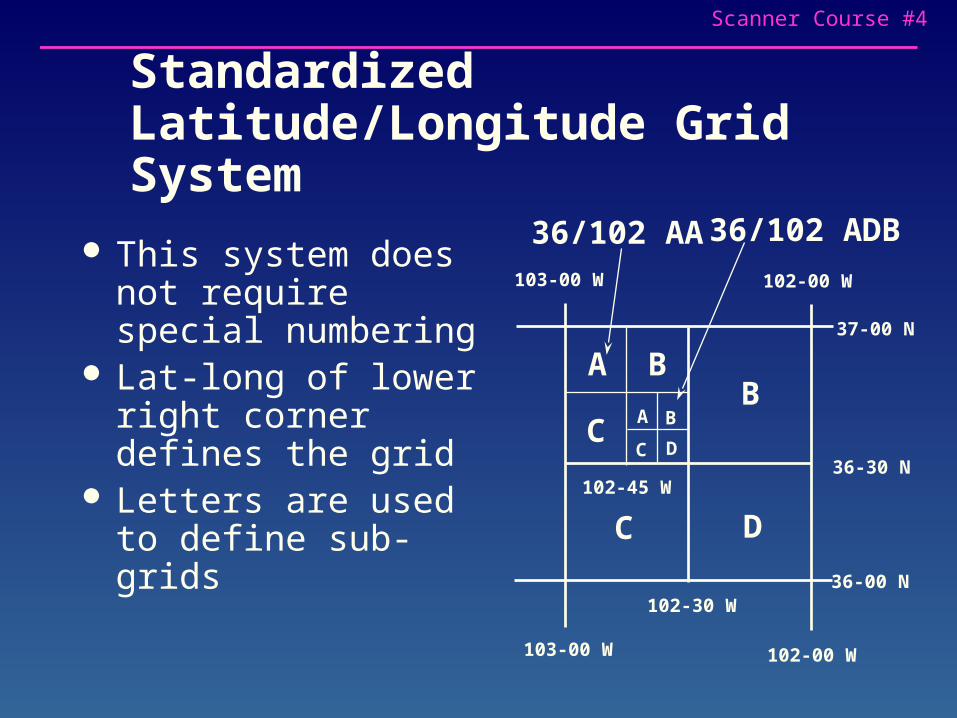
Standardized Latitude/Longitude Grid System
This system does not require special numbering
Lat-long of lower right corner defines the grid
Letters are used to define sub-grids
103-00 W
103-00 W
102-00 W
102-00 W
36-00 N
37-00 N
A B
CB
C D
36/102 AA
36-30 N102-45 W
102-30 W
A B
C D
36/102 ADB
Scanner Course #4
Making Grid Charts
You can use a new sectional — normally not updated unless it gets worn out
Use a hi-lighter (not pink) to mark grid boundaries on the chart using a long ruler
Mark grid identification in black ink for easy visibility
You should always keep a current sectional with you even if you have a sectional which is marked with grids