Embed Size (px)
Citation preview
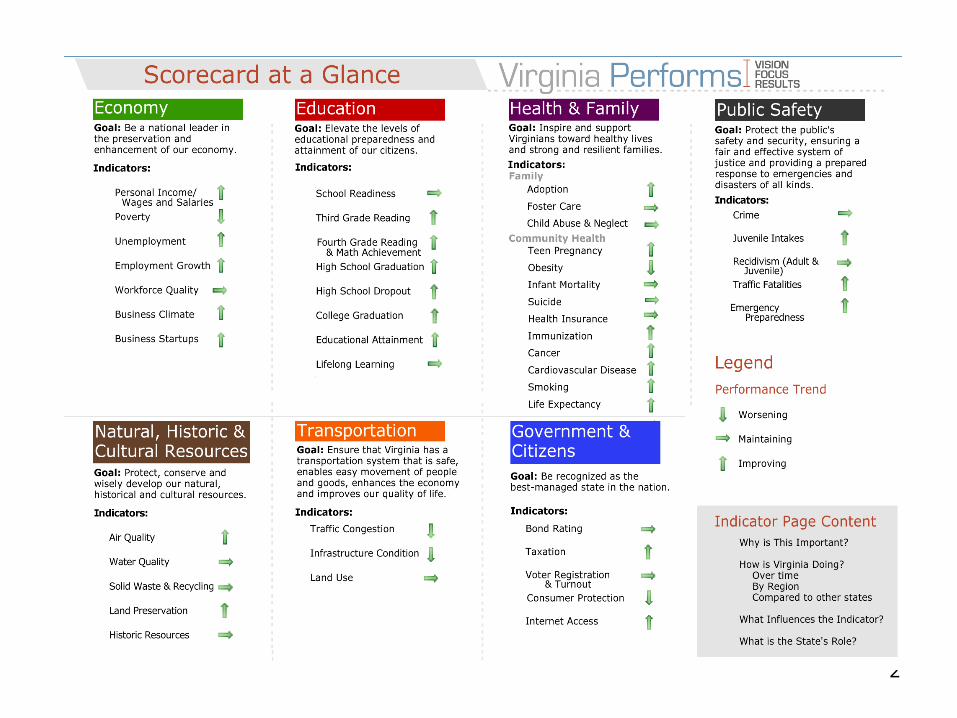
Minnesota Legislative Policy Conference
February 10, 2010
Bill Leighty
Performance Management Group
Virginia Commonwealth University
2
3
Overview of Operational Reviews
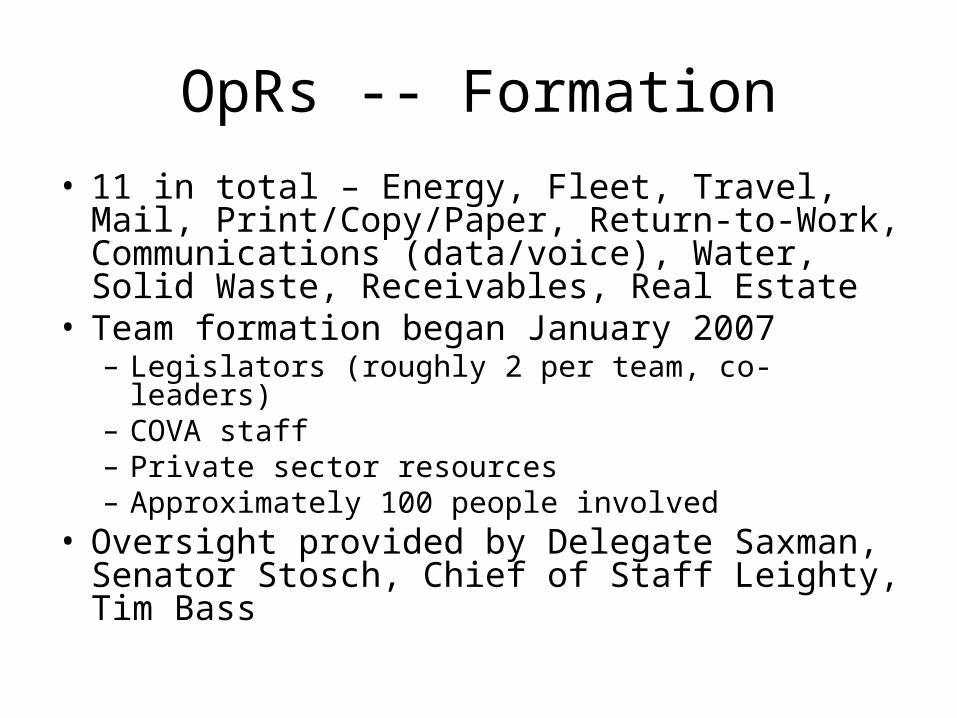
OpRs -- Formation
• 11 in total – Energy, Fleet, Travel, Mail, Print/Copy/Paper, Return-to-Work, Communications (data/voice), Water, Solid Waste, Receivables, Real Estate
• Team formation began January 2007– Legislators (roughly 2 per team, co-leaders)– COVA staff– Private sector resources– Approximately 100 people involved
• Oversight provided by Delegate Saxman, Senator Stosch, Chief of Staff Leighty, Tim Bass
OpRs – Why do this?
• Why were these topics picked?– Cross-cutting, fundamental to all agencies– Where single ideas, well-shared, can be
leveraged as a government enterprise for greater efficiency and effectiveness
– Reviewing/coordinating at the enterprise level will positively impact Bargaining Power
– Expenditure items that resonate with public
OpRs – Timeline & Reporting• Purpose: 3-5 month research teams that are focused on
delivering a final report that defines (at least) these four things in detail:– Overall costs and drivers,– The use (or lack) of best practices,– How we leverage our size as a customer in the market,– Overall recommendations for change to make the
Commonwealth more cost-effective in that area and improve performance
• Except for Real Estate, all reports expected by June 30, 2007• These reports will then be considered by the oversight group,
which will then make recommendations to the Governor• Decisions/selections made by the Governor then proceed
according to budget, project management and related policies and procedures – i.e. get in position for implementation
Sample: Energy OpR
• Legislative leadership: Delegate Harvey Morgan and Senator Emmett Hanger
• Coordinator: Steve Walz (Senior Advisor to Gov on Energy Policy)
• Team/Participants: Dept of Rehabilitative Services, Dept of General Services, Dept of Corrections, Dept of Accounts, University of Virginia, Virginia Military Institute, Virginia Tech, Office of Telework Promotion and Broadband Assistance, Dept of Planning and Budget, Dept of Human Resource Management, Dept of Rail and Pubic Transit, and Dept of Mines, Minerals and Energy, Wal-Mart, Food Lion, Meade Westvaco, the Federal Energy Star Program, and the Federal Energy Management Program
Sample: Energy OpR
• What’s our aggregate spend?• What’s our spend for specific energy
sources?• Are all agencies sharing information and
making use of “best practices” in terms of usage and overall energy mgt?
• Are we leveraging our enormous size as an energy consumer at the bargaining table?
Sample: Energy OpR
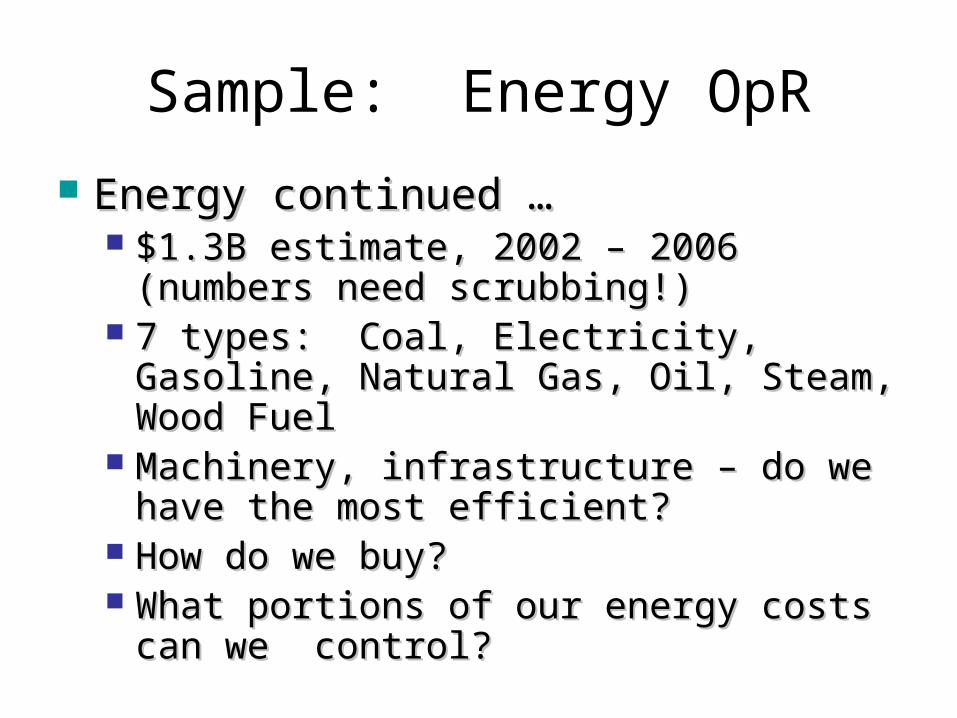
Energy continued …Energy continued … $1.3B estimate, 2002 – 2006 (numbers $1.3B estimate, 2002 – 2006 (numbers
need scrubbing!)need scrubbing!) 7 types: Coal, Electricity, Gasoline, 7 types: Coal, Electricity, Gasoline,
Natural Gas, Oil, Steam, Wood FuelNatural Gas, Oil, Steam, Wood Fuel Machinery, infrastructure – do we have Machinery, infrastructure – do we have
the most efficient?the most efficient? How do we buy?How do we buy? What portions of our energy costs can What portions of our energy costs can
we control?we control?
0.0
10.0
20.0
30.0
40.0
50.0
60.0
'02 '03 '04 '05 '06
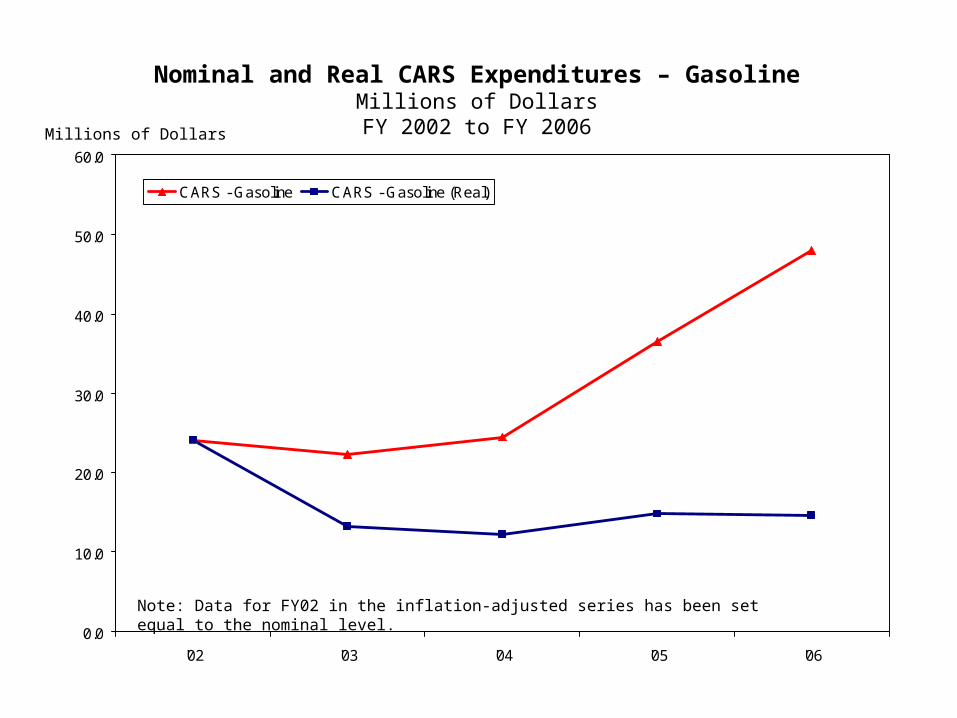
CARS - Gasoline CARS - Gasoline (Real)
Nominal and Real CARS Expenditures – GasolineMillions of Dollars
FY 2002 to FY 2006Millions of Dollars
Note: Data for FY02 in the inflation-adjusted series has been set equal to the nominal level.
0.0
20.0
40.0
60.0
80.0
100.0
120.0
140.0
160.0
'02 '03 '04 '05 '06
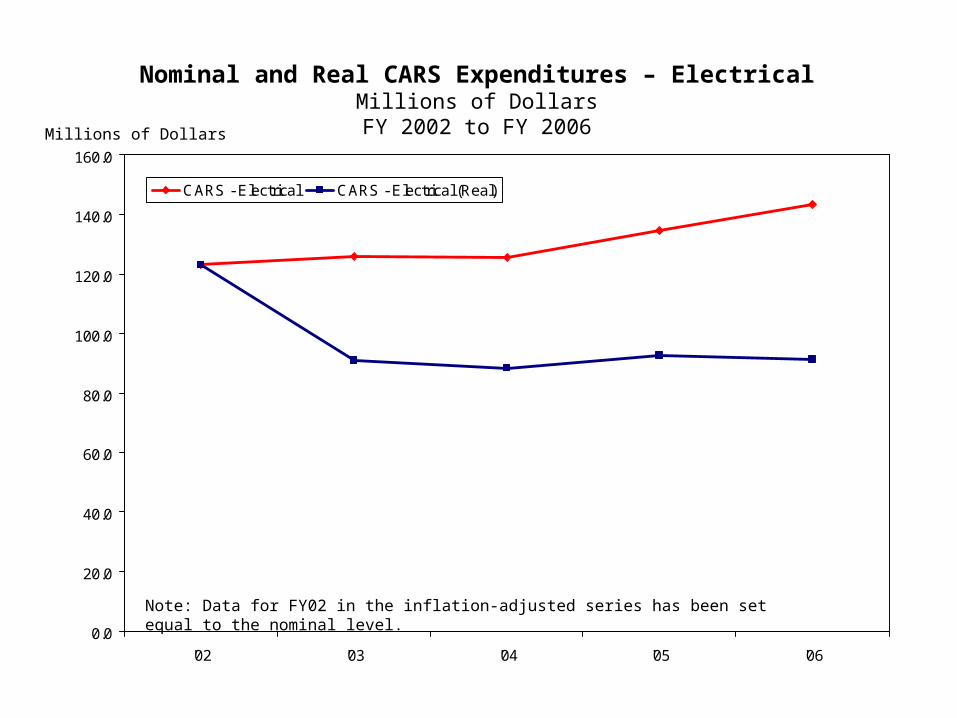
CARS - Electrical CARS - Electrical (Real)
Nominal and Real CARS Expenditures – ElectricalMillions of Dollars
FY 2002 to FY 2006Millions of Dollars
Note: Data for FY02 in the inflation-adjusted series has been set equal to the nominal level.
0.0
10.0
20.0
30.0
40.0
50.0
60.0
70.0
'02 '03 '04 '05 '06
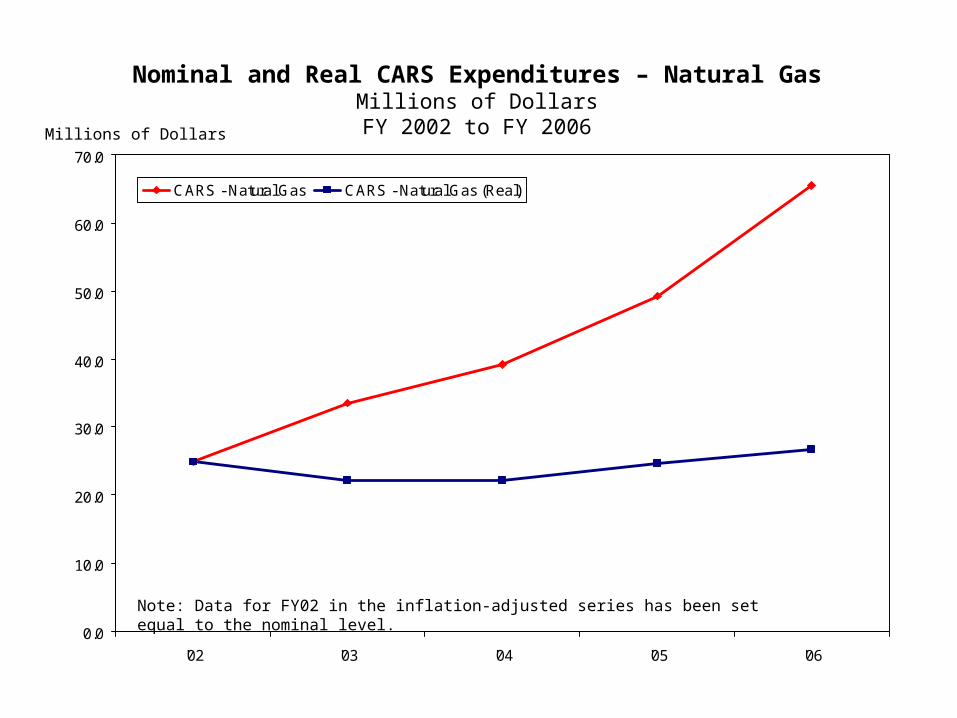
CARS - Natural Gas CARS - Natural Gas (Real)
Nominal and Real CARS Expenditures – Natural GasMillions of Dollars
FY 2002 to FY 2006Millions of Dollars
Note: Data for FY02 in the inflation-adjusted series has been set equal to the nominal level.
Sample: Energy OpR
• The good news on Energy – we’re using many best practices in parts of state operations:
• Coordinated purchasing of energy and fuels through private energy marketers and centralized state purchase agreements
• Widespread use of energy savings performance contracting
• Widespread training of facility managers for energy management
• Widespread use of agency transit incentive programs
Sample: Energy OpR• The opportunities with Energy:
• Improve coordination of energy management functions across agencies and institutions
• Expand use of coordinated purchasing of utilities and fuels, particularly natural gas
• Improve training to include certification• Expand participation in PJM Interconnection
program demand control programs• Broaden use of building commissioning and re-
commissioning• Constructing new buildings and major renovations
to LEED or Energy Star standards• Purchase of Energy Star equipment wherever
available.
OpRs -- Summary
• Here’s the point for each Operational Review– Need to reconcile costs, target discretionary
areas– Need to review methods for usage, buying,
maintenance– Celebrate existing best practices– Plan to renovate where appropriate – Need GA help, leadership and support
Contact: Bill Leighty
Performance Management Group
Virginia Commonwealth University
(804) 393-9401
Questions?