Embed Size (px)
Citation preview
Mining Patterns of Change in Remote Sensing Image Databases
Marcelino Pereira S. Silva1,2, Gilberto Câmara2, Ricardo Cartaxo M. Souza2, Dalton M. Valeriano2, Maria Isabel S. Escada2
1UERN – Rio Grande do Norte State University, BR 110, Km 48, 59610-090, Mossoró, RN, Brazil
2INPE – National Institute for Space Research, P.O. Box 515, 12201-097, São José dos Campos, SP, Brazil
{mpss, gilberto, cartaxo, isabel}@dpi.inpe.br, [email protected]
Abstract
Remote sensing image databases are the fastest
growing archives of spatial information. However, we still have a limited capacity for extracting information from large remote sensing image databases. There are currently very few techniques for image data mining and information extraction in large image data sets, and thus we are failing to exploit our large remote sensing data archives. This paper proposes a methodology to provide guidance for mining remote sensing image databases. The basic idea is to use domain concepts to build generic description of patterns in remote sensing images, and then use structural approaches to identify such patterns in images. We illustrate our proposal with a case study for detecting land use patterns in Amazonia from INPE’s remote sensing image database. 1. Introduction
Remote sensing satellites are currently the most significant source of new data about our planet, and remote sensing image databases are the fastest growing archives of spatial information. The variety of spatial and spectral resolutions for remote sensing images ranges from IKONOS 1-meter panchromatic images to the next generation of polarimetric radar imagery satellites. Given the widespread availability of remotely sensed data, many government and private institutions have built large remote sensing image archives. The US National Satellite Land Remote Sensing Data Archive, managed by USGS EROS Data Center, holds 1,400 TB of satellite data collected over a 40 year period, and satellites such as NASA’s Terra and Aqua generate an additional 3 Terabytes of imagery daily. Brazil’s National Institute for Space
Research (INPE) has more than 130 Terabytes of image datasets, covering 30 years of remote sensing activities, which are available on a database with free on-line access for Brazilian researchers. Strategic information from these remote sensing images is strongly demanded in many areas, including government (e.g., security and social purposes), economy (crop forecasting), and hydrology (water resources monitoring).
The first operational remote sensing satellite (LANDSAT-1) was launched in 1972, since then there has been a large worldwide experience in data gathering, processing and analysis of remotely sensed data. However, we still have a limited capacity for extracting information from large remote sensing image databases. Currently, most image processing techniques are designed to operate on a single image, and there are few algorithms and techniques for handling multi-temporal images [1]. This situation has lead to a “knowledge gap” in the process of deriving information from images and digital maps. This “knowledge gap” has arisen because there are currently very few techniques for image data mining and information extraction in large image data sets, and thus we are failing to exploit our large remote sensing data archives.
Although there has been a large research effort in content-based image retrieval (CBIR) techniques [2-6], the specific problem of mining remote sensing image databases has received much less attention. Proposals such as VISIMINE [7], ADAM [8] and KIM [9] are focused on clustering methods that operate on the feature space, the multi-dimensional space which is created by the different spectral bands of a remote sensing image. These techniques are useful for distinguishing spectral signatures of different land use types, such as finding areas which are classified as “lakes”, “cities” or “forests”.

However, in remote sensing image mining, one of the most important challenges is tracking patterns of land use change. A large remote sensing image database is a collection of snapshots of landscapes, which provide us with a unique opportunity for understanding how, when, and where changes take place in our world. For example, INPE’s image database covers a 30-year history of land use change in the Amazon tropical forest. Extensive fieldwork also indicates that the different actors involved in land use change (small-scale farmers, large plantations, cattle ranchers) can be distinguished by their different spatial patterns of land use [10]. Furthermore, these patterns evolve in time; new small farms will be created and large farms increase their agricultural area at the expense of the forest. In these and similar situations, patterns of land use change will have similar spectral signatures and image mining techniques based on clustering in the feature space will not be able to distinguish between them.
Therefore, tracking the temporal evolution of patterns in remote sensing imagery requires methods that are different from standard content-based image retrieval (CBIR) systems. A typical CBIR system uses a query image as the source and images in the database as targets, and query results are a set of images sorted by feature similarities with respect to the source [11]. When searching for patterns in remote sensing image databases, a different approach is necessary. Instead of similarity searches between image pairs, a system for mining remote sensing image databases must be able to do similarity searches between patterns found in different images. Therefore, mining remote sensing image databases is searching for patterns of change, not searching for internal content.
Our approach differs from previous work in the literature for content-based image retrieval. Schober et al [12] present a system that provides an automated keyword annotation for images, which assigns descriptive contents to objects in the image. Wang et al [5] describe an architecture that identifies object boundaries in a query image using segmentation, associates these objects to ontological concepts using neural networks, and uses these concepts to obtain a description for the image. These approaches aim at obtaining an adequate description of a single image, and are not adequate for solving the challenge of mining patterns in large remote sensing image databases, where the aim is to find similar patterns over significant temporal periods. We believe that by focusing on specific domain concepts for remote sensing data, it is possible to obtain significant results in mining land use patterns in large image databases.
Given this perspective, this paper proposes a methodology for mining patterns of change in remote
sensing image databases. The basic idea is to use domain concepts to build generic descriptions of patterns in remote sensing images, and then use structural approaches to identify these patterns in the image database. Our approach is motivated by earlier works by our research group on using ontologies for integrated GIS [13], and on ontological characterization of remote sensing imagery [14].
In what follows, we discuss patterns of change in remote sensing images and propose a methodology for mining land use patterns in remote sensing image databases. We illustrate our proposal with a case study for detecting land use patterns in Amazonia from INPE’s remote sensing image database. 2. Patterns of change in remote sensing image databases
Given a large remote sensing image database, researchers would like to explore the database with questions such as: What are the different land use patterns present in the database? When did a certain land use pattern emerge? What are the dominant land use patterns for each region? How do patterns emerge and change over time? The answer to these and similar questions requires the availability of data mining techniques which are able to perform similarity searches between patterns found in different images. We propose to approach this problem by using spatial patterns as a means of describing relevant semantic features of an image.
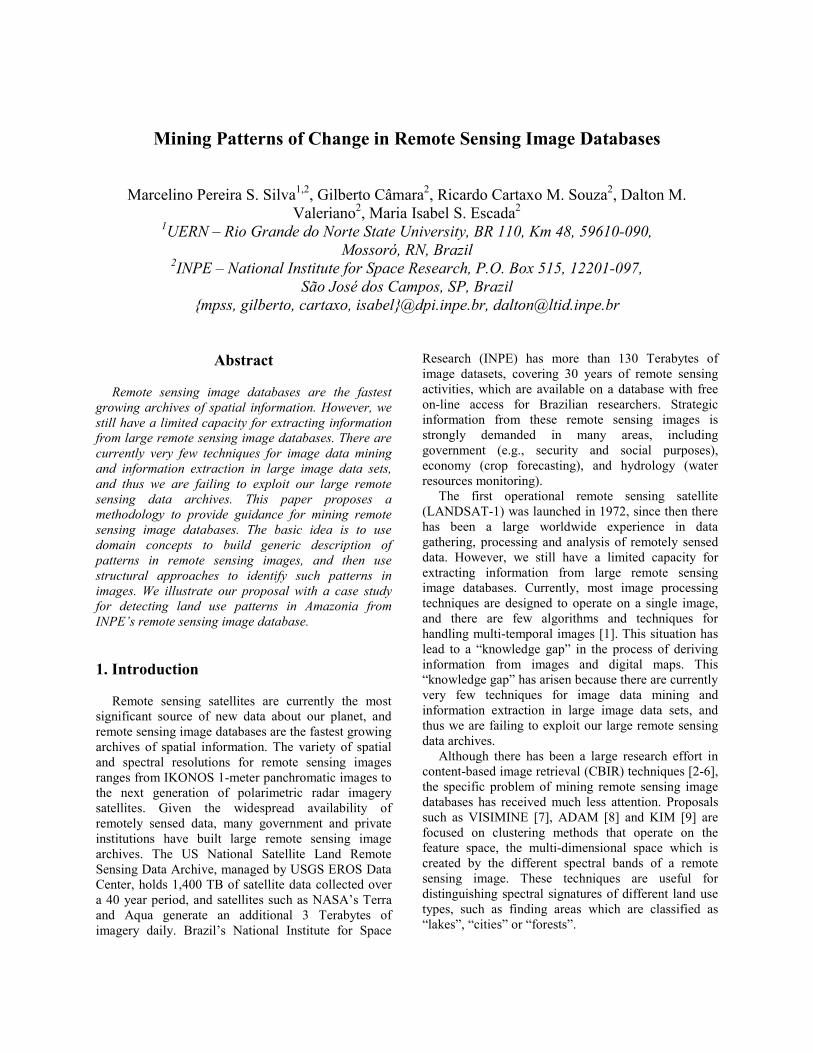
Our primary consideration is that the instruments onboard remote sensing satellites capture energy at different parts of the electromagnetic spectrum, which is then converted into digital imagery. These instruments are not designed for a specific application, but are a compromise between sensor technology and requirements from different user communities. As a result, remote sensing images have a structural description which is independent of the application domain that a scientist employs to extract information. We distinguish between the image domain and the application domain, as shown in Figure 1: • Spatial Patterns – the geometric structures that
can be extracted from the images using techniques for feature extraction, segmentation, and image classification. They must be identified and labeled according to a typology which expresses their semantics. Examples of such patterns include corridor-like regions and regular-shaped polygons representing patterns of the mined data.
• Application Concepts – the different classes of spatial objects, which are associated to a specific domain. For example, in deforestation
assessments, concepts include large-scale agriculture, small-scale agriculture, cattle ranching and wood logging.
Figure 1. Overview of pattern mining process To associate structures found in the image to
concepts in the application, we need a structural classifier, which is able to relate the same structures to different application domains. This strategy differs from most remote sensing image database mining systems, such as KIM [9] and VISIMINE [7], which implicitly assume that there is one “best fit” for associating semantic concepts in the user domains to image-derived structures. Our view is that different structural classifiers will produce different associations between spatial patterns and the user domain concepts, and that each association is valid within a given application context. In other words, there are many ways to bridge the “sensory gap” and we should not search for a “best fit”. For each type of application, there will be an appropriate structural classifier.
In what follows, we describe our proposed methodology for image mining, and apply it to the problem of mining patterns in INPE’s remote sensing image database. In this paper, the application domain is concerned with describing land use change in tropical forests using remote sensing satellites. 3. A methodology for mining land use patterns on remote sensing images
We propose a methodology for image mining in
large remote sensing databases using the idea application-dependent structural classifier, as outlined above. The methodology consists of three steps: Definition of a spatial pattern typology according
to the user’s application domain (Figure 2). Building a reference set of spatial patterns. This
reference set is built using a prototypical set of images. Landscape objects are identified and labelled: the identification employs image segmentation and the labeling is performed according to the spatial pattern typology (Figure 3).
Mining the database using a structural classifier (guided by the application concepts of the domain), matching the reference set of spatial patterns to the landscape objects identified in
images, thus revealing the spatial configurations present in each image (Figure 5).
3.1. Defining a spatial pattern typology
The first phase of the methodology calls for the definition of a spatial pattern typology which is associated to a given application domain. In order to illustrate our proposal, we will use a typology defined for mapping different types of land use change in tropical forests.
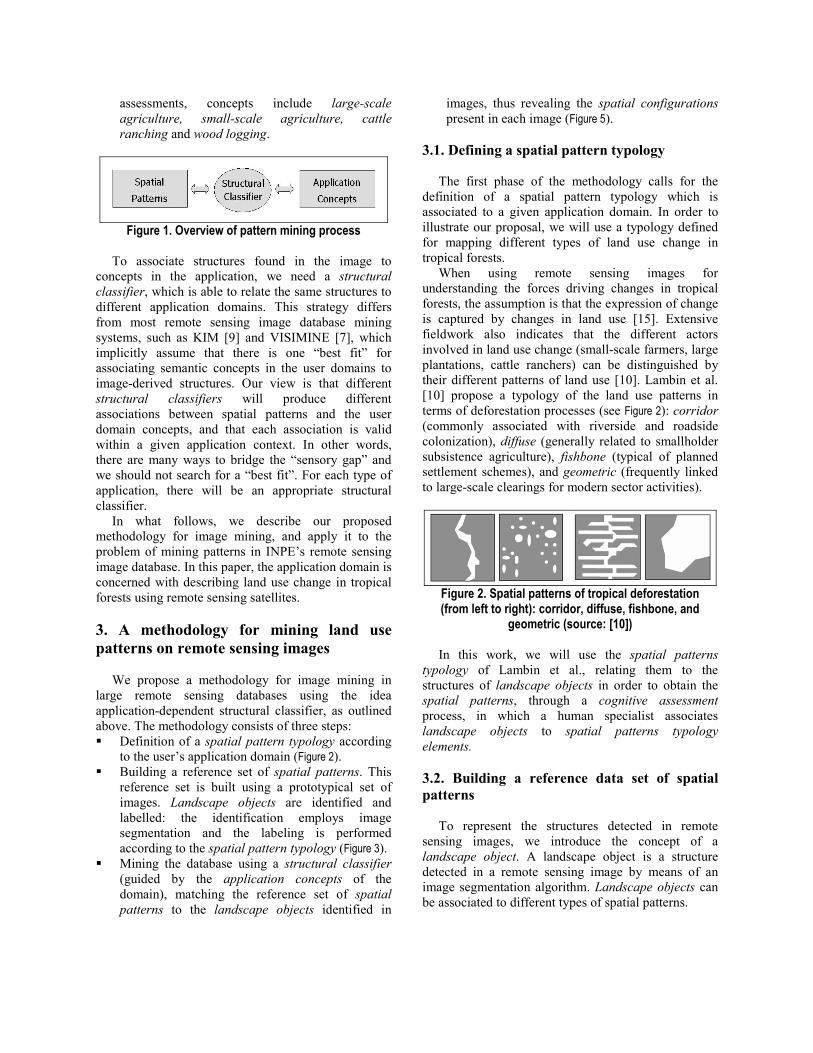
When using remote sensing images for understanding the forces driving changes in tropical forests, the assumption is that the expression of change is captured by changes in land use [15]. Extensive fieldwork also indicates that the different actors involved in land use change (small-scale farmers, large plantations, cattle ranchers) can be distinguished by their different patterns of land use [10]. Lambin et al. [10] propose a typology of the land use patterns in terms of deforestation processes (see Figure 2): corridor (commonly associated with riverside and roadside colonization), diffuse (generally related to smallholder subsistence agriculture), fishbone (typical of planned settlement schemes), and geometric (frequently linked to large-scale clearings for modern sector activities).
Figure 2. Spatial patterns of tropical deforestation (from left to right): corridor, diffuse, fishbone, and
geometric (source: [10]) In this work, we will use the spatial patterns
typology of Lambin et al., relating them to the structures of landscape objects in order to obtain the spatial patterns, through a cognitive assessment process, in which a human specialist associates landscape objects to spatial patterns typology elements.
3.2. Building a reference data set of spatial patterns
To represent the structures detected in remote
sensing images, we introduce the concept of a landscape object. A landscape object is a structure detected in a remote sensing image by means of an image segmentation algorithm. Landscape objects can be associated to different types of spatial patterns.

To build a reference set of spatial patterns (Figure 3), we obtain a set of prototypical landscape objects, which are extracted from a set of sample images. We use segmentation algorithms to partition the image into regions which are spatially continuous, disjoint and homogenous [16]. Recent surveys [17] indicate that region-growing approaches [18] are well-suited for producing closed and homogenous regions. In our proposal, we have adopted the region-growing segmentation algorithm developed by INPE’s [19], and grated in the SPRING software system [20], which is freely available on the Internet. This algorithm has been extensively validated for extracting land use patterns in tropical forests [21] and has been very favourably reviewed in a recent survey [17].
Figure 3. Building a reference set of spatial patterns
SPRING’s region growing algorithm works as follows (Figure 4) [22]: (a) the image is first segmented into atomic cells of one or few pixels; (b) each segment is compared with its neighbors to determine if they are similar or not. If similar, they are merged and the mean gray level of the new segment is updated; (c) the segment continues growing by comparing it with all the neighbors until there is no remaining joinable region, at which point the segment is labeled as a completed region; and (d) the process moves to the next uncompleted cell, repeating the entire sequence until all cells are labeled. The algorithm requires two parameters: (a) a similarity threshold value, and (b) an area threshold value.
Figure 4. Example of a segmentation process
3.3. Mining the database using a structural classifier
Once the reference set of spatial patterns is built,
the next phase will use them to mine spatial configurations from image databases. The structural classifier enables the association between landscape objects extracted from images and the reference set of spatial patterns (Figure 5).
Figure 5. Obtaining spatial configurations The structural classifier must be able to distinguish
between different spatial patterns. It uses the C4.5 decision tree classifier [23], a classification method based on a decision tree. It predicts the value of a categorical attribute [24] based on non-categorical attributes. The categorical attribute is the pattern type and the non-categorical attributes are a set of numerical attributes that characterize each pattern.
To select the attributes that distinguish the different types of land use patterns, we have used the concepts from Landscape Ecology [25]. Landscape ecology is based on the notion that environmental patterns strongly influence ecological processes. One of the key components of landscape ecology theory is the definition of metrics that characterize geometric and spatial properties of categorical map patterns [26]. The pattern metrics used in landscape ecology include metrics of spatial configuration that operate at the patch level. Patches form the building blocks for categorical maps and within-patch heterogeneity is ignored. Patch metrics refer to the spatial character and arrangement, position, or orientation of patches within the landscape. We have used the pattern metrics proposed by the FRAGSTATS (Spatial Pattern Analysis Program for Categorical Maps) software [27], that include: • Perimeter (m) and area (ha).
• Para (perimeter-area ratio): a measure of shape complexity.
• Shape (shape index): patch perimeter divided by the minimum perimeter possible for a maximally compact patch of the corresponding patch area.
• Frac (fractal dimension index): two times the logarithm of patch perimeter (m) divided by the logarithm of patch area (m2).
• Circle (related circumscribing circle): 1 minus patch area (m2) divided by the area (m2) of the smallest circumscribing circle.
• Contig (contiguity index): equals the average contiguity value for the cells in a patch.
The landscape ecology metrics are fed into the C4.5 classification algorithm to distinguish the different types of spatial patterns. After this classifier is properly trained, it can be used to label the landscape objects found in other images. Therefore, for each image in the database, this procedure identifies the number and location of the different types of spatial patterns. We refer to a specific set of spatial patterns found in an image as a spatial configuration.
By identifying the spatial configurations of different images, the user will be able to evaluate the emergence and evolution of different types of change. Each spatial pattern is associated to a different type of land use change. Therefore, the comparison between spatial configurations of images in different locations and between spatial configurations of images at the same location in different times will allow new insights into the processes and actors that bring about change.
4. Case study: image mining for deforestation patterns
Brazil is facing a difficult challenge: controlling deforestation on Amazon rain forest, which covers about 40% of its territory. The causes of deforestation include economic, social and political factors and the current pace of land use change is substantial, with an average of 25,000 km2 of forest being cleared every year. That situation demands fast and effective actions for reducing this pace of devastation. In order to monitor the extremely fast process of land use change in Amazonia, it is very important that INPE be able to use its huge data archive to the maximum extent possible. Given this motivation, we have used the methodology proposed above to achieve a better understanding of the processes of land use change in Amazonia.
We developed a case study using Landsat TM images (225/64, 226/64, 226/65, 225/65) of 1997, 2000, 2001, 2002 and 2003, which cover the region of São Félix do Xingu in the state of Pará. The images
and deforestation data were provided by PRODES Project [28]. The application concepts for this task are guided by the land use change domain in tropical forests (Table 1).
Table 1. Land use change in tropical forests
Landscape object Land use change Corridor pattern Roadside colonization
Riverside deforestation Diffuse pattern Smallholder agriculture
Small deforestation increments Geometric pattern Large farms
4.1. Building spatial patterns
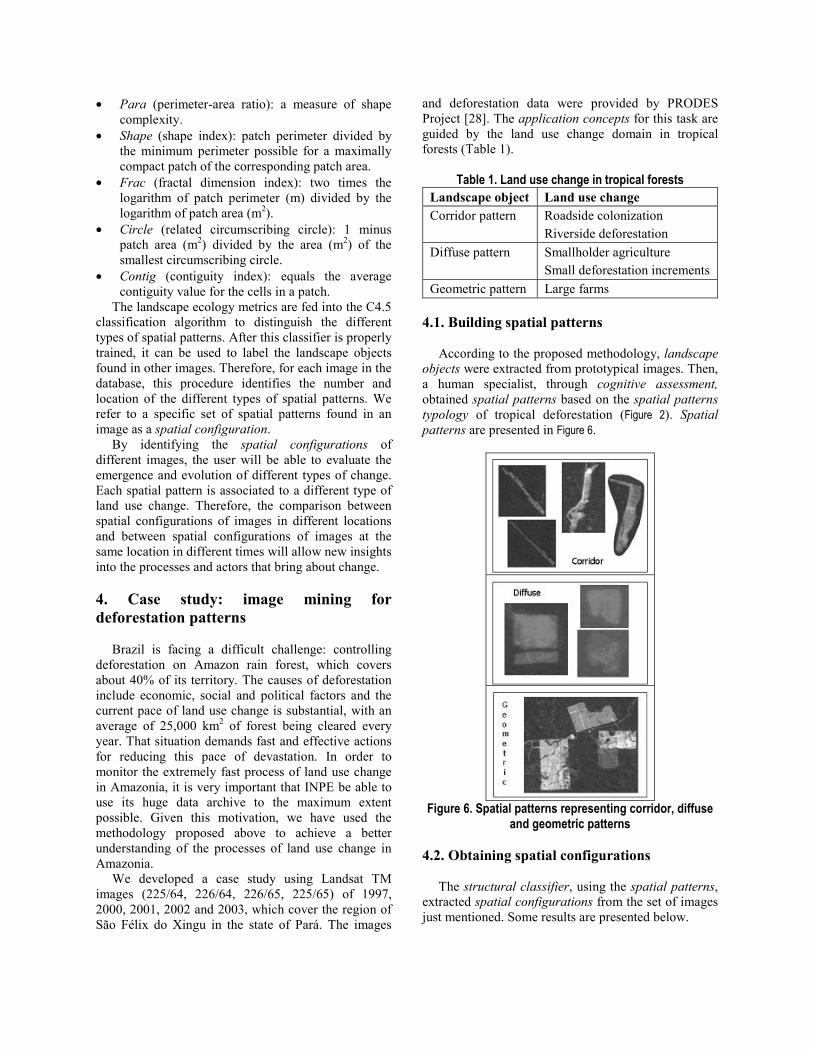
According to the proposed methodology, landscape
objects were extracted from prototypical images. Then, a human specialist, through cognitive assessment, obtained spatial patterns based on the spatial patterns typology of tropical deforestation (Figure 2). Spatial patterns are presented in Figure 6.
Figure 6. Spatial patterns representing corridor, diffuse
and geometric patterns
4.2. Obtaining spatial configurations The structural classifier, using the spatial patterns,
extracted spatial configurations from the set of images just mentioned. Some results are presented below.

In a first case, we wanted to answer the following question: “What’s the behavior of large farmers in São Félix do Xingu during this period (1997-2003)? Is the area of new large farms increasing?” Observing the evolution of the corresponding spatial configuration (geometric patterns) in Figure 7, it was possible to conclude that “in 2000, this kind of deforestation reached a peak of 55,000 ha, but decreased in the following years. In 2003, the deforestation area associated to large farms decreased to 29,000 ha. This indicates that large farms are reducing their contribution to deforestation”.
We posed a second question: “What’s the distribution of smallholder agriculture and small deforestation increments in São Félix do Xingu area during the years 1997-2003?”. Observing Figure 8, we concluded that “the distribution of this land use pattern in this period was mainly concentrated in the northeast and southeast of this area”.
Figure 7. Large farms dynamic in São Félix do Xingu
Figure 8. Diffuse pattern in São Félix do Xingu 1997-2003
The next question is: “In São Félix do Xingu region,
is there any dominant land use change pattern?” Observing Figure 9, we concluded that: “Diffuse pattern represented 61% of total occurrences of land use changes in 2001, indicating an increase in smallholder
agriculture / small increments in deforested areas in that year”.
Figure 9. Diffuse patterns in São Félix do Xingu
5. Conclusions
The methodology for mining patterns of change on remote sensing image databases proposed in this paper supports the extraction of spatial configurations and spatial patterns from these datasets. This methodology has been developed as an answer to the problem of searching for land use change patterns in remote sensing images. We consider that the proposed methodology can assist the environmental community to respond to the challenge of understanding and modeling land use change in a rapidly changing world. It also represents an alternative for making a more effective use of the large remote sensing image databases available in agencies such as USGS, ESA and INPE. Using satellite images and concepts of landscape ecology, the methodology provides a way to identify deforestation patterns in a complex domain, the Amazon forest. This approach bridges the gap between huge image databases and distinct domains (e.g. crop forecasting, deforestation).
Concepts and techniques of data mining, digital image processing and landscape ecology were used in the methodology to achieve good results during pattern detection. Images of distinct dates enabled the detection of pattern changes, which are extremely valuable when assessing, managing or preventing deforestation processes. Presented results revealed that the methodology is an important contribution to increase quality and speed of remote sensing image knowledge extraction.
Further experiments are necessary to calibrate distinct aspects of the methodology, such as image and structural patterns selection, segmentation and classification parameters, and mining algorithm aspects. Experimental evidences show that qualitative description of deforestation patterns are scale

dependent: aspects like area and perimeter are relevant to identify land use change pattern. More specific deforestation patterns must enhance the detection and analysis of such processes, including specific deforestation actor definitions, enabling specialists to perform more accurate and faster tasks using specialized application concepts of their domains. Acknowledgements
Contributions of Antônio Miguel V. Monteiro are gratefully acknowledged. Marcelino Silva would like to thank UERN and CAPES for supporting his work. Gilberto Câmara has been partially supported by CNPq and FAPESP. References [1] Datcu, M., et al., Information Mining in Remote Sensing Image Archives - Part A: System Concepts. IEEE Trans. on Geoscience and Remote Sensing, 2003. 41(2923--2936). [2] Smeulders, A.W.M., et al., Content-Based Image Retrieval at the End of the Early Years. IEEE Transactions on Pattern Analysis and Machine Intelligence, 2000. 22(12): p. 1349 - 1380. [3] Rui, Y., T.S. Huang, and S.-F. Chang, Image retrieval: current techniques, promising directions and open issues. Journal of Visual Communication and Image Representation, 1999. 10: p. 39--62. [4] Wang, J.Z., J. Li, and G. Wiederhold, SIMPLIcity: Semantics-sensitive Integrated Matching for Picture LIbraries. IEEE Trans. on Pattern Analysis and Machine Intelligence, 2001. 23(9): p. 947-963. [5] Wang, L., L. Khan, and C. Breen. Object Boundary Detection for Ontology-based Image Classification. in Third International Workshop on Multimedia Data Mining. 2002. Edmonton, Alberta, Canada: ACM. [6] Chen, Y. and J.Z. Wang, Image Categorization by Learning and Reasoning with Regions. Journal of Machine Learning Research, 2004. 5: p. 913-939. [7] Aksoy, S., et al. Interactive Training of Advanced Classifiers for Mining Remote Sensing Image Archives. in ACM International Conference on Knowledge Discovery and Data Mining. 2004. Seattle, WA: ACM. [8] Rushing, J., et al., ADaM: A Data Mining Toolkit for Scientists and Engineers. Computers and Geosciences, In Press, Available online 11 January 2005, 2005. [9] Schröder, M., et al., Interactive Learning and Probabilistic Retrieval in Remote Sensing Image Archives.
IEEE Trans. on Geoscience and Remote Sensing, 2000. 23(9): p. 2288--2298. [10] Lambin, E.F., H.J. Geist, and E. Lepers, Dynamics of land-use and land-cover change in Tropical Regions. Annual Review of Environment and Resources, 2003. 28: p. 205-241. [11] Chen, Y., J.Z. Wang, and R. Krovetz. CLUE: Cluster-based Retrieval of Images by Unsupervised Learning. in Seventh International Symposium on Signal Processing and its Applications. 2003. Paris: IEEE. [12] Schober, J.-P., T. Hermes, and O. Herzog. Content-based Image Retrieval by Ontology-based Object Recognition. in KI-2004 Workshop on Applications of Description Logics (ADL-2004). 2004. Ulm, Germany. [13] Fonseca, F., et al., Using Ontologies for Integrated Geographic Information Systems. Transactions in GIS, 2002. 6(3): p. 231-257. [14] Câmara, G., et al., What´s In An Image?, in Spatial Information Theory: Foundations of Geographic Information Science. International Conference, COSIT 2001., D. Montello, Editor. 2001, Springer: Santa Barbara, CA. p. 474-487. [15] Alves, D., et al., Land use intensification and abandonment in Rondônia, Brazilian Amazônia. International Journal of Remote Sensing, 2003. 24(4): p. 899-903. [16] Pekkarinen, A., A method for the segmentation of very high spatial resolution images of forested landscapes. International Journal of Remote Sensing, 2002. 23(14): p. 2817-2836. [17] Meinel, G. and M. Neubert, A comparison of segmentation programs for high resolution remote sensing data. International Archives of Photogrammetry and Remote Sensing, 2004. XXXV(Part B): p. 1097-1105. [18] Zucker, S.W., Region growing: childhood and adolescence. Computer Graphics and Image Processing, 1976. 15: p. 382-399. [19] Bins, L., L. Fonseca, and G. Erthal. Satellite Imagery Segmentation: a region growing approach. in VIII Brazilian Symposium on Remote Sensing. 1996. São José dos Campos, BR: INPE. [20] Câmara, G., et al., SPRING: Integrating Remote Sensing and GIS with Object-Oriented Data Modelling. Computers and Graphics, 1996. 15(6): p. 13-22. [21] Shimabukuro, Y., et al., Using shade fraction image segmentation to evaluate deforestation in Landsat Thematic Mapper images of the Amazon region. International Journal of Remote Sensing, 1998. 19(3): p. 535-541.
[22] Bins, L., et al. Satellite Imagery Segmentation: a Region Growing Approach. in VIII Brazilian Symposium on Remote Sensing. 1996. [23] Quinlan, R., C4.5: Programs for Machine Learning. 1993, San Francisco: Morgan Kaufmann. [24] Witten, I.H. and H. Frank, Data Mining: Practical Machine Learning Tools and Techniques with Java Implementations. 1999, San Francisco: Morgan Kaufmann. [24] Quinlan, R., C4.5: Programs for Machine Learning. 1993, San Francisco: Morgan Kaufmann. [25] Turner, M.G., Landscape Ecology: The effect of Pattern on Process. Annual Review of Ecology and Systematics, 1989. 20: p. 171-197. [26] McGarigal, K., Landscape pattern metrics, in Encyclopedia of Environmentrics, A.H. El-Shaarawi and W.W. Piegorsch, Editors. 2002, John Wiley & Sons: Sussex, England. p. 1135-1142. [27] McGarigal, K. and B. Marks, FRAGSTATS: spatial pattern analysis program for quantifying landscape structure. 1995, USDA Forestry Service Technical Report PNW-351: Washington, DC. [28] INPE, National Institute for Space Research: Prodes Project - Brazilian Amazon Forest Monitoring using Satellites. 2005. URL: http://www.obt.inpe.br/prodes/


![[REMOTE SENSING] 3-PM Remote Sensing](https://img.pdfslide.us/doc/110x75/61f2bbb282fa78206228d9e2/remote-sensing-3-pm-remote-sensing.jpg)