Embed Size (px)
Citation preview
Mining M&A NewsletterFirst half of 2016
kpmg.ca
ContentsUpturn inspires hope 3
Market trends 5
Market activity – H1 2016 top 10 deals 7
Copper steals the stage 8
String of gold deals 9
Fireside chat with Nolan Watson, CEO, Sandstorm Gold 10
© 2016 KPMG LLP, a Canadian limited liability partnership and a member firm of the KPMG network of independent member firms affiliated with KPMG International Cooperative (“KPMG International”), a Swiss entity. All rights reserved.
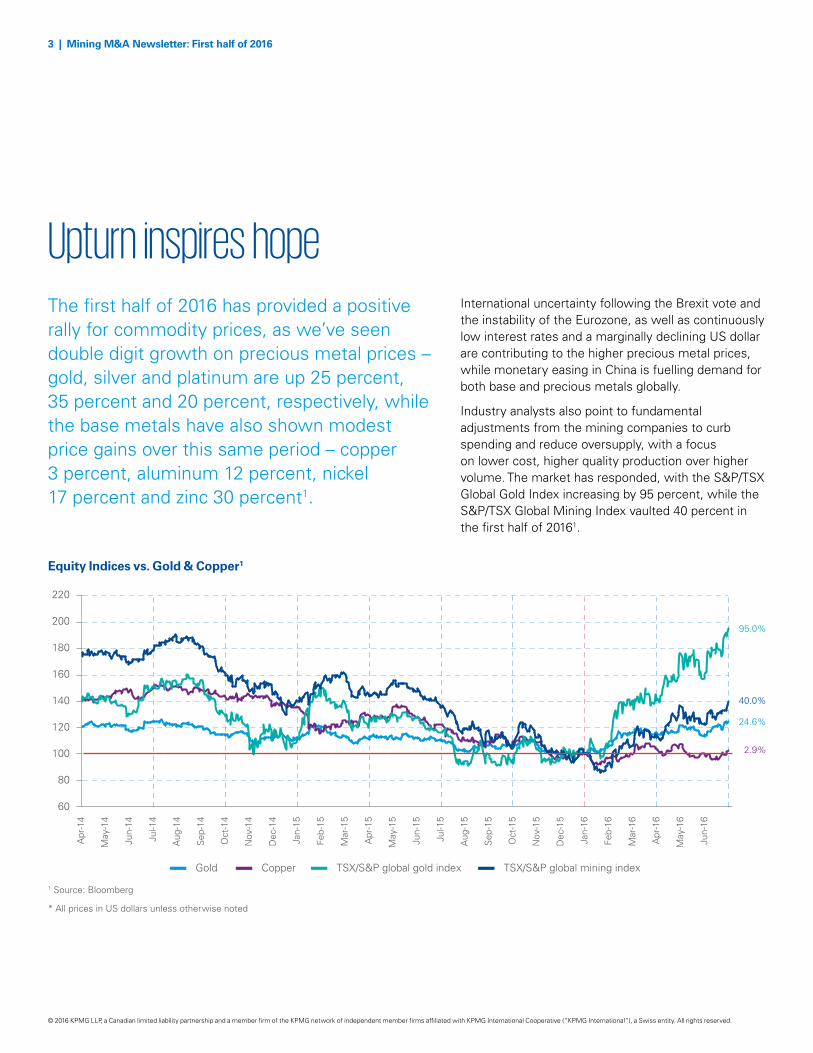
International uncertainty following the Brexit vote and the instability of the Eurozone, as well as continuously low interest rates and a marginally declining US dollar are contributing to the higher precious metal prices, while monetary easing in China is fuelling demand for both base and precious metals globally.
Industry analysts also point to fundamental adjustments from the mining companies to curb spending and reduce oversupply, with a focus on lower cost, higher quality production over higher volume. The market has responded, with the S&P/TSX Global Gold Index increasing by 95 percent, while the S&P/TSX Global Mining Index vaulted 40 percent in the first half of 20161.
Equity Indices vs. Gold & Copper1
Upturn inspires hopeThe first half of 2016 has provided a positive rally for commodity prices, as we’ve seen double digit growth on precious metal prices – gold, silver and platinum are up 25 percent, 35 percent and 20 percent, respectively, while the base metals have also shown modest price gains over this same period – copper 3 percent, aluminum 12 percent, nickel 17 percent and zinc 30 percent1.
60
80
100
120
140
160
180
220
200
Gold Copper TSX/S&P global gold index TSX/S&P global mining index
2.9%
95.0%
40.0%
24.6%
Apr
-14
May
-14
Jun-
14
May
-15
Jun-
15
Jul-1
4
Aug
-14
Sep
-14
Jul-1
5
Aug
-15
Sep
-15
Oct
-15
Nov
-15
Dec
-15
Oct
-14
Nov
-14
Dec
-14
Jan-
15
Feb-
15
Mar
-15
Jan-
16
Feb-
16
Mar
-16
Apr
-15
May
-16
Jun-
16
Apr
-16
1 Source: Bloomberg
* All prices in US dollars unless otherwise noted
© 2016 KPMG LLP, a Canadian limited liability partnership and a member firm of the KPMG network of independent member firms affiliated with KPMG International Cooperative (“KPMG International”), a Swiss entity. All rights reserved.
3 | Mining M&A Newsletter: First half of 2016
Value Volume
Dea
l vo
lum
e (#
of
tran
sact
ion
s)
Dea
l val
ue
(US
$ b
illio
ns)
15
0
30
45
60
75
90
35
0
5
10
15
20
25
30
H1-13 H2-13 H1-14 H2-14 H1-15 H2-15 H1-16
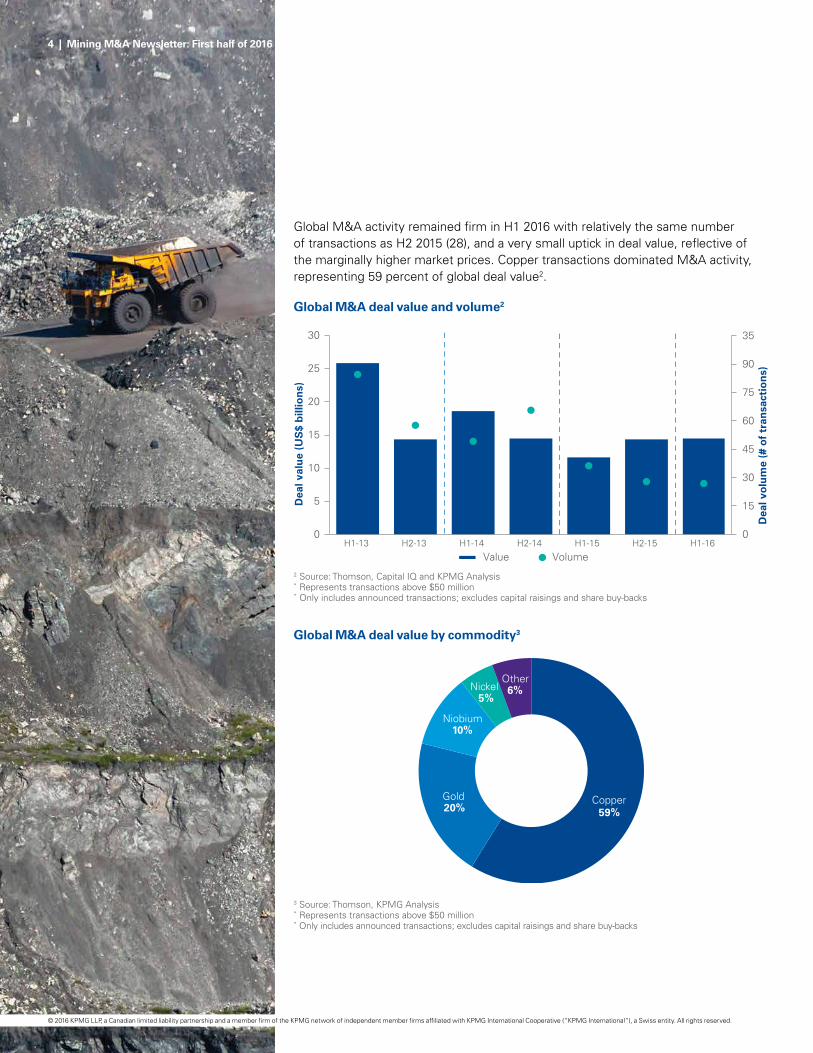
Global M&A deal value and volume2
2 Source: Thomson, Capital IQ and KPMG Analysis* Represents transactions above $50 million* Only includes announced transactions; excludes capital raisings and share buy-backs
Global M&A activity remained firm in H1 2016 with relatively the same number of transactions as H2 2015 (28), and a very small uptick in deal value, reflective of the marginally higher market prices. Copper transactions dominated M&A activity, representing 59 percent of global deal value2.
Copper 59%
Gold 20%
Niobium 10%
Nickel 5%
Other 6%
Global M&A deal value by commodity3
3 Source: Thomson, KPMG Analysis* Represents transactions above $50 million* Only includes announced transactions; excludes capital raisings and share buy-backs
© 2016 KPMG LLP, a Canadian limited liability partnership and a member firm of the KPMG network of independent member firms affiliated with KPMG International Cooperative (“KPMG International”), a Swiss entity. All rights reserved.
4 | Mining M&A Newsletter: First half of 2016
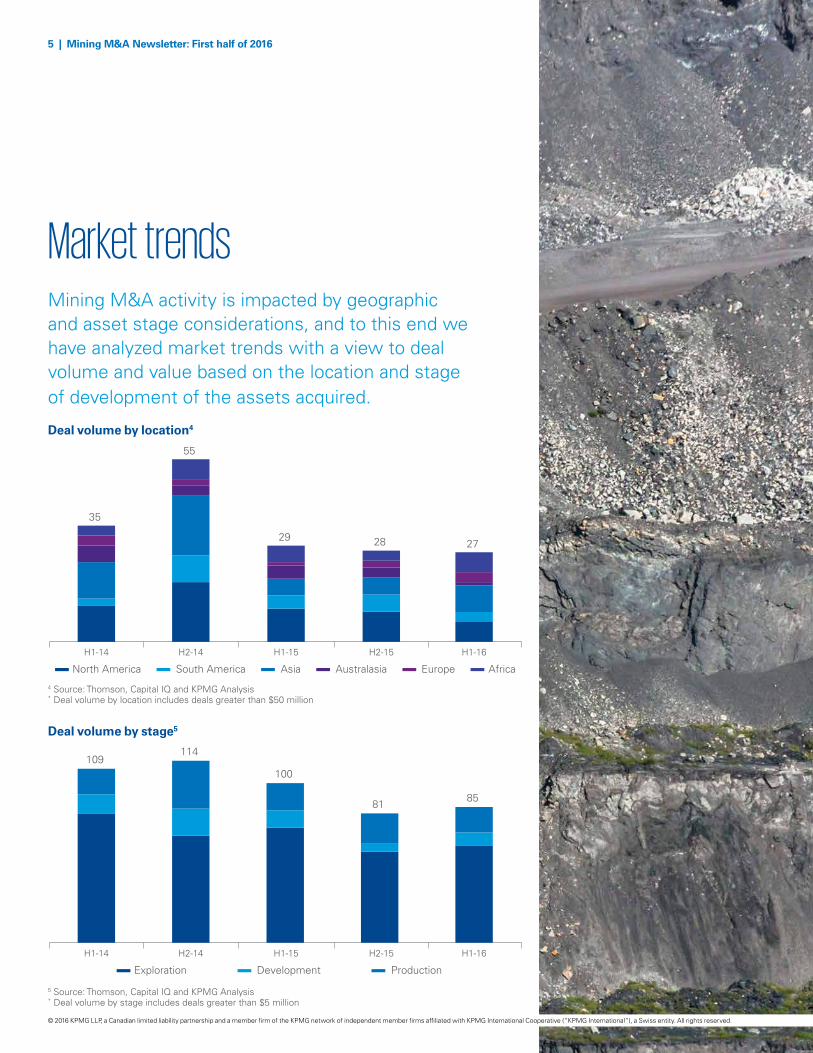
4 Source: Thomson, Capital IQ and KPMG Analysis* Deal volume by location includes deals greater than $50 million
5 Source: Thomson, Capital IQ and KPMG Analysis* Deal volume by stage includes deals greater than $5 million
Mining M&A activity is impacted by geographic and asset stage considerations, and to this end we have analyzed market trends with a view to deal volume and value based on the location and stage of development of the assets acquired.
Market trends
Deal volume by location4
© 2016 KPMG LLP, a Canadian limited liability partnership and a member firm of the KPMG network of independent member firms affiliated with KPMG International Cooperative (“KPMG International”), a Swiss entity. All rights reserved.
5 | Mining M&A Newsletter: First half of 2016
35
55
29 28 27
H1-14 H2-14 H1-15 H2-15 H1-16
North America South America Asia Australasia Europe Africa
H1-14 H2-14 H1-15 H2-15 H1-16
Exploration Development Production
109 114
100
81 85
Deal volume by stage5
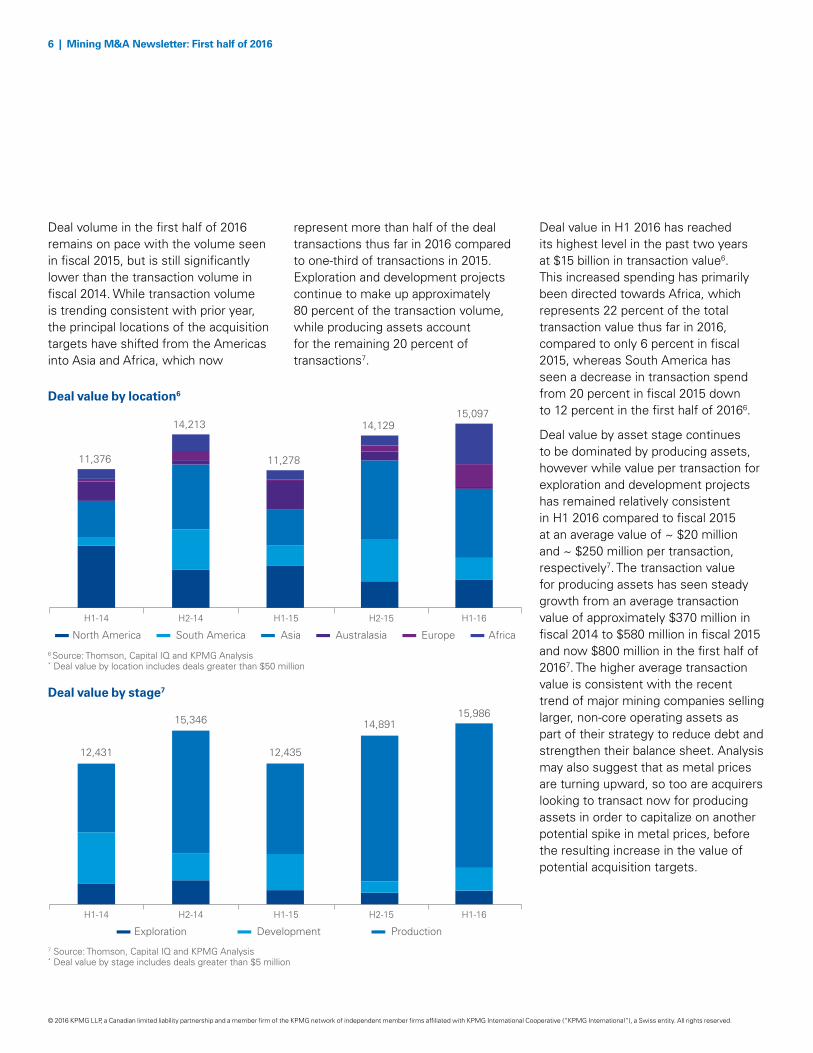
Deal value in H1 2016 has reached its highest level in the past two years at $15 billion in transaction value6. This increased spending has primarily been directed towards Africa, which represents 22 percent of the total transaction value thus far in 2016, compared to only 6 percent in fiscal 2015, whereas South America has seen a decrease in transaction spend from 20 percent in fiscal 2015 down to 12 percent in the first half of 20166.
Deal value by asset stage continues to be dominated by producing assets, however while value per transaction for exploration and development projects has remained relatively consistent in H1 2016 compared to fiscal 2015 at an average value of ~ $20 million and ~ $250 million per transaction, respectively7. The transaction value for producing assets has seen steady growth from an average transaction value of approximately $370 million in fiscal 2014 to $580 million in fiscal 2015 and now $800 million in the first half of 20167. The higher average transaction value is consistent with the recent trend of major mining companies selling larger, non-core operating assets as part of their strategy to reduce debt and strengthen their balance sheet. Analysis may also suggest that as metal prices are turning upward, so too are acquirers looking to transact now for producing assets in order to capitalize on another potential spike in metal prices, before the resulting increase in the value of potential acquisition targets.
Deal volume in the first half of 2016 remains on pace with the volume seen in fiscal 2015, but is still significantly lower than the transaction volume in fiscal 2014. While transaction volume is trending consistent with prior year, the principal locations of the acquisition targets have shifted from the Americas into Asia and Africa, which now
represent more than half of the deal transactions thus far in 2016 compared to one-third of transactions in 2015. Exploration and development projects continue to make up approximately 80 percent of the transaction volume, while producing assets account for the remaining 20 percent of transactions7.
Deal value by location6
H1-14 H2-14 H1-15 H2-15 H1-16
North America South America Asia Australasia Europe Africa
11,376
14,213
11,278
14,129 15,097
H1-14 H2-14 H1-15 H2-15 H1-16
Exploration Development Production
12,431
15,346
12,435
14,89115,986
Deal value by stage7
6 Source: Thomson, Capital IQ and KPMG Analysis* Deal value by location includes deals greater than $50 million
7 Source: Thomson, Capital IQ and KPMG Analysis* Deal value by stage includes deals greater than $5 million
© 2016 KPMG LLP, a Canadian limited liability partnership and a member firm of the KPMG network of independent member firms affiliated with KPMG International Cooperative (“KPMG International”), a Swiss entity. All rights reserved.
6 | Mining M&A Newsletter: First half of 2016
8 Source: Thomson, Capital IQ, KPMG Analysis
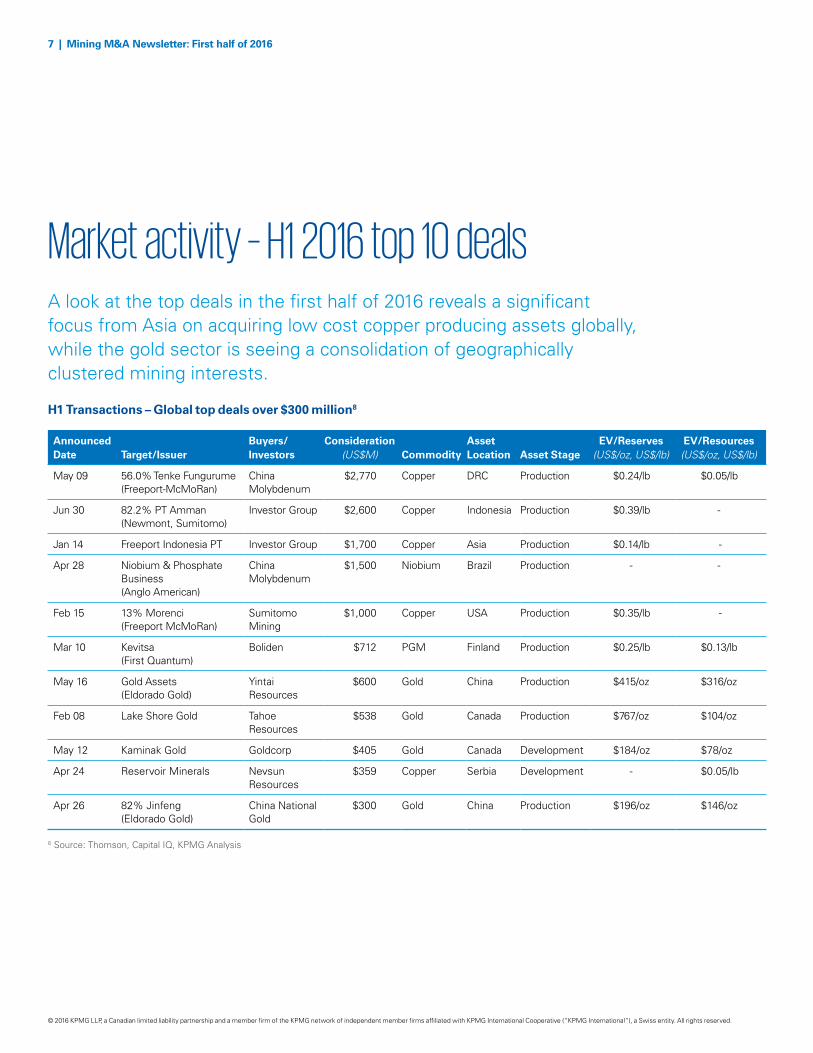
H1 Transactions – Global top deals over $300 million8
A look at the top deals in the first half of 2016 reveals a significant focus from Asia on acquiring low cost copper producing assets globally, while the gold sector is seeing a consolidation of geographically clustered mining interests.
Market activity – H1 2016 top 10 deals
Announced Date Target/Issuer
Buyers/Investors
Consideration (US$M) Commodity
Asset Location Asset Stage
EV/Reserves (US$/oz, US$/lb)
EV/Resources (US$/oz, US$/lb)
May 09 56.0% Tenke Fungurume (Freeport-McMoRan)
China Molybdenum
$2,770 Copper DRC Production $0.24/lb $0.05/lb
Jun 30 82.2% PT Amman (Newmont, Sumitomo)
Investor Group $2,600 Copper Indonesia Production $0.39/lb -
Jan 14 Freeport Indonesia PT Investor Group $1,700 Copper Asia Production $0.14/lb -
Apr 28 Niobium & Phosphate Business (Anglo American)
China Molybdenum
$1,500 Niobium Brazil Production - -
Feb 15 13% Morenci (Freeport McMoRan)
Sumitomo Mining
$1,000 Copper USA Production $0.35/lb -
Mar 10 Kevitsa (First Quantum)
Boliden $712 PGM Finland Production $0.25/lb $0.13/lb
May 16 Gold Assets (Eldorado Gold)
Yintai Resources
$600 Gold China Production $415/oz $316/oz
Feb 08 Lake Shore Gold Tahoe Resources
$538 Gold Canada Production $767/oz $104/oz
May 12 Kaminak Gold Goldcorp $405 Gold Canada Development $184/oz $78/oz
Apr 24 Reservoir Minerals Nevsun Resources
$359 Copper Serbia Development - $0.05/lb
Apr 26 82% Jinfeng (Eldorado Gold)
China National Gold
$300 Gold China Production $196/oz $146/oz
© 2016 KPMG LLP, a Canadian limited liability partnership and a member firm of the KPMG network of independent member firms affiliated with KPMG International Cooperative (“KPMG International”), a Swiss entity. All rights reserved.
7 | Mining M&A Newsletter: First half of 2016
Copper steals the stageAfter a very subdued year for copper activity throughout 2015, the base metal captured 60 percent of global deal value in H1 2016, as well as five of the six largest transactions, each exceeding $1 billion8.
The largest transaction of the half was announced May 9, as U.S.-based Freeport McMoRan (NYSE:FCX) agreed to sell its 56 percent stake in the Tenke Fungurume mine to China Molybdenum (HKG:3993) for $2.77 billion8. Located in the Democratic Republic of the Congo, Tenke Fungurume had been one of FCX’s five core mines. Tenke also produces cobalt, of particular interest to China Molybdenum, which is reportedly inquiring about other Freeport cobalt assets. FCX may receive a further $120 million in the Tenke deal based on developments in copper and cobalt prices8. FCX welcomed the cash infusion to support its targeted $4 billion debt reduction goal by June 30, 2016 in an attempt to strengthen its balance sheet after several difficult years8.
Indonesian PT Amman Mineral Internasional (PT AMI) has offered to purchase 82 percent of PT Newmont Nusa Tenggara (PTNNT), the company that operates the Batu Hijau copper and gold mine, Indonesia’s second-largest copper and gold mine, for $2.6 billion8.
The Indonesian buyers are acquiring 56 percent of PTNNT from U.S.-based Newmont Mining (NYSE:NEM) and Japan’s Sumitomo Corp. (TYO:8053), with the remaining 26 percent coming from local companies8. Newmont will receive $920 million upon closing and up to $403 million more depending on copper prices and mine developments8. According to Newmont, the proceeds will help fund projects while reducing risk and debt.
The next-largest copper transaction was prompted by an act of the Indonesian government, which ordered private copper and gold miner PT Freeport Indonesia (PT-FI) to sell 11 percent of its shares to state-owned mining corporations in compliance with regulations8. PT Aneka Tambang (JKSE:ANTM) and PT Indonesia Asahan Aluminium (Inalum) are the state mining corporations that will acquire the shares, as well as operating responsibilities for Freeport’s gold mines as the government may mandate. Freeport set the price of the deal at $1.7 billion, but the Indonesian government considers this to be overvalued8. Pricing of the transaction is currently under review.
On April 24, two Canadian companies, Nevsun Resources (TSX:NSU) and Reservoir Minerals (TSX.V:RMC) announced an agreement to combine
their companies in a transaction worth $359 million8. The combined company emerges as a mid-tier base metals miner with the producing open pit copper-zinc Bisha mine in Eritrea and the wholly owned high grade copper-gold Timok development project in Serbia. Upon completion of the merger, current Nevsun shareholders will own about 67 percent of the new company and Reservoir shareholders will own the remaining 33 percent8.
Freeport McMoRan (NYSE:FCX) surfaced again in the fifth largest and final significant copper transaction of the half, as Japan’s Sumimoto Metal Mining (TYO:5713) paid $1 billion in cash for a further 13 percent interest in the Morenci copper mine it owns with joint venture partner Freeport McMoRan8. Sumimoto already held an indirect 15 percent stake8. Freeport McMoRan’s CEO stated that the Company plans to use the cash to accelerate debt reduction and restore the company’s balance sheet. Located in eastern Arizona, Morenci holds one of the largest copper reserves in the world according to some sources. The mine has estimated reserves of 3.2 billion tonnes of ore graded 0.16 percent copper8.
© 2016 KPMG LLP, a Canadian limited liability partnership and a member firm of the KPMG network of independent member firms affiliated with KPMG International Cooperative (“KPMG International”), a Swiss entity. All rights reserved.
8 | Mining M&A Newsletter: First half of 2016
String of gold dealsAlthough gold lost its leadership for deal value in H1 2016, the precious metal still held down the second spot with a 20 percent share and captured three of the top 10 transactions8. All deals came in under $1 billion, but the activity maintained momentum in the global gold sector8.
In the largest of these transactions, Eldorado Gold (TSE:ELD) sold its ownership stakes in two mines and one development project to Yintai Resources (SHE:000975) for $600 million in cash8. The sale includes a 95 percent interest in the White Mountain mine, a 90 percent interest in the Tanjianshan mine and a 75 percent stake in the Eastern Dragon project9. As an adjunct to the largest gold deal of the half, but falling just outside the top 10 deals, was Eldorado Gold’s sale of its 82 percent interest in the Jinfeng mine to China National Gold Group as part of its overall exit strategy from China8. The deal was worth $300 million in cash. China National Gold had been Eldorado’s minority partner at Jinfeng for over fourteen years. Jinfeng entered production in 2007, and has performed well over the ensuing nine years8. The asset sales signifies Eldorado’s exit from mining in China after 11 years. Eldorado had been the largest foreign gold producer in China, but had trouble increasing the market value of its Chinese assets. Eldorado plans to use
the proceeds of sale to concentrate on long-lived, low-cost assets.
Lake Shore Gold (TSE:LSG) accepted a friendly $538 million all-stock offer from Tahoe Resources (TSE:THO) to acquire the company8. The combined entity can now accelerate development of Lake Shore’s existing project pipeline without worrying about diluting equity or adding debt. Tahoe will diversify its mining assets into Canada, a mining-friendly jurisdiction, and decrease exposure to Guatemala. Tahoe’s Escobal mine in Guatemala is the company’s flagship operation, but the mine has faced political hurdles and local opposition. Lake Shore’s operating assets are located near Timmins, Ontario.
In an all-Canadian transaction, Goldcorp Inc. (TSE:G) has acquired all of the outstanding shares of Kaminak Gold (CVE:KAM) for approximately $405 million in an all-share deal8. The transaction gives Kaminak shareholders a 40 percent share premium9. Kaminak’s prize asset is its wholly owned Coffee gold project located approximately 130 kilometres south of the City of Dawson, Yukon. Coffee is a high-grade, open pit, heap leach project with total indicated gold mineral resources of 3 million ounces and probable reserves of 2.2 million ounces9. Goldcorp’s move is part of a strategy of partnering with junior exploration companies to find and develop significant new mining districts.
Solo deals for niobium, nickel
One of the largest announced deals in 2016 to date was Anglo American’s (LON:AAL) $1.5 billion sale of its niobium and phosphates businesses in Brazil to China Molybdenum Co. Ltd. (HKG:3993)9. The phosphates business consists of a mine, beneficiation plant, two chemical complexes and two further mineral deposits. The niobium business consists of one mine and three processing facilities, two non-operating mines, two further mineral deposits and sales and marketing operations in the United Kingdom and Singapore.
Although nickel deals have been scarce lately, one large nickel deal ranged close to $1 billion in H1 2016, placing it on the global list of significant transactions. Swedish buyer Boliden (STO:BOL) offered First Quantum Minerals (TSE:FM), a Canadian company, $712 million in cash for its Kevitsa mine located in Finland9. Boliden targeted Kevitsa for its high quality, and excellent operational and geographic fit. The infusion of cash will help First Quantum cut its debt to target levels and add overall financial strength to its business. Nickel markets staged a recent rally, helping First Quantum obtain an advantageous price for the asset.
9 Source: Thomson, Capital IQ and KPMG Analysis
© 2016 KPMG LLP, a Canadian limited liability partnership and a member firm of the KPMG network of independent member firms affiliated with KPMG International Cooperative (“KPMG International”), a Swiss entity. All rights reserved.
9 | Mining M&A Newsletter: First half of 2016
Nolan Watson co-founded Sandstorm in 2008, prior to which he served as the Chief Financial Officer of Silver Wheaton Corp. In that role, Mr. Watson developed the silver streaming business model and helped raise over US$1 billion in debt and equity to fund Silver Wheaton’s growth. Mr. Watson is a Chartered Professional Accountant (Valedictorian), holds the designation of Chartered Financial Analyst and received a Bachelor of Commerce degree, with honours, from the University of British Columbia. He has won numerous awards for his professional and charitable achievements including the Early Achievement Award by the Institute of Chartered Accountants of British Columbia, Canada’s Top 40 Under 40 award, CEO of the Year by Business in Vancouver and the Queen’s Diamond Jubilee Medal. Mr. Watson also serves as the Chairman of the Audit Committee of the board of Bear Creek Mining Corp.
Sandstorm Gold provides financing to gold mining companies through gold stream and royalty agreements. Stream and royalty finance involves Sandstorm making an upfront payment to a mining partner that is in need of capital to build their mine, refinance their obligations, complete an acquisition or for various other reasons. In exchange for that upfront payment, Sandstorm receives the right to purchase a percentage of the gold produced from the mine (in the case of a stream) or a portion of the revenue generated from the mine (in the case of a royalty). Since 2009, Sandstorm has compiled a portfolio of 131 streams and royalties, of which 20 of the underlying assets are currently producing gold. Sandstorm plans to continue growing the company through accretive acquisitions of gold streams and royalties.
What were the factors that contributed to starting Sandstorm and the decision to focus on royalties/streams?I have wanted to start up and run businesses my whole life, and I have always had an entrepreneurial bent. To me, creating something is more fulfilling than maintaining something and since my career had focused on gold and silver mining, starting a precious metal royalty business was a natural fit.
1
Fireside chat with Nolan Watson, CEO, Sandstorm Gold
Nolan Watson CPA, FCA, CFAPresident, CEO and Director Sandstorm Gold
© 2016 KPMG LLP, a Canadian limited liability partnership and a member firm of the KPMG network of independent member firms affiliated with KPMG International Cooperative (“KPMG International”), a Swiss entity. All rights reserved.
10 | Mining M&A Newsletter: First half of 2016
© 2016 KPMG LLP, a Canadian limited liability partnership and a member firm of the KPMG network of independent member firms affiliated with KPMG International Cooperative (“KPMG International”), a Swiss entity. All rights reserved.
11 | Mining M&A Newsletter: First half of 2016
Why do some companies see streaming as a better alternative to traditional financing sources?The mining industry is incredibly volatile and building mining projects is an incredibly risky activity which is characterized by capital expenditure overruns, technical challenges and political risk. These characteristics combine to make financing mining projects with traditional debt a losing proposition. When things go wrong, and they always do, banks get nervous and call mining companies into default, which often results in insolvency of the mining company. In comparison, when Sandstorm provides royalty or stream financing, we have incentive alignment with the mining company because we only make money if the mine gets up and running and is successful. We are long-term oriented and committed to our mining partners.
Has there been an evolution in your service offering and how has the industry reacted to this form of financing? Stream and royalty finance has gone from being an obscure and fringe form of financing to a mainstream form of mine finance. As the industry has evolved, so has the flexibility of the types of financing that we can do. Today, we tailor each and every financing agreement directly to the specific situation of each mine. Every structure is slightly different as we focus on the unique aspects of each client and we pride ourselves in our flexibility.
What are the pros and cons of streaming transactions vs. traditional financing?In addition to being lower risk than traditional debt, streaming and royalty finance has the benefit of not being as dilutive as equity. One of the things that we look for at Sandstorm are quality projects that are trading in the market at below their intrinsic value, because we know that raising equity at low valuations is unattractive to the mining companies, making stream or royalty financing more attractive.
2
3
4
Is timing a factor when deciding to stream precious metals content; what stage of the mining cycle do companies generally prefer to stream?You would expect that mining companies would sell streams at the top of the market in order to get the best price, however, in our experience, we find more companies willing to sell streams at the bottom of the market because they can’t get money elsewhere. Generally, this dynamic works well for Sandstorm as it allows us to buy assets at attractive prices.
What factors impact the pricing of a streaming transaction – i.e. how much Sandstorm pays for a particular stream?Commodity prices, production, political risk, company risk and exploration upside all factor into what a stream or royalty is worth. Ultimately, anything that lowers risk and / or increases potential upside makes a stream or royalty worth more.
Where do you see further possible changes in terms of your investment strategy or activities when commodity prices rebound?As commodity prices rebound, at Sandstorm, we plan on being creative to ensure we can continue acquiring streams and royalties. We have even considered purchasing mines outright if the valuation is attractive so that we can create a stream, and then spin the mine out into a public company. We have already used this approach for smaller exploration properties in order to create free royalties and it has worked out well for us in the process.
5
6
7
kpmg.ca
Contact usFor more information about M&A trends in the worldwide mining industry, please contact:
Jamie SamogradPartner, Deal Advisory Transaction ServicesT: 416-777-3078 E: [email protected]
Geoff HayesSenior Manager, Deal Advisory Global InfrastructureT: 416-777-3269 E: [email protected]
Zakir PatelVice President, Deal Advisory Corporate FinanceT: 416-777-8944 E: [email protected]
The information contained herein is of a general nature and is not intended to address the circumstances of any particular individual or entity. Although we endeavor to provide accurate and timely information, there can be no guarantee that such information is accurate as of the date it is received or that it will continue to be accurate in the future. No one should act on such information without appropriate professional advice after a thorough examination of the particular situation.
© 2016 KPMG LLP, a Canadian limited liability partnership and a member firm of the KPMG network of independent member firms affiliated with KPMG International Cooperative (“KPMG International”), a Swiss entity. All rights reserved. 13892
The KPMG name and logo are registered trademarks or trademarks of KPMG International.