Embed Size (px)
Citation preview

A peer-reviewed version of this preprint was published in PeerJ on 19January 2016.
View the peer-reviewed version (peerj.com/articles/1558), which is thepreferred citable publication unless you specifically need to cite this preprint.
Mullen J, Cockell SJ, Tipney H, Woollard PM, Wipat A. 2016. Mining integratedsemantic networks for drug repositioning opportunities. PeerJ 4:e1558https://doi.org/10.7717/peerj.1558
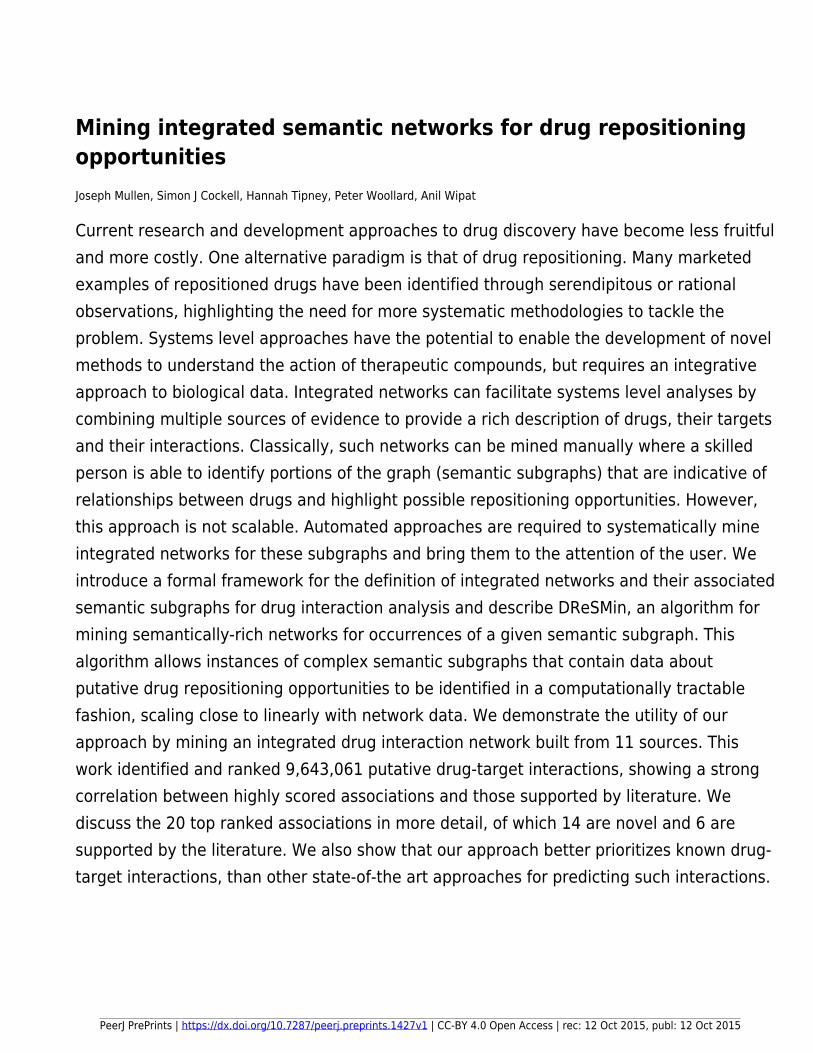
Mining integrated semantic networks for drug repositioning
opportunities
Joseph Mullen, Simon J Cockell, Hannah Tipney, Peter Woollard, Anil Wipat
Current research and development approaches to drug discovery have become less fruitful
and more costly. One alternative paradigm is that of drug repositioning. Many marketed
examples of repositioned drugs have been identified through serendipitous or rational
observations, highlighting the need for more systematic methodologies to tackle the
problem. Systems level approaches have the potential to enable the development of novel
methods to understand the action of therapeutic compounds, but requires an integrative
approach to biological data. Integrated networks can facilitate systems level analyses by
combining multiple sources of evidence to provide a rich description of drugs, their targets
and their interactions. Classically, such networks can be mined manually where a skilled
person is able to identify portions of the graph (semantic subgraphs) that are indicative of
relationships between drugs and highlight possible repositioning opportunities. However,
this approach is not scalable. Automated approaches are required to systematically mine
integrated networks for these subgraphs and bring them to the attention of the user. We
introduce a formal framework for the definition of integrated networks and their associated
semantic subgraphs for drug interaction analysis and describe DReSMin, an algorithm for
mining semantically-rich networks for occurrences of a given semantic subgraph. This
algorithm allows instances of complex semantic subgraphs that contain data about
putative drug repositioning opportunities to be identified in a computationally tractable
fashion, scaling close to linearly with network data. We demonstrate the utility of our
approach by mining an integrated drug interaction network built from 11 sources. This
work identified and ranked 9,643,061 putative drug-target interactions, showing a strong
correlation between highly scored associations and those supported by literature. We
discuss the 20 top ranked associations in more detail, of which 14 are novel and 6 are
supported by the literature. We also show that our approach better prioritizes known drug-
target interactions, than other state-of-the art approaches for predicting such interactions.
PeerJ PrePrints | https://dx.doi.org/10.7287/peerj.preprints.1427v1 | CC-BY 4.0 Open Access | rec: 12 Oct 2015, publ: 12 Oct 2015
Mining integrated semantic networks for 1
drug repositioning opportunities 2
Joseph Mullen1, Simon J. Cockell2, Hannah Tipney3, Peter Woollard3, and 3
Anil Wipat1,*4
1Interdisciplinary Computing and Complex BioSystems Research Group, School of 5
Computing Science, Newcastle University, Newcastle upon Tyne, NE1 7RU, UK 6
2Bioinformatics Support Unit, Newcastle University, Newcastle upon Tyne, NE1 7RU, UK 7
3Computational Biology Department, Quantitative Sciences, GlaxoSmithKline Research 8
& Development Ltd, Gunnels Wood Road, Stevenage, Hertfordshire, UK. 9
*E-mail: [email protected] 10
*Phone: +44-191-222-8213 11
ABSTRACT 12
Current research and development approaches to drug discovery have become less fruitful and more
costly. One alternative paradigm is that of drug repositioning. Many marketed examples of repositioned
drugs have been identified through serendipitous or rational observations, highlighting the need for
more systematic methodologies to tackle the problem. Systems level approaches have the potential
to enable the development of novel methods to understand the action of therapeutic compounds, but
requires an integrative approach to biological data. Integrated networks can facilitate systems level
analyses by combining multiple sources of evidence to provide a rich description of drugs, their targets
and their interactions. Classically, such networks can be mined manually where a skilled person is able
to identify portions of the graph (semantic subgraphs) that are indicative of relationships between drugs
and highlight possible repositioning opportunities. However, this approach is not scalable. Automated
approaches are required to systematically mine integrated networks for these subgraphs and bring them
to the attention of the user. We introduce a formal framework for the definition of integrated networks and
their associated semantic subgraphs for drug interaction analysis and describe DReSMin, an algorithm
for mining semantically-rich networks for occurrences of a given semantic subgraph. This algorithm
allows instances of complex semantic subgraphs that contain data about putative drug repositioning
opportunities to be identified in a computationally tractable fashion, scaling close to linearly with network
data. We demonstrate the utility of our approach by mining an integrated drug interaction network built
from 11 sources. This work identified and ranked 9,643,061 putative drug-target interactions, showing a
strong correlation between highly scored associations and those supported by literature. We discuss the
20 top ranked associations in more detail, of which 14 are novel and 6 are supported by the literature.
We also show that our approach better prioritizes known drug-target interactions, than other state-of-the
art approaches for predicting such interactions.
13
Keywords: drug repositioning, data integration, data mining, semantic networks, semantic subgraphs,
bioinformatics, systems approaches14
INTRODUCTION 15
Drug repositioning is the application of established, approved compounds to a novel therapeutic appli- 16
cation. This process is a rapidly-evolving issue in the area of drug development, having the potential to 17
reduce both drug development costs and the time taken for a drug to reach the market. Many repositioned 18
drugs currently on the market have been discovered through either serendipitous or rational observations. 19
However, these manual approaches are not efficient given the potentially huge search space of drug-target 20
(D-T) interactions. Systematic approaches to searching for repositioning opportunities are required to 21
provide an efficient and scalable alternative to manual investigations. 22
A large number of studies have detailed computational approaches to aid in the systematic identification 23
of drug repositioning opportunities, including methodologies based on: chemical structure (Keiser et al., 24
2009), protein structure and molecular docking (Moriaud et al., 2011), phenotype similarity (such as 25
side-effect similarity (Yang and Agarwal, 2011) and gene expression similarity (Lamb et al., 2006)) or 26
genetic variation (Sanseau et al., 2012). 27
More recent approaches to drug repositioning focus on the creation of integrated networks which 28
combine data from multiple analyses, to give a systems level view of cellular and molecular processes 29
(Chen et al., 2012; Cockell et al., 2010; He et al., 2011). This approach provides a complementary path 30
to reductionist science in understanding complex phenomena. Semantically-rich integrated networks, 31
which utilise a graph-based representation, are a convenient method of representing the types of integrated 32
data necessary for finding drug repositioning opportunities (Betzler et al., 2011). In graph-based data, 33
entities, such as proteins or drugs, are represented as vertices. Interactions between these entities, such 34
as protein-protein interactions or a drugs binding to a protein are captured in edges. In semantic graphs 35
each vertex and edge in the graph is assigned a type from a predefined set. Vertices and edges are also 36
are annotated with attributes. Graph representations of complex systems are widely used in computer 37
science, social and technological network analysis science due to their ability to represent structured 38
and semi-structured data (Riaz and Ali, 2011). Within bioinformatics graph-based representations are 39
also widely adopted, particularly as a means of representing data produced during an exercise in data 40
integration and in protein-protein interactions networks. 41
In the context of these integrated networks, subgraphs are connected components of the parent 42
network (Gallagher, 2006). These subgraphs formally capture local relationships between the elements 43
represented in the graph. Often, the relationships in a given subgraph are indicative of a particular 44
biological phenomenon. In the case of drug repositioning networks, the types of relationships include 45
amongst others: interactions between drugs and their targets, interactions between targets, and the 46
diseases associated with particular targets. Therefore, within the integrative graph are subgraphs that 47
describe repositioning opportunities as a result of their semantic and topological properties. Once 48
appropriate subgraphs have been observed and defined they can be used as templates to find instances 49
of these subgraphs, and related subgraphs, within a given graph to highlight similar drug repositioning 50
opportunities. 51
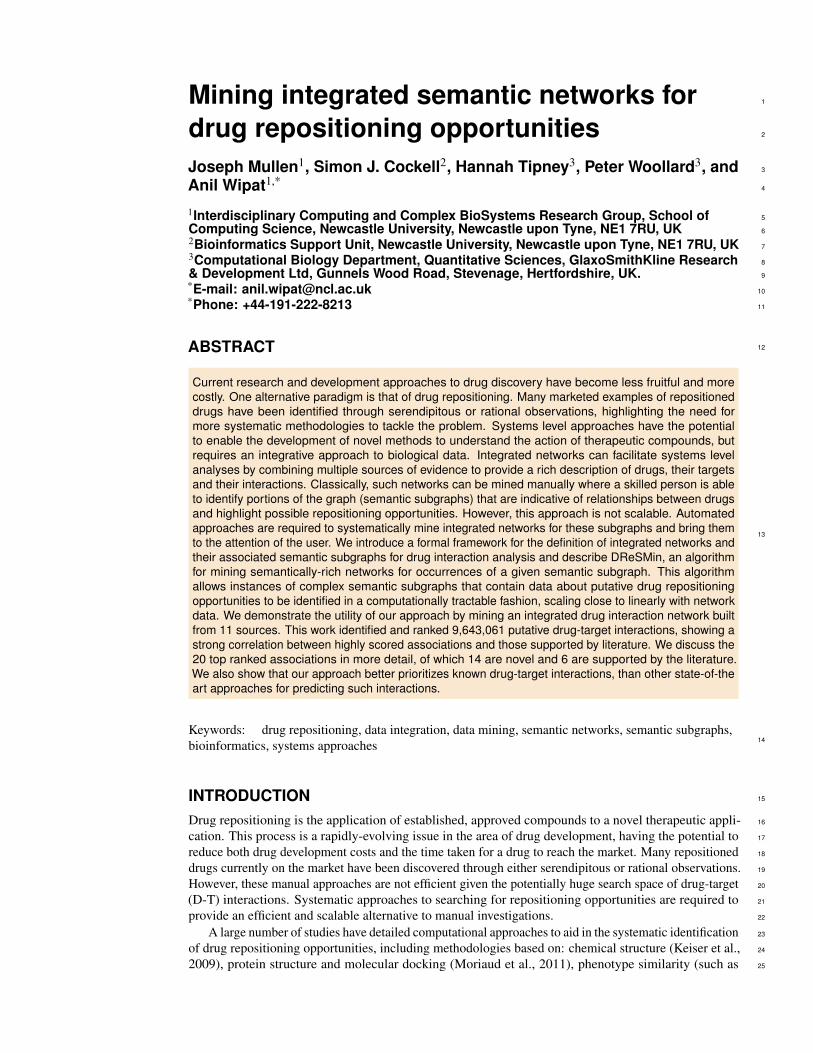
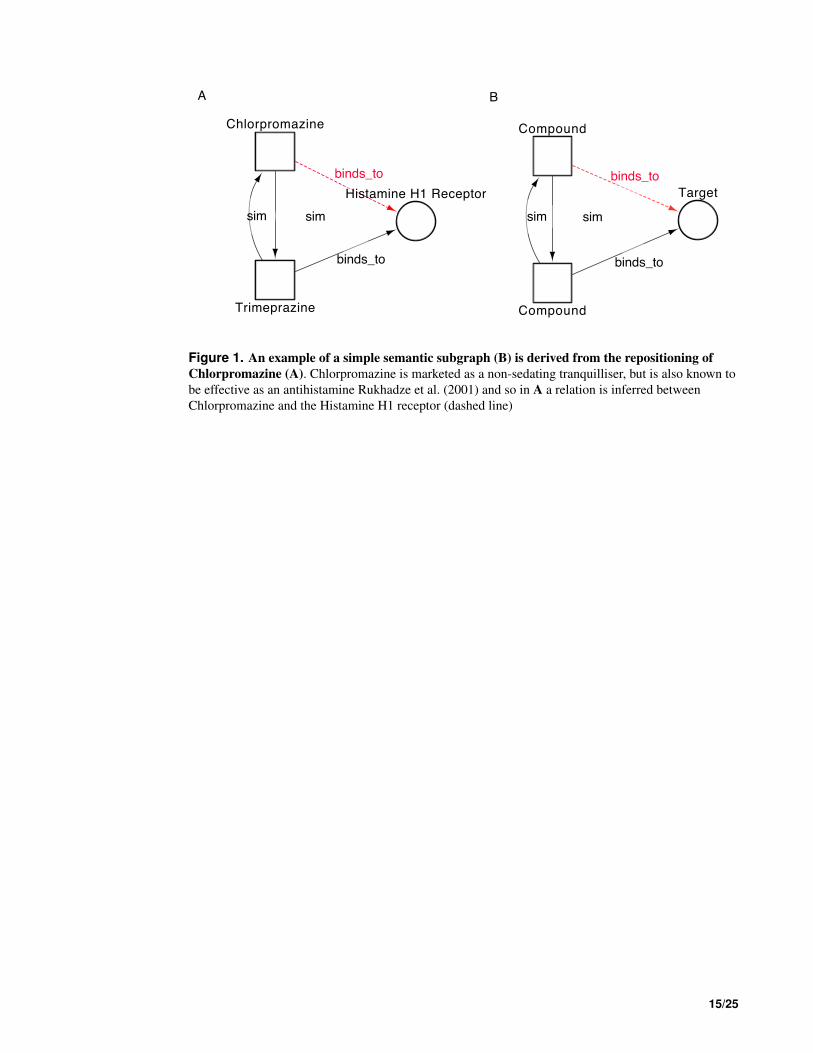
For example, chlorpromazine is an anti-psychotic drug that is also approved as an antihistamine 52
(Mitchell, 1993). The interactions of chlorpromazine can be captured in an integrated network (Fig. 53
1). Data from DrugBank version 2.5 (DBv2.5) (Wishart, 2006) provides three interactions between 54
chlorpromazine and single protein targets; none of these interactions explain the antihistaminic affects of 55
the drug. Structurally, chlorpromazine is very similar to the antiemetic trimeprazine. DBv2.5 captures 56
an interaction between trimeprazine and the Histamine H1 receptor, a known target for antihistamines. 57
Through guilt-by-association, we can therefore predict the Histamine H1 receptor as a target for chlor- 58
promazine, an interaction captured in the latest editions of the DrugBank database. The topological and 59
semantic properties of the subgraph depicted in Fig. 1B describe a repositioning relationship that could 60
be generically applicable to any two drugs and their target. Fig. 1B describes a situation whereby a 61
compound, structurally similar to a compound with a known target, may also bind to the same target 62
(the inference is represented as the dashed line). This real example can therefore be used to derive a 63
template semantic subgraph that can be used for searching for similar, but novel, drug-target associations 64
relationships involving different drugs and targets. This template semantic subgraph therefore describes 65
a pattern indicative of a drugs interaction with a target, highlighting potential new indications for the 66
drug. Although Fig. 1 shows a simple triad, semantic subgraphs capturing data relevant to repositioning 67
opportunities are likely to be more complex. In the context of drug repositioning, manual identification of 68
potential repositioning opportunities from large target networks is possible, though not efficient for the 69
systematic analysis of such large networks. The definition of semantic subgraphs for known repositioning 70
opportunities, in combination with an algorithm for the mining of integrated complex networks for these 71
subgraphs, allows us to highlight potential repositioning in a more systematic and exhaustive fashion. 72
In this paper we introduce a formal framework for the definition of a semantic subgraph for integrated 73
networks. We also present DReSMin (Drug Repositioning Semantic Mining), an algorithm for searching 74
integrated networks for occurrences of a given semantic subgraph using semantic distance thresholds. 75
DReSMin optimises the search time for larger subgraphs by including a semantic graph pruning step 76
and applying a method for splitting large subgraphs prior to searching. We demonstrate the utility of 77
our approach by searching an integrated drug dataset for semantic subgraphs that are indicative of drug 78
repositioning opportunities, particularly focusing on inferring D-T interactions. As part of this work we 79
updated an existing integrated dataset used for in silico drug discovery (Cockell et al., 2010). Finally we 80
2/25
demonstrate that our approach can be successfully used to predict putative D-T interactions that were not 81
explicitly represented in the integrated network. 82
Graphs 83
Definition of our graph model A graph G is defined as a ordered pair (V,E), where V is a set of vertices 84
(or nodes), and E ∈ V ×V is a set of edges (or relations). Each e ∈ E is a pair (vi,v j) where vi,v j ∈ V . 85
Edges represent relations between vertices. Edges may be directed or undirected. Both vertices and edges 86
may be labelled, typed and attributed. 87
DReSMin, requires a directed (edges have a direction associated with them) graph where vertices and 88
edges are labelled with types Tv and Te respectively, where Tv and Te are drawn from a finite hierarchy of 89
types H, and are annotated with attributes. The algorithm allows for multigraphs (vertices vi and v j are 90
permitted to have multiple edges between them) and for vertices to contain self-loops (vi may have an 91
edge directed toward itself). For the remainder of this paper |V (G)| will be used to represent the number 92
of vertices contained in graph G. 93
Classical subgraph definition Subgraph isomorphism is a task in which two graphs, G & Q are given 94
as input and one must determine whether G contains a subgraph that is isomorphic to Q: is there a 95
subgraph G′(V ′,E ′) : V ′ ⊆V,E ′ ⊆ E? During the search of a query graph, a mapping (M) is expressed as 96
the set of ordered pairs (v,m) (with v ∈ G and m ∈ Q ) and so M = {(v,m) ∈VG ×VQ|v is mapped onto 97
m}; that is M : G′ 7→ Q. 98
Semantic subgraph definition A semantic subgraph is defined as Q = (V,E,Tv, fv,Te, fe) , where V is 99
a set of vertices, E is a set of edges, Tv is a set of node types and Te is a set of edge types. fv : V ։ Tv 100
and fe : E ։ Te are surjective functions; each node is assigned a node type and each edge an edge type 101
from Tv or Te respectively. A semantic subgraph aims to infer a relation between vertices of a particular te, 102
where a relation does not exist; for example between a compound and a target (Fig. 1B). 103
Graph matching 104
Several approaches have been described for combining semantic information with network motif topology 105
including the list coloured motif problem (Betzler et al., 2011; Lacroix et al., 2006). In this case a 106
motif (M) is defined as a multiset of colours, or types. An occurrence of M is a subset of vertices that 107
forms a connected subgraph whose multiset of colours, or types, matches that of M exactly (Lacroix 108
et al., 2006). Although this approach demonstrates how network motifs may be extended to incorporate 109
semantic information, it does not allow for topological exacts to be identified. The ability to identify 110
sub-components of a target network that match a defined topology is a necessity in situations where the 111
topology of a subgraph is believed to aid in describing the functionality of the sub-component. The task 112
of identifying mappings of a predefined subgraph with similar topology from a larger graph is known as 113
the graph matching problem (Gallagher, 2006). 114
There are different variations of the graph-matching problem. For example, exact matching occurs 115
when the mapping between the vertices of the two graphs is edge-preserving; a mapping contains all 116
edges defined by the query. One of the most stringent forms of exact matching is subgraph isomorphism 117
(Conte et al., 2004) which aims to find all occurrences of a query graph and is an NP-complete problem 118
(Washio and Motoda, 2003). Currently, algorithms addressing this problem are exponential in performance 119
relative to the size of the input graphs (Gallagher, 2006). Many algorithms which have been developed 120
to address the subgraph isomorphism problem are based on the exhaustive algorithm developed by 121
Ullmann (1976). Applying an exhaustive method to the identification of drug repositioning opportunities 122
is important to ensure all possible novel applications for a drug are investigated. Using a backtracking 123
approach, Ulmann’s algorithm finds solutions by incrementing partial solutions or abandoning them 124
when determining they cannot be completed (Ullmann, 1976). An extension of the Ullman approach, 125
incorporating the semantics of a graph, has been implemented using inexact (Djoko et al., 1997), as well 126
as exact approaches (Cordella et al., 2004; Giugno and Shasha, 2002). However, as yet, none of these 127
approaches have been applied to the automated identification of drug repositioning opportunities. 128
Whilst searching for semantic subgraphs it is important to consider the similarity between the query 129
subgraph and the target, both in terms of graph topology and the meaning of the annotations on vertices 130
and edges. A measurement of semantic similarity between elements of a mapping and the equivalent 131
element in a query must be introduced to the search and the degree of similarity can be expressed as a 132
3/25
semantic distance. Numerous measures have been developed to score the semantic similarity between 133
two ontological concepts (Ge and Qiu, 2008; Noy, 2004). Previous work in the area of intelligence 134
link analysis has used ontology-based semantic similarity scoring methods for pattern matching (Seid 135
and Mehrotra, 2007). In Seid and Mehrotra’s algorithm, an inexact topological search is carried out 136
with matches semantically scored based on their Least Common Ancestor (LCA) within an ontology. 137
Topological and semantic scores are then combined and k ranked matches returned. 138
Whilst approaches described are adequate for their particular setting, here we present a new exhaustive 139
graph matching approach to aid in the identification of potential drug repositioning opportunities from 140
a target network. We therefore describe an algorithm for this task which is an improvement on those 141
introduced for the purpose of drug repositioning. 142
MATERIALS AND METHODS 143
Algorithm 144
We have developed DReSMin, an algorithm for the detection of semantic subgraphs. This algorithm 145
returns all mappings of a semantic subgraph that match at a level equal to, or above a given threshold, ST. 146
In this case our application for the algorithm is the identification of a semantic subgraph (Q) which may be 147
indicative of drug repositioning opportunities within a target graph (G). Examples of semantic subgraphs 148
may be initially drawn from a set of templates, that is the graph representation of known repositioned 149
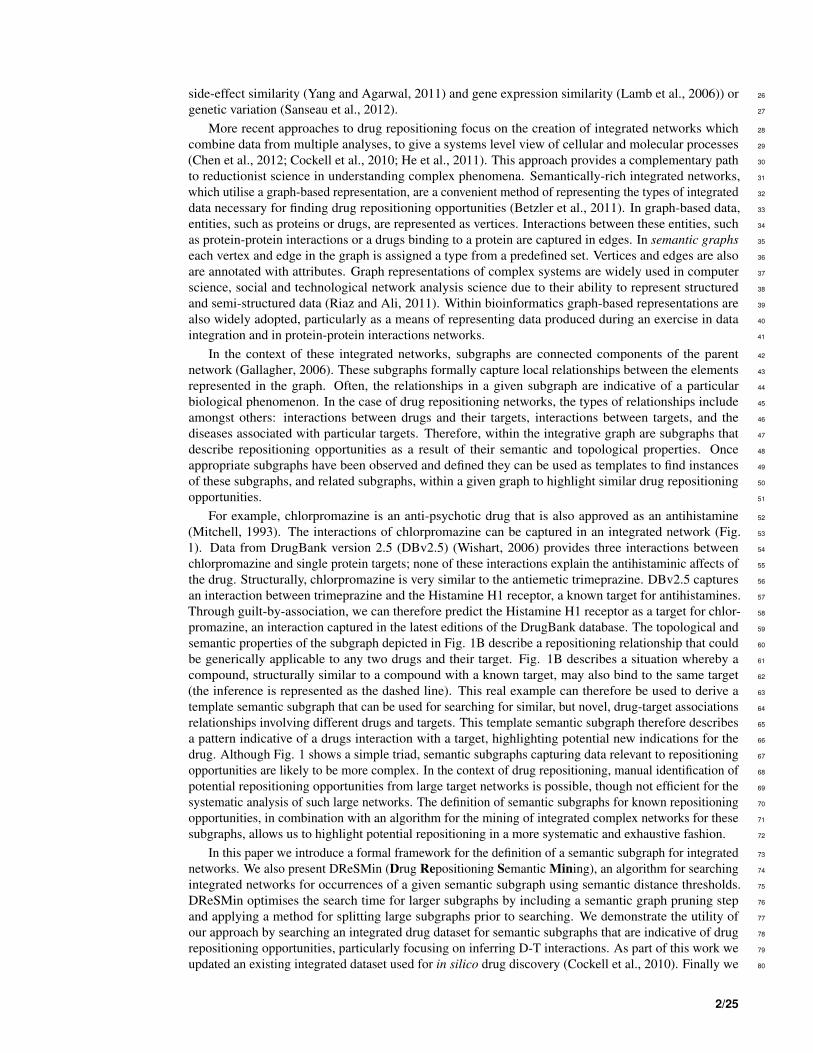
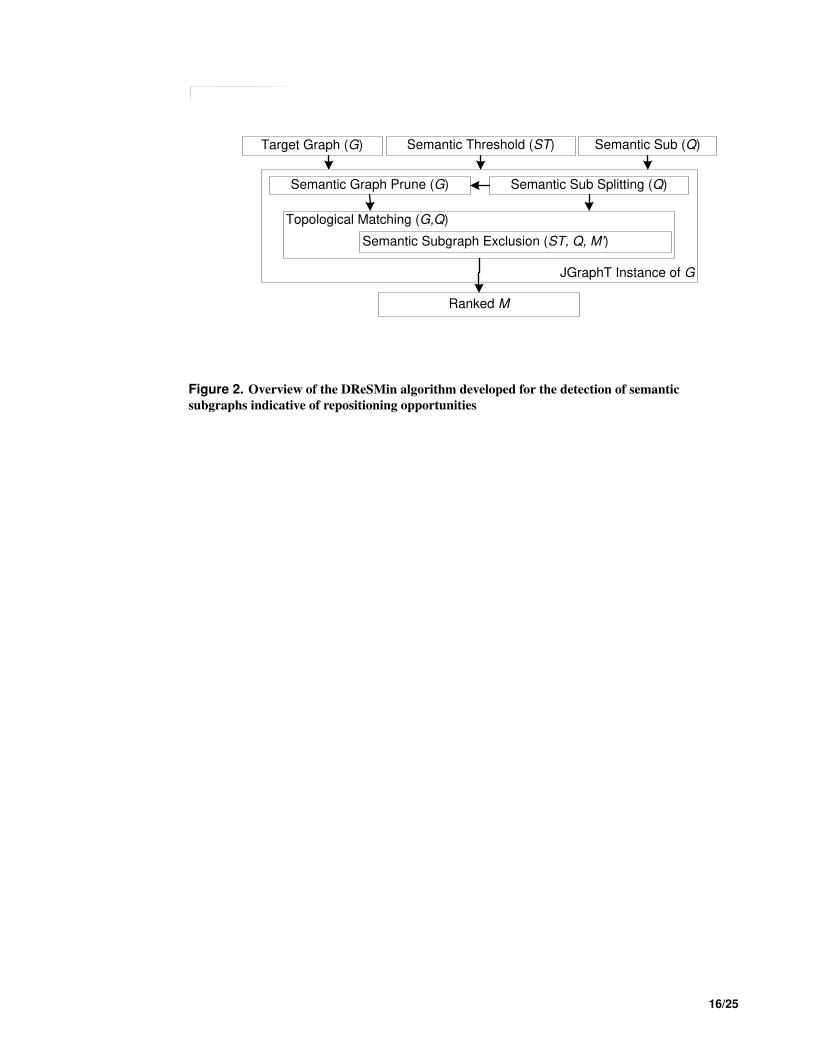
drugs, such as chlorpromazine, shown in Fig. 1A. The algorithm is made up of four main components 150
which are described in Fig. 2. These components comprise: (i) Semantic graph pruning (ii) Topological 151
search (iii) Semantic subgraph distance exclusion (iv) Semantic subgraph splitting. 152
Semantic graph pruning We are concerned only with identifying semantic subgraphs that match, 153
semantically, at a level equal to, or above our threshold. (Note: In this work, the semantic distance 154
between two graph entities is calculated using the semantic distance calculator described in the ’Semantic 155
subgraph distance exclusion’ section.) In this graph pruning component of the algorithm, any vertices 156
(and their associated edges) in G which are above a certain semantic distance from those in Q are removed 157
from G. This step allows any vertices that are semantically distant from our query to be removed prior to 158
a search, cutting down the search space. Taking G, Q and a semantic threshold (ST) each tv ∈ Tv(Q) are 159
sent to the semantic subgraph distance calculator (termed SDC and described later in the manuscript), 160
and scored against every tv ∈ Tv(G). If SDC(tv(Q), tv(G))< ST then all v ∈V (G) of type tv are removed 161
from G as well as any e ∈ E where v = vi or v = v j. Finally after all semantically insignificant elements 162
are removed from G, all isolated v ∈V (G) that may have resulted from the edge pruning step are also 163
removed. 164
Topological matching Many algorithms addressing the problem of subgraph isomorphism build on 165
Ullman’s work. These applications include: GraphQL (He and Singh, 2008), GADDI (Zhang et al., 2009) 166
and, one of the most efficient, the VF algorithm (Cordella et al., 1999). Performance is increased in 167
these algorithms by exploiting different join orders, pruning rules and auxiliary information to prune out 168
negative candidate subgraphs as early as possible. We carry out topological matching using a variation 169
of the VF algorithm (Cordella et al., 1999). The VF algorithm is exhaustive and suitable for working 170
with ‘large’ graphs (up to 3×10⁴ vertices) and employs a depth-first strategy implemented in a recursive 171
fashion (Cordella et al., 1999). During a search using the VF algorithm, the search space is minimised via 172
the introduction of topological pruning rules (Cordella et al., 1999). Integrated networks typically surpass 173
the aforementioned ’large’ graphs in size, particularly true within the biological and pharmaceutical 174
settings. As data volumes continue to grow (e.g. omics technologies continue to mature) it is important to 175
develop exhaustive algorithms capable of scaling with the data. 176
Our initial implementation of the VF algorithm showed poor scalability and so, as an enhancement 177
to the VF algorithm, we introduce three steps to improve the efficiency of searching for topological 178
subgraphs. These three steps include: a set of rules used to determine the appropriate vertices at which an 179
instance of the search is started (initial candidate set), as described in (1) below; a topological pruning 180
rule, based on a closed world assumption, as described in (2) below; and a semantic thresholding step 181
(described in the next section of the manuscript). Focussing on the identification of new indications for 182
existing compounds it is vital that mappings of semantic subgraphs, in this work, contain a compound. 183
1. When considering an initial candidate set of nodes from the target graph G at which to initiate 184
4/25
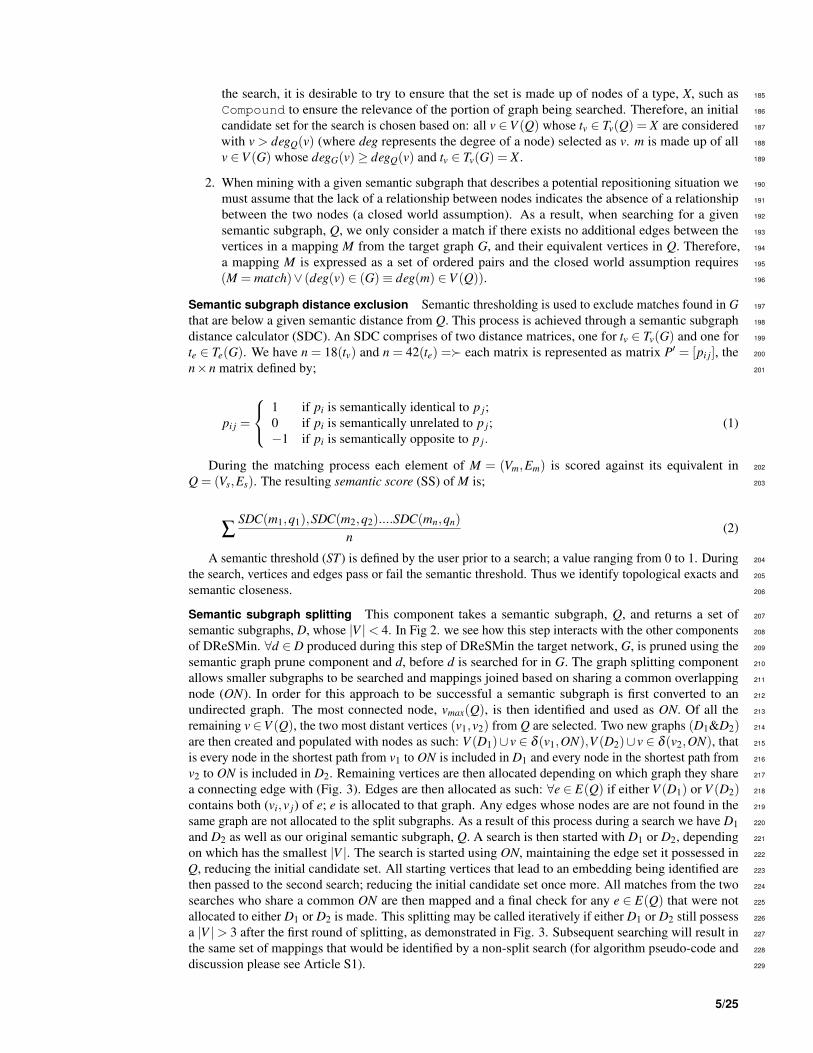
the search, it is desirable to try to ensure that the set is made up of nodes of a type, X, such as 185
Compound to ensure the relevance of the portion of graph being searched. Therefore, an initial 186
candidate set for the search is chosen based on: all v ∈V (Q) whose tv ∈ Tv(Q) = X are considered 187
with v > degQ(v) (where deg represents the degree of a node) selected as v. m is made up of all 188
v ∈V (G) whose degG(v)≥ degQ(v) and tv ∈ Tv(G) = X . 189
2. When mining with a given semantic subgraph that describes a potential repositioning situation we 190
must assume that the lack of a relationship between nodes indicates the absence of a relationship 191
between the two nodes (a closed world assumption). As a result, when searching for a given 192
semantic subgraph, Q, we only consider a match if there exists no additional edges between the 193
vertices in a mapping M from the target graph G, and their equivalent vertices in Q. Therefore, 194
a mapping M is expressed as a set of ordered pairs and the closed world assumption requires 195
(M = match)∨ (deg(v) ∈ (G)≡ deg(m) ∈V (Q)). 196
Semantic subgraph distance exclusion Semantic thresholding is used to exclude matches found in G 197
that are below a given semantic distance from Q. This process is achieved through a semantic subgraph 198
distance calculator (SDC). An SDC comprises of two distance matrices, one for tv ∈ Tv(G) and one for 199
te ∈ Te(G). We have n = 18(tv) and n = 42(te) =≻ each matrix is represented as matrix P′ = [pi j], the 200
n×n matrix defined by; 201
pi j =
1 if pi is semantically identical to p j;
0 if pi is semantically unrelated to p j;
−1 if pi is semantically opposite to p j.
(1)
During the matching process each element of M = (Vm,Em) is scored against its equivalent in 202
Q = (Vs,Es). The resulting semantic score (SS) of M is; 203
∑SDC(m1,q1),SDC(m2,q2)....SDC(mn,qn)
n(2)
A semantic threshold (ST) is defined by the user prior to a search; a value ranging from 0 to 1. During 204
the search, vertices and edges pass or fail the semantic threshold. Thus we identify topological exacts and 205
semantic closeness. 206
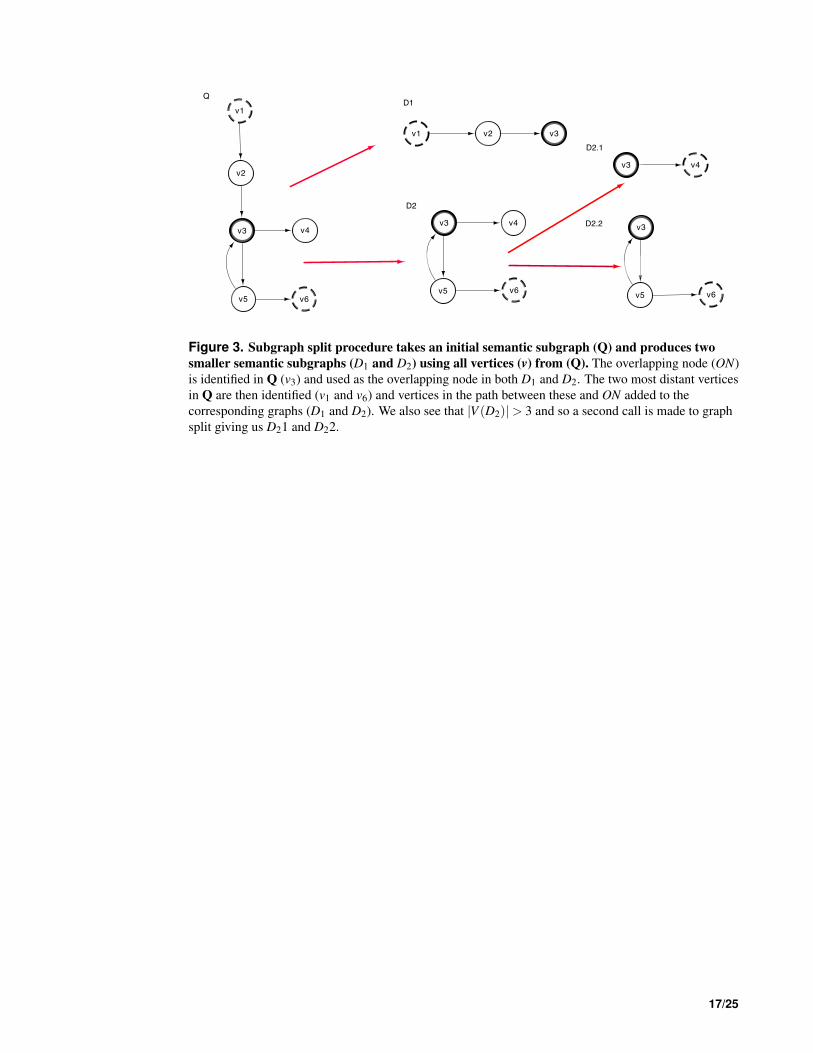
Semantic subgraph splitting This component takes a semantic subgraph, Q, and returns a set of 207
semantic subgraphs, D, whose |V |< 4. In Fig 2. we see how this step interacts with the other components 208
of DReSMin. ∀d ∈ D produced during this step of DReSMin the target network, G, is pruned using the 209
semantic graph prune component and d, before d is searched for in G. The graph splitting component 210
allows smaller subgraphs to be searched and mappings joined based on sharing a common overlapping 211
node (ON). In order for this approach to be successful a semantic subgraph is first converted to an 212
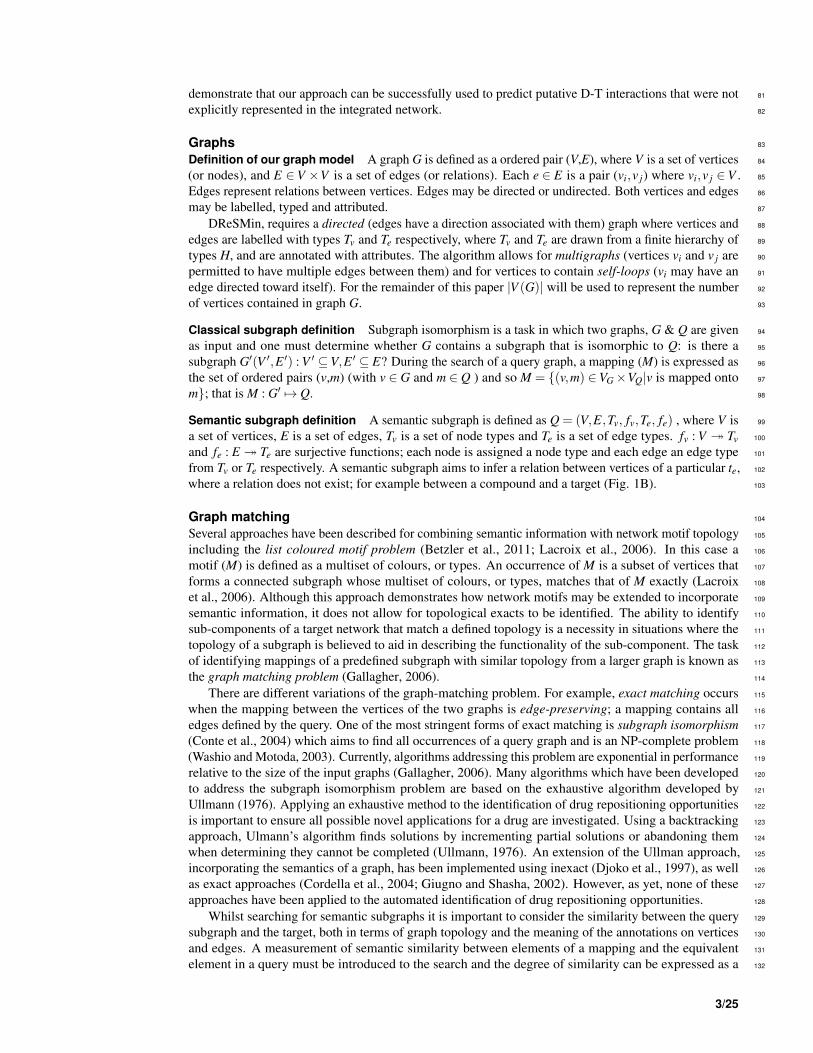
undirected graph. The most connected node, vmax(Q), is then identified and used as ON. Of all the 213
remaining v ∈V (Q), the two most distant vertices (v1,v2) from Q are selected. Two new graphs (D1&D2) 214
are then created and populated with nodes as such: V (D1)∪ v ∈ δ (v1,ON),V (D2)∪ v ∈ δ (v2,ON), that 215
is every node in the shortest path from v1 to ON is included in D1 and every node in the shortest path from 216
v2 to ON is included in D2. Remaining vertices are then allocated depending on which graph they share 217
a connecting edge with (Fig. 3). Edges are then allocated as such: ∀e ∈ E(Q) if either V (D1) or V (D2) 218
contains both (vi,v j) of e; e is allocated to that graph. Any edges whose nodes are are not found in the 219
same graph are not allocated to the split subgraphs. As a result of this process during a search we have D1 220
and D2 as well as our original semantic subgraph, Q. A search is then started with D1 or D2, depending 221
on which has the smallest |V |. The search is started using ON, maintaining the edge set it possessed in 222
Q, reducing the initial candidate set. All starting vertices that lead to an embedding being identified are 223
then passed to the second search; reducing the initial candidate set once more. All matches from the two 224
searches who share a common ON are then mapped and a final check for any e ∈ E(Q) that were not 225
allocated to either D1 or D2 is made. This splitting may be called iteratively if either D1 or D2 still possess 226
a |V |> 3 after the first round of splitting, as demonstrated in Fig. 3. Subsequent searching will result in 227
the same set of mappings that would be identified by a non-split search (for algorithm pseudo-code and 228
discussion please see Article S1). 229
5/25
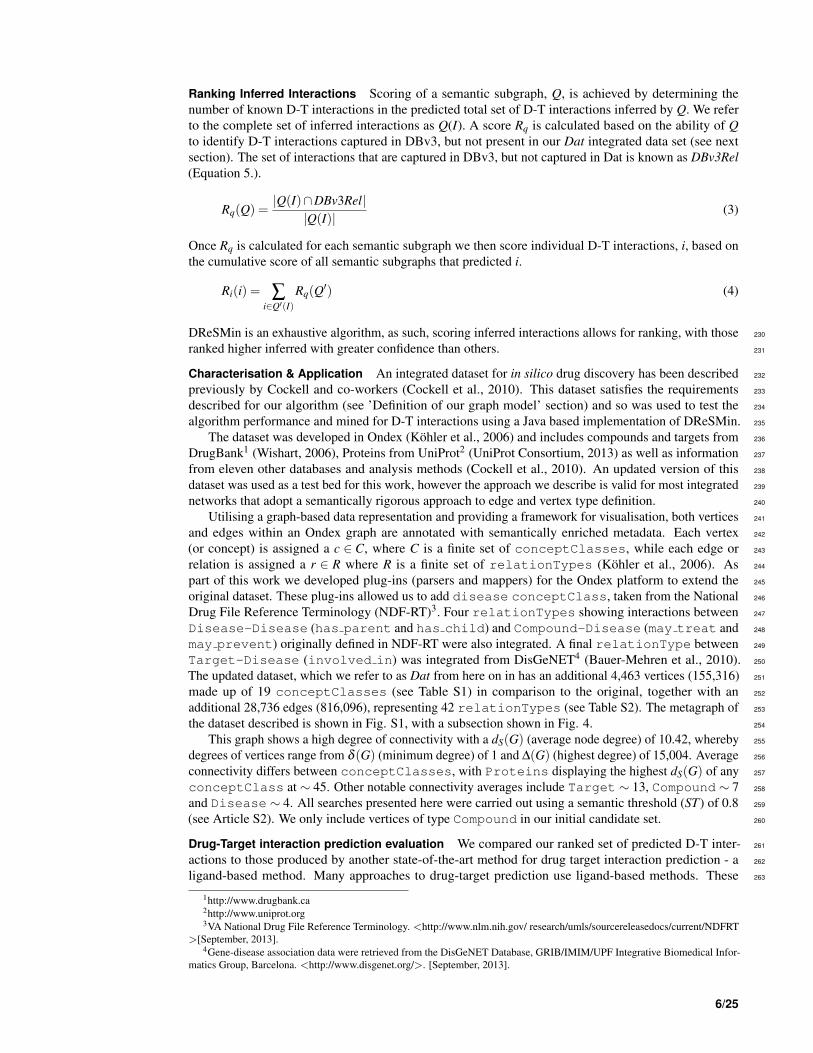
Ranking Inferred Interactions Scoring of a semantic subgraph, Q, is achieved by determining the
number of known D-T interactions in the predicted total set of D-T interactions inferred by Q. We refer
to the complete set of inferred interactions as Q(I). A score Rq is calculated based on the ability of Q
to identify D-T interactions captured in DBv3, but not present in our Dat integrated data set (see next
section). The set of interactions that are captured in DBv3, but not captured in Dat is known as DBv3Rel
(Equation 5.).
Rq(Q) =|Q(I)∩DBv3Rel|
|Q(I)|(3)
Once Rq is calculated for each semantic subgraph we then score individual D-T interactions, i, based on
the cumulative score of all semantic subgraphs that predicted i.
Ri(i) = ∑i∈Q′(I)
Rq(Q′) (4)
DReSMin is an exhaustive algorithm, as such, scoring inferred interactions allows for ranking, with those 230
ranked higher inferred with greater confidence than others. 231
Characterisation & Application An integrated dataset for in silico drug discovery has been described 232
previously by Cockell and co-workers (Cockell et al., 2010). This dataset satisfies the requirements 233
described for our algorithm (see ’Definition of our graph model’ section) and so was used to test the 234
algorithm performance and mined for D-T interactions using a Java based implementation of DReSMin. 235
The dataset was developed in Ondex (Kohler et al., 2006) and includes compounds and targets from 236
DrugBank1 (Wishart, 2006), Proteins from UniProt2 (UniProt Consortium, 2013) as well as information 237
from eleven other databases and analysis methods (Cockell et al., 2010). An updated version of this 238
dataset was used as a test bed for this work, however the approach we describe is valid for most integrated 239
networks that adopt a semantically rigorous approach to edge and vertex type definition. 240
Utilising a graph-based data representation and providing a framework for visualisation, both vertices 241
and edges within an Ondex graph are annotated with semantically enriched metadata. Each vertex 242
(or concept) is assigned a c ∈ C, where C is a finite set of conceptClasses, while each edge or 243
relation is assigned a r ∈ R where R is a finite set of relationTypes (Kohler et al., 2006). As 244
part of this work we developed plug-ins (parsers and mappers) for the Ondex platform to extend the 245
original dataset. These plug-ins allowed us to add disease conceptClass, taken from the National 246
Drug File Reference Terminology (NDF-RT)3. Four relationTypes showing interactions between 247
Disease-Disease (has parent and has child) and Compound-Disease (may treat and 248
may prevent) originally defined in NDF-RT were also integrated. A final relationType between 249
Target-Disease (involved in) was integrated from DisGeNET4 (Bauer-Mehren et al., 2010). 250
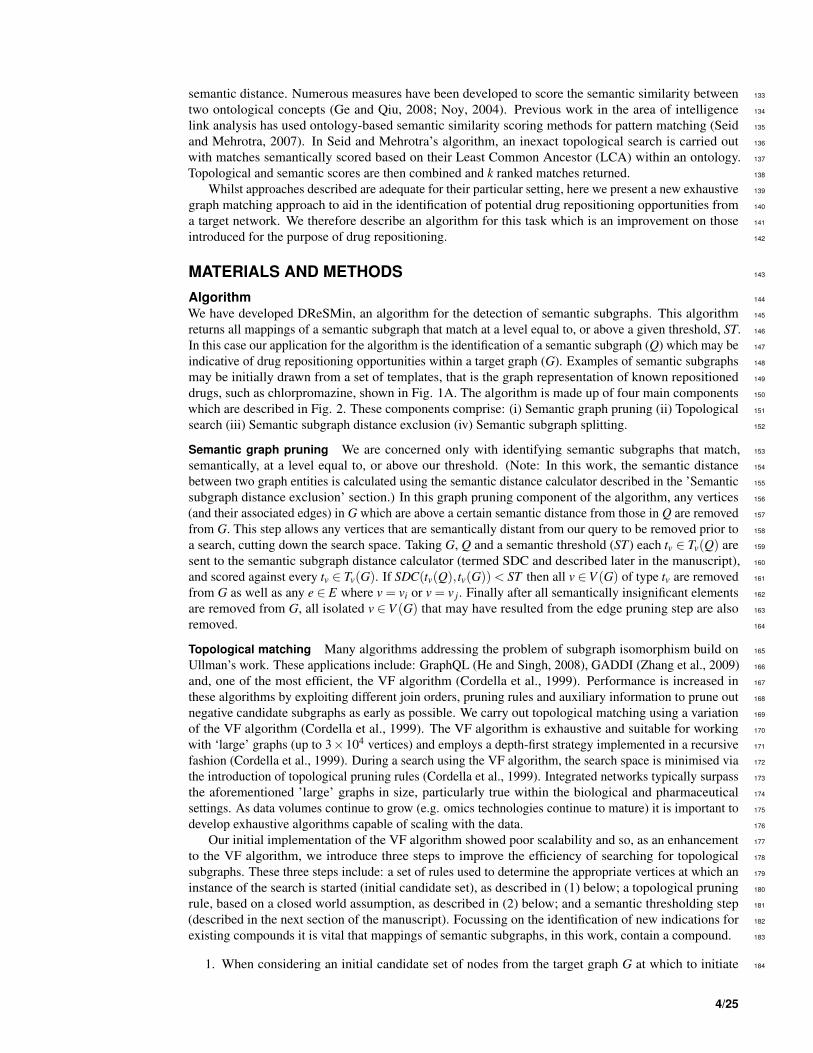
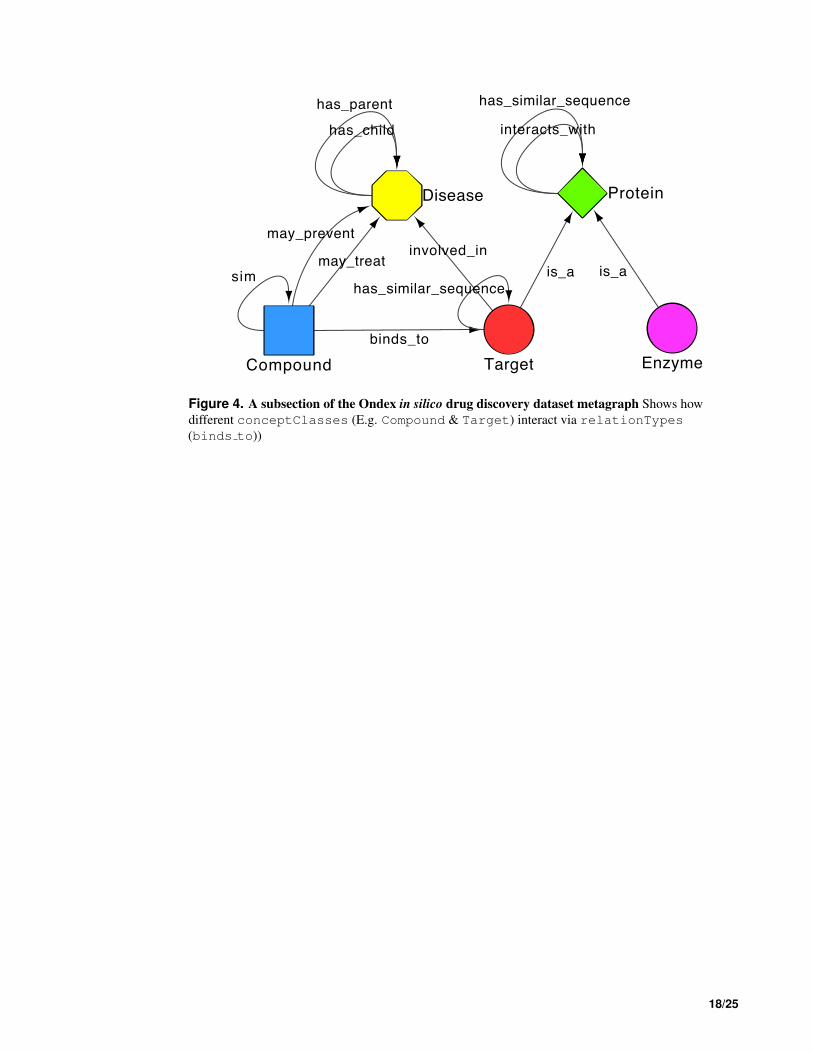
The updated dataset, which we refer to as Dat from here on in has an additional 4,463 vertices (155,316) 251
made up of 19 conceptClasses (see Table S1) in comparison to the original, together with an 252
additional 28,736 edges (816,096), representing 42 relationTypes (see Table S2). The metagraph of 253
the dataset described is shown in Fig. S1, with a subsection shown in Fig. 4. 254
This graph shows a high degree of connectivity with a dS(G) (average node degree) of 10.42, whereby 255
degrees of vertices range from δ (G) (minimum degree) of 1 and ∆(G) (highest degree) of 15,004. Average 256
connectivity differs between conceptClasses, with Proteins displaying the highest dS(G) of any 257
conceptClass at ∼ 45. Other notable connectivity averages include Target ∼ 13, Compound ∼ 7 258
and Disease ∼ 4. All searches presented here were carried out using a semantic threshold (ST) of 0.8 259
(see Article S2). We only include vertices of type Compound in our initial candidate set. 260
Drug-Target interaction prediction evaluation We compared our ranked set of predicted D-T inter- 261
actions to those produced by another state-of-the-art method for drug target interaction prediction - a 262
ligand-based method. Many approaches to drug-target prediction use ligand-based methods. These 263
1http://www.drugbank.ca2http://www.uniprot.org3VA National Drug File Reference Terminology. <http://www.nlm.nih.gov/ research/umls/sourcereleasedocs/current/NDFRT
>[September, 2013].4Gene-disease association data were retrieved from the DisGeNET Database, GRIB/IMIM/UPF Integrative Biomedical Infor-
matics Group, Barcelona. <http://www.disgenet.org/>. [September, 2013].
6/25
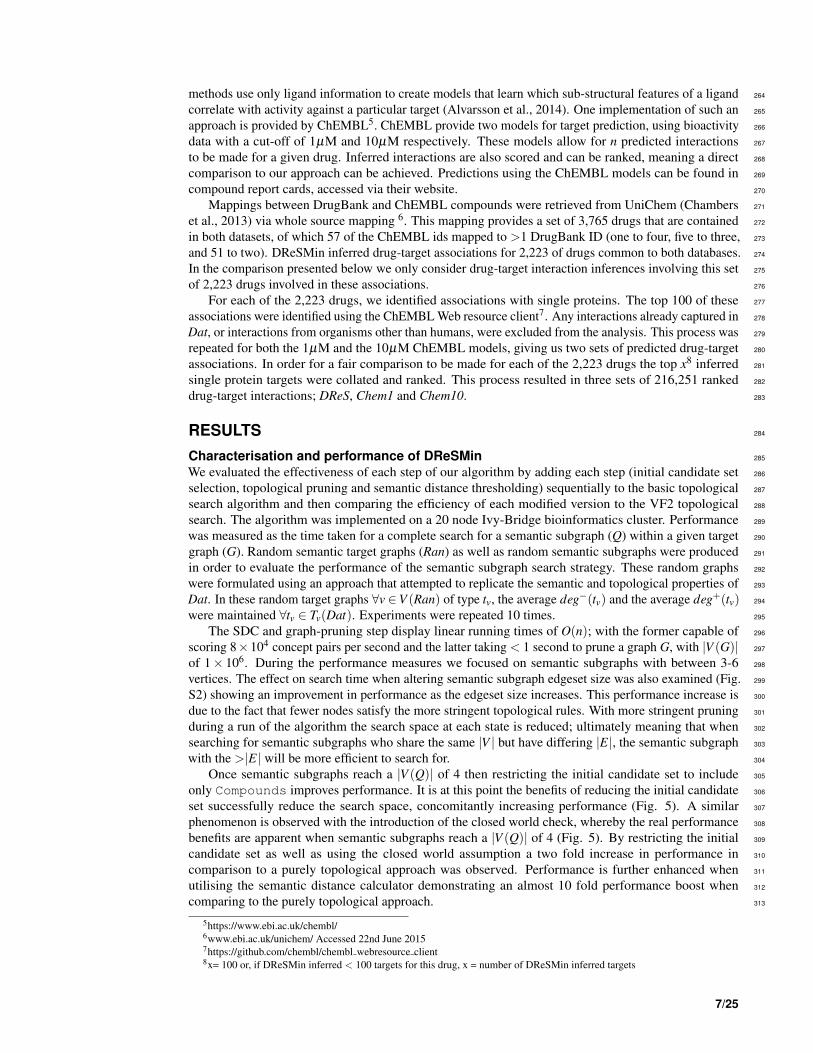
methods use only ligand information to create models that learn which sub-structural features of a ligand 264
correlate with activity against a particular target (Alvarsson et al., 2014). One implementation of such an 265
approach is provided by ChEMBL5. ChEMBL provide two models for target prediction, using bioactivity 266
data with a cut-off of 1µM and 10µM respectively. These models allow for n predicted interactions 267
to be made for a given drug. Inferred interactions are also scored and can be ranked, meaning a direct 268
comparison to our approach can be achieved. Predictions using the ChEMBL models can be found in 269
compound report cards, accessed via their website. 270
Mappings between DrugBank and ChEMBL compounds were retrieved from UniChem (Chambers 271
et al., 2013) via whole source mapping 6. This mapping provides a set of 3,765 drugs that are contained 272
in both datasets, of which 57 of the ChEMBL ids mapped to >1 DrugBank ID (one to four, five to three, 273
and 51 to two). DReSMin inferred drug-target associations for 2,223 of drugs common to both databases. 274
In the comparison presented below we only consider drug-target interaction inferences involving this set 275
of 2,223 drugs involved in these associations. 276
For each of the 2,223 drugs, we identified associations with single proteins. The top 100 of these 277
associations were identified using the ChEMBL Web resource client7. Any interactions already captured in 278
Dat, or interactions from organisms other than humans, were excluded from the analysis. This process was 279
repeated for both the 1µM and the 10µM ChEMBL models, giving us two sets of predicted drug-target 280
associations. In order for a fair comparison to be made for each of the 2,223 drugs the top x8 inferred 281
single protein targets were collated and ranked. This process resulted in three sets of 216,251 ranked 282
drug-target interactions; DReS, Chem1 and Chem10. 283
RESULTS 284
Characterisation and performance of DReSMin 285
We evaluated the effectiveness of each step of our algorithm by adding each step (initial candidate set 286
selection, topological pruning and semantic distance thresholding) sequentially to the basic topological 287
search algorithm and then comparing the efficiency of each modified version to the VF2 topological 288
search. The algorithm was implemented on a 20 node Ivy-Bridge bioinformatics cluster. Performance 289
was measured as the time taken for a complete search for a semantic subgraph (Q) within a given target 290
graph (G). Random semantic target graphs (Ran) as well as random semantic subgraphs were produced 291
in order to evaluate the performance of the semantic subgraph search strategy. These random graphs 292
were formulated using an approach that attempted to replicate the semantic and topological properties of 293
Dat. In these random target graphs ∀v ∈V (Ran) of type tv, the average deg−(tv) and the average deg+(tv) 294
were maintained ∀tv ∈ Tv(Dat). Experiments were repeated 10 times. 295
The SDC and graph-pruning step display linear running times of O(n); with the former capable of 296
scoring 8×10⁴ concept pairs per second and the latter taking < 1 second to prune a graph G, with |V (G)| 297
of 1× 10⁶. During the performance measures we focused on semantic subgraphs with between 3-6 298
vertices. The effect on search time when altering semantic subgraph edgeset size was also examined (Fig. 299
S2) showing an improvement in performance as the edgeset size increases. This performance increase is 300
due to the fact that fewer nodes satisfy the more stringent topological rules. With more stringent pruning 301
during a run of the algorithm the search space at each state is reduced; ultimately meaning that when 302
searching for semantic subgraphs who share the same |V | but have differing |E|, the semantic subgraph 303
with the >|E| will be more efficient to search for. 304
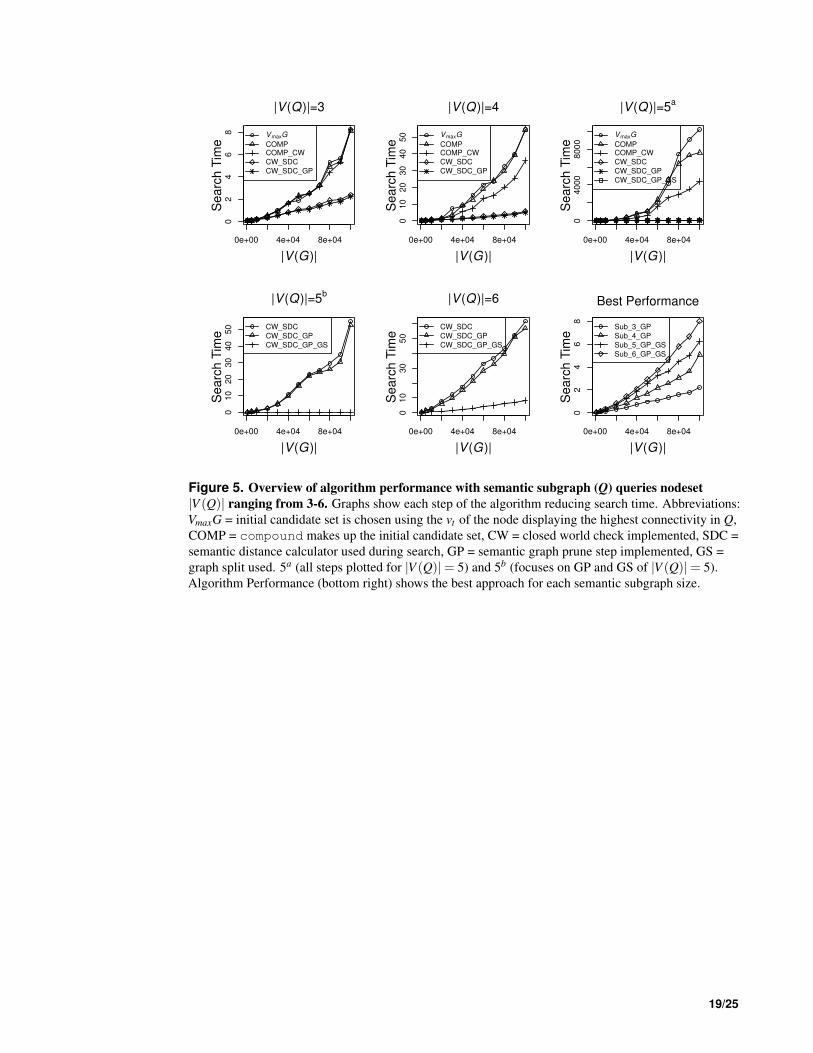
Once semantic subgraphs reach a |V (Q)| of 4 then restricting the initial candidate set to include 305
only Compounds improves performance. It is at this point the benefits of reducing the initial candidate 306
set successfully reduce the search space, concomitantly increasing performance (Fig. 5). A similar 307
phenomenon is observed with the introduction of the closed world check, whereby the real performance 308
benefits are apparent when semantic subgraphs reach a |V (Q)| of 4 (Fig. 5). By restricting the initial 309
candidate set as well as using the closed world assumption a two fold increase in performance in 310
comparison to a purely topological approach was observed. Performance is further enhanced when 311
utilising the semantic distance calculator demonstrating an almost 10 fold performance boost when 312
comparing to the purely topological approach. 313
5https://www.ebi.ac.uk/chembl/6www.ebi.ac.uk/unichem/ Accessed 22nd June 20157https://github.com/chembl/chembl webresource client8x= 100 or, if DReSMin inferred < 100 targets for this drug, x = number of DReSMin inferred targets
7/25
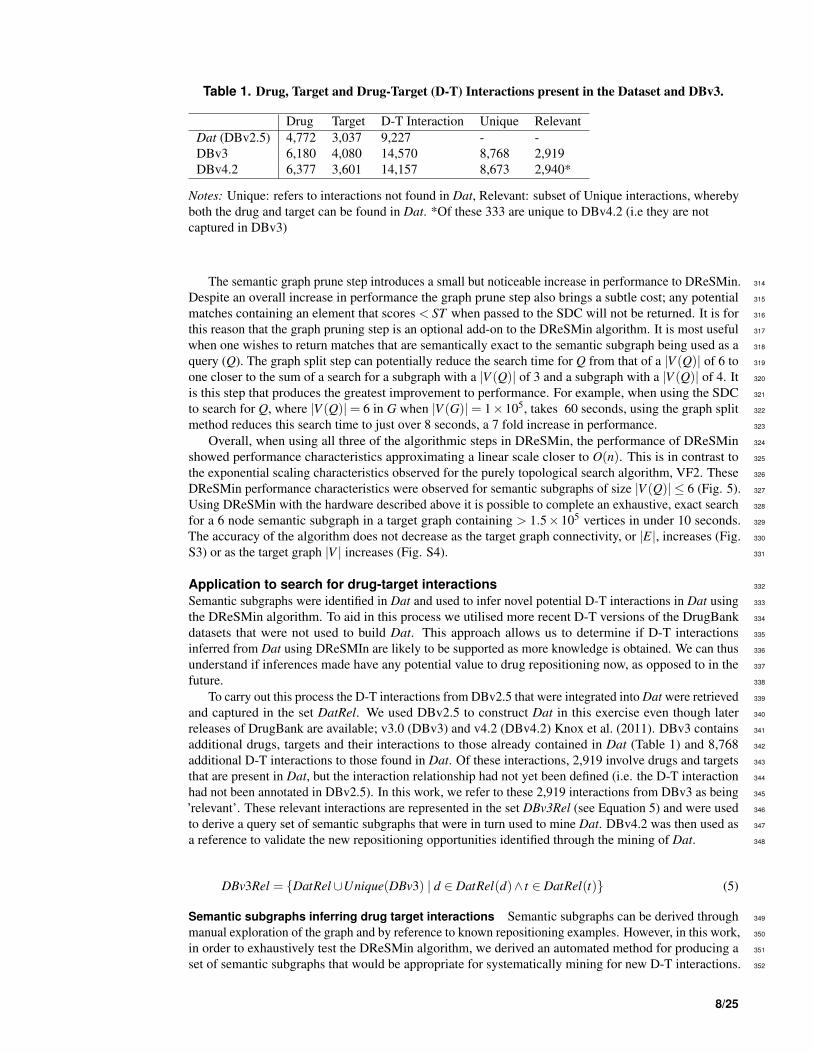
Table 1. Drug, Target and Drug-Target (D-T) Interactions present in the Dataset and DBv3.
Drug Target D-T Interaction Unique Relevant
Dat (DBv2.5) 4,772 3,037 9,227 - -
DBv3 6,180 4,080 14,570 8,768 2,919
DBv4.2 6,377 3,601 14,157 8,673 2,940*
Notes: Unique: refers to interactions not found in Dat, Relevant: subset of Unique interactions, whereby
both the drug and target can be found in Dat. *Of these 333 are unique to DBv4.2 (i.e they are not
captured in DBv3)
The semantic graph prune step introduces a small but noticeable increase in performance to DReSMin. 314
Despite an overall increase in performance the graph prune step also brings a subtle cost; any potential 315
matches containing an element that scores < ST when passed to the SDC will not be returned. It is for 316
this reason that the graph pruning step is an optional add-on to the DReSMin algorithm. It is most useful 317
when one wishes to return matches that are semantically exact to the semantic subgraph being used as a 318
query (Q). The graph split step can potentially reduce the search time for Q from that of a |V (Q)| of 6 to 319
one closer to the sum of a search for a subgraph with a |V (Q)| of 3 and a subgraph with a |V (Q)| of 4. It 320
is this step that produces the greatest improvement to performance. For example, when using the SDC 321
to search for Q, where |V (Q)|= 6 in G when |V (G)|= 1×10⁵, takes 60 seconds, using the graph split 322
method reduces this search time to just over 8 seconds, a 7 fold increase in performance. 323
Overall, when using all three of the algorithmic steps in DReSMin, the performance of DReSMin 324
showed performance characteristics approximating a linear scale closer to O(n). This is in contrast to 325
the exponential scaling characteristics observed for the purely topological search algorithm, VF2. These 326
DReSMin performance characteristics were observed for semantic subgraphs of size |V (Q)| ≤ 6 (Fig. 5). 327
Using DReSMin with the hardware described above it is possible to complete an exhaustive, exact search 328
for a 6 node semantic subgraph in a target graph containing > 1.5×10⁵ vertices in under 10 seconds. 329
The accuracy of the algorithm does not decrease as the target graph connectivity, or |E|, increases (Fig. 330
S3) or as the target graph |V | increases (Fig. S4). 331
Application to search for drug-target interactions 332
Semantic subgraphs were identified in Dat and used to infer novel potential D-T interactions in Dat using 333
the DReSMin algorithm. To aid in this process we utilised more recent D-T versions of the DrugBank 334
datasets that were not used to build Dat. This approach allows us to determine if D-T interactions 335
inferred from Dat using DReSMIn are likely to be supported as more knowledge is obtained. We can thus 336
understand if inferences made have any potential value to drug repositioning now, as opposed to in the 337
future. 338
To carry out this process the D-T interactions from DBv2.5 that were integrated into Dat were retrieved 339
and captured in the set DatRel. We used DBv2.5 to construct Dat in this exercise even though later 340
releases of DrugBank are available; v3.0 (DBv3) and v4.2 (DBv4.2) Knox et al. (2011). DBv3 contains 341
additional drugs, targets and their interactions to those already contained in Dat (Table 1) and 8,768 342
additional D-T interactions to those found in Dat. Of these interactions, 2,919 involve drugs and targets 343
that are present in Dat, but the interaction relationship had not yet been defined (i.e. the D-T interaction 344
had not been annotated in DBv2.5). In this work, we refer to these 2,919 interactions from DBv3 as being 345
’relevant’. These relevant interactions are represented in the set DBv3Rel (see Equation 5) and were used 346
to derive a query set of semantic subgraphs that were in turn used to mine Dat. DBv4.2 was then used as 347
a reference to validate the new repositioning opportunities identified through the mining of Dat. 348
DBv3Rel = {DatRel ∪Unique(DBv3) | d ∈ DatRel(d)∧ t ∈ DatRel(t)} (5)
Semantic subgraphs inferring drug target interactions Semantic subgraphs can be derived through 349
manual exploration of the graph and by reference to known repositioning examples. However, in this work, 350
in order to exhaustively test the DReSMin algorithm, we derived an automated method for producing a 351
set of semantic subgraphs that would be appropriate for systematically mining for new D-T interactions. 352
8/25
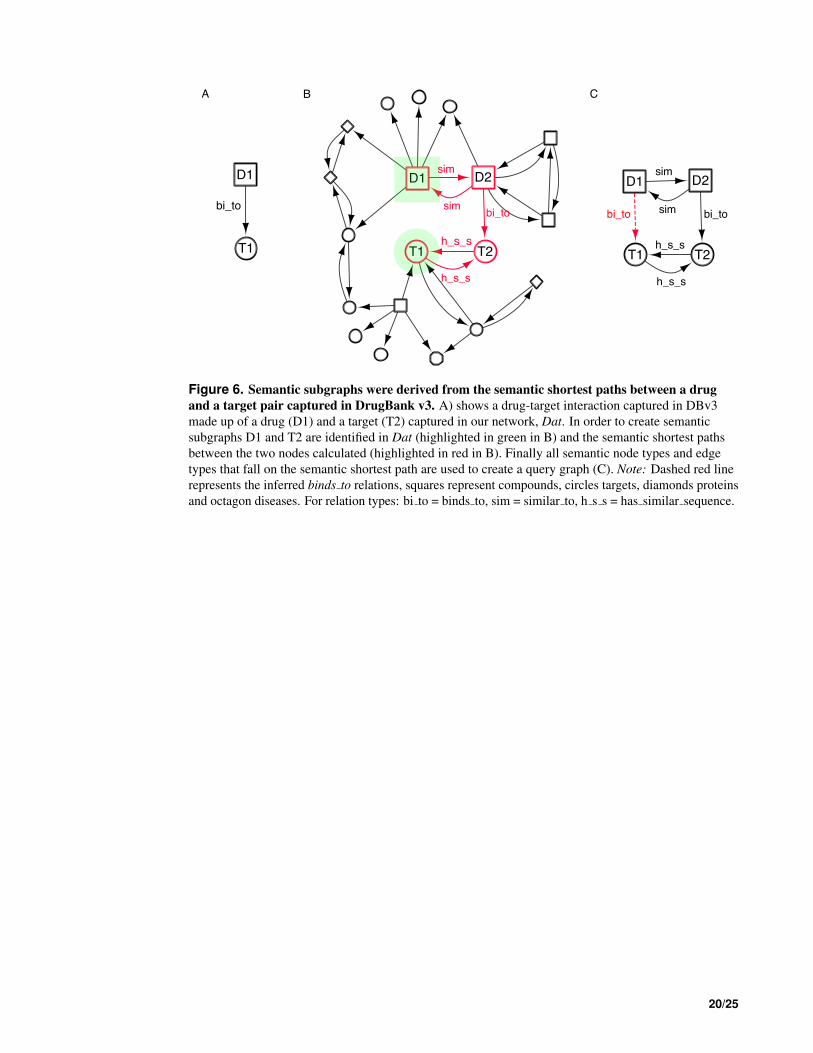
In order to produce such a set, we extracted the portions of the network in Dat that contained drugs and 353
targets from the 2,919 D-T interactions whose interaction was annotated later in DBv3Rel. To extract 354
the subnetworks, each drug and target pair was identified in Dat and the subnetwork represented by 355
the shortest path between them was extracted as a semantic subgraph (Fig. 6). To identify the shortest 356
semantic subpaths, Dat was converted to an undirected graph and a Java implementation of Dijkstra’s 357
shortest path algorithm Dijkstra (1959), from the JGraphT 9 library used. On carrying out this semantic 358
subgraph identification exercise 194 different subgraphs with a |V | <10 were found to cumulatively 359
identify more than 95% of the D-T interactions in DBv3Rel and were used as a reference set for D-T 360
inference using DReSMin as described below. 361
Inference of novel drug-target interactions The 194 semantic subgraphs were used as queries to 362
search Dat using DReSMin to test the ability of the algorithm to identify D-T interactions in Dat that had 363
not yet been annotated in DBv2.5 (but are present in DBv3). DReSMin was used to identify subgraphs 364
in Dat that were similar to the query set of semantic subgraphs and therefore with the potential to 365
be indicative of novel D-T interactions and ultimately aid in the identification of drug repositioning 366
opportunities. After an exhaustive search of Dat with the 194 semantic subgraphs a set of mappings (or 367
instances) of each subgraph was identified. Semantic subgraphs were scored on their ability to identify 368
D-T interactions captured in DBv3Rel (using Equation 3), with these scores ranging from 0.0 to 0.06589 369
(Table S4). A single D-T interaction can be inferred by mappings of more than one query semantic 370
subgraph, thus adding confidence to the prediction that a D-T interaction exists. Therefore, in order to 371
rank the D-T interactions in terms of confidence, the scores assigned by all query semantic subgraphs that 372
produced a mapping containing a potential D-T interaction were summed (using Equation 4). The ∑Rq 373
of the scores of all 194 query semantic subgraphs was 0.9499 (Fig. S5) and so inferred D-T interaction 374
scores contained within mappings could potentially, range from 0.0 to 0.9459. The top ten performing 375
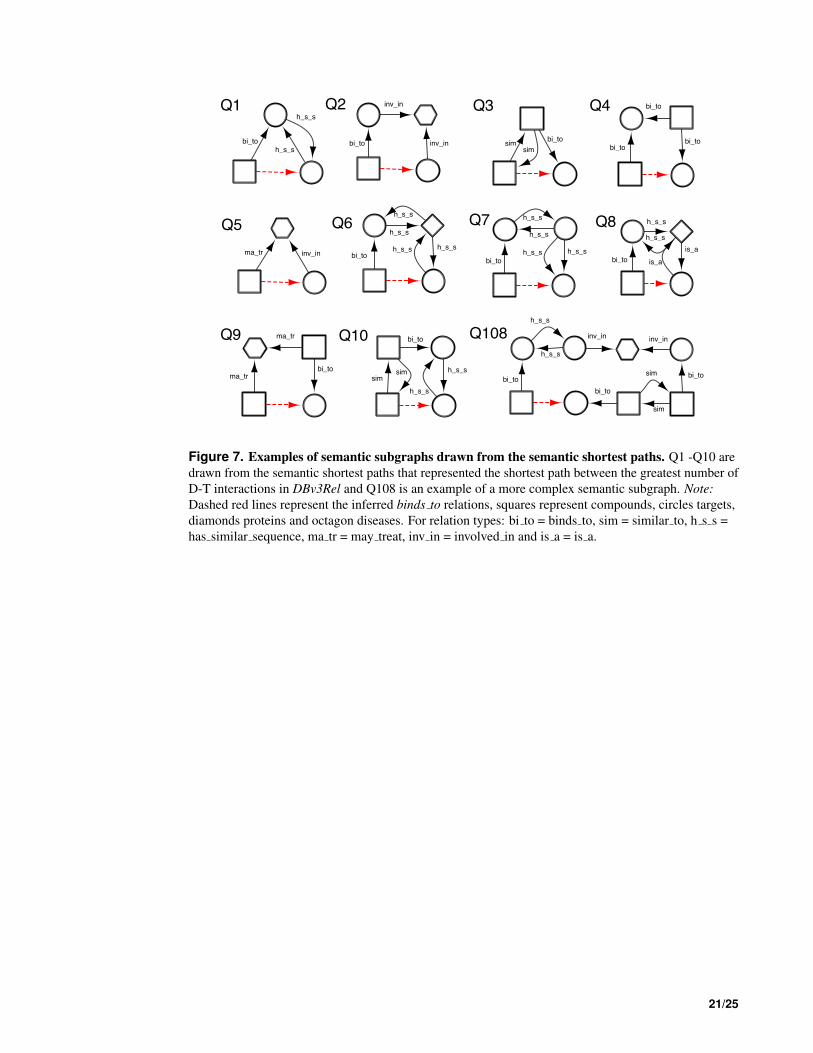
subgraphs, and a larger illustrative subgraph, are shown in Fig. 7. 376
A search of Dat with the set of 194 semantic subgraphs described above resulted in 906,152,721 377
mappings. These mappings now captured the potential drug target interactions in the structure of the 378
mapping subgraph. The 906,152,721 mappings predicted 9,643,061 D-T interactions that were ranked 379
as described above. Unsurprisingly, we identify the interactions from DBv3Rel that were used to create 380
the semantic subgraphs. Importantly, however, these interactions score highly, which indicates that a 381
single interaction was identified by multiple semantic subgraphs. The D-T interactions from DBv3Rel 382
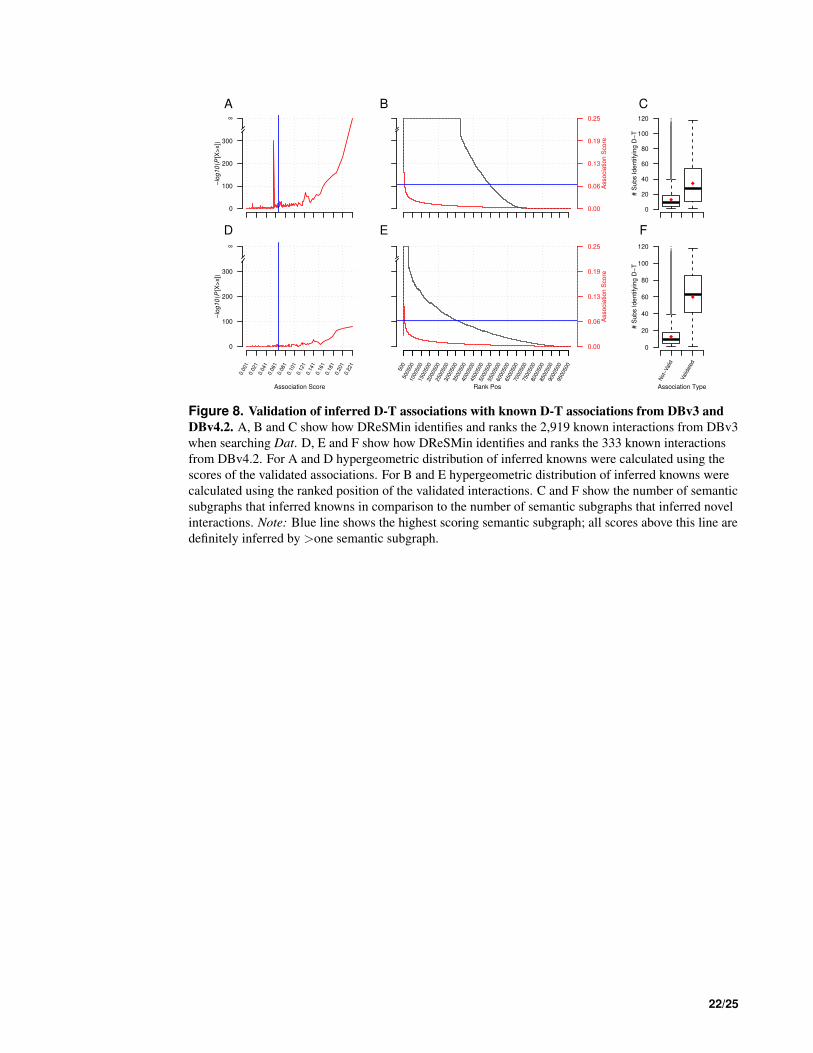
consistently scored better and ranked higher than the unsupported inferred associations (Fig. 8A and 383
Fig. 8B). We also observe that the D-T interactions subsequently annotated and captured in DBv3Rel are 384
identified by two fold the number that infer D-T associations not annotated and present in DBv3Rel (Fig. 385
8C). 386
However, in order to quantify the predictive power of DReSMin we examined how many of the high 387
scoring D-T predictions were subsequently annotated in DBv4.2. DBv4.2 contains 333 interactions not 388
captured in DBv3 or Dat. In this work, these interactions are represented in the set DBv4Rel (see Equation 389
6). These 333 new interactions had not been used to construct the semantic subgraphs used for searching 390
Dat. Of the 333 D-T interactions captured in DBv4Rel, 309 were successfully identified (94%). We also 391
observed high ranking and scoring of 309 D-T interactions from DBv4Rel that were successfully identified 392
by DReSMin (Fig. 8D and Fig. 8E). The average number of semantic subgraphs that have mappings 393
inferring the 309 annotated D-T associations captured in DBv4Rel is increased >4 fold in comparison to 394
the number of semantic subgraphs that produce mappings that infer interactions not captured in DBv4Rel 395
(Fig. 8F). 396
DBv4Rel = {(DatRel ∪Unique(DBv4.2))∩DBv3Rel | d ∈ DatRel(d)∧ t ∈ DatRel(t)} (6)
Looking in more detail at the top 20 inferred D-T interactions (Table 2) we see 12 different drugs and 397
eight targets. Drugs include: three antiarrythmic calcium channel blockers (Verapamil, Mibefradil and 398
Bepridil); three phenothiazine antipsychotic agents (Promazine, Perphenazine and Thioridazine); three 399
atypical antipyschotic agents (Propiomazine, Clozapine and Quetiapine); two anticonvulsants (Zonisamide 400
and Levetiracetam) and one antiarrythmic adrenergic beta-antagonist (Propranolol). Of the 12 drugs 401
captured in the top ranked inferred D-T interactions, the average number of D-T interactions captured in 402
9 http://jgrapht.org
9/25
Dat is ˜13, with the average number for all compounds being closer to three. The compounds present 403
in the top 20 inferred D-T interactions are well studied and annotated and are thus highly connected 404
in Dat. Targets include four voltage-dependant calcium channels (VDCC) and four G-Protein coupled 405
receptors (GPCR). VDCCs display selective permeability to calcium ions which enter a cell, and alter 406
a channel’s properties, through the pore which is formed by the a 1 subunit. We can see that three 407
sub-types of VDCC are represented in Table 2, being: L-type (CAC1C and CAC1D); P/Q Type (CAC1A) 408
and N-type (CAC1B). Members of the GPCR superfamily in Table 2 include receptors activated by the 409
neurotransmitters: serotonin (5HT7R and 5HT2B); epinephrine (ADA1A) and dopamine (DRD1). 410
The ability of DReSMin to predict novel D-T interactions was compared to the state-of-the-art ligand- 411
based method from ChEMBL. We first examined how many D-T interactions were predicted by both 412
methods (co-prediction) using interactions captured in the sets DReS, Chem1 and Chem10. Unsurprisingly, 413
due to the fact that the methods use different approaches, only 10% of the top x D-T interactions inferred 414
by DReSMin are found in the top x D-T interactions predicted by ChEMBL models (Fig.9A and Fig.9B). 415
More interestingly is the fact that DReSMin successfully infers >20 % more of the knowns from DBv4Rel 416
than ChEMBL, for both models (Fig.9C and Fig.9F). We found that DReSMin is able to rank the known 417
D-T interactions more effectively than ChEMBL, with a mean ranking position of known D-T interactions 418
from DBv4rel of ˜25,000, as opposed to the 50,000 achieved by ChEMBL. We must recognise the fact 419
that the semantic subgraphs used during this work were derived using DrugBank data and the ChEMBL 420
models trained on ChEMBL data. 421
Completing the drug-target-disease pathway The highest ranked D-T interaction identified by DReSMin,422
receiving a score of 0.49211, is supported by the literature and therefore known to the scientific commu- 423
nity. This D-T interaction is between one of the antiarrythmic calcium blockers, Verapamil, and CAC1C. 424
Within Dat eight indications are associated to Veparamil and 12 diseases associated to CAC1C. One 425
indication, hypertension, shares a has Indication association with Verapamil and a involved in association 426
with CAC1C. Although Verapamil is already used to treat hypertension, and the inferred D-T interaction 427
already known, we see how DReSMin may be used to help understand the molecular mechanism of a 428
drug and thus complete the ’drug-target-disease’ pathway. Understanding the molecular mechanisms 429
of drugs can only aide the identification of repositioning opportunities. In Fig. 10 we see examples of 430
unsupported, and therefore novel, DReSMin inferred D-T interactions that also increase understanding of 431
the molecular mechanisms involved in a drugs ability to treat a disease. Like Verapamil, Bepridil is also a 432
calcium channel blocker with known antiarrhythmia activities. Used as a treatment of hypertension, we 433
can see in Table 2 an inferred D-T association involving Bepridil and CAC1C. Bepridil is one of the two 434
drugs from Table 2 that have been withdrawn from the market due to safety concerns. For this reason it 435
is not a strong candidate to be repositioned, however, via the inferred association we are able to better 436
understand the molecular mechanism of the drugs ability to treat hypertension (Fig. 10A). 437
In Dat we see three indications for Quetiapine (Psychotic Disorders, Bipolar Disorders and Autistic 438
Disorders) and three involved in associations involving 5HT7R (Schizophrenia, Pain and Muscular 439
Diseases). Although not captured in Dat, Quetiapine is approved for the treatment of Schizophrenia. By 440
integrating this knowledge with Dat and our inferred associations we can complete another drug-target- 441
disease pathway (Fig.10C). Although Schizophrenia, along with many other diseases, is classified as a 442
psychotic disorder, we see how inferred knowledge can enable better understanding of drug-target-disease 443
pathways in more specific, as opposed to broader, disease areas. 444
Propranolol One inferred D-T interaction in Table 2 involves the antiarrythmic adrenergic beta- 445
antagonist, Propranolol, and the G protein-coupled receptor DRD1. In Dat we capture 12 indications 446
for Propranolol and 17 disease associations for DRD1, with one indication, Hypertension, in both (Fig. 447
11). Of the remaining 16 involved in associations involving DRD1 three of the diseases represent known 448
off-label indications for Propranolol being: Bipolar disorders; Schizophrenia, Alcoholism and as a 449
non-stimulant treatment for ADHD Gobbo and Louza (2014). The remaining 12 diseases present and 450
support some interesting repositioning opportunities/studies of potential repositioning opportunities for 451
Propranolol. 452
Looking at potential indications of Propranolol that are currently being investigated by the scientific 453
community we see three that are supported by our work. Dat contains an association between DRD1 and 454
cocaine related disorders, with multiple clinical trials being undertaken to analyse the use of Propranolol 455
as a treatment for cocaine addiction NIDA (2010) as well as cocaine cravings of South Carolina (2015). 456
10/25
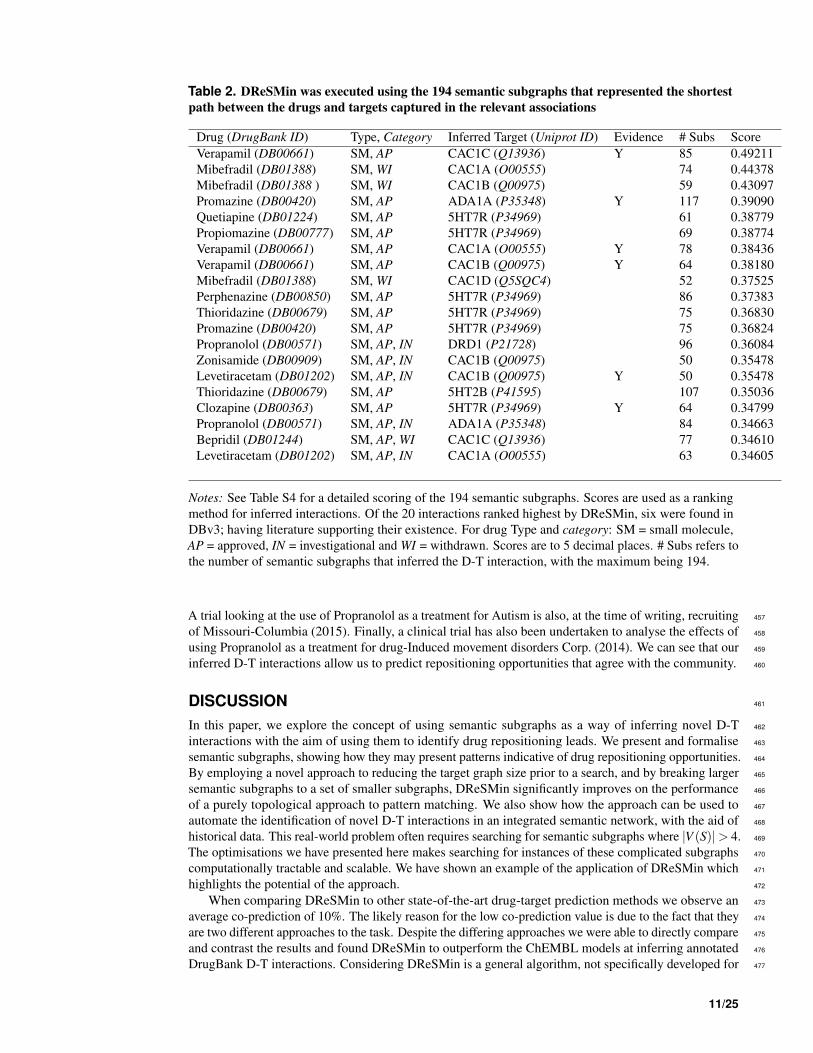
Table 2. DReSMin was executed using the 194 semantic subgraphs that represented the shortest
path between the drugs and targets captured in the relevant associations
Drug (DrugBank ID) Type, Category Inferred Target (Uniprot ID) Evidence # Subs Score
Verapamil (DB00661) SM, AP CAC1C (Q13936) Y 85 0.49211
Mibefradil (DB01388) SM, WI CAC1A (O00555) 74 0.44378
Mibefradil (DB01388 ) SM, WI CAC1B (Q00975) 59 0.43097
Promazine (DB00420) SM, AP ADA1A (P35348) Y 117 0.39090
Quetiapine (DB01224) SM, AP 5HT7R (P34969) 61 0.38779
Propiomazine (DB00777) SM, AP 5HT7R (P34969) 69 0.38774
Verapamil (DB00661) SM, AP CAC1A (O00555) Y 78 0.38436
Verapamil (DB00661) SM, AP CAC1B (Q00975) Y 64 0.38180
Mibefradil (DB01388) SM, WI CAC1D (Q5SQC4) 52 0.37525
Perphenazine (DB00850) SM, AP 5HT7R (P34969) 86 0.37383
Thioridazine (DB00679) SM, AP 5HT7R (P34969) 75 0.36830
Promazine (DB00420) SM, AP 5HT7R (P34969) 75 0.36824
Propranolol (DB00571) SM, AP, IN DRD1 (P21728) 96 0.36084
Zonisamide (DB00909) SM, AP, IN CAC1B (Q00975) 50 0.35478
Levetiracetam (DB01202) SM, AP, IN CAC1B (Q00975) Y 50 0.35478
Thioridazine (DB00679) SM, AP 5HT2B (P41595) 107 0.35036
Clozapine (DB00363) SM, AP 5HT7R (P34969) Y 64 0.34799
Propranolol (DB00571) SM, AP, IN ADA1A (P35348) 84 0.34663
Bepridil (DB01244) SM, AP, WI CAC1C (Q13936) 77 0.34610
Levetiracetam (DB01202) SM, AP, IN CAC1A (O00555) 63 0.34605
Notes: See Table S4 for a detailed scoring of the 194 semantic subgraphs. Scores are used as a ranking
method for inferred interactions. Of the 20 interactions ranked highest by DReSMin, six were found in
DBv3; having literature supporting their existence. For drug Type and category: SM = small molecule,
AP = approved, IN = investigational and WI = withdrawn. Scores are to 5 decimal places. # Subs refers to
the number of semantic subgraphs that inferred the D-T interaction, with the maximum being 194.
A trial looking at the use of Propranolol as a treatment for Autism is also, at the time of writing, recruiting 457
of Missouri-Columbia (2015). Finally, a clinical trial has also been undertaken to analyse the effects of 458
using Propranolol as a treatment for drug-Induced movement disorders Corp. (2014). We can see that our 459
inferred D-T interactions allow us to predict repositioning opportunities that agree with the community. 460
DISCUSSION 461
In this paper, we explore the concept of using semantic subgraphs as a way of inferring novel D-T 462
interactions with the aim of using them to identify drug repositioning leads. We present and formalise 463
semantic subgraphs, showing how they may present patterns indicative of drug repositioning opportunities. 464
By employing a novel approach to reducing the target graph size prior to a search, and by breaking larger 465
semantic subgraphs to a set of smaller subgraphs, DReSMin significantly improves on the performance 466
of a purely topological approach to pattern matching. We also show how the approach can be used to 467
automate the identification of novel D-T interactions in an integrated semantic network, with the aid of 468
historical data. This real-world problem often requires searching for semantic subgraphs where |V (S)|> 4. 469
The optimisations we have presented here makes searching for instances of these complicated subgraphs 470
computationally tractable and scalable. We have shown an example of the application of DReSMin which 471
highlights the potential of the approach. 472
When comparing DReSMin to other state-of-the-art drug-target prediction methods we observe an 473
average co-prediction of 10%. The likely reason for the low co-prediction value is due to the fact that they 474
are two different approaches to the task. Despite the differing approaches we were able to directly compare 475
and contrast the results and found DReSMin to outperform the ChEMBL models at inferring annotated 476
DrugBank D-T interactions. Considering DReSMin is a general algorithm, not specifically developed for 477
11/25
the inference of D-T interactions, this highlights it’s potential. Although the semantic subgraphs used 478
to search Dat were derived from the shortest paths between a drug and target from D-T interactions in 479
DBv3, these interactions were inferred, on average, by around 40 different semantic subgraphs. This is in 480
contrast to the 15 semantic subgraphs that inferred D-T interactions not captured in DBv3. Again this 481
validates the approach we employed during this work. Annotated D-T interactions were not only captured 482
by the semantic subgraph derived from the semantic shortest path between their drug and target but also 483
by many more. 484
Although DReSMin at present scores semantics based purely on the most abstract form of types, it 485
could be beneficial to include scoring metrics based on node and edge attributes, and the data-sources 486
from which they are retrieved. For example, during the process of data integration it would be useful to 487
consider dataset quality during the construction of the integrated graph and apply annotations that indicate 488
a measure of confidence in a given interaction. To this end we are currently developing a new integrated 489
dataset that will allow provenance and data to reliability to be scored during a search. This modification 490
will allow the scoring of semantic subgraphs to be not only topological and semantic but also based on 491
the reliability of the source of each element. 492
In the approach described here semantic subgraphs are derived from only the node types and edge 493
types that fall directly on the semantic shortest path between a drug and a target. In order for a semantic 494
subgraph capture even more functional detail it may be beneficial to expand the view that the subgraph 495
takes of its immediate neighbourhood. To this regard we are currently considering extending semantic 496
subgraphs to include nodes that interact with those in the semantic shortest path at a particular depth. 497
Although we present an exhaustive automated approach it is also worth noting that semantic subgraphs 498
can be drawn from real life repositioning examples via manual curation. Manually developing semantic 499
subgraphs is time consuming, however they may allow for more the creation of more accurate represen- 500
tations of a functional module representative of a drug repositioning opportunity. We hope to create a 501
library of semantic subgraphs curated from real world examples of repositioned drugs and compare the 502
accuracy and efficiency to the semantic subgraphs developed during this work. 503
With regard to the mining algorithm, as new graph mining frameworks emerge with efficient graph 504
searching algorithms (e.g. Neo4J), it may be possible to exploit these built in algorithms to implement 505
sections of the approach we describe here. However, necessarily, the nature of these implementations will 506
depend on the specific graph database. 507
We have demonstrated that our algorithm may be used to infer D-T interactions, however, like all 508
in silico approaches to analysing in vivo and in vitro systems the accuracy is limited; overly simplified 509
settings innately struggle to reflect real-life problems. Our approach, unlike many other computational 510
approaches to drug repositioning, is not limited to the inference of D-T interactions. Semantic subgraphs 511
may be designed to infer relations between any conceptClasses in a dataset and can be used to infer 512
a drugs indication, mode of action, side effect and more. We believe that the systems biology approach 513
that we describe here will allow for a more accurate, holistic, systematic approach to drug repositioning. 514
SUPPLEMENTAL INFORMATION 515
Uploaded separately. 516
ADDITIONAL INFORMATION AND DECLARATIONS 517
Dr. Hannah Tipney and Peter Woollard are employed by GlaxoSmithKline. 518
ACKNOWLEDGEMENTS 519
We would like to thank Dr Philipe Sanseau of GlaxoSmithKline Research & Development Ltd for his 520
guidance during this project. We also extend our gratitude to the ICOS Writing Group and acknowledge 521
Bioinformatics Support Unit, both of Newcastle University for their discussions and manuscript input. 522
REFERENCES 523
Alvarsson, J., Eklund, M., Engkvist, O., Spjuth, O., Carlsson, L., Wikberg, J. E. S., and Noeske, T. 524
(2014). Ligand-based target prediction with signature fingerprints. Journal of chemical information 525
and modeling, 54(10):2647–2653. 526
12/25
Bauer-Mehren, A., Rautschka, M., Sanz, F., and Furlong, L. I. (2010). DisGeNET: a cytoscape plugin to 527
visualize, integrate, search and analyze gene-disease networks. Bioinformatics, 26(22):2924–2926. 528
Betzler, N., van Bevern, R., Fellows, M. R., Komusiewicz, C., and Niedermeier, R. (2011). Parameter- 529
ized algorithmics for finding connected motifs in biological networks. IEEE/ACM transactions on 530
computational biology and bioinformatics / IEEE, ACM, 8(5):1296–1308. PMID: 21282862. 531
Chambers, J., Davies, M., Gaulton, A., Hersey, A., Velankar, S., Petryszak, R., Hastings, J., Bellis, L., 532
McGlinchey, S., and Overington, J. P. (2013). Unichem: a unified chemical structure cross-referencing 533
and identifier tracking system. Journal of cheminformatics, 5(1):3. 534
Chen, B., Ding, Y., and Wild, D. J. (2012). Assessing drug target association using semantic linked data. 535
PLoS computational biology, 8(7):e1002574. 536
Cockell, S. J., Weile, J., Lord, P., Wipat, C., Andriychenko, D., Pocock, M., Wilkinson, D., Young, 537
M., and Wipat, A. (2010). An integrated dataset for in silico drug discovery. Journal of integrative 538
bioinformatics, 7(3). PMID: 20375448. 539
Conte, D., Foggia, P., Sansone, C., and Vento, M. (2004). Thirty Years Of Graph Matching In Pattern 540
Recognition. International Journal of Pattern Recognition and Artificial Intelligence. 541
Cordella, L., Foggia, P., Sansone, C., and Vento, M. (1999). Performance evaluation of the VF graph 542
matching algorithm. Proceeding ICIAP 99 Proceedings of the 10th International Conference on Image 543
Analysis and Processing, page 1172. 544
Cordella, L., Foggia, P., Sansone, C., and Vento, M. (2004). A (sub)graph isomorphism algorithm for 545
matching large graphs. IEEE Transactions on Pattern Analysis and Machine Intelligence, 26(10):1367– 546
1372. 547
Corp., M. S. . D. (2014). Study of Preladenant for the Treatment of Neuroleptic Induced Akathisia. In: 548
ClinicalTrials.gov [Internet]. Bethesda (MD): National Library of Medicine (US). 2000- [cited 2015 Apr 549
27]. Available from: https://clinicaltrials.gov/ct2/show/NCT00693472 NLM Identifier: NCT00693472. 550
Dijkstra, E. W. (1959). A note on two problems in connexion with graphs. Numerische Mathematik, 551
1(1):269–271. 552
Djoko, S., Cook, D., and Holder, L. (1997). An empirical study of domain knowledge and its benefits to 553
substructure discovery. IEEE Transactions on Knowledge and Data Engineering, 9(4):575–586. 554
Gallagher, B. (2006). Matching structure and semantics: A survey on graph-based pattern matching. 555
AAAI FS. 556
Ge, J. and Qiu, Y. (2008). Concept similarity matching based on semantic distance. pages 380–383. IEEE. 557
Giugno, R. and Shasha, D. (2002). GraphGrep: A fast and universal method for querying graphs. In 558
Pattern Recognition, 2002. Proceedings. 16th International Conference on, volume 2, pages 112–115 559
vol.2. 560
Gobbo, M. A. and Louza, M. R. (2014). Influence of stimulant and non-stimulant drug treatment on driving 561
performance in patients with attention deficit hyperactivity disorder: a systematic review. European 562
neuropsychopharmacology : the journal of the European College of Neuropsychopharmacology, 563
24(9):1425–1443. 564
He, B., Tang, J., Ding, Y., Wang, H., Sun, Y., Shin, J. H., Chen, B., Moorthy, G., Qiu, J., Desai, P., and 565
Wild, D. J. (2011). Mining Relational Paths in Integrated Biomedical Data. PLoS ONE, 6(12):e27506+. 566
He, H. and Singh, A. K. (2008). Graphs-at-a-time. page 405. ACM Press. 567
Keiser, M. J., Setola, V., Irwin, J. J., Laggner, C., Abbas, A. I., Hufeisen, S. J., Jensen, N. H., Kuijer, 568
M. B., Matos, R. C., Tran, T. B., Whaley, R., Glennon, R. A., Hert, J., Thomas, K. L. H., Edwards, 569
D. D., Shoichet, B. K., and Roth, B. L. (2009). Predicting new molecular targets for known drugs. 570
Nature, 462(7270):175–181. 571
Knox, C., Law, V., Jewison, T., Liu, P., Ly, S., Frolkis, A., Pon, A., Banco, K., Mak, C., Neveu, V., 572
Djoumbou, Y., Eisner, R., Guo, A. C., and Wishart, D. S. (2011). DrugBank 3.0: a comprehensive 573
resource for ’omics’ research on drugs. Nucleic acids research, 39(Database issue):D1035–1041. 574
PMID: 21059682. 575
Kohler, J., Baumbach, J., Taubert, J., Specht, M., Skusa, A., Ruegg, A., Rawlings, C., Verrier, P., and 576
Philippi, S. (2006). Graph-based analysis and visualization of experimental results with ONDEX. 577
Bioinformatics (Oxford, England), 22(11):1383–1390. PMID: 16533819. 578
Lacroix, V., Fernandes, C. G., and Sagot, M.-F. (2006). Motif search in graphs: application to metabolic 579
networks. IEEE/ACM transactions on computational biology and bioinformatics / IEEE, ACM, 3(4):360– 580
368. PMID: 17085845. 581
13/25
Lamb, J., Crawford, E. D., Peck, D., Modell, J. W., Blat, I. C., Wrobel, M. J., Lerner, J., Brunet, J.-P., 582
Subramanian, A., Ross, K. N., Reich, M., Hieronymus, H., Wei, G., Armstrong, S. A., Haggarty, S. J., 583
Clemons, P. A., Wei, R., Carr, S. A., Lander, E. S., and Golub, T. R. (2006). The connectivity map: 584
using gene-expression signatures to connect small molecules, genes, and disease. Science (New York, 585
N.Y.), 313(5795):1929–1935. 586
Mitchell, P. (1993). Chlorpromazine Turns Forty. Aust NZ J Psychiatry, 27(3):370–373. 587
Moriaud, F., Richard, S. B., Adcock, S. A., Chanas-Martin, L., Surgand, J.-S., Jelloul, M. B., and 588
Delfaud, F. (2011). Identify drug repurposing candidates by mining the protein data bank. Briefings in 589
Bioinformatics, 12(4):336–340. 590
NIDA (2010). Propranolol for Treatment of Cocaine Addiction - 2. In: ClinicalTrials.gov [Internet]. 591
Bethesda (MD): National Library of Medicine (US). 2000- [cited 2015 Apr 27]. Available from: 592
https://clinicaltrials.gov/ct2/show/NCT00000197 NLM Identifier: NCT00000197. 593
Noy, N. F. (2004). Semantic integration: a survey of ontology-based approaches. ACM SIGMOD Record, 594
33(4):65. 595
of Missouri-Columbia, U. (2015). Trial of Propranolol in Adults and Adolescents With ASD and 596
Predictors of Response. In: ClinicalTrials.gov [Internet]. Bethesda (MD): National Library of Medicine 597
(US). 2000- [cited 2015 Apr 27]. Available from: https://clinicaltrials.gov/ct2/show/NCT02414451 598
NLM Identifier: NCT02414451. 599
of South Carolina, M. U. (2015). Enhancing Disrupted Reconsolidation: Impact on Cocaine Craving. In: 600
ClinicalTrials.gov [Internet]. Bethesda (MD): National Library of Medicine (US). 2000- [cited 2015 Apr 601
27]. Available from: https://clinicaltrials.gov/ct2/show/NCT01822587 NLM Identifier: NCT01822587. 602
Riaz, F. and Ali, K. M. (2011). Applications of graph theory in computer science. pages 142–145. IEEE. 603
Rukhadze, M. D., Bezarashvili, G. S., Sidamonidze, N. S., and Tsagareli, S. K. (2001). Investigation of 604
binding process of chlorpromazine to bovine serum albumin by means of passive and active experiments. 605
Biomedical chromatography: BMC, 15(6):365–373. PMID: 11559920. 606
Sanseau, P., Agarwal, P., Barnes, M. R., Pastinen, T., Richards, J. B., Cardon, L. R., and Mooser, V. (2012). 607
Use of genome-wide association studies for drug repositioning. Nature biotechnology, 30(4):317–320. 608
Seid, D. and Mehrotra, S. (2007). Semantically ranked graph pattern queries for link analysis. pages 609
296–299. IEEE. 610
Ullmann, J. R. (1976). An algorithm for subgraph isomorphism. Journal of the ACM, 23(1):31–42. 611
UniProt Consortium (2013). Update on activities at the universal protein resource (UniProt) in 2013. 612
Nucleic acids research, 41(Database issue):D43–47. PMID: 23161681. 613
Washio, T. and Motoda, H. (2003). State of the art of graph-based data mining. ACM SIGKDD 614
Explorations Newsletter, 5(1):59. 615
Wishart, D. S. (2006). DrugBank: a comprehensive resource for in silico drug discovery and exploration. 616
Nucleic Acids Research, 34(90001):D668–D672. 617
Yang, L. and Agarwal, P. (2011). Systematic Drug Repositioning Based on Clinical Side-Effects. PLoS 618
ONE, 6(12):e28025+. 619
Zhang, S., Li, S., and Yang, J. (2009). GADDI. page 192. ACM Press. 620
14/25
binds_to
simsim
binds_to
sim
binds_to
sim
binds_to
sim
binds_to
sim
binds_to
Compound
Target
CompoundTrimeprazine
binds_to
sim
binds_to
Histamine H1 Receptor
Chlorpromazine
sim
A B
Figure 1. An example of a simple semantic subgraph (B) is derived from the repositioning of
Chlorpromazine (A). Chlorpromazine is marketed as a non-sedating tranquilliser, but is also known to
be effective as an antihistamine Rukhadze et al. (2001) and so in A a relation is inferred between
Chlorpromazine and the Histamine H1 receptor (dashed line)
15/25
JGraphT Instance of G
Semantic Sub (Q)
Semantic Sub Splitting (Q)Semantic Graph Prune (G)
Topological Matching (G,Q)
Semantic Subgraph Exclusion (ST, Q, M’)
Ranked M
Target Graph (G) Semantic Threshold (ST)
Figure 2. Overview of the DReSMin algorithm developed for the detection of semantic
subgraphs indicative of repositioning opportunities
16/25
v6v5v5 v6
v6v5
v3
v4
v2
D1
D2
v1
v3v3
D2.1
D2.2
v4v3
Q
v2
v1
v3 v4
Figure 3. Subgraph split procedure takes an initial semantic subgraph (Q) and produces two
smaller semantic subgraphs (D1 and D2) using all vertices (v) from (Q). The overlapping node (ON)
is identified in Q (v3) and used as the overlapping node in both D1 and D2. The two most distant vertices
in Q are then identified (v1 and v6) and vertices in the path between these and ON added to the
corresponding graphs (D1 and D2). We also see that |V (D2)|> 3 and so a second call is made to graph
split giving us D21 and D22.
17/25
binds_to
may_treatmay_prevent
sim
has_parenthas_child
is_similar_to
is_a is_a
interacts_with has_similar_sequence
Compound
may_prevent
sim
involved_in
has_parent
Disease
has_similar_sequence
binds_to
may_treat
has_child
is_a
Target
has_similar_sequence
Enzyme
Protein
is_a
interacts_with
Figure 4. A subsection of the Ondex in silico drug discovery dataset metagraph Shows how
different conceptClasses (E.g. Compound & Target) interact via relationTypes
(binds to))
18/25
0e+00 4e+04 8e+04
02
46
8
|V (Q )|=3
|V (G )|
Searc
h T
ime
VmaxG
COMPCOMP_CW
CW_SDC
CW_SDC_GP
0e+00 4e+04 8e+04
01
02
03
04
05
0
|V (Q )|=4
|V (G )|
Searc
h T
ime
VmaxG
COMPCOMP_CW
CW_SDC
CW_SDC_GP
0e+00 4e+04 8e+04
04
00
08
00
0
|V (Q )|=5a
|V (G )|
Searc
h T
ime
VmaxG
COMPCOMP_CW
CW_SDC
CW_SDC_GP
CW_SDC_GP_GS
0e+00 4e+04 8e+04
01
02
03
04
05
0
|V (Q )|=5b
|V (G )|
Searc
h T
ime
CW_SDC
CW_SDC_GP
CW_SDC_GP_GS
0e+00 4e+04 8e+04
01
03
05
0
|V (Q )|=6
|V (G )|
Searc
h T
ime
CW_SDC
CW_SDC_GP
CW_SDC_GP_GS
0e+00 4e+04 8e+04
02
46
8
Best Performance
|V (G )|
Searc
h T
ime
Sub_3_GP
Sub_4_GP
Sub_5_GP_GS
Sub_6_GP_GS
Figure 5. Overview of algorithm performance with semantic subgraph (Q) queries nodeset
|V (Q)| ranging from 3-6. Graphs show each step of the algorithm reducing search time. Abbreviations:
VmaxG = initial candidate set is chosen using the vt of the node displaying the highest connectivity in Q,
COMP = compound makes up the initial candidate set, CW = closed world check implemented, SDC =
semantic distance calculator used during search, GP = semantic graph prune step implemented, GS =
graph split used. 5a (all steps plotted for |V (Q)|= 5) and 5b (focuses on GP and GS of |V (Q)|= 5).
Algorithm Performance (bottom right) shows the best approach for each semantic subgraph size.
19/25
BA C
T1 T2 T2T1T1
D2D1 D1D2D1
bi_tobi_to
h_s_s
h_s_s
sim
sim bi_to
sim
sim
h_s_s
h_s_s
bi_to
Figure 6. Semantic subgraphs were derived from the semantic shortest paths between a drug
and a target pair captured in DrugBank v3. A) shows a drug-target interaction captured in DBv3
made up of a drug (D1) and a target (T2) captured in our network, Dat. In order to create semantic
subgraphs D1 and T2 are identified in Dat (highlighted in green in B) and the semantic shortest paths
between the two nodes calculated (highlighted in red in B). Finally all semantic node types and edge
types that fall on the semantic shortest path are used to create a query graph (C). Note: Dashed red line
represents the inferred binds to relations, squares represent compounds, circles targets, diamonds proteins
and octagon diseases. For relation types: bi to = binds to, sim = similar to, h s s = has similar sequence.
20/25
Q4
Q8Q6
Q2Q1
Q9
Q5
Q10
Q3
Q7
Q108
bi_to
h_s_s
h_s_sbi_to
inv_in
inv_in simsim
bi_to
bi_to
bi_tobi_to
ma_tr inv_in bi_to
h_s_s
h_s_s
h_s_sh_s_s
bi_to
h_s_s
h_s_s
h_s_s h_s_s
bi_to
h_s_s
h_s_s
is_a
is_a
ma_tr
ma_tr
bi_to
simsim
bi_to
h_s_s
h_s_s
bi_to
h_s_s
h_s_s
inv_ininv_in
bi_to
sim
sim
bi_to
Figure 7. Examples of semantic subgraphs drawn from the semantic shortest paths. Q1 -Q10 are
drawn from the semantic shortest paths that represented the shortest path between the greatest number of
D-T interactions in DBv3Rel and Q108 is an example of a more complex semantic subgraph. Note:
Dashed red lines represent the inferred binds to relations, squares represent compounds, circles targets,
diamonds proteins and octagon diseases. For relation types: bi to = binds to, sim = similar to, h s s =
has similar sequence, ma tr = may treat, inv in = involved in and is a = is a.
21/25
0
100
200
300
∞
−lo
g10
(P[X
>x])
A B
0.00
0.06
0.13
0.19
0.25
Associa
tion S
core
0
20
40
60
80
100
120
# S
ubs Identify
ing D
−T
C
0
100
200
300
∞
−lo
g10
(P[X
>x])
Association Score
0.0
01
0.0
21
0.0
41
0.0
61
0.0
81
0.1
01
0.1
21
0.1
41
0.1
61
0.1
81
0.2
01
0.2
21
D
0.00
0.06
0.13
0.19
0.25
Associa
tion S
core
Rank Pos
500
500500
1000500
1500500
2000500
2500500
3000500
3500500
4000500
4500500
5000500
5500500
6000500
6500500
7000500
7500500
8000500
8500500
9000500
9500500
E
0
20
40
60
80
100
120
# S
ubs Identify
ing D
−T
Not−
Valid
Valid
ate
d
Association Type
F
Figure 8. Validation of inferred D-T associations with known D-T associations from DBv3 and
DBv4.2. A, B and C show how DReSMin identifies and ranks the 2,919 known interactions from DBv3
when searching Dat. D, E and F show how DReSMin identifies and ranks the 333 known interactions
from DBv4.2. For A and D hypergeometric distribution of inferred knowns were calculated using the
scores of the validated associations. For B and E hypergeometric distribution of inferred knowns were
calculated using the ranked position of the validated interactions. C and F show the number of semantic
subgraphs that inferred knowns in comparison to the number of semantic subgraphs that inferred novel
interactions. Note: Blue line shows the highest scoring semantic subgraph; all scores above this line are
definitely inferred by >one semantic subgraph.
22/25

0
10
20
30
40
0
50
100
150
N=2223
Bandwidth= 1.2942
Mean= 9.645
Fre
quency
A●●●●●●●●●●●
●
●
●
●●
●
●●●
●
●
●●
●
●
●●
●
●
●
●
●
●
●
●●
●●●
●
●
●
●
●
●
●●
●
●●●
●●
●●
●●
●
●
●
●
●
●●
●
●●
●
●
●
●
●
●
0
50000
100000
150000
200000
Rankin
g o
f know
ns
747 1201B
●
●
●
●
●
●●
●
●
●
●●
●
●
●
●
●●
●
0
50000
100000
150000
200000
Rankin
g o
f know
ns
189 234C
0
10
20
30
40
0
50
100
150
N=2223
Bandwidth= 1.1504
Mean= 9.2511
Fre
quency
Crossover
D●●●●●●●●●●●●●
●
●
●
●●
●
●●●
●
●
●●
●
●
●●
●
●
●
●
●
●
●
●●
●●●
●
●
●
●
●
●
●●
●
●●●
●●
●●
●●
●
●
●
●
●
●●
●
●●
●
●
●
●
●
●
0
50000
100000
150000
200000
Rankin
g o
f know
ns
ChE
MB
L
DR
eS
Min
751 1201E
●
●
●
●
●
●●
●
●
●
●●
●
●
●
●
●●
●
0
50000
100000
150000
200000
Rankin
g o
f know
ns
ChE
MB
L
DR
eS
Min
185 234
F
Figure 9. DReSMin inferred D-T associations in comparison to those inferred using the
ligand-based similarity models provided by ChEMBL. Top graphs (A, B and C) show comparison to
those using the 1uM model from ChEMBL and bottom graphs (D, E and F) show comparison with the
10uM model. A and D show the %age crossover between the top ranked x associations from each method
for each drug. B and E show the comparative ranking of the 2,919 known D-T interactions from DBv3Rel.
C and F show the comparative ranking of the 333 known D-T interactions from DBv4Rel. In B, C, E and
F red diamonds show the mean ranking and numbers in red show the number of knowns captured by each
method. Only associations inferred by the 2,223 drugs with a mapping between DrugBank and ChEMBL
are included.
23/25
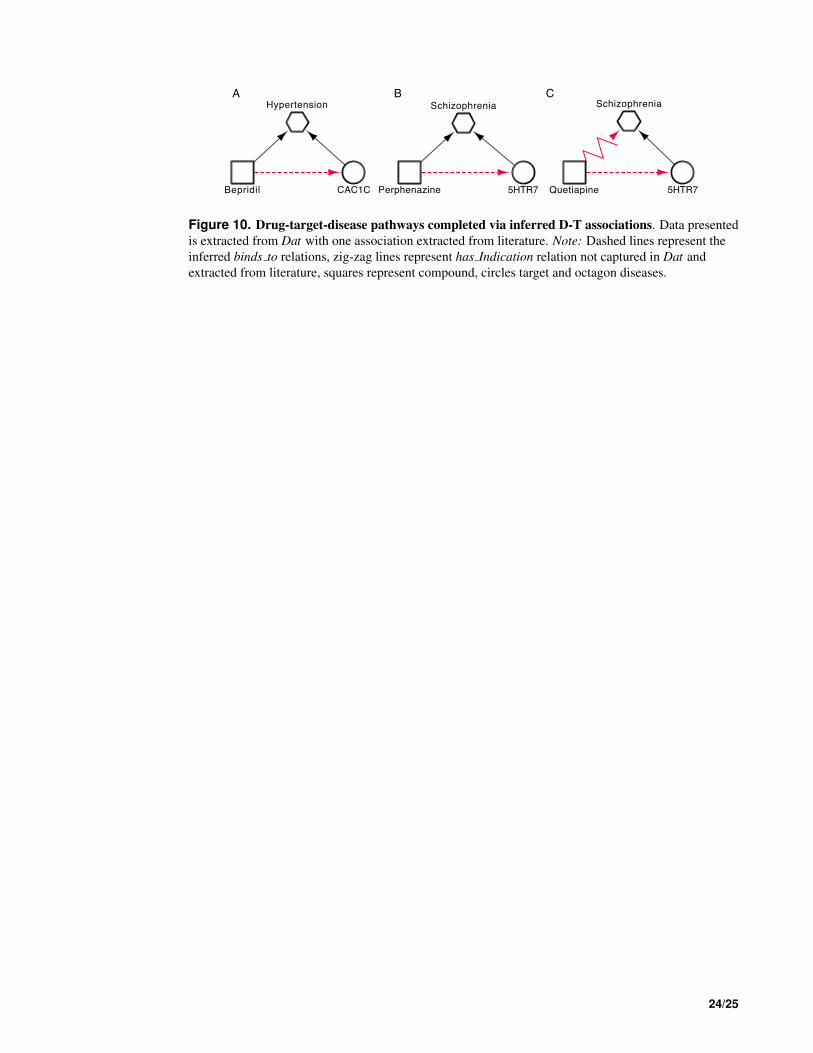
AHypertension
Bepridil
B
CAC1C Perphenazine
Schizophrenia
5HTR7
C
Quetiapine
Schizophrenia
5HTR7
Figure 10. Drug-target-disease pathways completed via inferred D-T associations. Data presented
is extracted from Dat with one association extracted from literature. Note: Dashed lines represent the
inferred binds to relations, zig-zag lines represent has Indication relation not captured in Dat and
extracted from literature, squares represent compound, circles target and octagon diseases.
24/25
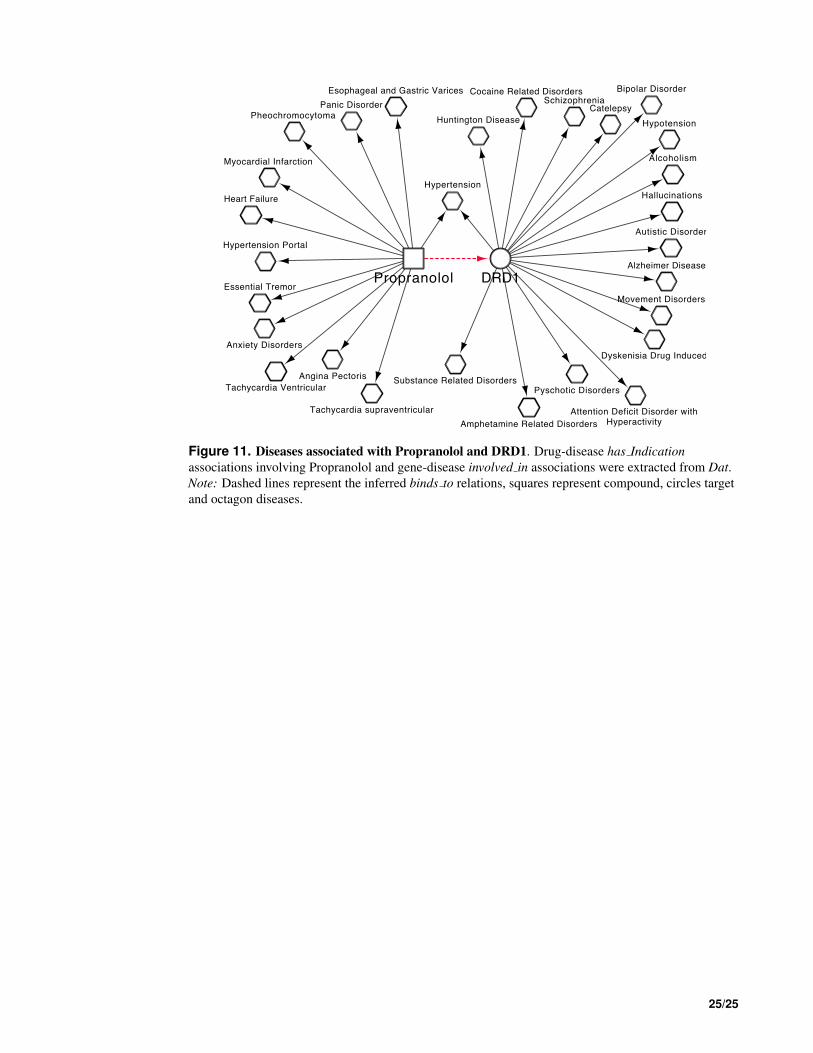
Pheochromocytoma
Tachycardia Ventricular
Essential Tremor
Hypertension Portal
Heart Failure
Myocardial Infarction
Anxiety Disorders
Bipolar Disorder
Hallucinations
Alcoholism
Autistic Disorder
Hypotension
Catelepsy
Movement Disorders
Alzheimer Disease
Attention Deficit Disorder with Hyperactivity
Dyskenisia Drug Induced
Cocaine Related Disorders
DRD1
Huntington Disease
Schizophrenia
Substance Related DisordersPyschotic Disorders
Amphetamine Related Disorders
Hypertension
Tachycardia supraventricular
Panic Disorder
Propranolol
Angina Pectoris
Esophageal and Gastric Varices
Figure 11. Diseases associated with Propranolol and DRD1. Drug-disease has Indication
associations involving Propranolol and gene-disease involved in associations were extracted from Dat.
Note: Dashed lines represent the inferred binds to relations, squares represent compound, circles target
and octagon diseases.
25/25