Embed Size (px)
Citation preview
227
Renato Oliveira et al.
REM: R. Esc. Minas, Ouro Preto, 69(2), 227-232, apr. jun. | 2016
Abstract
A pilot scale test program was conducted to evaluate the size reduction perfor-mance of HPGR (High Pressure Grinding Rolls) operating in different circuit con-figurations. For this purpose a series of pilot-HPGR locked cycle tests were performed with medium and high pressures to simulate the HPGR operation in closed circuit with a screen, with partial product recycle, and with edge recycle. Logged instrumen-tation data such as roller speed, working gap, operating pressure, and power draw were used in combination with material test results such as particle size distributions, flake density, flake thickness, and bulk density of the feed for calculation of HPGR operational parameters. The paper reports the results from the pilot HPGR test work. The analysis reported herein includes an evaluation and comparison of different circuit configurations of the HPGR operation in terms of energy consumption, capacity and product fineness and also discusses the benefits of various circuit arrangements.
keywords: comminution, HPGR, classification, circuit configuration.
Renato OliveiraEngenheiro de minas e mestre em engenharia mineral
Universidade de São Paulo – USP
Escola Politécnica
Departamento de Engenharia de Minas e de Petróleo
São Paulo – São Paulo – Brasil
Homero Delboni JúniorProfessor Doutor
Universidade de São Paulo - USP
Escola Politécnica
Departamento de Engenharia de Minas e de Petróleo
São Paulo - SP – Brasil
Maurício Guimarães BergermanProfessor Doutor
Universidade de São Paulo - USP
Escola Politécnica
Departamento de Engenharia de Minas e de Petróleo
São Paulo - SP – Brasil
Performance analysis of the HRC™ HPGR in pilot plant
MiningMineração
http://dx.doi.org/10.1590/0370-44672015690124
1. Introduction
During the last decade, there have been considerable improvements in comminution efficiency. The improve-ments are not only due to the optimal design of grinding systems and operat-ing variables that enable more efficient use of existing comminution devices, but also due to the development of comminution devices with the abil-ity to enhance energy utilisation. The HPGR was one of these new energy efficient comminution devices. The first commercial application of HPGR was in 1985 and its success resulted in increasing numbers of applications since then, particularly in the cement industry (Kellerwessel, 1990).
A number of new large hard rock mining operations have incorporated HPGR in their grinding circuit instead of the conventional AG/SAG mill (Mor-ley, 2003; Rosario & Hall, 2010; Von Michaelis, 2005, Hart et al., 2011). HPGR’s are being used to significantly reduce the energy required for grinding,
but there are opportunities to better utilise this technology in novel flow-sheet arrangements to result in further energy reduction.
The product size distribution of an HPGR is the result of two separate product flows: centre and edge. The product from the centre has a relatively fine size distribution resulting from the high pressure at the centre of the rolls. The edge product, from either side of the roll, is coarser as the pressure is much lower due to the design of the machine. Thus, the product from an open circuit HPGR has a relatively wide size distribution (Van der Meer & Gruendken, 2010).
The main purpose of operating an HPGR with a recycle is to control product fineness and to form a sta-bilized bed of particles between the rollers for smooth and efficient opera-tion of the machine. Recycling can be accomplished in a number of ways: by screening the entire product and
recycling all or a portion of the screen oversize, by partial recycling of the entire product, or recycling of the edge products only. HPGR performance will vary accordingly.
A pilot scale test program was conducted to evaluate the size reduction performance of HPGR (High Pressure Grinding Rolls) operating in different circuit configurations and pressure. For this purpose a series of pilot-HPGR locked cycle tests were performed to simulate the HPGR operation in closed circuit with a screen, with partial prod-uct recycle, and with edge recycle
In the following sections, the re-sults from the pilot HPGR test work obtained to date are presented. The analysis reported herein includes an evaluation and comparison of different circuit configurations of HPGR opera-tion in terms of energy consumption, capacity and product fineness. Benefits of various circuit arrangements are also discussed.
228
Performance analysis of the HRC™ HPGR in pilot plant
REM: R. Esc. Minas, Ouro Preto, 69(2), 227-232, apr. jun. | 2016
2. Method and materials
Locked cycle tests were carried out with a pilot-scale HPGR to simu-late the HPGR performance in differ-ent circuit configurations. The circuit configurations considered included: open circuit, closed circuit with a
screen (75% and 100% efficiency), partial product recycle (25% and 50%) and edge recycle.
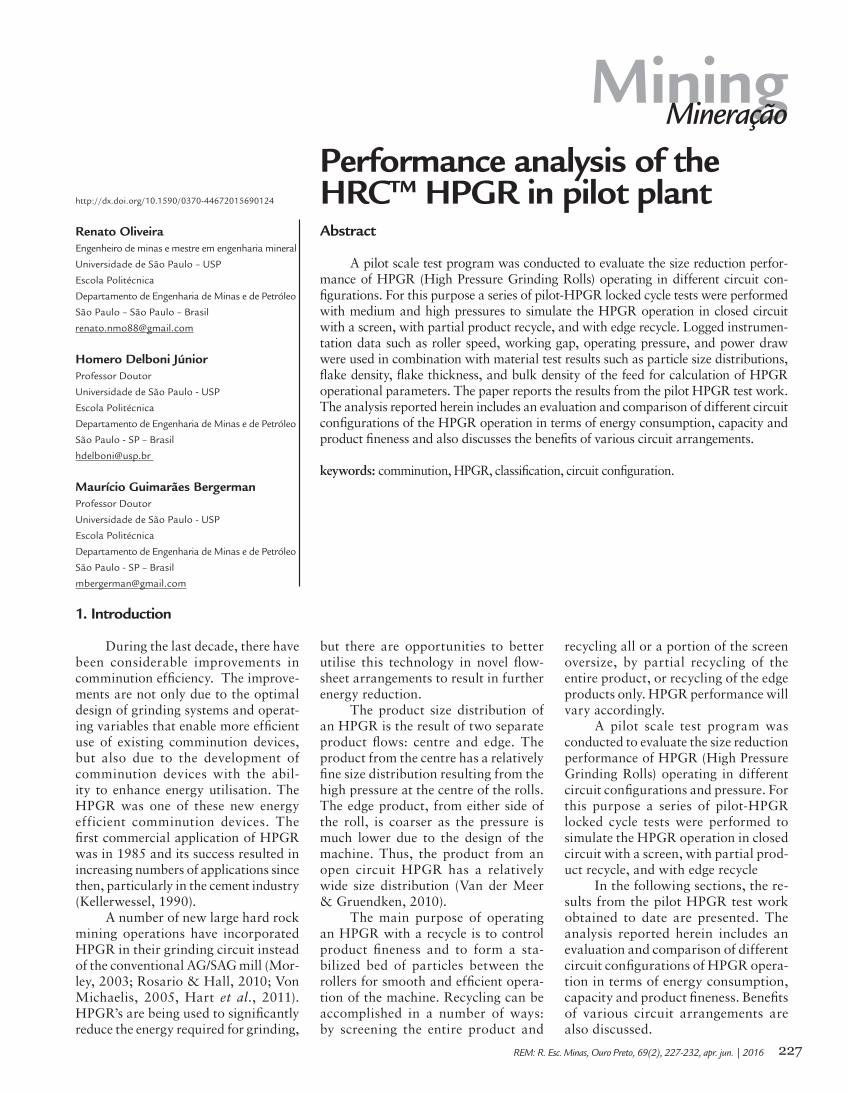
A pilot-scale HPGR with a roll diameter of 300mm, a roll length of 150mm, and powered by two 15kW
motors was used for the test program. The HPGR is equipped with pressure, gap, speed and torque sensors. A bin over the HPGR helps maintain choke feeding conditions. The pilot-scale HPGR circuit is shown in Figure 1.
Figure 1Pilot HPGR facility.
The material used in the tests was obtained from a local quarry and stock-piled at Sorocaba. The material was then mixed as consistently as possible into two
homogenized stockpiles that provided the feed for each test. Precautions were taken to ensure the moisture content of each stockpile was similar by protecting
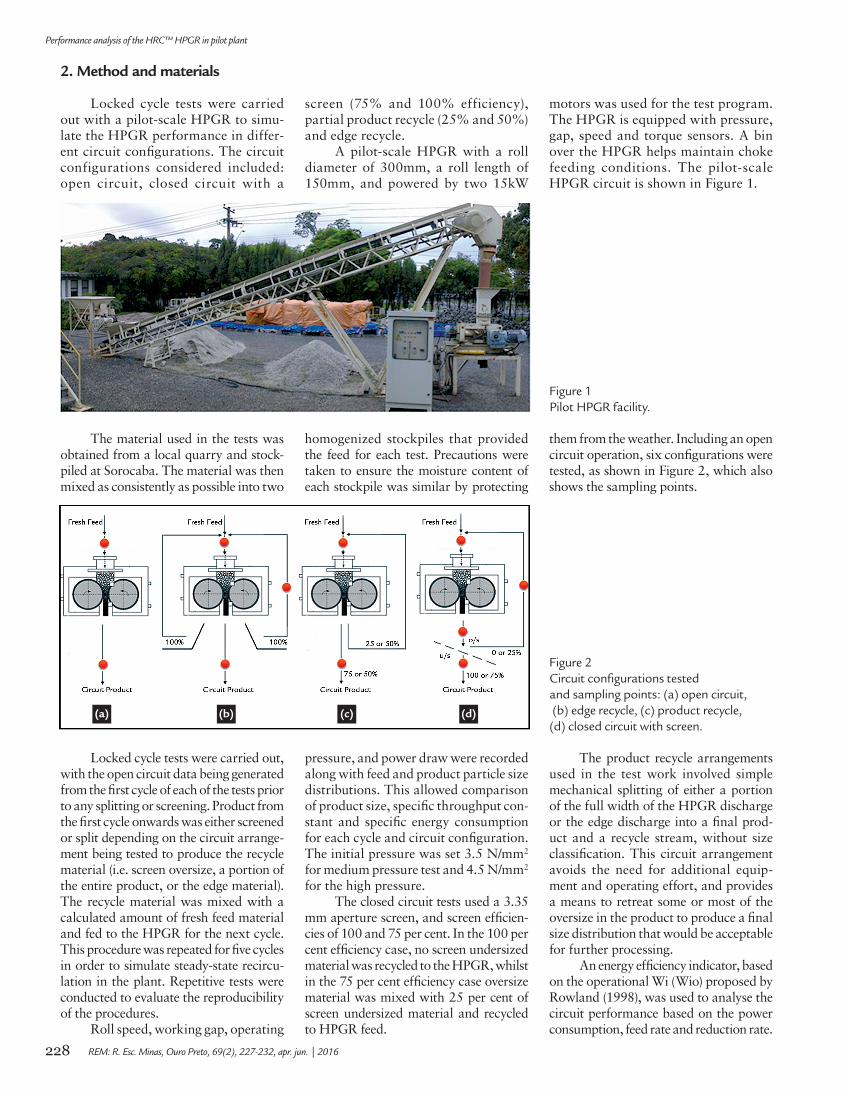
them from the weather. Including an open circuit operation, six configurations were tested, as shown in Figure 2, which also shows the sampling points.
Figure 2Circuit configurations tested and sampling points: (a) open circuit, (b) edge recycle, (c) product recycle, (d) closed circuit with screen.
Locked cycle tests were carried out, with the open circuit data being generated from the first cycle of each of the tests prior to any splitting or screening. Product from the first cycle onwards was either screened or split depending on the circuit arrange-ment being tested to produce the recycle material (i.e. screen oversize, a portion of the entire product, or the edge material). The recycle material was mixed with a calculated amount of fresh feed material and fed to the HPGR for the next cycle. This procedure was repeated for five cycles in order to simulate steady-state recircu-lation in the plant. Repetitive tests were conducted to evaluate the reproducibility of the procedures.
Roll speed, working gap, operating
pressure, and power draw were recorded along with feed and product particle size distributions. This allowed comparison of product size, specific throughput con-stant and specific energy consumption for each cycle and circuit configuration. The initial pressure was set 3.5 N/mm2 for medium pressure test and 4.5 N/mm2 for the high pressure.
The closed circuit tests used a 3.35 mm aperture screen, and screen efficien-cies of 100 and 75 per cent. In the 100 per cent efficiency case, no screen undersized material was recycled to the HPGR, whilst in the 75 per cent efficiency case oversize material was mixed with 25 per cent of screen undersized material and recycled to HPGR feed.
The product recycle arrangements used in the test work involved simple mechanical splitting of either a portion of the full width of the HPGR discharge or the edge discharge into a final prod-uct and a recycle stream, without size classification. This circuit arrangement avoids the need for additional equip-ment and operating effort, and provides a means to retreat some or most of the oversize in the product to produce a final size distribution that would be acceptable for further processing.
An energy efficiency indicator, based on the operational Wi (Wio) proposed by Rowland (1998), was used to analyse the circuit performance based on the power consumption, feed rate and reduction rate.
(a) (b) (c) (d)
229
Renato Oliveira et al.
REM: R. Esc. Minas, Ouro Preto, 69(2), 227-232, apr. jun. | 2016
3. Results
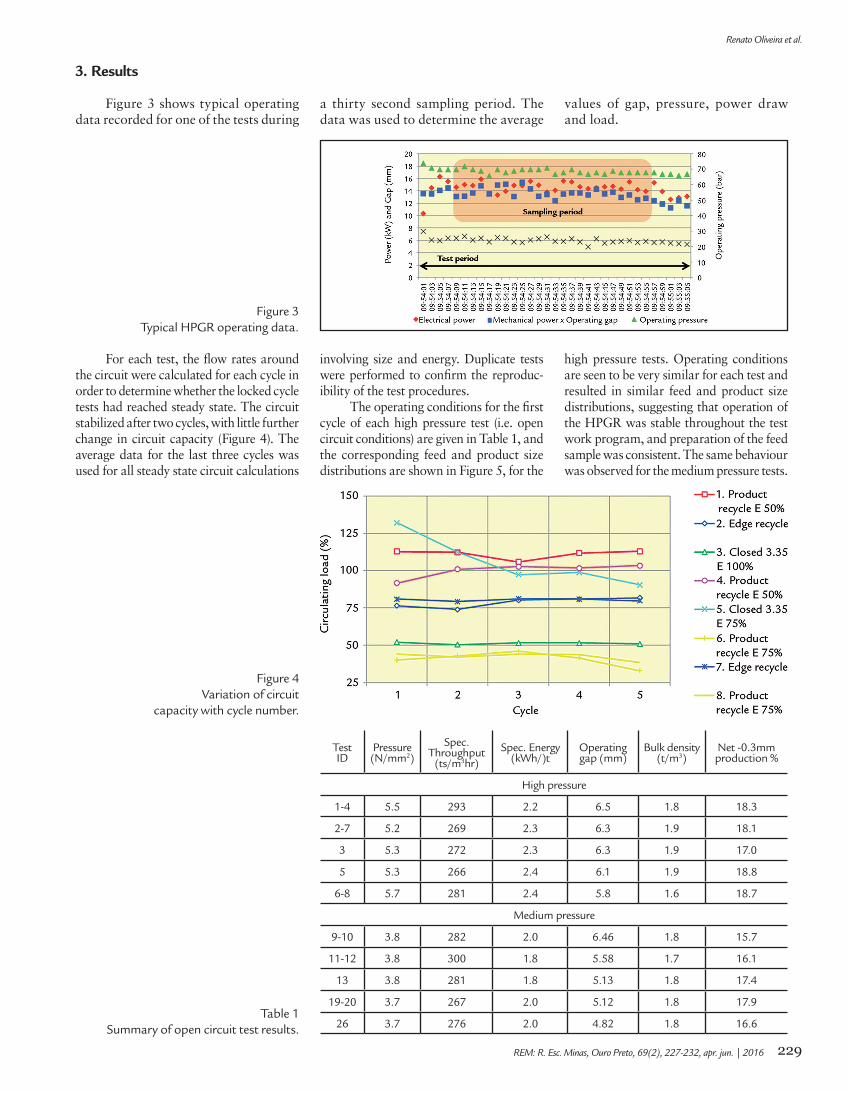
Figure 3 shows typical operating data recorded for one of the tests during
a thirty second sampling period. The data was used to determine the average
values of gap, pressure, power draw and load.
Figure 3Typical HPGR operating data.
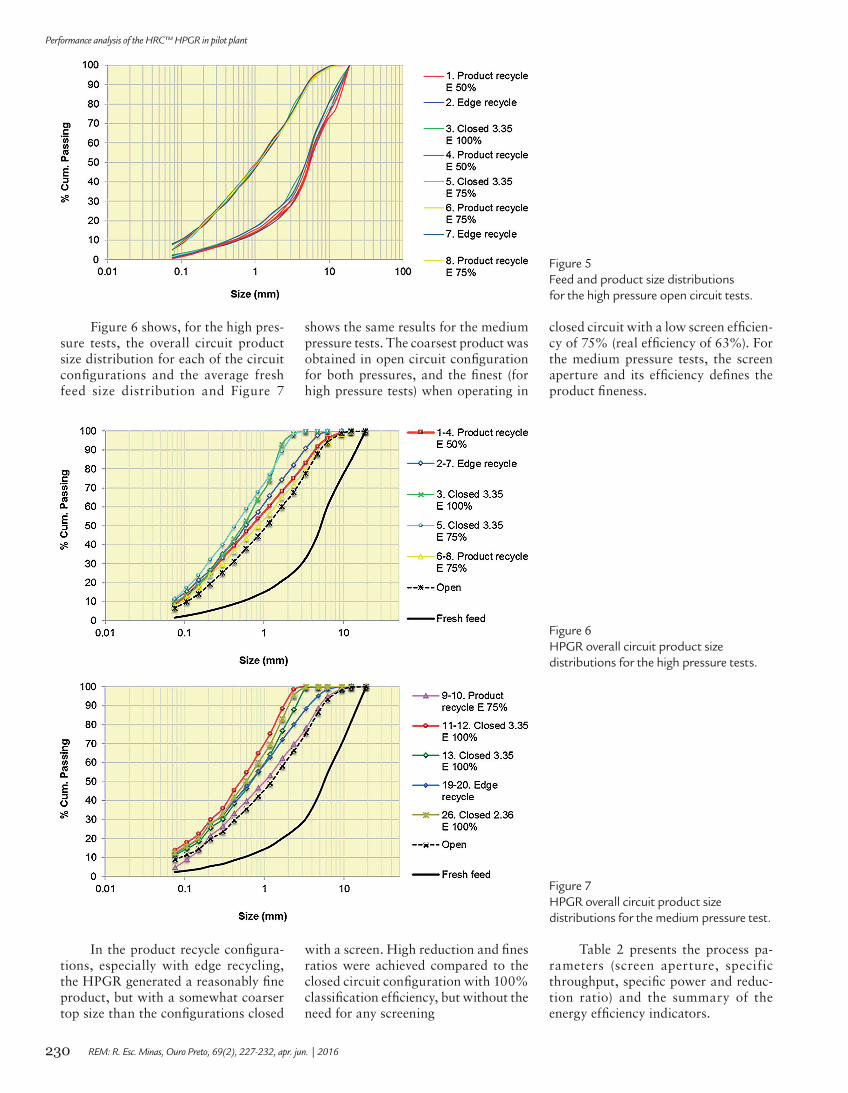
For each test, the flow rates around the circuit were calculated for each cycle in order to determine whether the locked cycle tests had reached steady state. The circuit stabilized after two cycles, with little further change in circuit capacity (Figure 4). The average data for the last three cycles was used for all steady state circuit calculations
involving size and energy. Duplicate tests were performed to confirm the reproduc-ibility of the test procedures.
The operating conditions for the first cycle of each high pressure test (i.e. open circuit conditions) are given in Table 1, and the corresponding feed and product size distributions are shown in Figure 5, for the
high pressure tests. Operating conditions are seen to be very similar for each test and resulted in similar feed and product size distributions, suggesting that operation of the HPGR was stable throughout the test work program, and preparation of the feed sample was consistent. The same behaviour was observed for the medium pressure tests.
Figure 4Variation of circuit
capacity with cycle number.
Test ID
Pressure (N/mm2)
Spec. Throughput
(ts/m3hr)Spec. Energy
(kWh/)tOperating gap (mm)
Bulk density (t/m3)
Net -0.3mm production %
High pressure
1-4 5.5 293 2.2 6.5 1.8 18.3
2-7 5.2 269 2.3 6.3 1.9 18.1
3 5.3 272 2.3 6.3 1.9 17.0
5 5.3 266 2.4 6.1 1.9 18.8
6-8 5.7 281 2.4 5.8 1.6 18.7
Medium pressure
9-10 3.8 282 2.0 6.46 1.8 15.7
11-12 3.8 300 1.8 5.58 1.7 16.1
13 3.8 281 1.8 5.13 1.8 17.4
19-20 3.7 267 2.0 5.12 1.8 17.9
26 3.7 276 2.0 4.82 1.8 16.6Table 1
Summary of open circuit test results.
230
Performance analysis of the HRC™ HPGR in pilot plant
REM: R. Esc. Minas, Ouro Preto, 69(2), 227-232, apr. jun. | 2016
Figure 5Feed and product size distributions for the high pressure open circuit tests.
Figure 6 shows, for the high pres-sure tests, the overall circuit product size distribution for each of the circuit configurations and the average fresh feed size distribution and Figure 7
shows the same results for the medium pressure tests. The coarsest product was obtained in open circuit configuration for both pressures, and the finest (for high pressure tests) when operating in
closed circuit with a low screen efficien-cy of 75% (real efficiency of 63%). For the medium pressure tests, the screen aperture and its efficiency defines the product fineness.
Figure 6HPGR overall circuit product size distributions for the high pressure tests.
Figure 7HPGR overall circuit product size distributions for the medium pressure test.
In the product recycle configura-tions, especially with edge recycling, the HPGR generated a reasonably fine product, but with a somewhat coarser top size than the configurations closed
with a screen. High reduction and fines ratios were achieved compared to the closed circuit configuration with 100% classification efficiency, but without the need for any screening
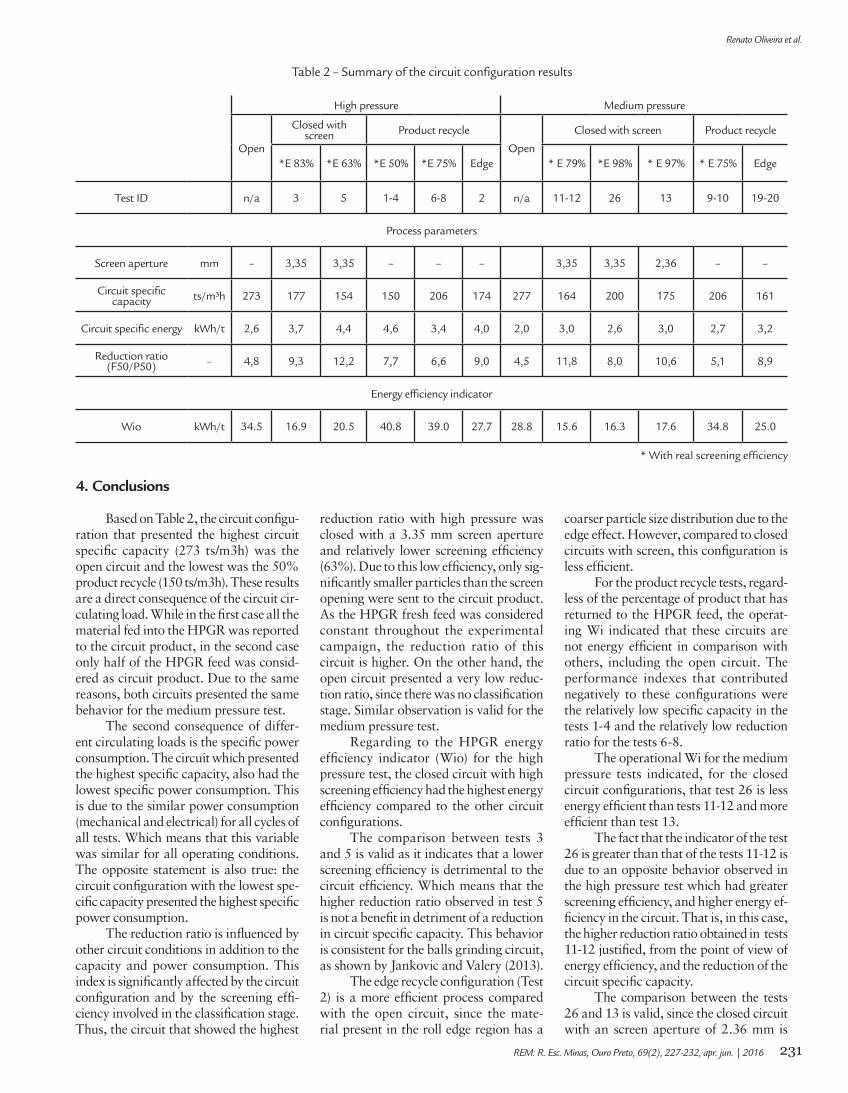
Table 2 presents the process pa-rameters (screen aperture, specific throughput, specific power and reduc-tion ratio) and the summary of the energy efficiency indicators.
231
Renato Oliveira et al.
REM: R. Esc. Minas, Ouro Preto, 69(2), 227-232, apr. jun. | 2016
High pressure Medium pressure
Open
Closed with screen Product recycle
Open
Closed with screen Product recycle
*E 83% *E 63% *E 50% *E 75% Edge * E 79% *E 98% * E 97% * E 75% Edge
Test ID n/a 3 5 1-4 6-8 2 n/a 11-12 26 13 9-10 19-20
Process parameters
Screen aperture mm – 3,35 3,35 – – – 3,35 3,35 2,36 – –
Circuit specific capacity ts/m³h 273 177 154 150 206 174 277 164 200 175 206 161
Circuit specific energy kWh/t 2,6 3,7 4,4 4,6 3,4 4,0 2,0 3,0 2,6 3,0 2,7 3,2
Reduction ratio (F50/P50) – 4,8 9,3 12,2 7,7 6,6 9,0 4,5 11,8 8,0 10,6 5,1 8,9
Energy efficiency indicator
Wio kWh/t 34.5 16.9 20.5 40.8 39.0 27.7 28.8 15.6 16.3 17.6 34.8 25.0
4. Conclusions
Based on Table 2, the circuit configu-ration that presented the highest circuit specific capacity (273 ts/m3h) was the open circuit and the lowest was the 50% product recycle (150 ts/m3h). These results are a direct consequence of the circuit cir-culating load. While in the first case all the material fed into the HPGR was reported to the circuit product, in the second case only half of the HPGR feed was consid-ered as circuit product. Due to the same reasons, both circuits presented the same behavior for the medium pressure test.
The second consequence of differ-ent circulating loads is the specific power consumption. The circuit which presented the highest specific capacity, also had the lowest specific power consumption. This is due to the similar power consumption (mechanical and electrical) for all cycles of all tests. Which means that this variable was similar for all operating conditions. The opposite statement is also true: the circuit configuration with the lowest spe-cific capacity presented the highest specific power consumption.
The reduction ratio is influenced by other circuit conditions in addition to the capacity and power consumption. This index is significantly affected by the circuit configuration and by the screening effi-ciency involved in the classification stage. Thus, the circuit that showed the highest
reduction ratio with high pressure was closed with a 3.35 mm screen aperture and relatively lower screening efficiency (63%). Due to this low efficiency, only sig-nificantly smaller particles than the screen opening were sent to the circuit product. As the HPGR fresh feed was considered constant throughout the experimental campaign, the reduction ratio of this circuit is higher. On the other hand, the open circuit presented a very low reduc-tion ratio, since there was no classification stage. Similar observation is valid for the medium pressure test.
Regarding to the HPGR energy efficiency indicator (Wio) for the high pressure test, the closed circuit with high screening efficiency had the highest energy efficiency compared to the other circuit configurations.
The comparison between tests 3 and 5 is valid as it indicates that a lower screening efficiency is detrimental to the circuit efficiency. Which means that the higher reduction ratio observed in test 5 is not a benefit in detriment of a reduction in circuit specific capacity. This behavior is consistent for the balls grinding circuit, as shown by Jankovic and Valery (2013).
The edge recycle configuration (Test 2) is a more efficient process compared with the open circuit, since the mate-rial present in the roll edge region has a
coarser particle size distribution due to the edge effect. However, compared to closed circuits with screen, this configuration is less efficient.
For the product recycle tests, regard-less of the percentage of product that has returned to the HPGR feed, the operat-ing Wi indicated that these circuits are not energy efficient in comparison with others, including the open circuit. The performance indexes that contributed negatively to these configurations were the relatively low specific capacity in the tests 1-4 and the relatively low reduction ratio for the tests 6-8.
The operational Wi for the medium pressure tests indicated, for the closed circuit configurations, that test 26 is less energy efficient than tests 11-12 and more efficient than test 13.
The fact that the indicator of the test 26 is greater than that of the tests 11-12 is due to an opposite behavior observed in the high pressure test which had greater screening efficiency, and higher energy ef-ficiency in the circuit. That is, in this case, the higher reduction ratio obtained in tests 11-12 justified, from the point of view of energy efficiency, and the reduction of the circuit specific capacity.
The comparison between the tests 26 and 13 is valid, since the closed circuit with an screen aperture of 2.36 mm is
Table 2 – Summary of the circuit configuration results
* With real screening efficiency
232
Performance analysis of the HRC™ HPGR in pilot plant
REM: R. Esc. Minas, Ouro Preto, 69(2), 227-232, apr. jun. | 2016
5. Acknowledgements
This work was conducted as part of a research project sponsored by Metso Process Technology and Innovation. Special thanks to José Corsini, Eduardo Nozawa, Bruno
Pereira, Julio Almeida, Bruno Pontes and Nicolas Siqueira from Metso PTI Brazil and Birol Sömmez from Metso PTI Turky and Hakan Dündar from Hacettepe Üniversitesi.
Additional acknowledgements for Ju-lio Silva, Andrzej Niklewski, Willer Ito and Edilson Pereira from Metso Brazil HRC™ HPGR team.
6. References
HART, S., REES, T., VALERY, W., JANKOVIC, A. Process Integration and Opti-misation of the Boddington HPGR circuit. SAG 2011 CONFERENCE. Canada, 25-28 September 2011.
JANKOVIC, A., VALERY, W. Closed circuit ball mill – Basics revisited. Minerals Engineering, v.43-44, 2013.
KELLERWESSEL, H. High-pressure material-bed comminution in practice. Transla-tion ZKG, v.2 (90), 1990.
MORLEY, C. HPGR in hard rock applications. Mining Magazine. September 2003.MORRELL, S. The appropriateness of the transfer size in AG and SAG mill circuit
design. SAG 2011 CONFERENCE. Canada, 25-28 September 2011.ROSARIO, P, HALL, R. A structured approach to the evaluation of the energy requi-
rements of HPGR and SAG mill circuits in hard ore applications. The Journal of The Southern African Institute of Mining and Metallurgy, v.110, 2010.
ROWLAND, C.A. Using the Bond Work Index to measure operating efficiency. Mi-nerals and Metallurgical Processing, v.15, n.4, November 1998.
VAN DER MEER, F. P., GRUENDKEN, A. Flowsheet considerations foroptimal use of high pressure grinding rolls. Minerals Engineering, v.23, n.9, 2010.
VON MICHAELIS, H. Real and potential metallurgical benefits of HPGR in hard rock ore processing. Proceedings of the Randol Innovative Metallurgy Forum, Perth, W.A., Australia, 21–24 August 2005.
less efficient than the closed circuit with a 3.35 mm. There are two explanations for this conclusion. The first is that the power consumption is inversely proportional to the particle size. Therefore, to reduce the particle size below 2.36 mm, more energy consumption is required. The second is that the HPGR does not supply enough
energy to reduce the particle size and the circulating load increases. The conclusion from both cases is that the HPGR is less efficient to reduce the particle size below 2.36 mm.
For tests with product recycle, either for the partial recycle of the full product, or for the edge recycle,
the same behavior of the high pres-sure tests was observed. Lower energy efficiency with full product recycle and the edge recycle configuration is a more efficient compared to open circuit; however, compared to closed circuits with screen, this configuration is less efficient.
Received: 10 August 2015 - Accepted: 26 March 2016.