Embed Size (px)
Citation preview
Mineral Processing, Financial Modellingand Specialist Capabilities
01/2013
2
Specialist Capabilities
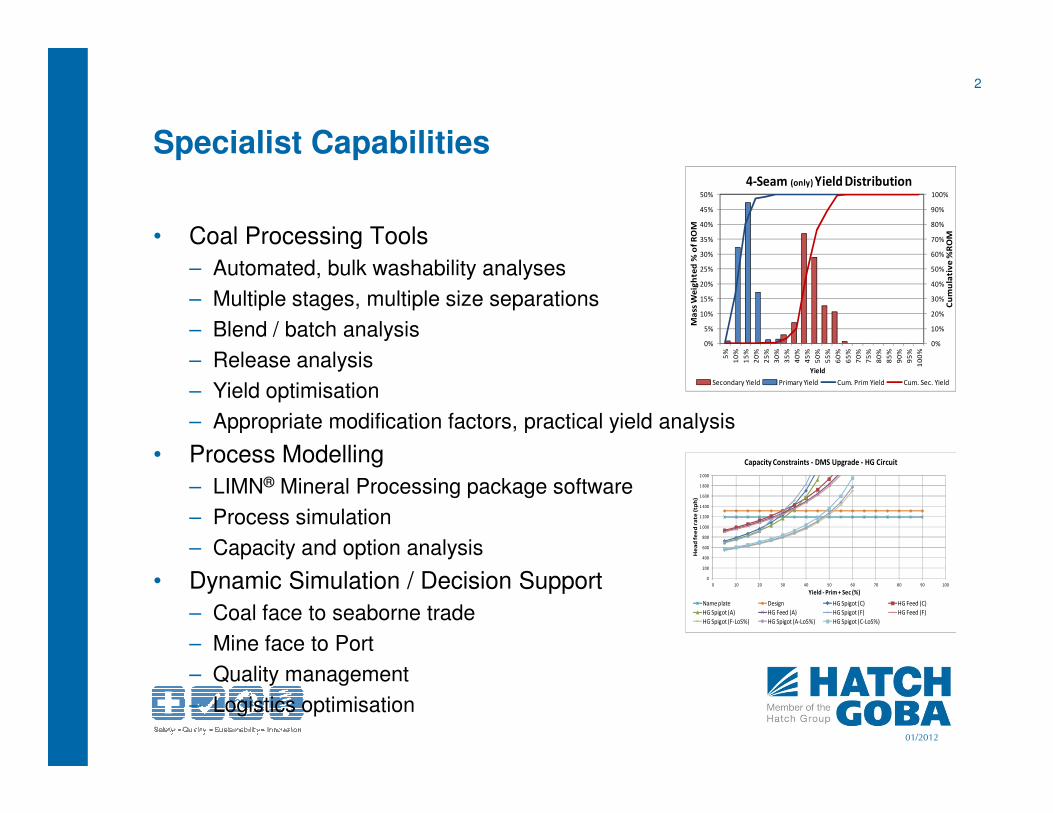
• Coal Processing Tools
– Automated, bulk washability analyses
– Multiple stages, multiple size separations
– Blend / batch analysis
– Release analysis
– Yield optimisation
0%
10%
20%
30%
40%
50%
60%
70%
80%
90%
100%
0%
5%
10%
15%
20%
25%
30%
35%
40%
45%
50%
5%
10
%
15
%
20
%
25
%
30
%
35
%
40
%
45
%
50
%
55
%
60
%
65
%
70
%
75
%
80
%
85
%
90
%
95
%
10
0%
Cu
mu
lati
ve
%R
OM
Ma
ss W
eig
hte
d %
of
RO
M
Yield
4-Seam (only) Yield Distribution
Secondary Yield Primary Yield Cum. Prim Yield Cum. Sec. Yield
01/2012
– Appropriate modification factors, practical yield analysis
• Process Modelling
– LIMN® Mineral Processing package software
– Process simulation
– Capacity and option analysis
• Dynamic Simulation / Decision Support
– Coal face to seaborne trade
– Mine face to Port
– Quality management
– Logistics optimisation
0
200
400
600
800
1 000
1 200
1 400
1 600
1 800
2 000
0 10 20 30 40 50 60 70 80 90 100
He
ad
fe
ed
ra
te (
tph
)
Yield - Prim + Sec (%)
Capacity Constraints - DMS Upgrade - HG Circuit
Name plate Design HG Spigot (C) HG Feed (C)
HG Spigot (A) HG Feed (A) HG Spigot (F) HG Feed (F)
HG Spigot (F-LoS%) HG Spigot (A-LoS%) HG Spigot (C-LoS%)
3
Specialist Capabilities (Cont.)
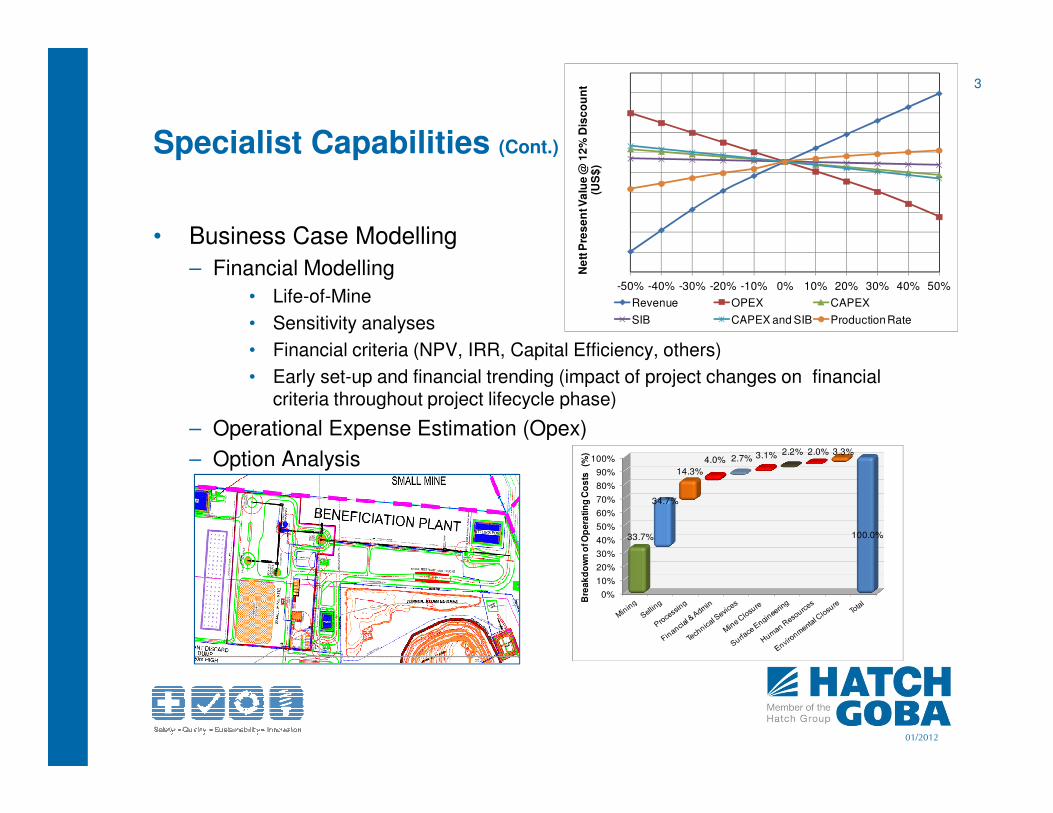
• Business Case Modelling
– Financial Modelling
• Life-of-Mine
• Sensitivity analyses
• Financial criteria (NPV, IRR, Capital Efficiency, others)
• Early set-up and financial trending (impact of project changes on financial criteria throughout project lifecycle phase)
-50% -40% -30% -20% -10% 0% 10% 20% 30% 40% 50%
Ne
tt P
res
en
t Va
lue
@ 1
2%
Dis
co
un
t (U
S$
)
Revenue OPEX CAPEX
SIB CAPEX and SIB Production Rate
01/2012
criteria throughout project lifecycle phase)
– Operational Expense Estimation (Opex)
– Option Analysis
0%
10%
20%
30%
40%
50%
60%
70%
80%
90%
100%
33.7%
34.7%
14.3%
4.0% 2.7% 3.1% 2.2% 2.0% 3.3%
100.0%
Bre
ak
do
wn
of O
pe
rati
ng
Co
sts
(%
)
4
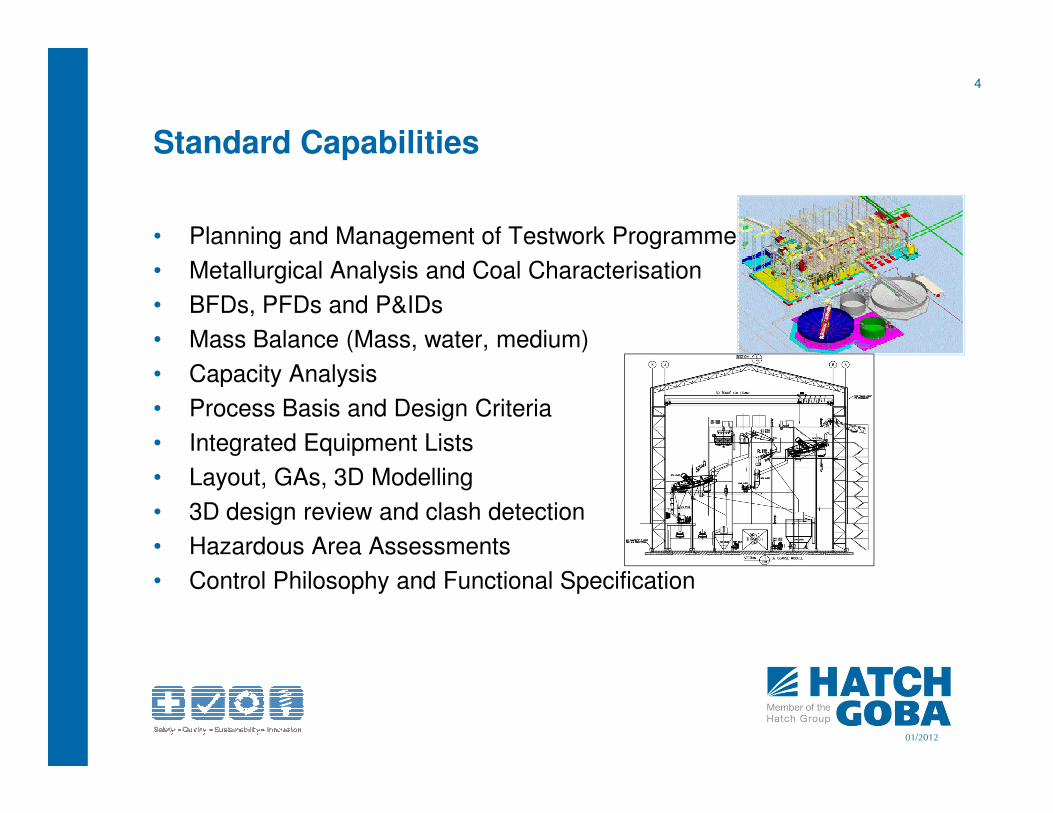
Standard Capabilities
• Planning and Management of Testwork Programme
• Metallurgical Analysis and Coal Characterisation
• BFDs, PFDs and P&IDs
• Mass Balance (Mass, water, medium)
• Capacity Analysis
• Process Basis and Design Criteria
01/2012
• Process Basis and Design Criteria
• Integrated Equipment Lists
• Layout, GAs, 3D Modelling
• 3D design review and clash detection
• Hazardous Area Assessments
• Control Philosophy and Functional Specification
5
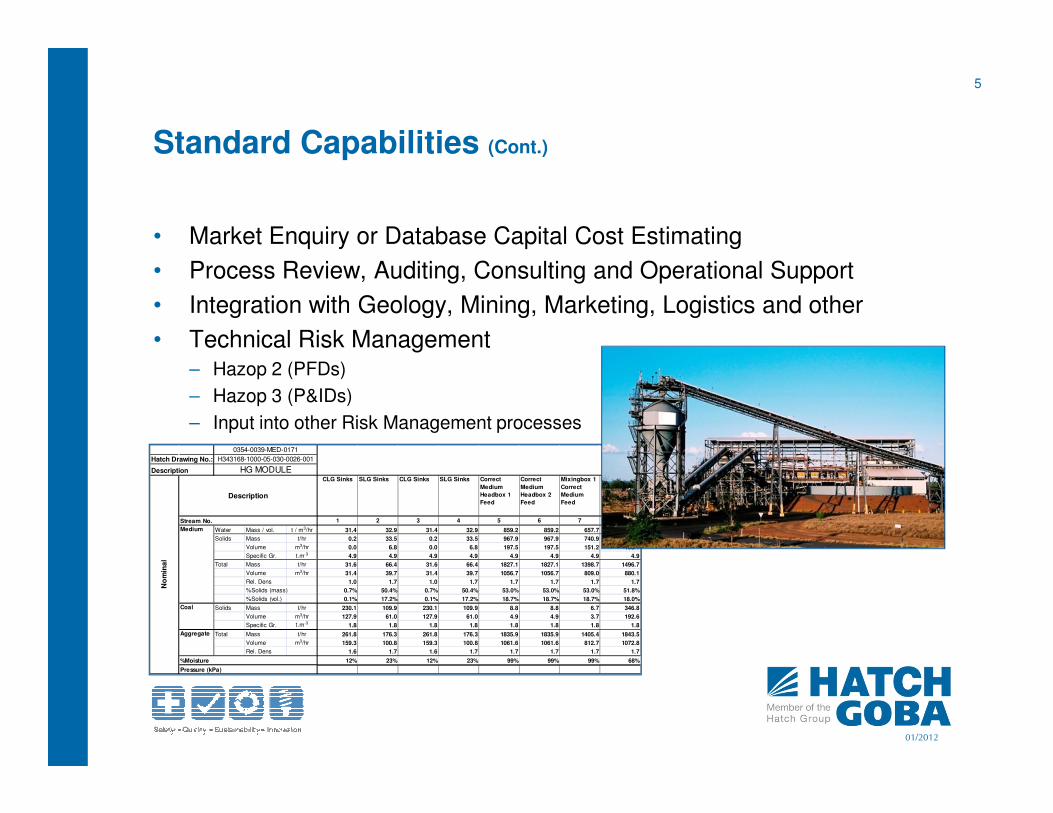
Standard Capabilities (Cont.)
• Market Enquiry or Database Capital Cost Estimating
• Process Review, Auditing, Consulting and Operational Support
• Integration with Geology, Mining, Marketing, Logistics and other
• Technical Risk Management– Hazop 2 (PFDs)
– Hazop 3 (P&IDs)
01/2012
– Input into other Risk Management processes
Hatch Drawing No.:
DescriptionCLG Sinks SLG Sinks CLG Sinks SLG Sinks Correct
Medium
Headbox 1
Feed
Correct
Medium
Headbox 2
Feed
Mixingbox 1
Correct
Medium
Feed
Mixingbox 1
Feed
1 2 3 4 5 6 7 8
Water Mass / vol. t / m3/hr 31.4 32.9 31.4 32.9 859.2 859.2 657.7 722.0
Solids Mass t/hr 0.2 33.5 0.2 33.5 967.9 967.9 740.9 774.7
Volume m3/hr 0.0 6.8 0.0 6.8 197.5 197.5 151.2 158.1
Specific Gr. t.m-3 4.9 4.9 4.9 4.9 4.9 4.9 4.9 4.9
Total Mass t/hr 31.6 66.4 31.6 66.4 1827.1 1827.1 1398.7 1496.7
Volume m3/hr 31.4 39.7 31.4 39.7 1056.7 1056.7 809.0 880.1
Rel. Dens 1.0 1.7 1.0 1.7 1.7 1.7 1.7 1.7
%Solids (mass) 0.7% 50.4% 0.7% 50.4% 53.0% 53.0% 53.0% 51.8%
%Solids (vol.) 0.1% 17.2% 0.1% 17.2% 18.7% 18.7% 18.7% 18.0%
Solids Mass t/hr 230.1 109.9 230.1 109.9 8.8 8.8 6.7 346.8
Volume m3/hr 127.9 61.0 127.9 61.0 4.9 4.9 3.7 192.6
Specific Gr. t.m-3 1.8 1.8 1.8 1.8 1.8 1.8 1.8 1.8
Total Mass t/hr 261.8 176.3 261.8 176.3 1835.9 1835.9 1405.4 1843.5
Volume m3/hr 159.3 100.8 159.3 100.8 1061.6 1061.6 812.7 1072.8
Rel. Dens 1.6 1.7 1.6 1.7 1.7 1.7 1.7 1.7
12% 23% 12% 23% 99% 99% 99% 68%
Pressure (kPa)
No
min
al
Description
Stream No.
Medium
Coal
Aggregate
%Moisture
0354-0039-MED-0171
H343168-1000-05-030-0026-001
HG MODULE