Embed Size (px)
Citation preview

Chapter 16
339
Mind on Statistics
Chapter 16
Section 16.1
1. Which of the following is not one of the assumptions made in the analysis of variance?
A. Each sample is an independent random sample.
B. The distribution of the response variable is a normal curve within each population.
C. The different populations all have the same mean.
D. The different populations all have the same standard deviation .
KEY: C
2. Which one of the following choices describes a problem for which an analysis of variance would be
appropriate?
A. Comparing the proportion of successes for three different treatments of anxiety. Each treatment is tried on
100 patients.
B. Analyzing the relationship between high school GPA and college GPA.
C. Comparing the mean birth weights of newborn babies for three different racial groups.
D. Analyzing the relationship between gender and opinion about capital punishment (favor or oppose).
KEY: C
3. What procedure is used to test whether or not three or more population means are equal?
A. Analysis of correlation
B. 3-sample t-test
C. Chi-square test
D. Analysis of variance F-test
KEY: D
4. Which of the following is a research question that could be addressed using a one-way analysis of variance?
A. Does mean blood pressure differ for three different age groups?
B. Does the variance of blood pressure differ for three different age groups?
C. Are the proportions of people who oppose capital punishment different for three different age groups?
D. Is there a relationship between political party preference and age?
KEY: A
5. Which of these situations could be analyzed with a one-way analysis of variance?
A. The relationship between gender (male or female) and opinion about the death penalty (favor, oppose,
uncertain)
B. The relationship between weight and height for 12-year old girls
C. A comparison of four different age groups with regard to mean hours of watching television per day
D. A comparison of four different age groups with regard to proportion that opposes legalization of marijuana
KEY: C
Chapter 16
340
6. Ninety people with high cholesterol are randomly divided into three groups of thirty, and a different treatment
program for decreasing cholesterol is assigned to each group. The response variable is the change in cholesterol
level after two months of treatment. An analysis of variance will be used to compare the three treatments. What
null hypothesis is tested by this F-test?
A. The sample variances are equal for the three treatment groups.
B. The population variances are equal for the three treatments.
C. The sample means are equal for the three treatment groups.
D. The population means are equal for the three treatments
KEY: D
7. A one-way analysis of variance will be done to compare systolic blood pressures in three different age groups.
What is the correct statement of the null hypothesis?
A. 321
B. 321
C. 321 xxx
D. 321 xxx
KEY: A
8. Which of the following statements is not true about the F-test in one-way analysis of variance?
A. The F-statistic can never be a negative number.
B. The numerator degrees of freedom = number of groups in the study 1
C. The denominator degrees of freedom = total sample size – number of groups.
D. An F-distribution is a symmetric distribution.
KEY: D
Questions 9 and 10: A shopper wanted to test whether there was a difference in the average waiting times at the
check-out counter among 5 different supermarkets. She selected a random sample of 20 shoppers from each of the
five supermarkets.
9. What is the null hypothesis for this situation?
A. The average waiting time to check out is 25 minutes for all five supermarkets.
B. The average waiting time to check out is the same for all five supermarkets.
C. The average waiting time for each of the 100 shoppers is different.
D. The average waiting time to check out is not the same for all five supermarkets.
KEY: B
10. What is the alternative hypothesis for this situation?
A. The average waiting time to check out is 25 minutes for all five supermarkets.
B. The average waiting time to check out is the same for all five supermarkets.
C. The average waiting time for each of the 100 shoppers is different.
D. The average waiting time to check out is not the same for all five supermarkets.
KEY: D
Chapter 16
341
Questions 11 and 12: A student wanted to test whether there was a difference in the mean daily hours of study for
students living in four different dormitories. She selected a random sample of 50 students from each of the four
dormitories.
11. What is the null hypothesis for this situation?
A. The mean daily hours of study is 3 hours for each dormitory.
B. The mean daily hours of study is the same for each dormitory.
C. The mean daily hours of study is different for each of the 200 students in the sample.
D. The mean daily hours of study is not the same for all four dormitories.
KEY: B
12. What is the alternative hypothesis for this situation?
A. The mean daily hours of study is 3 hours for each dormitory.
B. The mean daily hours of study is the same for each dormitory.
C. The mean daily hours of study is different for each of the 200 students in the sample.
D. The mean daily hours of study is not the same for all four dormitories.
KEY: D
13. When multiple tests are done in analysis of variance, the family error rate is
A. the smallest p-value among the tests in the set.
B. the probability of making one or more type 2 errors among the tests.
C. the probability of not rejecting the null hypothesis when the null hypothesis is true.
D. the probability of making one or more type 1 errors among the tests.
KEY: D
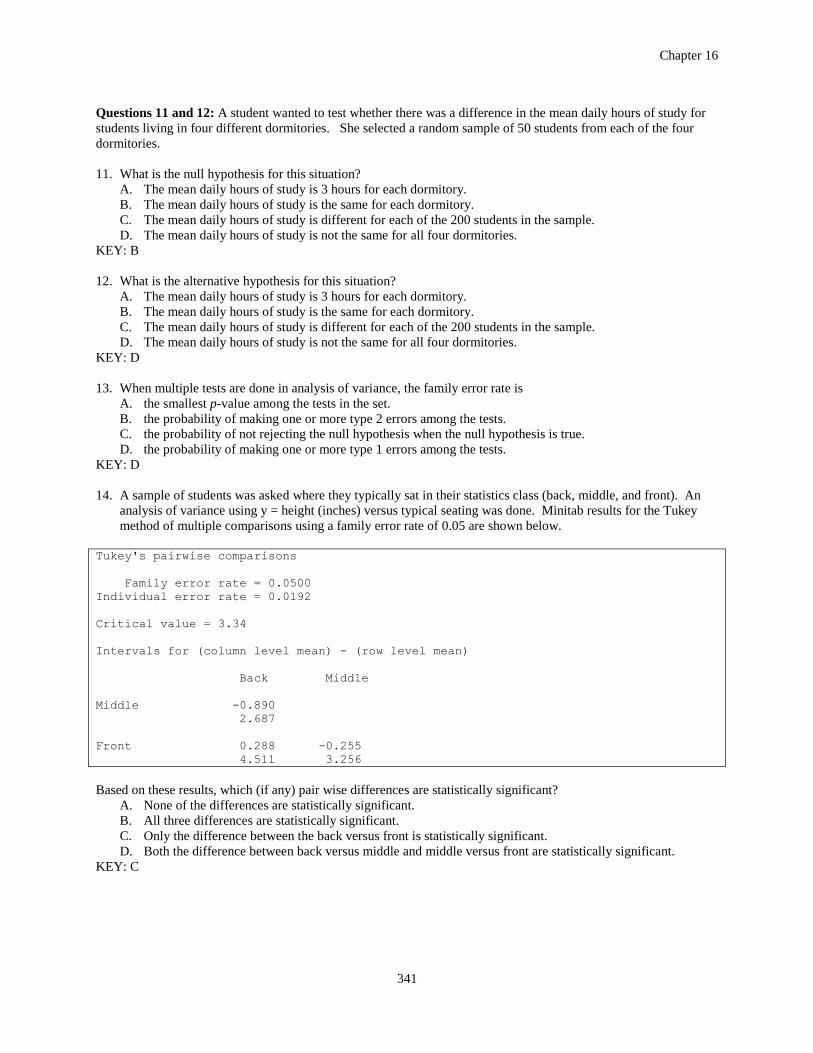
14. A sample of students was asked where they typically sat in their statistics class (back, middle, and front). An
analysis of variance using y = height (inches) versus typical seating was done. Minitab results for the Tukey
method of multiple comparisons using a family error rate of 0.05 are shown below.
Tukey's pairwise comparisons
Family error rate = 0.0500
Individual error rate = 0.0192
Critical value = 3.34
Intervals for (column level mean) - (row level mean)
Back Middle
Middle -0.890
2.687
Front 0.288 -0.255
4.511 3.256
Based on these results, which (if any) pair wise differences are statistically significant?
A. None of the differences are statistically significant.
B. All three differences are statistically significant.
C. Only the difference between the back versus front is statistically significant.
D. Both the difference between back versus middle and middle versus front are statistically significant.
KEY: C
Chapter 16
342
Questions 15 to 18: A company that owns five resort hotels wants to compare guest satisfaction across the hotels.
For each hotel, the company's research department randomly sampled 21 people who had stayed at the hotel during
the past month and asked them to rate their expectation of the hotel before their stay and to rate the quality of their
actual stay at the hotel. Both observations used a rating scale of 0 to 10 with 0 = “very poor” and 10 = “excellent”.
For each guest, the researchers calculated a performance gap score, defined as the difference between a guest’s prior
expectation rating and actual quality rating.
15. Identify the response variable and the explanatory variable.
KEY: The response variable is the performance gap score (the difference between the guest’s prior expectation
rating and actual quality of stay rating). The explanatory variable (used to classify the groups) is the resort
hotel (with 5 levels).
16. How many guests were in the study?
KEY: The total number of guests in this study is N = 5*21 = 105.
17. What are the degrees of freedom of the F-distribution if we were to use an ANOVA to compare the
population means?
KEY: Numerator df = 5-1 = 4 and Denominator df = 105-5 = 100
18. Suppose the F-statistic for comparing the five means is F = 4.5. What can you say about the corresponding
p-value?
KEY: Using Table A.4 (with 4 and 100 degrees of freedom) the 5% critical value is 2.46 and the 1% critical value
is 3.51. Since the observed statistic value of 4.5 is even larger than the 1% critical value of 3.51, we can say
the p-value is less than 0.01. Using a statistical calculator, Excel or some other statistical software, the exact
p-value can be found to be 0.002197.
Chapter 16
343
Section 16.2
19. In a one-way analysis of variance, the “Sum of Squares for Groups” is a measure of the
A. variation among observed sample standard deviations
B. variation among observed sample sizes
C. variation among observed sample means
D. variation among individuals within a group
KEY: C
20. In a one-way analysis of variance, the “Sum of Squared Errors” is a measure of the
A. variation among population means
B. variation among individuals within groups
C. variation among observed sample means
D. variation among sample sizes
KEY: B
21. When a one-way analysis of variance test is done, what probability distribution is used to find the
p-value?
A. F-distribution
B. normal distribution
C. Chi-square distribution
D. t-distribution
KEY: A
Questions 22 to 25: A study compared testosterone levels among athletes in four sports: soccer, track, Lacrosse, and
water polo. The total sample size was n =30 (10 soccer, 10 track, 5 Lacrosse, and 5 water polo). A one-way analysis
of variance was used to compare the population mean levels for the four sports.
22. What are the numerator and denominator degrees of freedom for the F-test?
A. 10 for numerator and 30 for denominator.
B. 3 for numerator and 29 for denominator.
C. 3 for numerator and 26 for denominator.
D. None of the above.
KEY: C
23. The sum of squared errors is SS Error = 100. What is the value of the Mean Square Error (MS Error)?
A. 10
B. 3.45
C. 3.85
D. None of the above.
KEY: C
24. The sum of squares for groups is SS Groups = 60. What is the Mean Square for groups (MS Groups)?
A. 15
B. 20
C. 60
D. None of the above.
KEY: B
25. The p-value for the F-test is = 0.02. Using the = 0.05 significance level, what is the conclusion?
A. The null hypothesis is not rejected: the means are not significantly different.
B. The null hypothesis is not rejected: the means are significantly different.
C. The null hypothesis is rejected: the means are not significantly different.
D. The null hypothesis is rejected: the means are significantly different.
KEY: D
Chapter 16
344
Questions 26 to 29: A study compared grade point averages (GPA) for students in a class: students were divided by
6 locations where they usually sat during lecture (i.e. left or right front, left or right center, left or right rear). A total
sample size of 12 students was studied (2 students from each section) using one-way analysis of variance.
26. What are the numerator and denominator degrees of freedom for the F-test?
A. 6 for numerator and 12 for denominator.
B. 5 for numerator and 11 for denominator.
C. 5 for numerator and 6 for denominator.
D. None of the above.
KEY: C
27. The Error Sum of Squares is SS Error = 50. What is the Mean Square Error (MS Error)?
A. 4.17
B. 8.33
C. 10.00
D. None of the above.
KEY: B
28. The sum of squares for groups is SS Groups = 60. What is the Mean Square for groups (MS Groups)?
A. 10
B. 12
C. 30
D. None of the above.
KEY: B
29. The p-value for the F-test is 0.46. If the significance level = 0.05, what is the conclusion?
A. The null hypothesis is not rejected so we cannot say the population means are different.
B. The null hypothesis is not rejected so we can say the population means are different.
C. The null hypothesis is rejected so we cannot say the population means are different.
D. The null hypothesis is rejected so we can say the population means are different.
KEY: A
Questions 30 to 33: A study compared grade point averages (GPA) among students in 4 different majors (English,
History, Statistics, and Art) using analysis of variance. A total sample size of 20 students (5 in each major) was
studied.
30. What are the numerator and denominator degrees of freedom for the F-test?
A. 5 for numerator and 20 for denominator.
B. 4 for numerator and 79 for denominator.
C. 3 for numerator and 16 for denominator.
D. None of the above.
KEY: C
31. The Error Sum of Squares is SS Error = 64. What is the Mean Square Error (MS Error)?
A. 3.2
B. 4
C. 16
D. None of the above.
KEY: B
32. The sum of squares for groups is SS Groups = 60. What is the Mean Square for groups (MS Groups)?
A. 3
B. 15
C. 20
D. None of the above.
KEY: C
Chapter 16
345
33. The p-value for the F-test is 0.013. If the significance level = 0.05, what is the conclusion from the analysis of
variance?
A. The null hypothesis is not rejected; the sample means are not significantly different.
B. The null hypothesis is not rejected; the sample means are significantly different.
C. The null hypothesis is rejected; the sample means are not significantly different.
D. The null hypothesis is rejected; the sample means are significantly different.
KEY: D
Questions 34 to 37: A study compared weight loss among 5 different diet programs. A total sample size of 25
people was studied (5 people from each program) using one-way analysis of variance.
34. What are the numerator and denominator degrees of freedom for the F-test?
A. 5 for numerator and 25 for denominator.
B. 5 for numerator and 24 for denominator.
C. 4 for numerator and 20 for denominator.
D. None of the above.
KEY: C
35. The Error Sum of Squares is SS Error = 40. What is the Mean Square Error (MS Error)?
A. 2
B. 4
C. 8
D. None of the above.
KEY: A
36. The sum of squares for groups is SS Groups = 80. What is the Mean Square for groups (MS Groups)?
A. 4
B. 5
C. 20
D. None of the above.
KEY: C
37. The p-value of the F-test is 0.327. If the significance level = 0.05, what is the conclusion from the analysis of
variance?
A. The null hypothesis is not rejected; the sample means are not significantly different.
B. The null hypothesis is not rejected; the sample means are significantly different.
C. The null hypothesis is rejected; the sample means are not significantly different.
D. The null hypothesis is rejected; the sample means are significantly different.
KEY: A
Questions 38 to 40: Twenty students were randomly assigned to one of four exercise programs (5 students in each
program), and the mean weight losses for the four programs were compared using one-way analysis of variance.
The mean square error (MS Error) was 40. The mean weight loss for the first program was 1x = 5 pounds.
38. What are the degrees of freedom for the t* multiplier for a confidence interval for ,1 the population mean
weight loss for the first program.
A. 3
B. 15
C. 16
D. 20
KEY: C
Chapter 16
346
39. What is the standard error of 1x , the sample mean weight loss in the first program?
A. 0.32
B. 1.41
C. 2.83
D. None of the above
KEY: C
40. What is a 90% confidence interval for the mean weight loss from the first program?
A. (4.44, 5.56)
B. (2.53, 7.47)
C. (0.05, 9.95)
D. None of the above
KEY: C
Questions 41 to 43: 12 corn plants were randomly assigned to one of four plots of land (3 plants in each plot), and
the mean heights of the plants were compared for the four plots using one-way analysis of variance. The mean
square error (MS Error) was 20. The average height of the corn plants in the first plot was 1x = 60 inches.
41. What are the degrees of freedom for the t* multiplier for a confidence interval for ,1 the average height of
corn plants grown in the first plot?
A. 8
B. 12
C. 20
D. None of the above
KEY: A
42. What is the standard error of the sample mean weight loss in the first program ( 1x )?
A. 4.47
B. 1.73
C. 2.58
D. None of the above
KEY: C
43. What is a 99% confidence interval for the mean weight loss from the first program?
A. (51.3, 68.7)
B. (54.2, 65.8)
C. (45.0, 75.0)
D. None of the above
KEY: A
Chapter 16
347
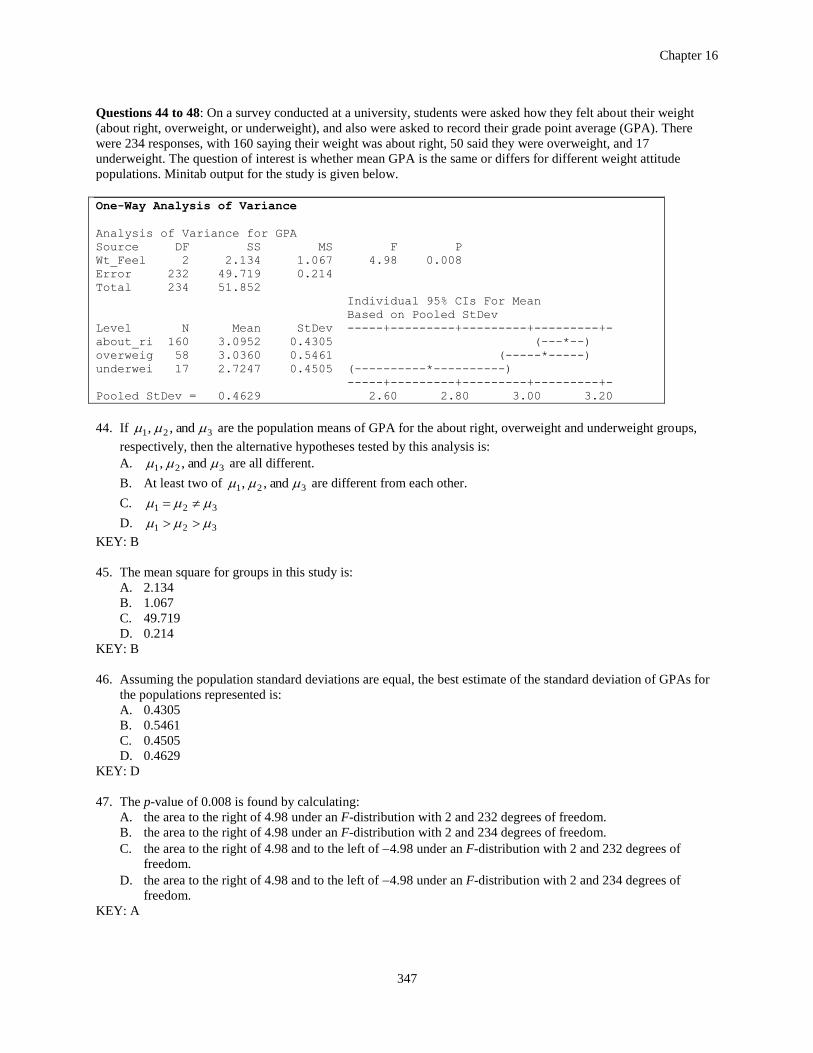
Questions 44 to 48: On a survey conducted at a university, students were asked how they felt about their weight
(about right, overweight, or underweight), and also were asked to record their grade point average (GPA). There
were 234 responses, with 160 saying their weight was about right, 50 said they were overweight, and 17
underweight. The question of interest is whether mean GPA is the same or differs for different weight attitude
populations. Minitab output for the study is given below.
One-Way Analysis of Variance
Analysis of Variance for GPA
Source DF SS MS F P
Wt_Feel 2 2.134 1.067 4.98 0.008
Error 232 49.719 0.214
Total 234 51.852
Individual 95% CIs For Mean
Based on Pooled StDev
Level N Mean StDev -----+---------+---------+---------+-
about_ri 160 3.0952 0.4305 (---*--)
overweig 58 3.0360 0.5461 (-----*-----)
underwei 17 2.7247 0.4505 (----------*----------)
-----+---------+---------+---------+-
Pooled StDev = 0.4629 2.60 2.80 3.00 3.20
44. If 321 and,, are the population means of GPA for the about right, overweight and underweight groups,
respectively, then the alternative hypotheses tested by this analysis is:
A. 321 and,, are all different.
B. At least two of 321 and,, are different from each other.
C. 321
D. 321
KEY: B
45. The mean square for groups in this study is:
A. 2.134
B. 1.067
C. 49.719
D. 0.214
KEY: B
46. Assuming the population standard deviations are equal, the best estimate of the standard deviation of GPAs for
the populations represented is:
A. 0.4305
B. 0.5461
C. 0.4505
D. 0.4629
KEY: D
47. The p-value of 0.008 is found by calculating:
A. the area to the right of 4.98 under an F-distribution with 2 and 232 degrees of freedom.
B. the area to the right of 4.98 under an F-distribution with 2 and 234 degrees of freedom.
C. the area to the right of 4.98 and to the left of 4.98 under an F-distribution with 2 and 232 degrees of
freedom.
D. the area to the right of 4.98 and to the left of 4.98 under an F-distribution with 2 and 234 degrees of
freedom.
KEY: A
Chapter 16
348
48. What is the appropriate conclusion to draw from this analysis?
A. If a student is underweight he (she) should gain weight in order to raise his (her) GPA.
B. Overweight students should go on a diet to lose weight because this will result in a higher GPA.
C. There is no significant difference among the mean GPAs of students in the three weight attitude groups.
D. There is a significant difference among the mean GPAs of students in the three weight attitude groups.
KEY: D
Questions 49 and 50: Five different training programs for improving endurance are compared. Forty individuals are
randomly divided into five groups of n = 8 each and a different training program is assigned to each group. After
two months, the improvement in endurance is recorded for each participant.
49. A one-way analysis of variance is used to compare the five training programs, and the resulting
p-value is 0.023. At a significance level of 0.05, the appropriate conclusion about mean improvement in
endurance is that it
A. is the same for the five training programs.
B. is different for each of the five training programs
C. differs for at least two of the five training programs.
D. is significantly better for one of the training programs than for the other four.
KEY: C
50. The p-value in this situation would be found using
A. an F-distribution with 39 degrees of freedom.
B. an F-distribution with 5 and 8 degrees of freedom.
C. an F-distribution with 4 and 3 degrees of freedom.
D. an F-distribution with 4 and 35 degrees of freedom.
KEY: D
51. In a student survey, two of the questions asked are:
(1) How many times do you pray per month?
(2) What is the importance of religion in your life (fairly important, not very important, or very
important)?
Descriptive statistics for the three different categories of the importance of religion are given in the following
table.
Importance Sample size Mean Std. Dev.
Fairly 206 25.0 224.1
Not very 252 3.3 7.1
Very 273 38.8 64.3
To compare the times of praying for the three groups, an analysis of variance F-test
A. can be done because the sample means are unequal.
B. should not be done because the sample means are unequal.
C. should not be done because the sample standard deviations differ by so much.
D. can be done because the data probably have a normal distribution.
KEY: C
Chapter 16
349
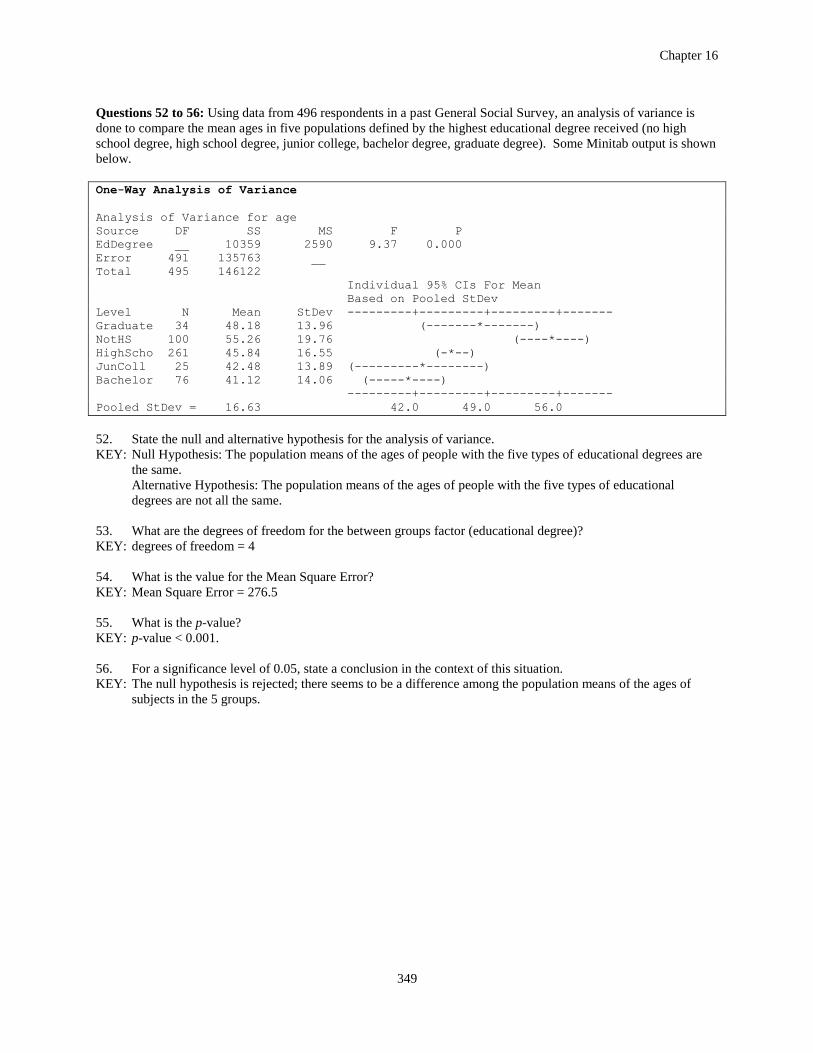
Questions 52 to 56: Using data from 496 respondents in a past General Social Survey, an analysis of variance is
done to compare the mean ages in five populations defined by the highest educational degree received (no high
school degree, high school degree, junior college, bachelor degree, graduate degree). Some Minitab output is shown
below.
One-Way Analysis of Variance
Analysis of Variance for age
Source DF SS MS F P
EdDegree __ 10359 2590 9.37 0.000
Error 491 135763 __
Total 495 146122
Individual 95% CIs For Mean
Based on Pooled StDev
Level N Mean StDev ---------+---------+---------+-------
Graduate 34 48.18 13.96 (-------*-------)
NotHS 100 55.26 19.76 (----*----)
HighScho 261 45.84 16.55 (-*--)
JunColl 25 42.48 13.89 (---------*--------)
Bachelor 76 41.12 14.06 (-----*----)
---------+---------+---------+-------
Pooled StDev = 16.63 42.0 49.0 56.0
52. State the null and alternative hypothesis for the analysis of variance.
KEY: Null Hypothesis: The population means of the ages of people with the five types of educational degrees are
the same.
Alternative Hypothesis: The population means of the ages of people with the five types of educational
degrees are not all the same.
53. What are the degrees of freedom for the between groups factor (educational degree)?
KEY: degrees of freedom = 4
54. What is the value for the Mean Square Error?
KEY: Mean Square Error = 276.5
55. What is the p-value?
KEY: p-value < 0.001.
56. For a significance level of 0.05, state a conclusion in the context of this situation.
KEY: The null hypothesis is rejected; there seems to be a difference among the population means of the ages of
subjects in the 5 groups.
Chapter 16
350
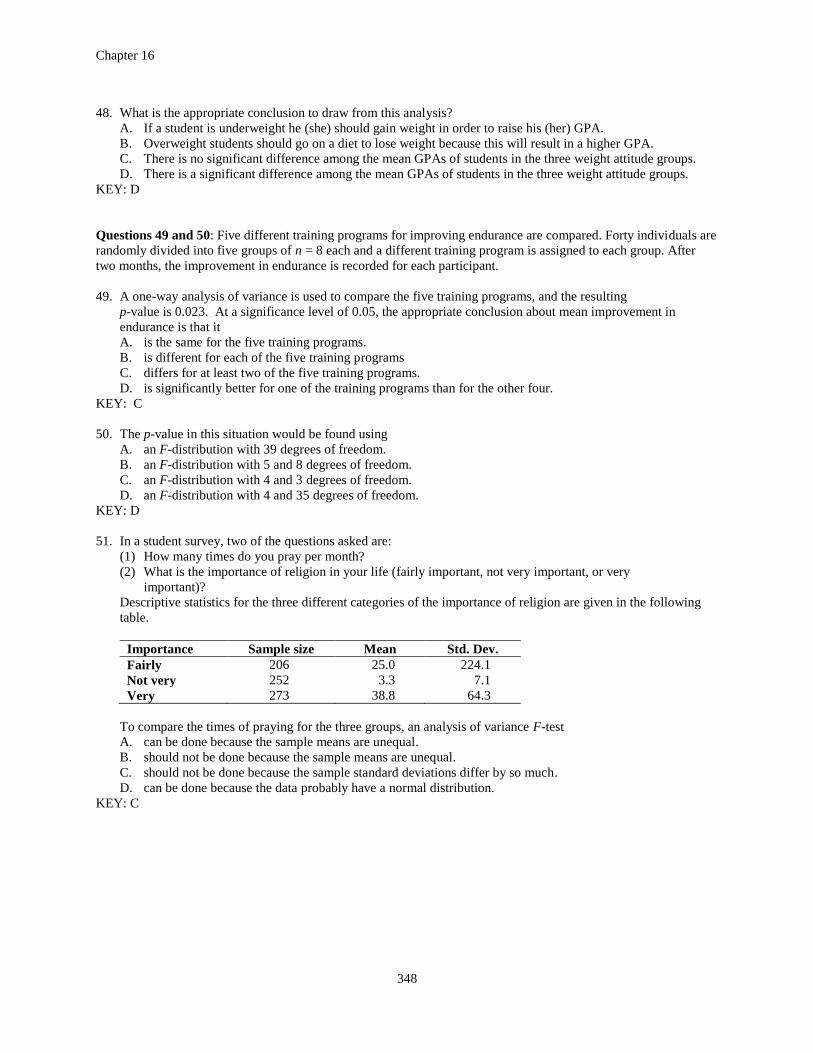
Questions 57 to 61: A researcher is hired by a company that sells appliances to investigate whether there is any
difference in the average ratings that customers give to a DVD player between three different age groups. Sixty-
eight people were asked to fill out a questionnaire and rate the DVD player by answering various questions (easy to
use? looks nice? manual understandable?) after using it for a week. The scores (a value between 1 and 50) were
recorded and a one-way ANOVA was performed. Partial SPSS output is provided below.
ANOVA
Total DVD assessment
701.83 2 350.91 .. .000059
2007.87
2709.69
Between Groups
Within Groups
Total
Sum of
Squares df
Mean
Square F Sig.
57. One of the assumptions in ANOVA is that the standard deviation for the response (DVD assessment score)
for each age group is the same. Give an estimate of that common standard deviation.
KEY: 5.56
58. What is the numerical value of the test statistic that we would calculate to assess equality of the average DVD
assessment scores for the three different age groups? Include the symbol we use to represent this test statistic
in your answer.
KEY: F = 11.36
59. Using a 5% significance level, what is the conclusion of the analysis of variance?
KEY: It appears that the average DVD assessment scores are not the same for the three different age groups.
60. Which distribution was used to calculate the p-value of 0.000059? Include all details of this distribution.
KEY: An F-distribution with 2 and 65 degrees of freedom or F(2, 65).
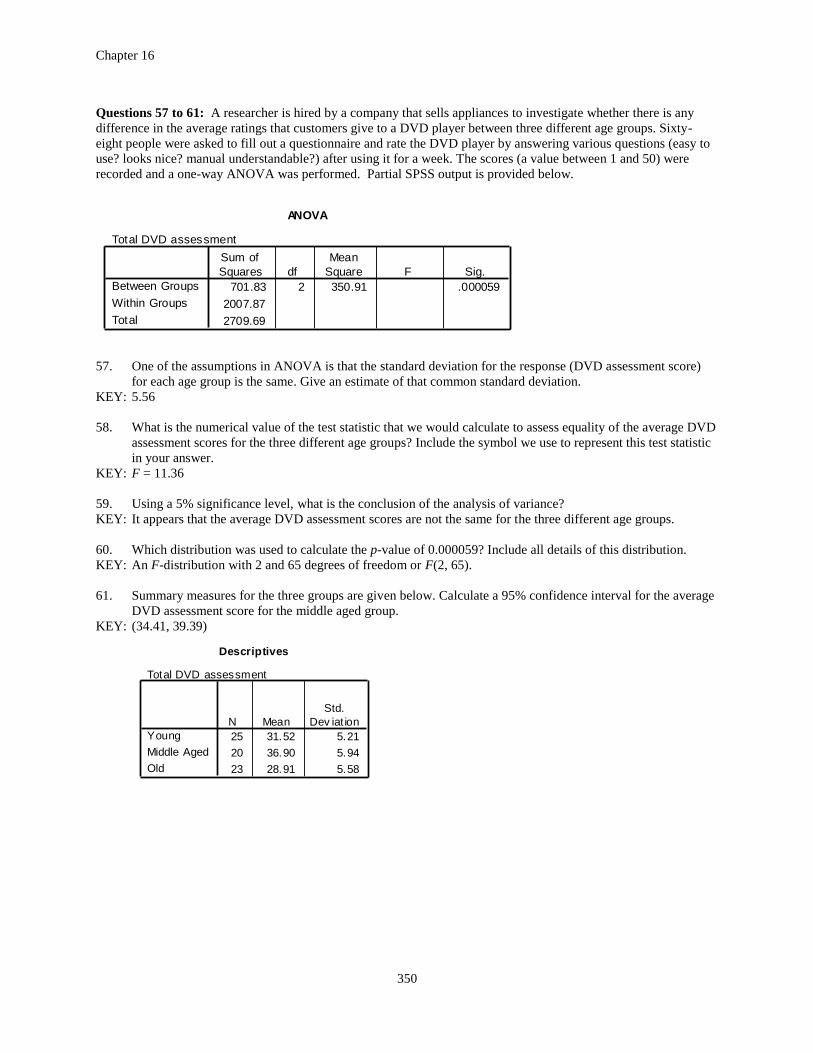
61. Summary measures for the three groups are given below. Calculate a 95% confidence interval for the average
DVD assessment score for the middle aged group.
KEY: (34.41, 39.39)
Descriptives
Total DVD assessment
25 31.52 5.21
20 36.90 5.94
23 28.91 5.58
Young
Middle Aged
Old
N Mean
Std.
Dev iat ion
Chapter 16
351
Questions 62 to 66. A study was conducted to compare the mean sulfur dioxide concentrations for three cities.
Independent random samples were obtained from each city and the concentration levels along with some summaries
are provided below:
City I: 2, 1, 3 sample mean = 2
City II: 4, 6, 8 sample mean = 6 overall sample mean = 4
City III: 3, 6, 3 sample mean = 4
The researcher wishes to perform an ANOVA to assess if the population mean concentration levels for the three
cities are the same. Part of the ANOVA table for testing this null hypothesis is provided.
62. Some values in the ANOVA table are missing. Complete the ANOVA table. Specifically show your work for
finding the SSGroups (or SS Between Cities)
KEY: SSGroups = SS Between Cities = 3[ (2 – 4)2 + (6 – 4)
2 + (4 – 4)
2 ] = 3[ 4 + 4 + 0 ] = 24
The completed table is below.
63. One of the assumptions in ANOVA is that the standard deviation for the response (sulfur dioxide
concentrations) for each city population be the same. Give an estimate of that common standard deviation.
KEY: 2.667 = 1.634
64. Suppose the necessary assumptions hold. Using a 10% significance level, which of the following is the correct
conclusion?
A. It appears that the mean concentration levels are the same for the three city populations.
B. It appears that at least one of the population mean concentration levels is different.
C. It appears that the population mean concentration levels are all different.
KEY: B
65. Consider the following four statements. Clearly select all that are correct.
A. If this study were repeated many times, the null hypothesis would be true only 6.4% of the time.
B. If this study were repeated many times, we would see an F statistic as large as or larger than that observed
in about 6.4% of the repetitions.
C. If this study were repeated many times and if the population means were all equal, we would see an
F statistic as large as or larger than that observed in about 6.4% of the repetitions.
D. If this study were repeated many times and if the population means were all equal, we would reject the null
hypothesis in about 10% of the repetitions.
KEY: C and D
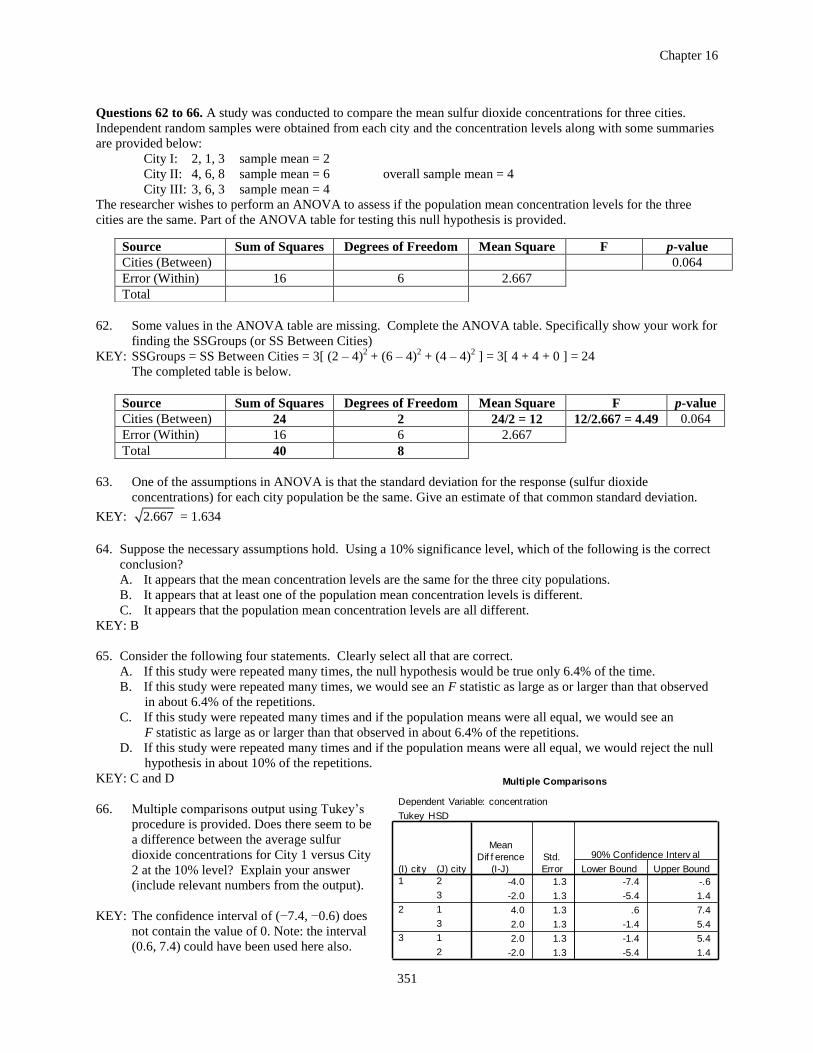
66. Multiple comparisons output using Tukey’s
procedure is provided. Does there seem to be
a difference between the average sulfur
dioxide concentrations for City 1 versus City
2 at the 10% level? Explain your answer
(include relevant numbers from the output).
KEY: The confidence interval of (−7.4, −0.6) does
not contain the value of 0. Note: the interval
(0.6, 7.4) could have been used here also.
Source Sum of Squares Degrees of Freedom Mean Square F p-value
Cities (Between) 0.064
Error (Within) 16 6 2.667
Total
Source Sum of Squares Degrees of Freedom Mean Square F p-value
Cities (Between) 24 2 24/2 = 12 12/2.667 = 4.49 0.064
Error (Within) 16 6 2.667
Total 40 8
Multiple Comparisons
Dependent Variable: concentration
Tukey HSD
-4.0 1.3 -7.4 -.6
-2.0 1.3 -5.4 1.4
4.0 1.3 .6 7.4
2.0 1.3 -1.4 5.4
2.0 1.3 -1.4 5.4
-2.0 1.3 -5.4 1.4
(J) city
2
3
1
3
1
2
(I) city
1
2
3
Mean
Dif f erence
(I-J)
Std.
Error Lower Bound Upper Bound
90% Conf idence Interv al
Chapter 16
352
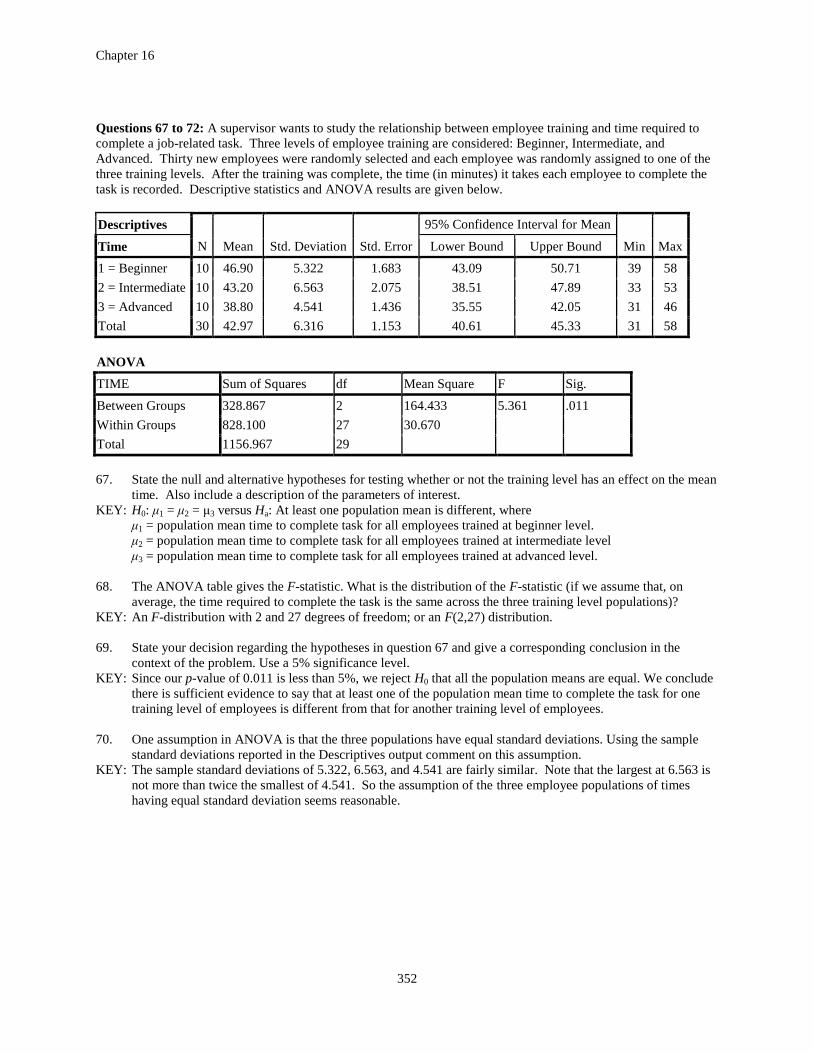
Questions 67 to 72: A supervisor wants to study the relationship between employee training and time required to
complete a job-related task. Three levels of employee training are considered: Beginner, Intermediate, and
Advanced. Thirty new employees were randomly selected and each employee was randomly assigned to one of the
three training levels. After the training was complete, the time (in minutes) it takes each employee to complete the
task is recorded. Descriptive statistics and ANOVA results are given below.
Descriptives
N Mean Std. Deviation Std. Error
95% Confidence Interval for Mean
Min Max Time Lower Bound Upper Bound
1 = Beginner 10 46.90 5.322 1.683 43.09 50.71 39 58
2 = Intermediate 10 43.20 6.563 2.075 38.51 47.89 33 53
3 = Advanced 10 38.80 4.541 1.436 35.55 42.05 31 46
Total 30 42.97 6.316 1.153 40.61 45.33 31 58
ANOVA
TIME Sum of Squares df Mean Square F Sig.
Between Groups 328.867 2 164.433 5.361 .011
Within Groups 828.100 27 30.670
Total 1156.967 29
67. State the null and alternative hypotheses for testing whether or not the training level has an effect on the mean
time. Also include a description of the parameters of interest.
KEY: H0: μ1 = μ2 = μ3 versus Ha: At least one population mean is different, where
μ1 = population mean time to complete task for all employees trained at beginner level.
μ2 = population mean time to complete task for all employees trained at intermediate level
μ3 = population mean time to complete task for all employees trained at advanced level.
68. The ANOVA table gives the F-statistic. What is the distribution of the F-statistic (if we assume that, on
average, the time required to complete the task is the same across the three training level populations)?
KEY: An F-distribution with 2 and 27 degrees of freedom; or an F(2,27) distribution.
69. State your decision regarding the hypotheses in question 67 and give a corresponding conclusion in the
context of the problem. Use a 5% significance level.
KEY: Since our p-value of 0.011 is less than 5%, we reject H0 that all the population means are equal. We conclude
there is sufficient evidence to say that at least one of the population mean time to complete the task for one
training level of employees is different from that for another training level of employees.
70. One assumption in ANOVA is that the three populations have equal standard deviations. Using the sample
standard deviations reported in the Descriptives output comment on this assumption.
KEY: The sample standard deviations of 5.322, 6.563, and 4.541 are fairly similar. Note that the largest at 6.563 is
not more than twice the smallest of 4.541. So the assumption of the three employee populations of times
having equal standard deviation seems reasonable.
Chapter 16
353
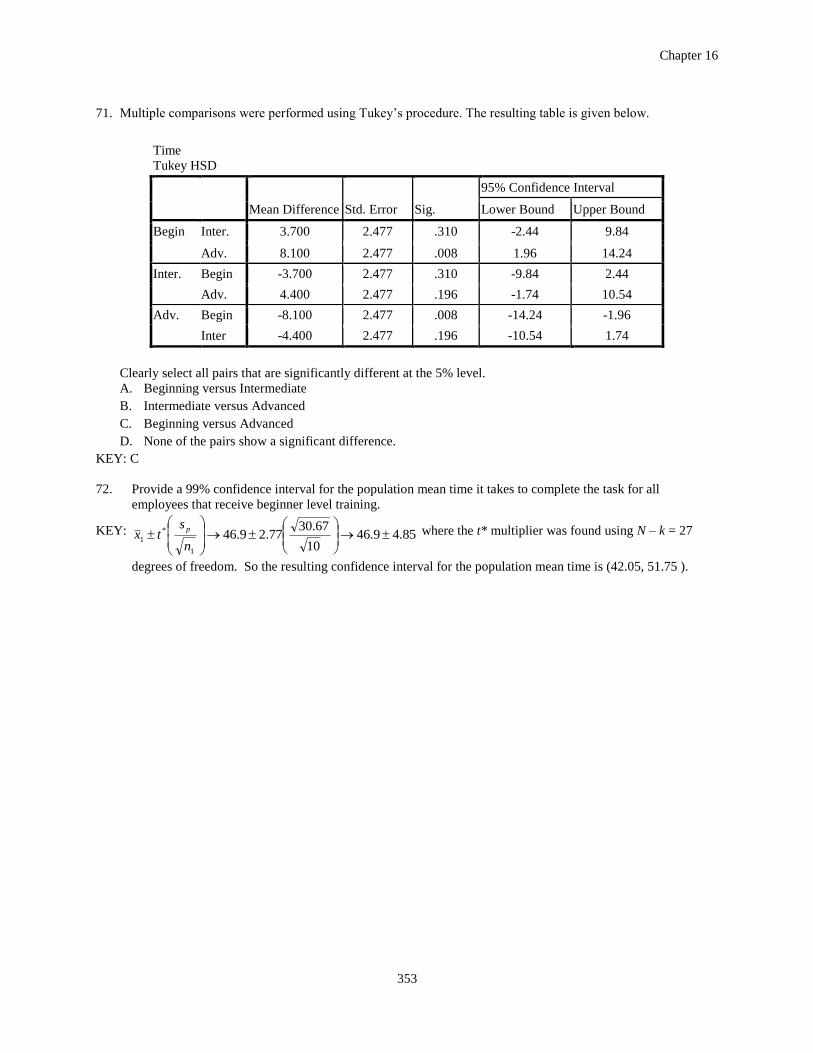
71. Multiple comparisons were performed using Tukey’s procedure. The resulting table is given below.
Time
Tukey HSD
Mean Difference Std. Error Sig.
95% Confidence Interval
Lower Bound Upper Bound
Begin Inter. 3.700 2.477 .310 -2.44 9.84
Adv. 8.100 2.477 .008 1.96 14.24
Inter. Begin -3.700 2.477 .310 -9.84 2.44
Adv. 4.400 2.477 .196 -1.74 10.54
Adv. Begin -8.100 2.477 .008 -14.24 -1.96
Inter -4.400 2.477 .196 -10.54 1.74
Clearly select all pairs that are significantly different at the 5% level.
A. Beginning versus Intermediate
B. Intermediate versus Advanced
C. Beginning versus Advanced
D. None of the pairs show a significant difference.
KEY: C
72. Provide a 99% confidence interval for the population mean time it takes to complete the task for all
employees that receive beginner level training.
KEY: 85.49.4610
67.3077.29.46
1
*
1
n
stx
p where the t* multiplier was found using N – k = 27
degrees of freedom. So the resulting confidence interval for the population mean time is (42.05, 51.75 ).
Chapter 16
354
Section 16.3
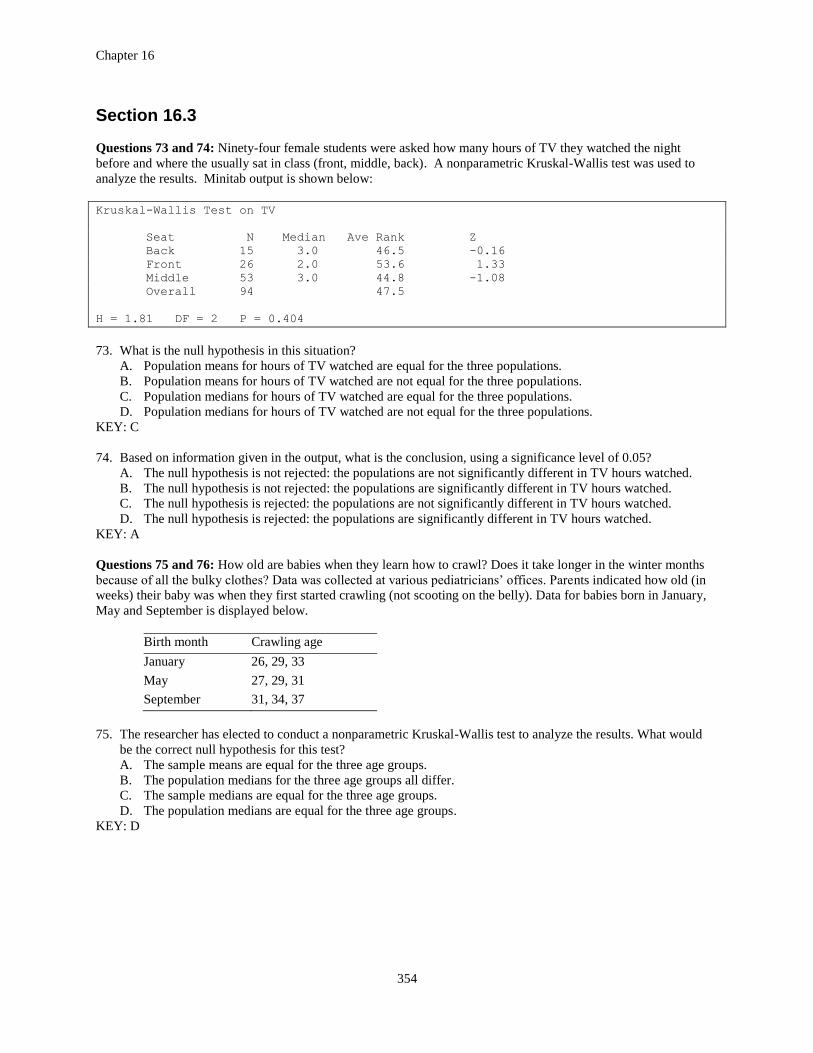
Questions 73 and 74: Ninety-four female students were asked how many hours of TV they watched the night
before and where the usually sat in class (front, middle, back). A nonparametric Kruskal-Wallis test was used to
analyze the results. Minitab output is shown below:
Kruskal-Wallis Test on TV
Seat N Median Ave Rank Z
Back 15 3.0 46.5 -0.16
Front 26 2.0 53.6 1.33
Middle 53 3.0 44.8 -1.08
Overall 94 47.5
H = 1.81 DF = 2 P = 0.404
73. What is the null hypothesis in this situation?
A. Population means for hours of TV watched are equal for the three populations.
B. Population means for hours of TV watched are not equal for the three populations.
C. Population medians for hours of TV watched are equal for the three populations.
D. Population medians for hours of TV watched are not equal for the three populations.
KEY: C
74. Based on information given in the output, what is the conclusion, using a significance level of 0.05?
A. The null hypothesis is not rejected: the populations are not significantly different in TV hours watched.
B. The null hypothesis is not rejected: the populations are significantly different in TV hours watched.
C. The null hypothesis is rejected: the populations are not significantly different in TV hours watched.
D. The null hypothesis is rejected: the populations are significantly different in TV hours watched.
KEY: A
Questions 75 and 76: How old are babies when they learn how to crawl? Does it take longer in the winter months
because of all the bulky clothes? Data was collected at various pediatricians’ offices. Parents indicated how old (in
weeks) their baby was when they first started crawling (not scooting on the belly). Data for babies born in January,
May and September is displayed below.
Birth month Crawling age
January 26, 29, 33
May 27, 29, 31
September 31, 34, 37
75. The researcher has elected to conduct a nonparametric Kruskal-Wallis test to analyze the results. What would
be the correct null hypothesis for this test?
A. The sample means are equal for the three age groups.
B. The population medians for the three age groups all differ.
C. The sample medians are equal for the three age groups.
D. The population medians are equal for the three age groups.
KEY: D
Chapter 16
355
76. The computer was used to analyze the data and the test statistic value was 3.82. At the 5% significance level,
the critical value for this test is 5.99. What is the conclusion?
A. The results are significant and conclude that the median crawling ages appear to be equal for the three age
group populations.
B. The results are not significant and conclude that the median crawling ages appear to be equal for the three
age group populations.
C. The results are significant and conclude that the median crawling ages do not appear to be equal for the
three age group populations.
D. The results are not significant and conclude that the median crawling ages do not appear to be equal for the
three age group populations.
KEY: B
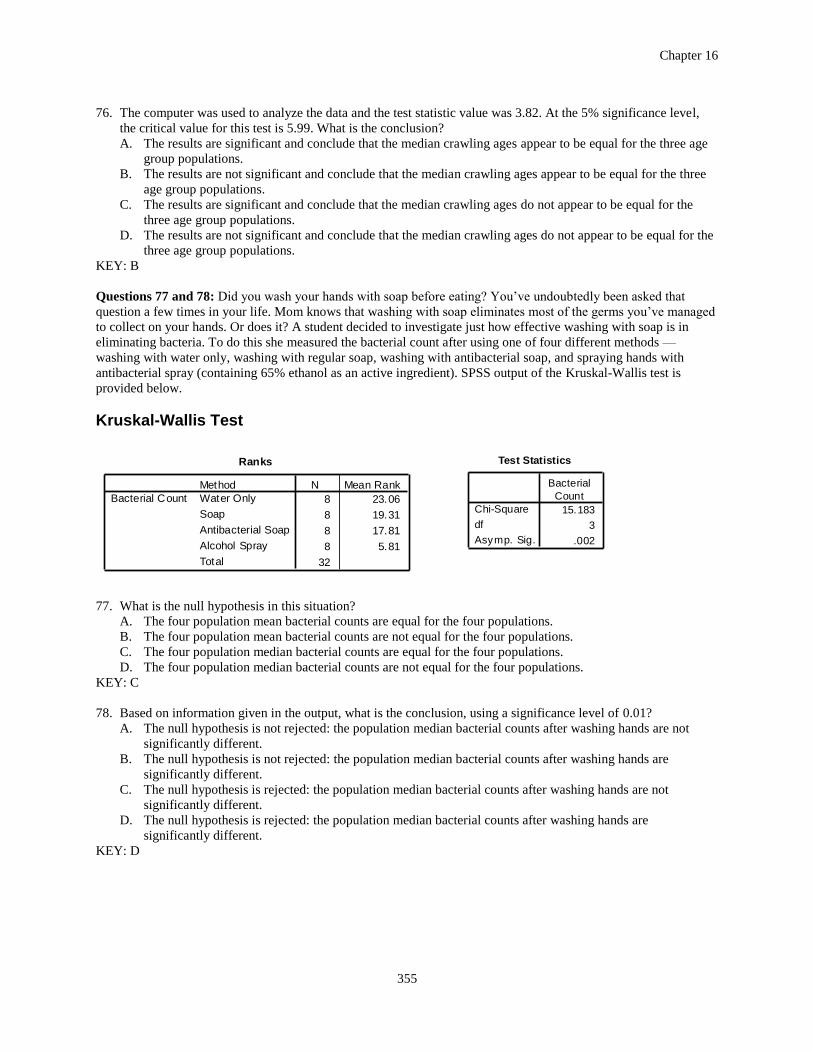
Questions 77 and 78: Did you wash your hands with soap before eating? You’ve undoubtedly been asked that
question a few times in your life. Mom knows that washing with soap eliminates most of the germs you’ve managed
to collect on your hands. Or does it? A student decided to investigate just how effective washing with soap is in
eliminating bacteria. To do this she measured the bacterial count after using one of four different methods —
washing with water only, washing with regular soap, washing with antibacterial soap, and spraying hands with
antibacterial spray (containing 65% ethanol as an active ingredient). SPSS output of the Kruskal-Wallis test is
provided below.
Kruskal-Wallis Test
Ranks
8 23.06
8 19.31
8 17.81
8 5.81
32
Method
Water Only
Soap
Antibacterial Soap
Alcohol Spray
Total
Bacterial Count
N Mean Rank
77. What is the null hypothesis in this situation?
A. The four population mean bacterial counts are equal for the four populations.
B. The four population mean bacterial counts are not equal for the four populations.
C. The four population median bacterial counts are equal for the four populations.
D. The four population median bacterial counts are not equal for the four populations.
KEY: C
78. Based on information given in the output, what is the conclusion, using a significance level of 0.01?
A. The null hypothesis is not rejected: the population median bacterial counts after washing hands are not
significantly different.
B. The null hypothesis is not rejected: the population median bacterial counts after washing hands are
significantly different.
C. The null hypothesis is rejected: the population median bacterial counts after washing hands are not
significantly different.
D. The null hypothesis is rejected: the population median bacterial counts after washing hands are
significantly different.
KEY: D
Test Statistics
15.183
3
.002
Chi-Square
df
Asymp. Sig.
Bacterial
Count
Chapter 16
356
Questions 79 to 82: Using data from 496 respondents in a past General Social Survey, a Kruskal-Wallis test is done
to compare the median ages in five populations defined by the highest educational degree received (no high school
degree, high school degree, junior college, bachelor degree, graduate degree). The Minitab output is provided
below.
Kruskal-Wallis Test on age
degree N Median Ave Rank Z
Graduate 34 46.50 267.0 0.78
NotHS 100 61.00 310.5 4.84
HighScho 261 42.00 240.0 -1.40
JunColl 25 42.00 217.2 -1.12
Bachelor 76 38.50 198.2 -3.32
Overall 496 248.5
H = 30.75 DF = 4 P = 0.000
79. What is the null hypothesis in this situation?
KEY: The null hypothesis is that population medians for the 5 educational groups are all equal.
80. What is the alternative hypothesis in this situation?
KEY: The alternative hypothesis is that population medians for the 5 educational groups are not all equal.
81. What is the p-value?
KEY: p-value < 0.001.
82. At a significance level of 0.05, what is the conclusion?
KEY: The null hypothesis is rejected: the population medians are not all equal.
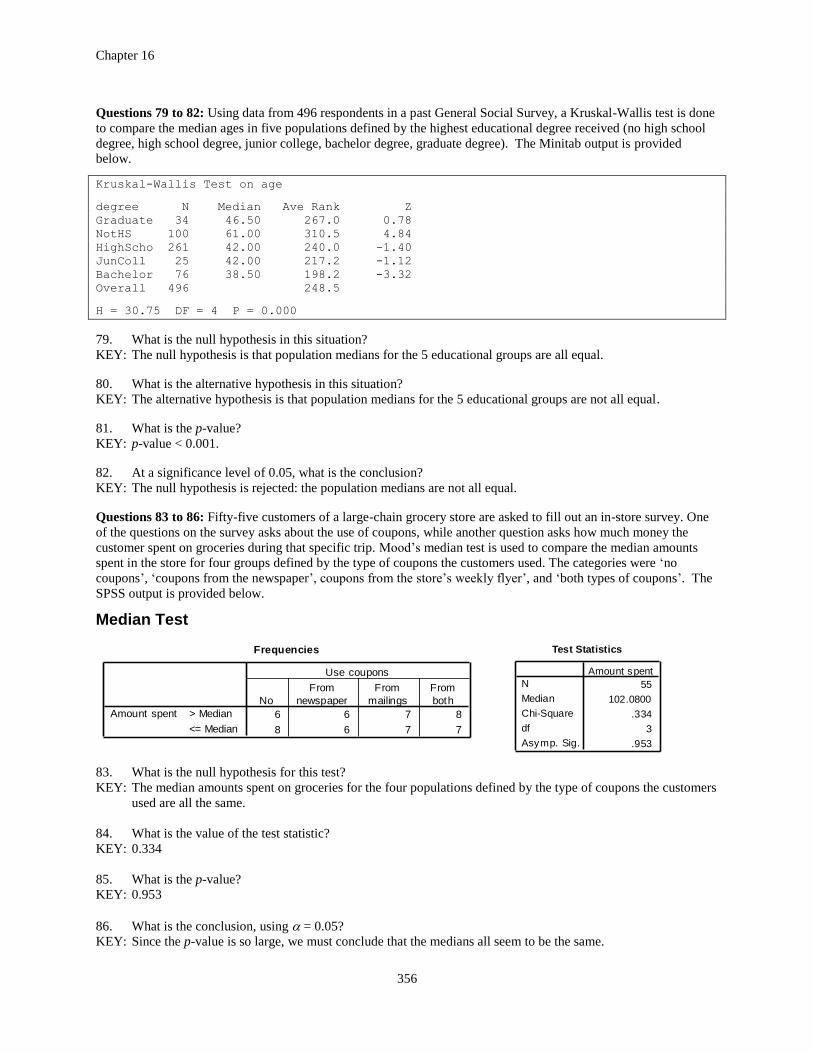
Questions 83 to 86: Fifty-five customers of a large-chain grocery store are asked to fill out an in-store survey. One
of the questions on the survey asks about the use of coupons, while another question asks how much money the
customer spent on groceries during that specific trip. Mood’s median test is used to compare the median amounts
spent in the store for four groups defined by the type of coupons the customers used. The categories were ‘no
coupons’, ‘coupons from the newspaper’, coupons from the store’s weekly flyer’, and ‘both types of coupons’. The
SPSS output is provided below.
Median Test
Frequencies
6 6 7 8
8 6 7 7
> Median
<= Median
Amount spent
No
From
newspaper
From
mailings
From
both
Use coupons
83. What is the null hypothesis for this test?
KEY: The median amounts spent on groceries for the four populations defined by the type of coupons the customers
used are all the same.
84. What is the value of the test statistic?
KEY: 0.334
85. What is the p-value?
KEY: 0.953
86. What is the conclusion, using = 0.05?
KEY: Since the p-value is so large, we must conclude that the medians all seem to be the same.
Test Statistics
55
102.0800
.334
3
.953
N
Median
Chi-Square
df
Asymp. Sig.
Amount spent
Chapter 16
357
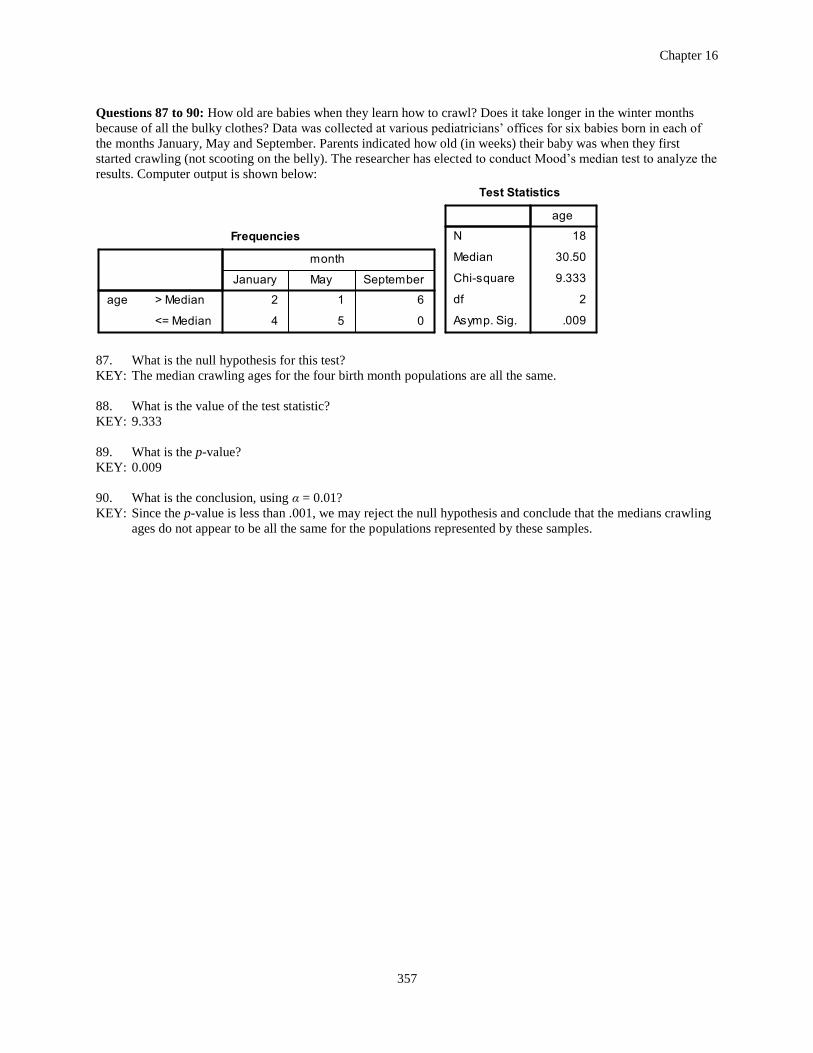
Questions 87 to 90: How old are babies when they learn how to crawl? Does it take longer in the winter months
because of all the bulky clothes? Data was collected at various pediatricians’ offices for six babies born in each of
the months January, May and September. Parents indicated how old (in weeks) their baby was when they first
started crawling (not scooting on the belly). The researcher has elected to conduct Mood’s median test to analyze the
results. Computer output is shown below:
87. What is the null hypothesis for this test?
KEY: The median crawling ages for the four birth month populations are all the same.
88. What is the value of the test statistic?
KEY: 9.333
89. What is the p-value?
KEY: 0.009
90. What is the conclusion, using α = 0.01?
KEY: Since the p-value is less than .001, we may reject the null hypothesis and conclude that the medians crawling
ages do not appear to be all the same for the populations represented by these samples.
Chapter 16
358
Section 16.4
91. A two-way analysis of variance is used to analyze the relationship between
A. a categorical explanatory variable and two quantitative response variables.
B. two categorical explanatory variables and a quantitative response variable.
C. two quantitative explanatory variables and a categorical response variable.
D. a quantitative explanatory variable and two categorical response variables.
KEY: B
Questions 92 to 94: A random sample of 235 students from University X is given a questionnaire about feelings.
One of the questions was: “How do you feel about your height?” The answer categories were: too short, just about
right, or too tall. A total feelings score is also calculated to measure the students’ self worth. The results of the
self worth score will be compared between the three groups defined by their feelings about their height and
between boys and girl. The F-ratio for the interaction between feelings about height and gender is 4.98, with a
p-value of 0.008.
92. How many degrees of freedom are associated with the F-statistic for the interaction effect?
A. 6 and 235
B. 5 and 234
C. 2 and 229
D. 2 and 234
KEY: C
93. Which null hypothesis is tested by the test statistic F = 4.98?
A. H0: The average self worth scores are the same for the populations of boys and girls.
B. H0: The average self worth scores are the same for students who think they are too short, too tall and those
who think their height is just right.
C. H0: The (possible) differences in average self worth scores between boys and girls are equal for the three
populations defined by feelings about height.
D. H0: The (possible) differences in average self worth scores between the three populations defined by
feelings about height differ for boys and girls.
KEY: C
94. How is the p-value of 0.008 obtained?
A. The area to the right of F = 4.98 under the F-distribution.
B. The area to the left of F = 4.98 under the F-distribution.
C. The area left of F = −4.98 and right of F = 4.98 under the F-distribution.
D. The area between F = −4.98 and F = 4.98 under the F-distribution.
KEY: A
Chapter 16
359
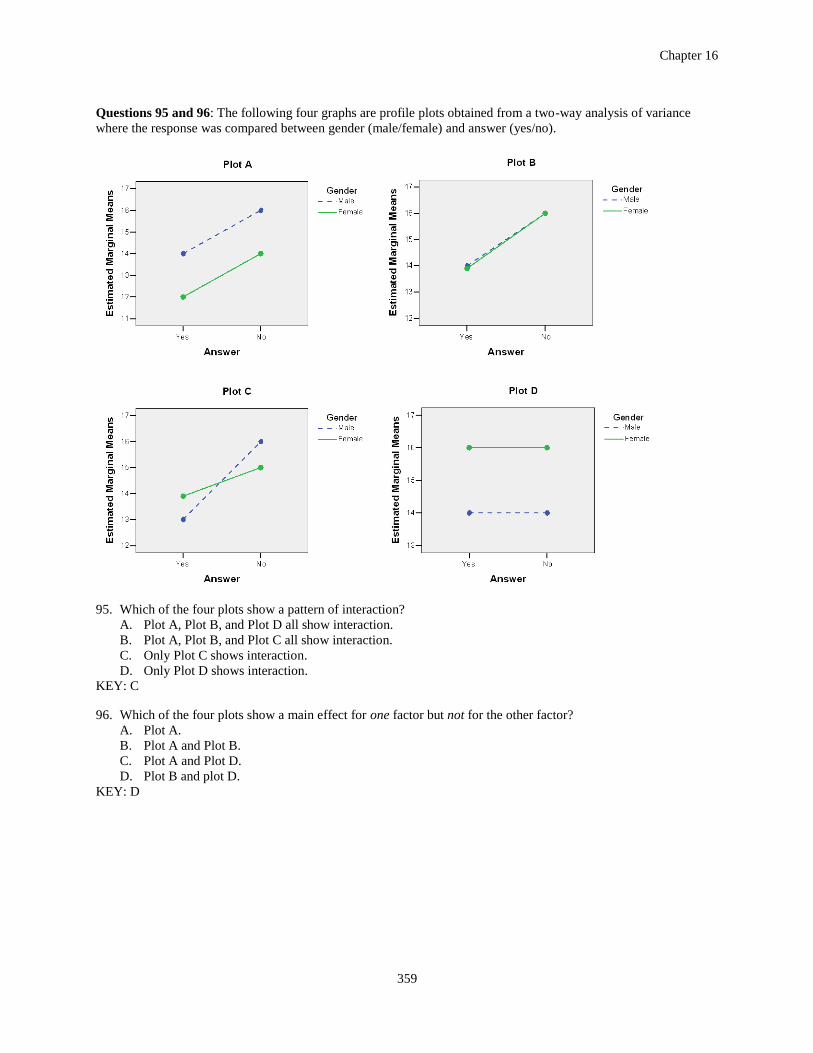
Questions 95 and 96: The following four graphs are profile plots obtained from a two-way analysis of variance
where the response was compared between gender (male/female) and answer (yes/no).
95. Which of the four plots show a pattern of interaction?
A. Plot A, Plot B, and Plot D all show interaction.
B. Plot A, Plot B, and Plot C all show interaction.
C. Only Plot C shows interaction.
D. Only Plot D shows interaction.
KEY: C
96. Which of the four plots show a main effect for one factor but not for the other factor?
A. Plot A.
B. Plot A and Plot B.
C. Plot A and Plot D.
D. Plot B and plot D.
KEY: D
Chapter 16
360
97. At a certain college, the average difference in GPA for male sophomores compared to male freshmen is 0.5
point. The average difference in GPA for female freshmen compared to female freshmen is also 0.5 point.
Based on this pattern, you can conclude
A. There is no interaction between gender (male, female) and GPA.
B. There is no interaction between gender (male, female) and class (freshmen, sophomore).
C. There is no interaction between class (freshmen, sophomore) and GPA.
D. There is an interaction between gender (male, female) and GPA.
KEY: B
98. For a survey of 900 college students, the following table gives the average number of classes missed per week
classified by gender and whether or not students are in a Greek organization (sorority/ fraternity).
Greek organization member?
Gender Yes No
Female 1.24 1.23
Male 2.13 1.67
Based on the means given in the table, it appears that gender and Greek organization membership are
A. not interacting variables because members of Greek organization miss more classes per week than non-
members do, regardless of gender.
B. interacting variables because the difference between non-members and members of Greek organizations is
greater for males than it is for females.
C. interacting variables because males miss more classes than females.
D. not interacting variables because males miss more classes than females regardless of Greek membership.
KEY: B
99. Using a sample of 300 children aged 10 to 12 years old, a child psychologist examines how scores on a “violent
behaviors” index relate to gender and amount of television watching per day (less than 2 hours, 2 to 4 hours,
more than 4 hours). In his report, the psychologist writes, “The effect of the amount of television watching on
the violent behaviors index was more pronounced for males than for females.” The sentence quoted in the
previous sentence indicates that
A. amount of television watching and gender are interacting variables.
B. amount of television watching and gender are confounding variables.
C. there is a main effect of gender.
D. amount of television watching and the violent behaviors score are not related.
KEY: A
Chapter 16
361
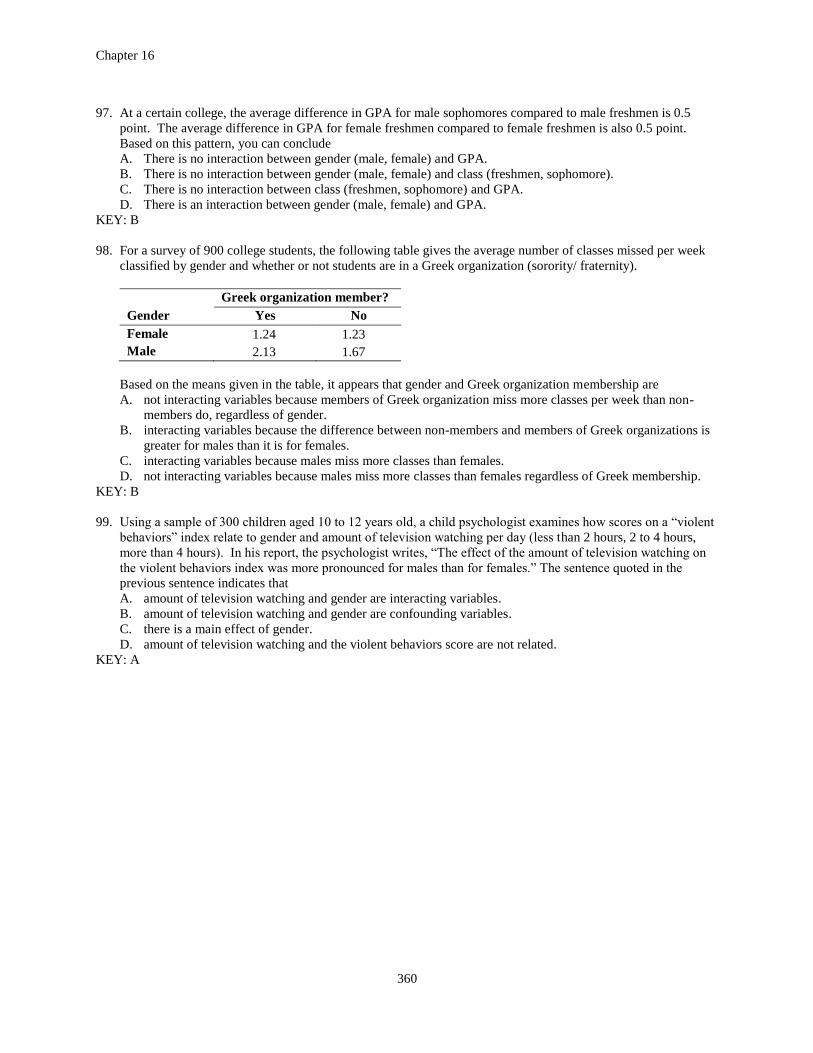
Questions 100 to 103: Satisfaction scores are to be compared for women in five different treatment groups. Some
sort of exercise is added to the daily routine of half of the women in each group. The other half of the women does
not exercise. SPSS is used to compare the scores, not only between the five treatment groups, but also between the
two exercise routines.
Tests of Between-Subjects Effects
Dependent Variable: Satisfaction
Source Type III Sum of
Squares df Mean Square F Sig.
Treatment 6.421 4 1.605 2.527 .046
Exercise 2.593 1 2.593 4.082 .046
Treatment * Exercise .811 .864
Error 90 .635
Total 66.998 99
100. How many women participated in this experiment?
A. 90
B. 91
C. 99
D. 100
KEY: D
101. What is the value of the SS Error?
A. 0.635
B. 66.998
C. 57.173
D. 9.825
KEY: C
102. What is the value of the test statistic for testing the interaction between treatment and exercise?
A. 0.319
B. 0.811
C. 1.277
D. 0.014
KEY: A
103. Is the interaction between treatment and exercise significant in this model? (Use α = 0.05)
A. Yes, p-value < 0.05. We can conclude that there is a significant interaction between treatment and exercise.
B. No, p-value < 0.05. We can conclude that there is no significant interaction between treatment and exercise.
C. Yes, p-value > 0.05. We can conclude that there is a significant interaction between treatment and exercise.
D. No, p-value > 0.05. We can conclude that there is no significant interaction between treatment and exercise.
KEY: D
Chapter 16
362
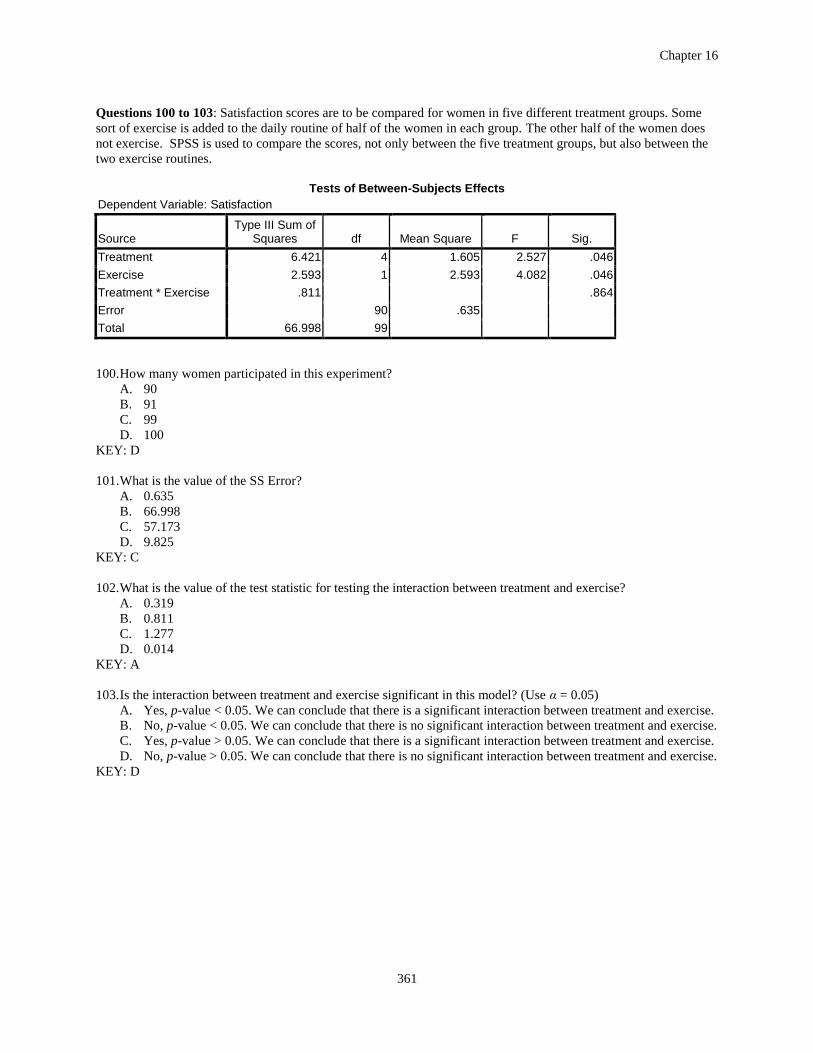
Questions 104 to 106: An experiment is conducted to compare the enthusiasm of participants performing two
different tasks. Before starting the task, the personality type of the participants is determined. Two groups are then
formed: one group of personality type A people and an equal size group of personality type B people. There were
more type A people in the initial sample, so they were randomly sampled until the right number was reached. Then
half of the participants in each group was given one of two tasks. The one task is easy and earns the participants $1.
The other task is difficult and earns the participant $10. Part of the computer output is shown below.
Tests of Between-Subjects Effects Dependent Variable: enthusiasm
Source Type III Sum of
Squares df Mean Square F Sig.
Task 2.791 2.050 .158
PersType 73.684 54.122 .000
Task * PersType 153.023 .000
Error 76.241 56
Total 306.648 59
104. How many degrees of freedom are associated with the F-statistic for the interaction effect?
A. 4 and 59
B. 2 and 59
C. 1 and 56
D. 2 and 56
KEY: C
105. What is the value of the test statistic for the interaction effect?
A. 1.36
B. 2.01
C. 38.26
D. 112.40
KEY: D
106. What are the results of this two-way ANOVA?
A. There is only a main effect of task.
B. There is a main effect of personality type and there is an interaction effect.
C. There is only an interaction effect.
D. There are main effects for task and personality type but there is no interaction effect.
KEY: B
Chapter 16
363
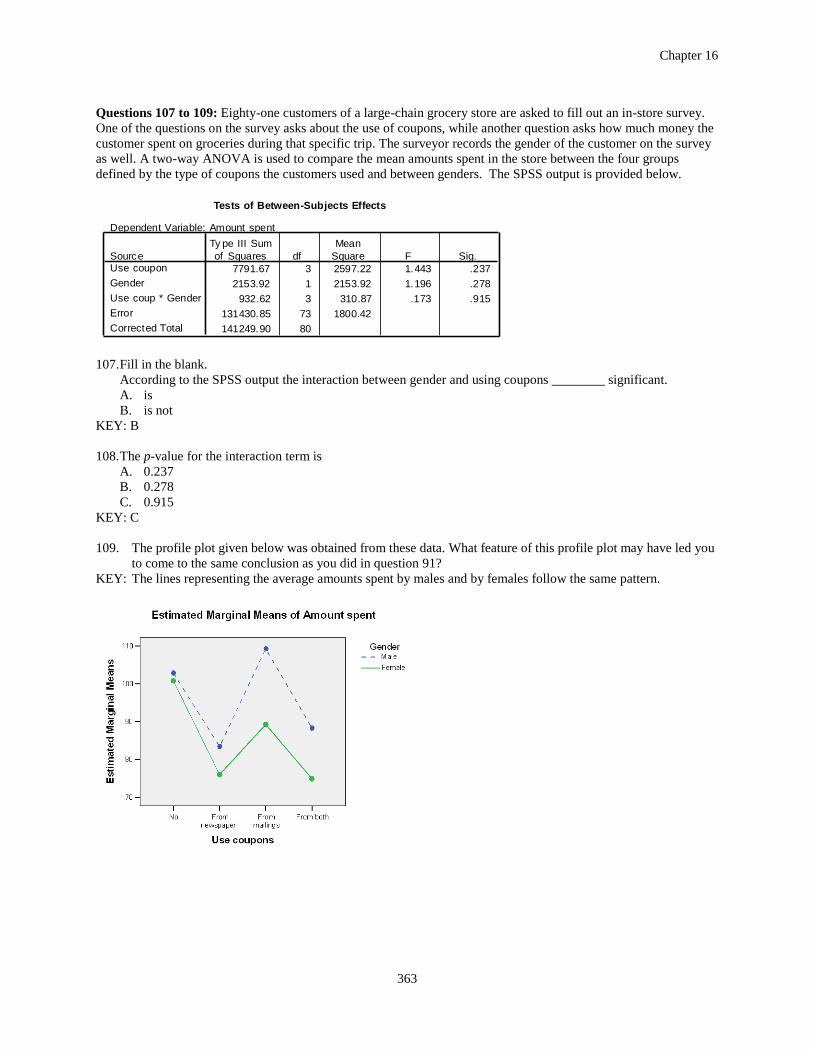
Questions 107 to 109: Eighty-one customers of a large-chain grocery store are asked to fill out an in-store survey.
One of the questions on the survey asks about the use of coupons, while another question asks how much money the
customer spent on groceries during that specific trip. The surveyor records the gender of the customer on the survey
as well. A two-way ANOVA is used to compare the mean amounts spent in the store between the four groups
defined by the type of coupons the customers used and between genders. The SPSS output is provided below.
Tests of Between-Subjects Effects
Dependent Variable: Amount spent
7791.67 3 2597.22 1.443 .237
2153.92 1 2153.92 1.196 .278
932.62 3 310.87 .173 .915
131430.85 73 1800.42
141249.90 80
SourceUse coupon
Gender
Use coup * Gender
Error
Corrected Total
Ty pe III Sum
of Squares df
Mean
Square F Sig.
107. Fill in the blank.
According to the SPSS output the interaction between gender and using coupons ________ significant.
A. is
B. is not
KEY: B
108. The p-value for the interaction term is
A. 0.237
B. 0.278
C. 0.915
KEY: C
109. The profile plot given below was obtained from these data. What feature of this profile plot may have led you
to come to the same conclusion as you did in question 91?
KEY: The lines representing the average amounts spent by males and by females follow the same pattern.
Chapter 16
364
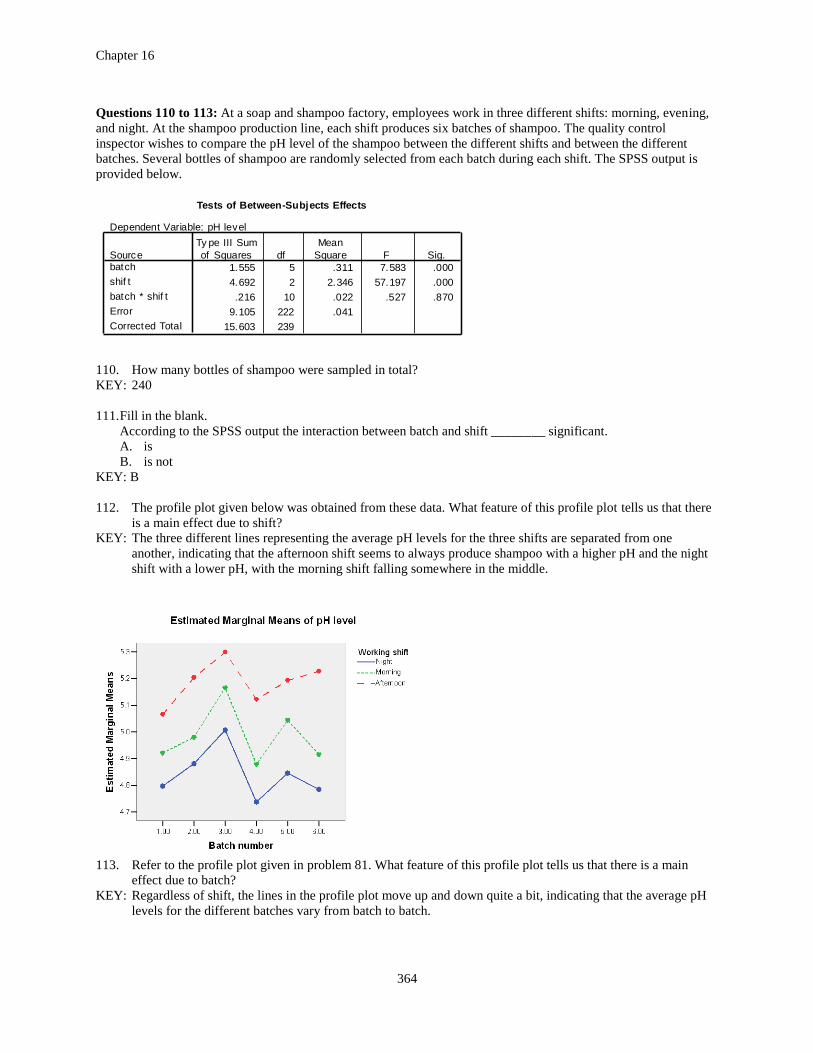
Questions 110 to 113: At a soap and shampoo factory, employees work in three different shifts: morning, evening,
and night. At the shampoo production line, each shift produces six batches of shampoo. The quality control
inspector wishes to compare the pH level of the shampoo between the different shifts and between the different
batches. Several bottles of shampoo are randomly selected from each batch during each shift. The SPSS output is
provided below.
Tests of Between-Subjects Effects
Dependent Variable: pH level
1.555 5 .311 7.583 .000
4.692 2 2.346 57.197 .000
.216 10 .022 .527 .870
9.105 222 .041
15.603 239
Sourcebatch
shif t
batch * shif t
Error
Corrected Total
Ty pe III Sum
of Squares df
Mean
Square F Sig.
110. How many bottles of shampoo were sampled in total?
KEY: 240
111. Fill in the blank.
According to the SPSS output the interaction between batch and shift ________ significant.
A. is
B. is not
KEY: B
112. The profile plot given below was obtained from these data. What feature of this profile plot tells us that there
is a main effect due to shift?
KEY: The three different lines representing the average pH levels for the three shifts are separated from one
another, indicating that the afternoon shift seems to always produce shampoo with a higher pH and the night
shift with a lower pH, with the morning shift falling somewhere in the middle.
113. Refer to the profile plot given in problem 81. What feature of this profile plot tells us that there is a main
effect due to batch?
KEY: Regardless of shift, the lines in the profile plot move up and down quite a bit, indicating that the average pH
levels for the different batches vary from batch to batch.