Embed Size (px)
Citation preview

1
Understanding attitudes & behaviors toward saving and spending
Millennials and Money Research
2
TABLE OF CONTENTS
RESEARCH METHOD 3
KEY FINDINGS 4
SAVER OR SPENDER? 7
SAVING HABITS 16
SPENDING HABITS 27
GOAL SETTING 41
RETIREMENT PLANS 55
FINANCIAL SECURITY 69
FINANCIAL ADVICE 73
APPENDIX 79
Millions of investors and independent registered investment advisors (RIAs) have turned to TD Ameritrade’s (Nasdaq: AMTD) technology, people, and education to help make investing and trading easier to understand and do. Online or over the phone. In a branch or with an independent RIA. First-timer or sophisticated trader. Our clients want to take control, and we help them decide how-bringing Wall Street to Main Street for more than 39 years. An official sponsor of the 2014 and 2016 U.S. Olympic and Paralympic Teams, as well as an official sponsor of the National Football League, TD Ameritrade has time and again been recognized as a leader in investment services. Please visit the TD Ameritrade newsroom or www.amtd.com for more information.
Brokerage services provided by TD Ameritrade, Inc., member FINRA (www.FINRA.org)/SIPC ( www.SIPC.org).
3
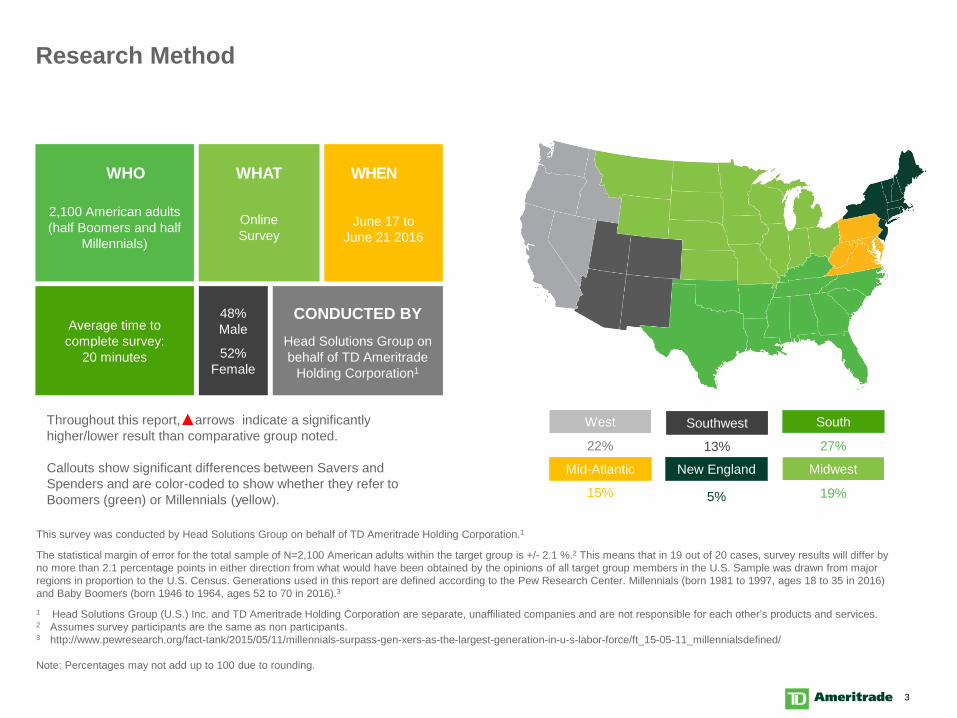
This survey was conducted by Head Solutions Group on behalf of TD Ameritrade Holding Corporation.1
The statistical margin of error for the total sample of N=2,100 American adults within the target group is +/- 2.1 %.2 This means that in 19 out of 20 cases, survey results will differ by no more than 2.1 percentage points in either direction from what would have been obtained by the opinions of all target group members in the U.S. Sample was drawn from major regions in proportion to the U.S. Census. Generations used in this report are defined according to the Pew Research Center. Millennials (born 1981 to 1997, ages 18 to 35 in 2016) and Baby Boomers (born 1946 to 1964, ages 52 to 70 in 2016).3
1 Head Solutions Group (U.S.) Inc. and TD Ameritrade Holding Corporation are separate, unaffiliated companies and are not responsible for each other’s products and services.2 Assumes survey participants are the same as non participants.3 http://www.pewresearch.org/fact-tank/2015/05/11/millennials-surpass-gen-xers-as-the-largest-generation-in-u-s-labor-force/ft_15-05-11_millennialsdefined/
Note: Percentages may not add up to 100 due to rounding.
New England
5%
Mid-Atlantic
15%
South
27%
Southwest
13%
West
22%
2,100 American adults (half Boomers and half
Millennials)
OnlineSurvey
June 17 to June 21 2016
Average time to complete survey:
20 minutesHead Solutions Group on behalf of TD Ameritrade
Holding Corporation1
48% Male
52% Female
Midwest
19%
WHENWHATWHO
CONDUCTED BY
Research Method
Throughout this report, arrows indicate a significantly higher/lower result than comparative group noted.
Callouts show significant differences between Savers and Spenders and are color-coded to show whether they refer to Boomers (green) or Millennials (yellow).
4
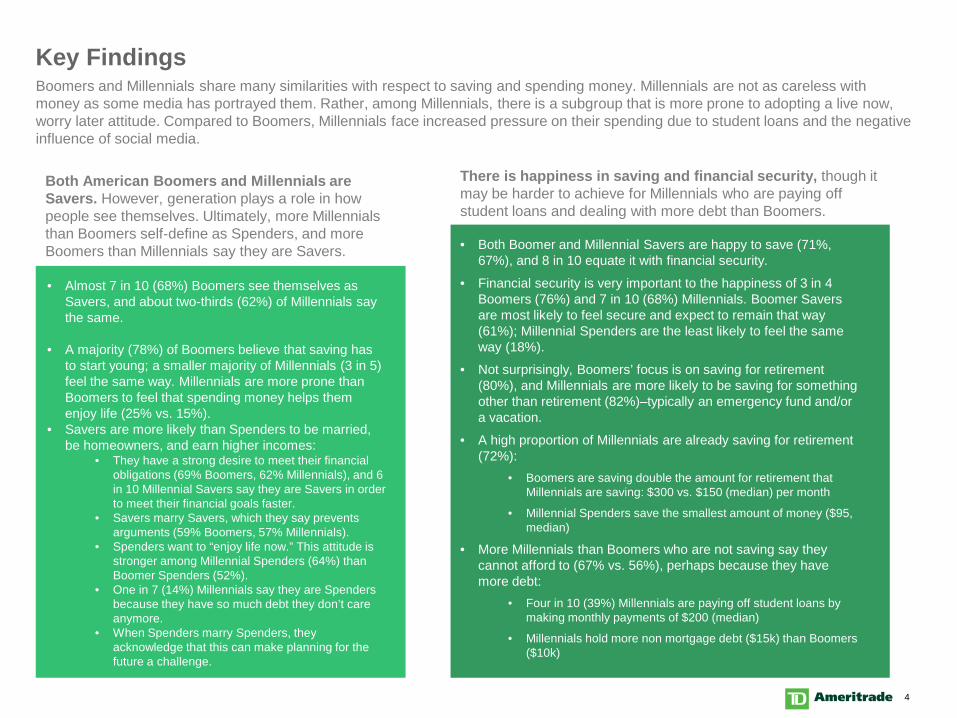
• Almost 7 in 10 (68%) Boomers see themselves as Savers, and about two-thirds (62%) of Millennials say the same.
• A majority (78%) of Boomers believe that saving has to start young; a smaller majority of Millennials (3 in 5) feel the same way. Millennials are more prone than Boomers to feel that spending money helps them enjoy life (25% vs. 15%).
• Savers are more likely than Spenders to be married, be homeowners, and earn higher incomes:
• They have a strong desire to meet their financial obligations (69% Boomers, 62% Millennials), and 6 in 10 Millennial Savers say they are Savers in order to meet their financial goals faster.
• Savers marry Savers, which they say prevents arguments (59% Boomers, 57% Millennials).
• Spenders want to “enjoy life now.” This attitude is stronger among Millennial Spenders (64%) than Boomer Spenders (52%).
• One in 7 (14%) Millennials say they are Spenders because they have so much debt they don’t care anymore.
• When Spenders marry Spenders, they acknowledge that this can make planning for the future a challenge.
Key FindingsBoomers and Millennials share many similarities with respect to saving and spending money. Millennials are not as careless with money as some media has portrayed them. Rather, among Millennials, there is a subgroup that is more prone to adopting a live now, worry later attitude. Compared to Boomers, Millennials face increased pressure on their spending due to student loans and the negative influence of social media.
• Both Boomer and Millennial Savers are happy to save (71%, 67%), and 8 in 10 equate it with financial security.
• Financial security is very important to the happiness of 3 in 4 Boomers (76%) and 7 in 10 (68%) Millennials. Boomer Savers are most likely to feel secure and expect to remain that way (61%); Millennial Spenders are the least likely to feel the same way (18%).
• Not surprisingly, Boomers’ focus is on saving for retirement (80%), and Millennials are more likely to be saving for something other than retirement (82%)–typically an emergency fund and/or a vacation.
• A high proportion of Millennials are already saving for retirement (72%):
• Boomers are saving double the amount for retirement that Millennials are saving: $300 vs. $150 (median) per month
• Millennial Spenders save the smallest amount of money ($95, median)
• More Millennials than Boomers who are not saving say they cannot afford to (67% vs. 56%), perhaps because they have more debt:
• Four in 10 (39%) Millennials are paying off student loans by making monthly payments of $200 (median)
• Millennials hold more non mortgage debt ($15k) than Boomers ($10k)
Both American Boomers and Millennials are Savers. However, generation plays a role in how people see themselves. Ultimately, more Millennials than Boomers self-define as Spenders, and more Boomers than Millennials say they are Savers.
There is happiness in saving and financial security, though it may be harder to achieve for Millennials who are paying off student loans and dealing with more debt than Boomers.
5
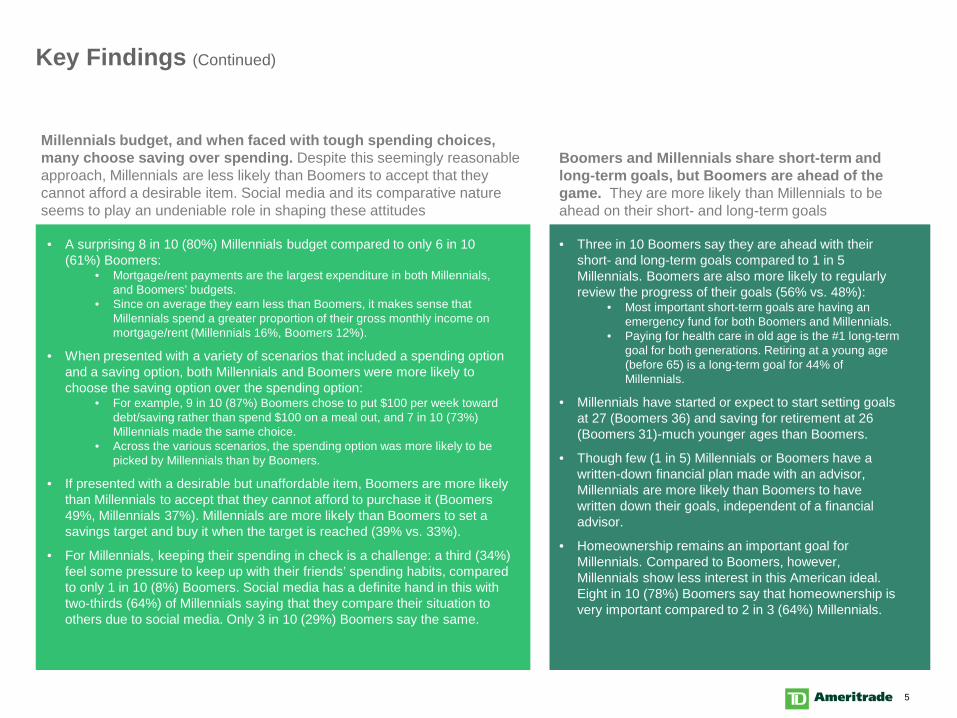
• A surprising 8 in 10 (80%) Millennials budget compared to only 6 in 10 (61%) Boomers:
• Mortgage/rent payments are the largest expenditure in both Millennials, and Boomers’ budgets.
• Since on average they earn less than Boomers, it makes sense that Millennials spend a greater proportion of their gross monthly income on mortgage/rent (Millennials 16%, Boomers 12%).
• When presented with a variety of scenarios that included a spending option and a saving option, both Millennials and Boomers were more likely to choose the saving option over the spending option:
• For example, 9 in 10 (87%) Boomers chose to put $100 per week toward debt/saving rather than spend $100 on a meal out, and 7 in 10 (73%) Millennials made the same choice.
• Across the various scenarios, the spending option was more likely to be picked by Millennials than by Boomers.
• If presented with a desirable but unaffordable item, Boomers are more likely than Millennials to accept that they cannot afford to purchase it (Boomers 49%, Millennials 37%). Millennials are more likely than Boomers to set a savings target and buy it when the target is reached (39% vs. 33%).
• For Millennials, keeping their spending in check is a challenge: a third (34%) feel some pressure to keep up with their friends’ spending habits, compared to only 1 in 10 (8%) Boomers. Social media has a definite hand in this with two-thirds (64%) of Millennials saying that they compare their situation to others due to social media. Only 3 in 10 (29%) Boomers say the same.
Key Findings (Continued)
• Three in 10 Boomers say they are ahead with their short- and long-term goals compared to 1 in 5 Millennials. Boomers are also more likely to regularly review the progress of their goals (56% vs. 48%):
• Most important short-term goals are having an emergency fund for both Boomers and Millennials.
• Paying for health care in old age is the #1 long-term goal for both generations. Retiring at a young age (before 65) is a long-term goal for 44% of Millennials.
• Millennials have started or expect to start setting goals at 27 (Boomers 36) and saving for retirement at 26 (Boomers 31)-much younger ages than Boomers.
• Though few (1 in 5) Millennials or Boomers have a written-down financial plan made with an advisor, Millennials are more likely than Boomers to have written down their goals, independent of a financial advisor.
• Homeownership remains an important goal for Millennials. Compared to Boomers, however, Millennials show less interest in this American ideal. Eight in 10 (78%) Boomers say that homeownership is very important compared to 2 in 3 (64%) Millennials.
Millennials budget, and when faced with tough spending choices, many choose saving over spending. Despite this seemingly reasonable approach, Millennials are less likely than Boomers to accept that they cannot afford a desirable item. Social media and its comparative nature seems to play an undeniable role in shaping these attitudes
Boomers and Millennials share short-term and long-term goals, but Boomers are ahead of the game. They are more likely than Millennials to be ahead on their short- and long-term goals
6
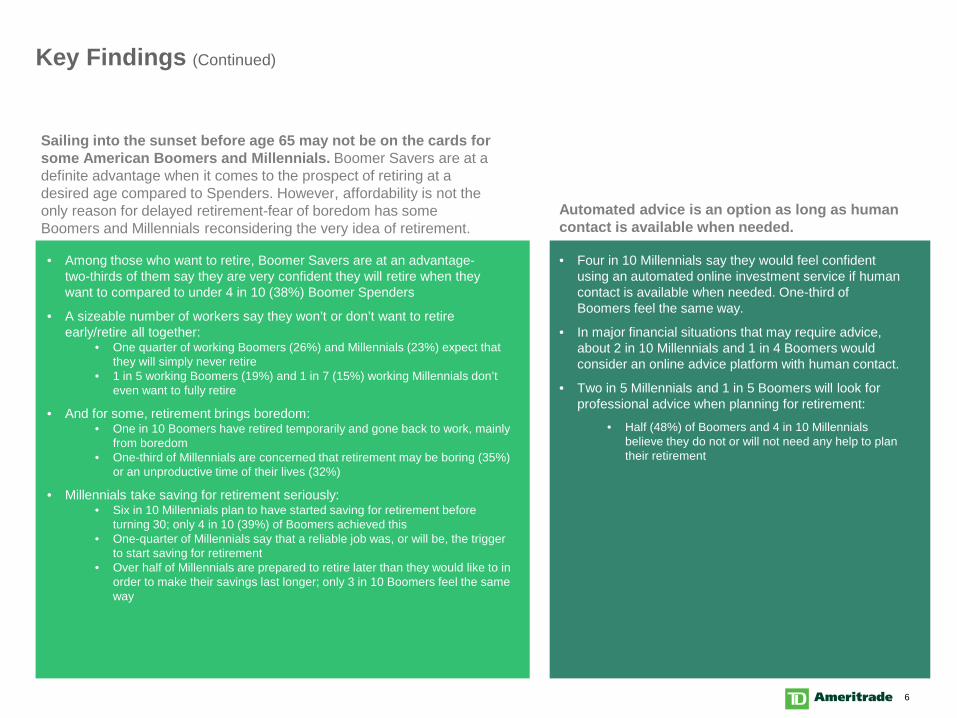
• Among those who want to retire, Boomer Savers are at an advantage-two-thirds of them say they are very confident they will retire when they want to compared to under 4 in 10 (38%) Boomer Spenders
• A sizeable number of workers say they won’t or don’t want to retire early/retire all together:
• One quarter of working Boomers (26%) and Millennials (23%) expect that they will simply never retire
• 1 in 5 working Boomers (19%) and 1 in 7 (15%) working Millennials don’t even want to fully retire
• And for some, retirement brings boredom:• One in 10 Boomers have retired temporarily and gone back to work, mainly
from boredom• One-third of Millennials are concerned that retirement may be boring (35%)
or an unproductive time of their lives (32%)
• Millennials take saving for retirement seriously:• Six in 10 Millennials plan to have started saving for retirement before
turning 30; only 4 in 10 (39%) of Boomers achieved this• One-quarter of Millennials say that a reliable job was, or will be, the trigger
to start saving for retirement• Over half of Millennials are prepared to retire later than they would like to in
order to make their savings last longer; only 3 in 10 Boomers feel the same way
Key Findings (Continued)
• Four in 10 Millennials say they would feel confident using an automated online investment service if human contact is available when needed. One-third of Boomers feel the same way.
• In major financial situations that may require advice, about 2 in 10 Millennials and 1 in 4 Boomers would consider an online advice platform with human contact.
• Two in 5 Millennials and 1 in 5 Boomers will look for professional advice when planning for retirement:
• Half (48%) of Boomers and 4 in 10 Millennials believe they do not or will not need any help to plan their retirement
Sailing into the sunset before age 65 may not be on the cards for some American Boomers and Millennials. Boomer Savers are at a definite advantage when it comes to the prospect of retiring at a desired age compared to Spenders. However, affordability is not the only reason for delayed retirement-fear of boredom has some Boomers and Millennials reconsidering the very idea of retirement.
Automated advice is an option as long as human contact is available when needed.

7
Saver or Spender?
8
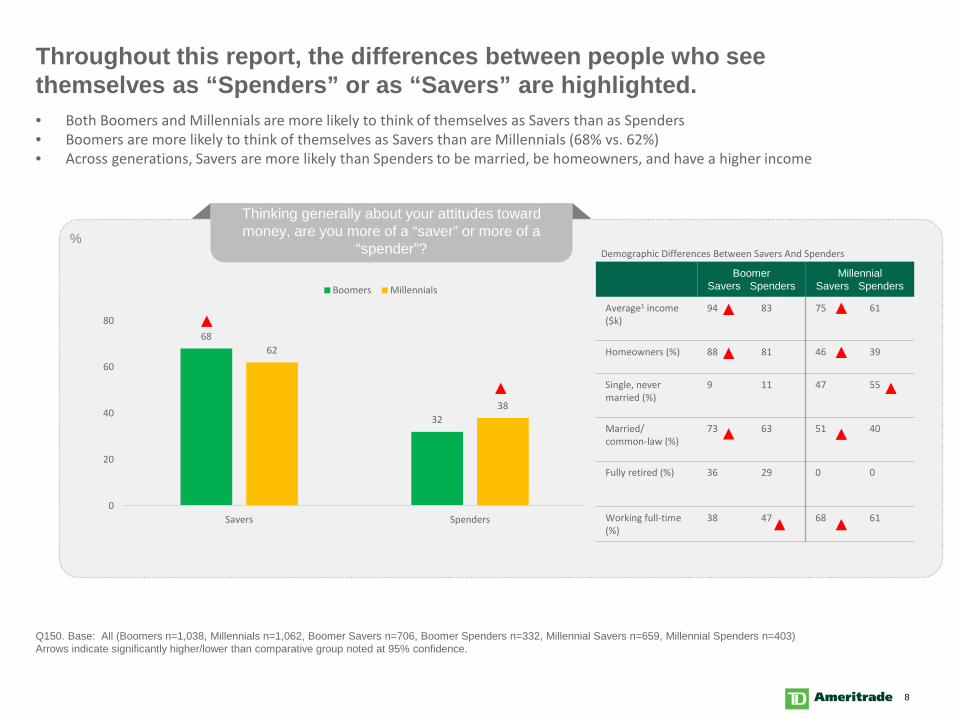
Throughout this report, the differences between people who see themselves as “Spenders” or as “Savers” are highlighted.
Q150. Base: All (Boomers n=1,038, Millennials n=1,062, Boomer Savers n=706, Boomer Spenders n=332, Millennial Savers n=659, Millennial Spenders n=403)Arrows indicate significantly higher/lower than comparative group noted at 95% confidence.
Thinking generally about your attitudes toward money, are you more of a “saver” or more of a
“spender”?
68
32
62
38
0
20
40
60
80
Savers Spenders
Boomers Millennials
%
• Both Boomers and Millennials are more likely to think of themselves as Savers than as Spenders• Boomers are more likely to think of themselves as Savers than are Millennials (68% vs. 62%)• Across generations, Savers are more likely than Spenders to be married, be homeowners, and have a higher income
Boomer Savers Spenders
MillennialSavers Spenders
Average1 income ($k)
94 83 75 61
Homeowners (%) 88 81 46 39
Single, never married (%)
9 11 47 55
Married/common-law (%)
73 63 51 40
Fully retired (%) 36 29 0 0
Working full-time (%)
38 47 68 61
Demographic Differences Between Savers And Spenders
9
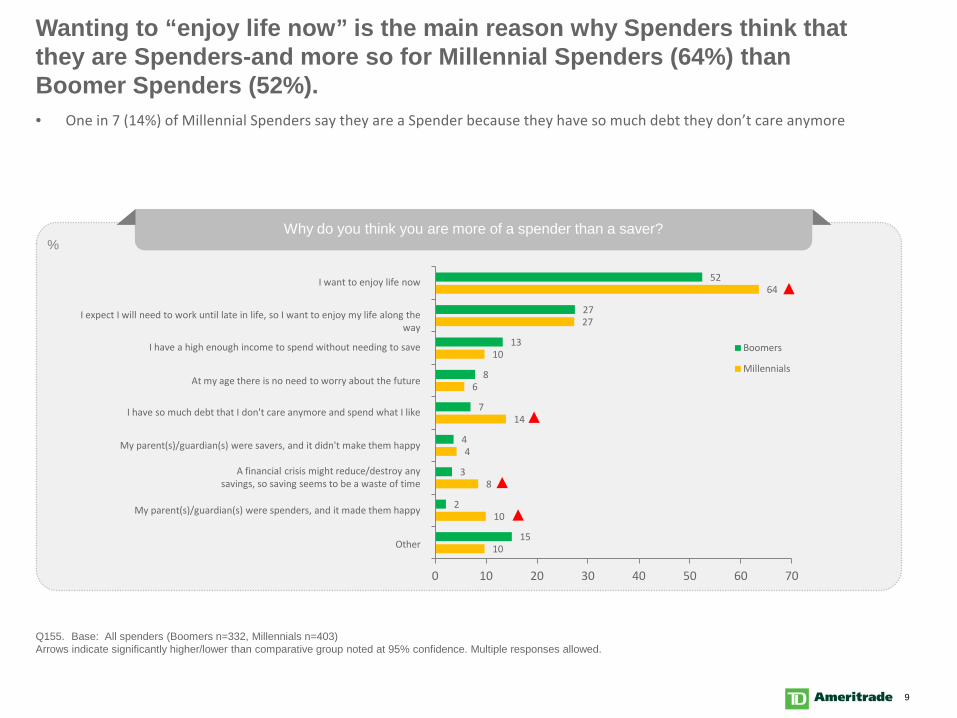
Wanting to “enjoy life now” is the main reason why Spenders think that they are Spenders-and more so for Millennial Spenders (64%) than Boomer Spenders (52%).
Q155. Base: All spenders (Boomers n=332, Millennials n=403)Arrows indicate significantly higher/lower than comparative group noted at 95% confidence. Multiple responses allowed.
Why do you think you are more of a spender than a saver?
10
10
8
4
14
6
10
27
64
15
2
3
4
7
8
13
27
52
0 10 20 30 40 50 60 70
Boomers
Millennials
%
• One in 7 (14%) of Millennial Spenders say they are a Spender because they have so much debt they don’t care anymore
Other
I want to enjoy life now
I expect I will need to work until late in life, so I want to enjoy my life along the way
I have a high enough income to spend without needing to save
At my age there is no need to worry about the future
I have so much debt that I don't care anymore and spend what I like
My parent(s)/guardian(s) were savers, and it didn't make them happy
A financial crisis might reduce/destroy any savings, so saving seems to be a waste of time
My parent(s)/guardian(s) were spenders, and it made them happy
10
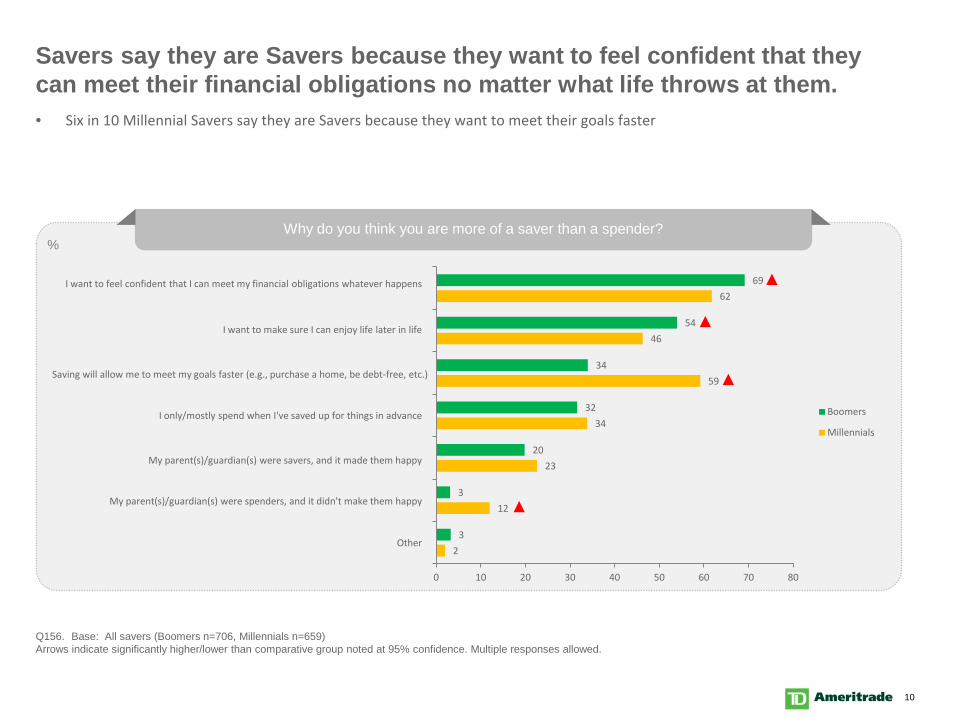
Savers say they are Savers because they want to feel confident that they can meet their financial obligations no matter what life throws at them.
Q156. Base: All savers (Boomers n=706, Millennials n=659)Arrows indicate significantly higher/lower than comparative group noted at 95% confidence. Multiple responses allowed.
Why do you think you are more of a saver than a spender?
2
12
23
34
59
46
62
3
3
20
32
34
54
69
0 10 20 30 40 50 60 70 80
Boomers
Millennials
• Six in 10 Millennial Savers say they are Savers because they want to meet their goals faster
I want to feel confident that I can meet my financial obligations whatever happens
Other
My parent(s)/guardian(s) were spenders, and it didn't make them happy
My parent(s)/guardian(s) were savers, and it made them happy
I only/mostly spend when I've saved up for things in advance
Saving will allow me to meet my goals faster (e.g., purchase a home, be debt-free, etc.)
I want to make sure I can enjoy life later in life
%
11
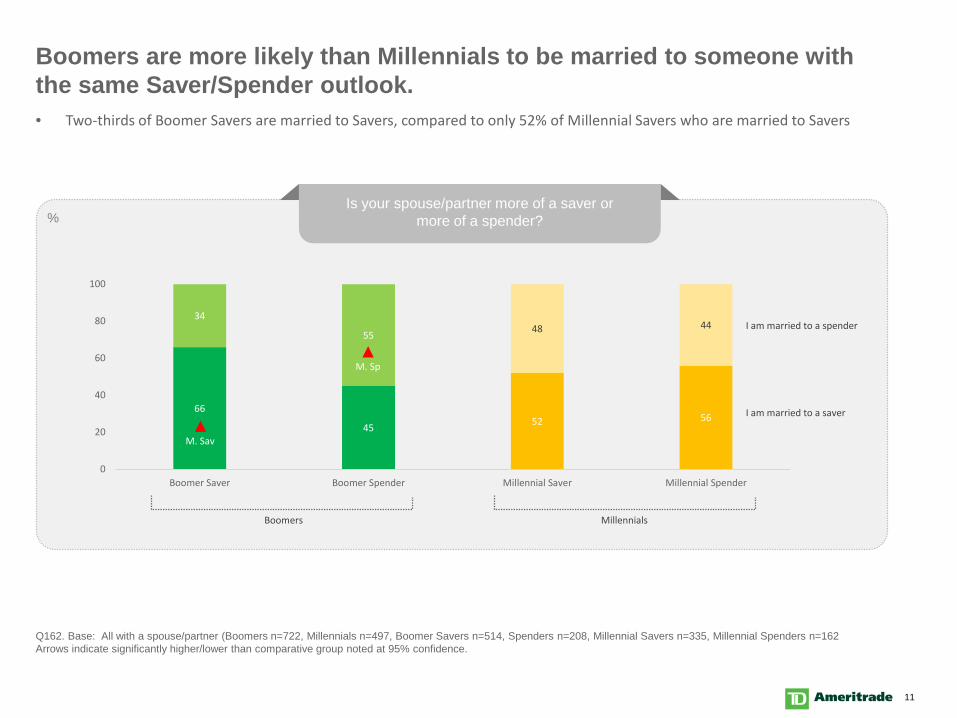
Boomers are more likely than Millennials to be married to someone with the same Saver/Spender outlook.
Q162. Base: All with a spouse/partner (Boomers n=722, Millennials n=497, Boomer Savers n=514, Spenders n=208, Millennial Savers n=335, Millennial Spenders n=162Arrows indicate significantly higher/lower than comparative group noted at 95% confidence.
Is your spouse/partner more of a saver ormore of a spender?
66
45 52 56
34
55 48 44
0
20
40
60
80
100
Boomer Saver Boomer Spender Millennial Saver Millennial Spender
%
• Two-thirds of Boomer Savers are married to Savers, compared to only 52% of Millennial Savers who are married to Savers
M. Sav
M. Sp
I am married to a spender
I am married to a saver
Boomers Millennials
12
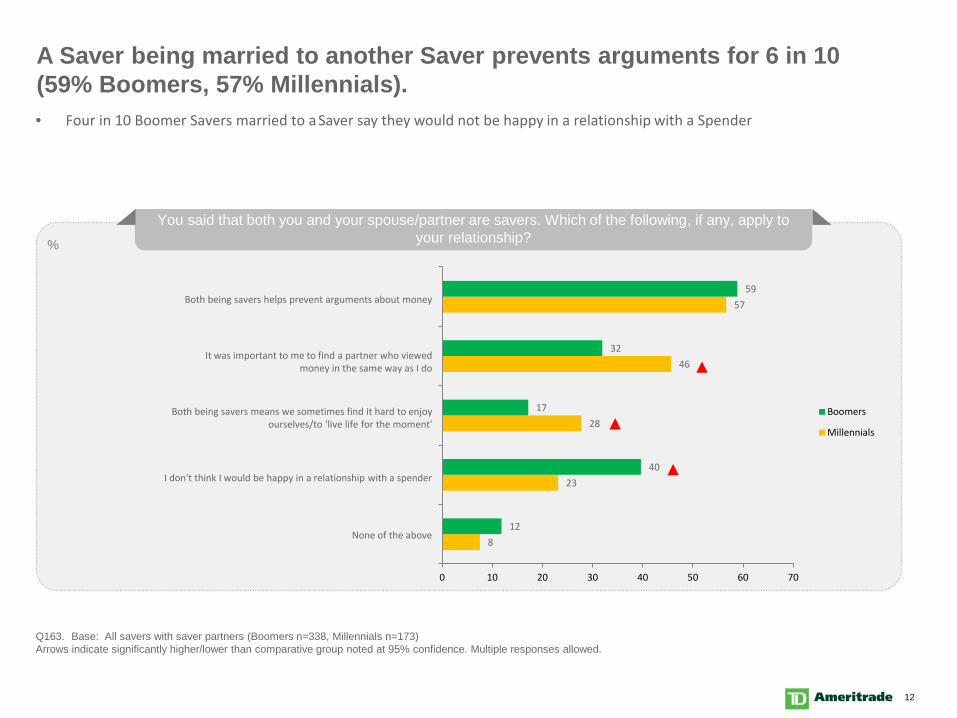
A Saver being married to another Saver prevents arguments for 6 in 10 (59% Boomers, 57% Millennials).
Q163. Base: All savers with saver partners (Boomers n=338, Millennials n=173)Arrows indicate significantly higher/lower than comparative group noted at 95% confidence. Multiple responses allowed.
You said that both you and your spouse/partner are savers. Which of the following, if any, apply to your relationship?
8
23
28
46
57
12
40
17
32
59
0 10 20 30 40 50 60 70
Boomers
Millennials
• Four in 10 Boomer Savers married to a Saver say they would not be happy in a relationship with a Spender
None of the above
I don't think I would be happy in a relationship with a spender
Both being savers means we sometimes find it hard to enjoy ourselves/to 'live life for the moment'
It was important to me to find a partner who viewed money in the same way as I do
Both being savers helps prevent arguments about money
%
13
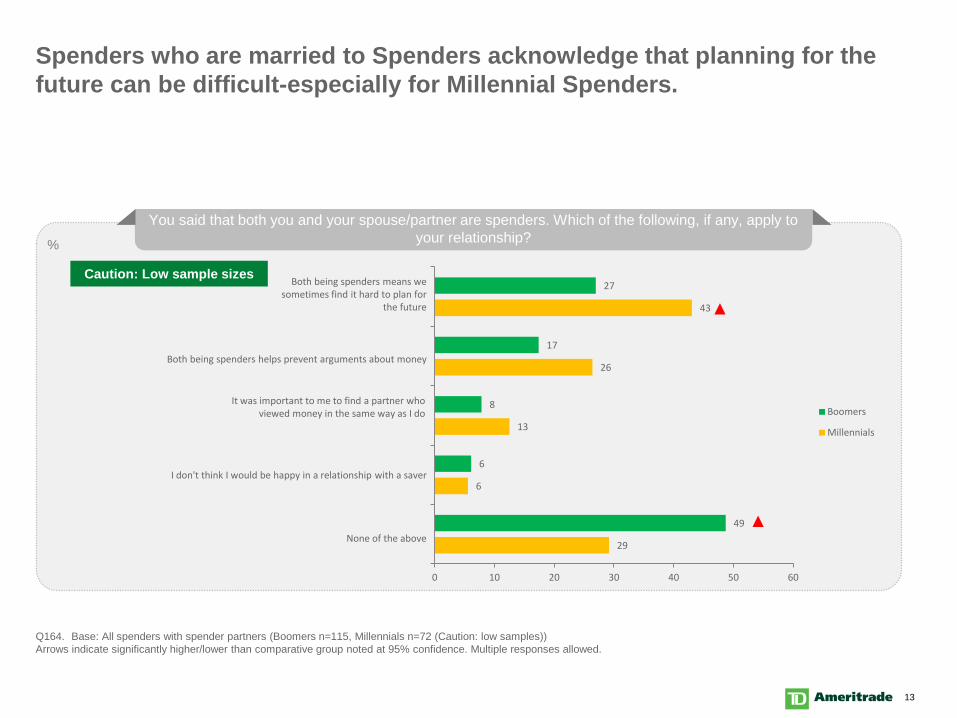
Spenders who are married to Spenders acknowledge that planning for the future can be difficult-especially for Millennial Spenders.
Q164. Base: All spenders with spender partners (Boomers n=115, Millennials n=72 (Caution: low samples))Arrows indicate significantly higher/lower than comparative group noted at 95% confidence. Multiple responses allowed.
You said that both you and your spouse/partner are spenders. Which of the following, if any, apply to your relationship?
29
6
13
26
43
49
6
8
17
27
0 10 20 30 40 50 60
Boomers
Millennials
Both being spenders means we sometimes find it hard to plan for
the future
None of the above
I don't think I would be happy in a relationship with a saver
It was important to me to find a partner who viewed money in the same way as I do
Both being spenders helps prevent arguments about money
Caution: Low sample sizes
%
14
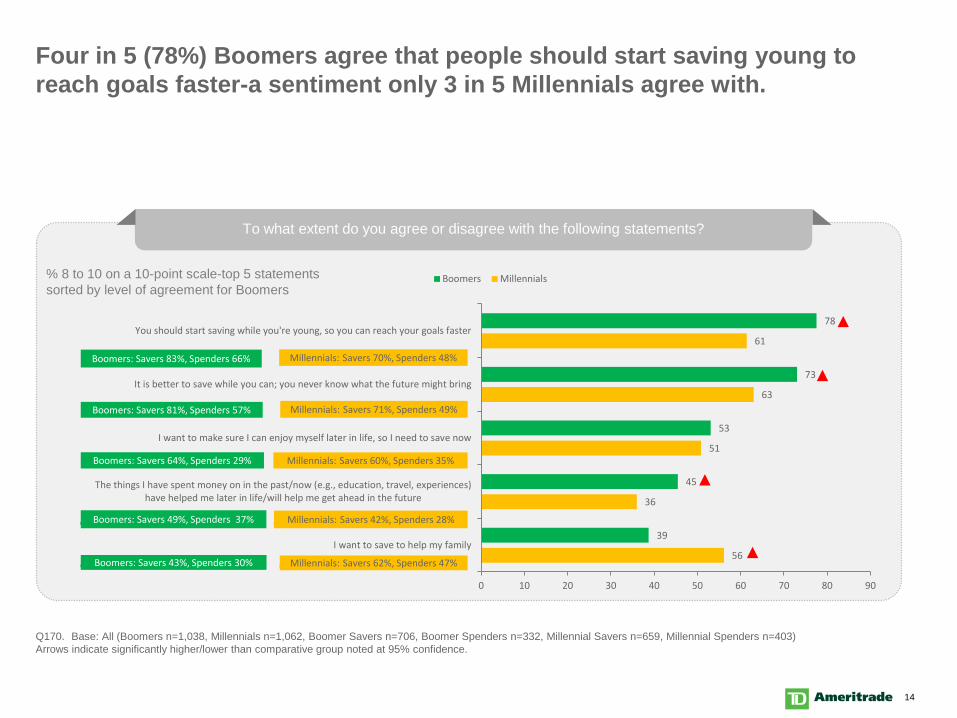
Four in 5 (78%) Boomers agree that people should start saving young to reach goals faster-a sentiment only 3 in 5 Millennials agree with.
Q170. Base: All (Boomers n=1,038, Millennials n=1,062, Boomer Savers n=706, Boomer Spenders n=332, Millennial Savers n=659, Millennial Spenders n=403) Arrows indicate significantly higher/lower than comparative group noted at 95% confidence.
To what extent do you agree or disagree with the following statements?
56
36
51
63
61
39
45
53
73
78
0 10 20 30 40 50 60 70 80 90
I want to save to help my family
The things I have spent money on in the past/now (e.g., education, travel, experiences)have helped me later in life/will help me get ahead in the future
I want to make sure I can enjoy myself later in life, so I need to save now
It is better to save while you can; you never know what the future might bring
You should start saving while you're young, so you can reach your goals faster
Boomers Millennials% 8 to 10 on a 10-point scale-top 5 statements sorted by level of agreement for Boomers
Millennials: Savers 70%, Spenders 48%
Millennials: Savers 42%, Spenders 28%
Millennials: Savers 71%, Spenders 49%
Millennials: Savers 60%, Spenders 35%
Millennials: Savers 62%, Spenders 47%
Boomers: Savers 83%, Spenders 66%
Boomers: Savers 81%, Spenders 57%
Boomers: Savers 64%, Spenders 29%
Boomers: Savers 49%, Spenders 37%
Boomers: Savers 43%, Spenders 30%
15
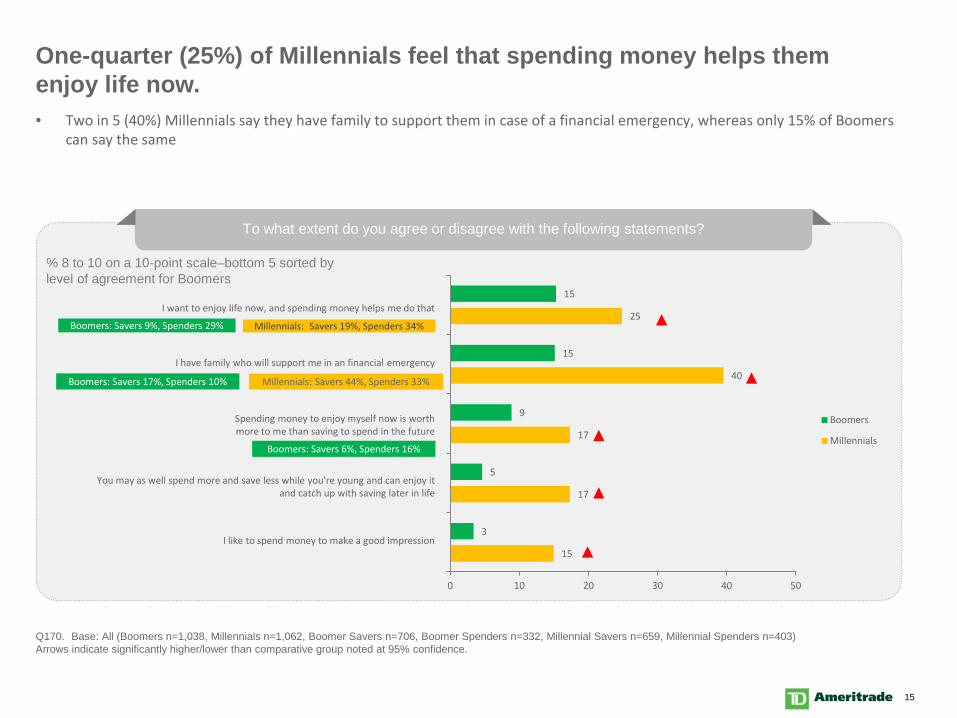
One-quarter (25%) of Millennials feel that spending money helps them enjoy life now.
Q170. Base: All (Boomers n=1,038, Millennials n=1,062, Boomer Savers n=706, Boomer Spenders n=332, Millennial Savers n=659, Millennial Spenders n=403) Arrows indicate significantly higher/lower than comparative group noted at 95% confidence.
To what extent do you agree or disagree with the following statements?
15
17
17
40
25
3
5
9
15
15
0 10 20 30 40 50
Boomers
Millennials
% 8 to 10 on a 10-point scale–bottom 5 sorted by level of agreement for Boomers
Millennials: Savers 19%, Spenders 34%Boomers: Savers 9%, Spenders 29%
• Two in 5 (40%) Millennials say they have family to support them in case of a financial emergency, whereas only 15% of Boomerscan say the same
I want to enjoy life now, and spending money helps me do that
I like to spend money to make a good impression
You may as well spend more and save less while you're young and can enjoy it and catch up with saving later in life
Spending money to enjoy myself now is worth more to me than saving to spend in the future
I have family who will support me in an financial emergency
Millennials: Savers 44%, Spenders 33%Boomers: Savers 17%, Spenders 10%
Boomers: Savers 6%, Spenders 16%
16
Saving Habits
17
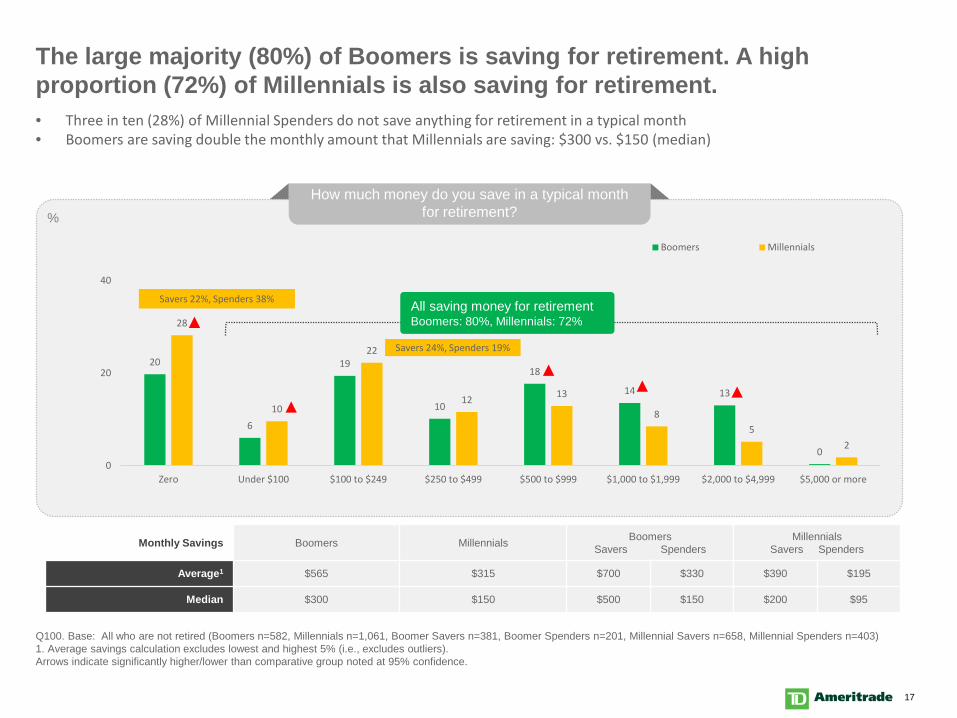
The large majority (80%) of Boomers is saving for retirement. A high proportion (72%) of Millennials is also saving for retirement.
Q100. Base: All who are not retired (Boomers n=582, Millennials n=1,061, Boomer Savers n=381, Boomer Spenders n=201, Millennial Savers n=658, Millennial Spenders n=403)1. Average savings calculation excludes lowest and highest 5% (i.e., excludes outliers).Arrows indicate significantly higher/lower than comparative group noted at 95% confidence.
How much money do you save in a typical month for retirement?
20
6
19
10
18
14 13
0
28
10
22
12 13
85
2
0
20
40
Zero Under $100 $100 to $249 $250 to $499 $500 to $999 $1,000 to $1,999 $2,000 to $4,999 $5,000 or more
Boomers Millennials
All saving money for retirement Boomers: 80%, Millennials: 72%
Monthly Savings Boomers Millennials BoomersSavers Spenders
MillennialsSavers Spenders
Average1 $565 $315 $700 $330 $390 $195
Median $300 $150 $500 $150 $200 $95
%
Savers 22%, Spenders 38%
Savers 24%, Spenders 19%
• Three in ten (28%) of Millennial Spenders do not save anything for retirement in a typical month• Boomers are saving double the monthly amount that Millennials are saving: $300 vs. $150 (median)
18
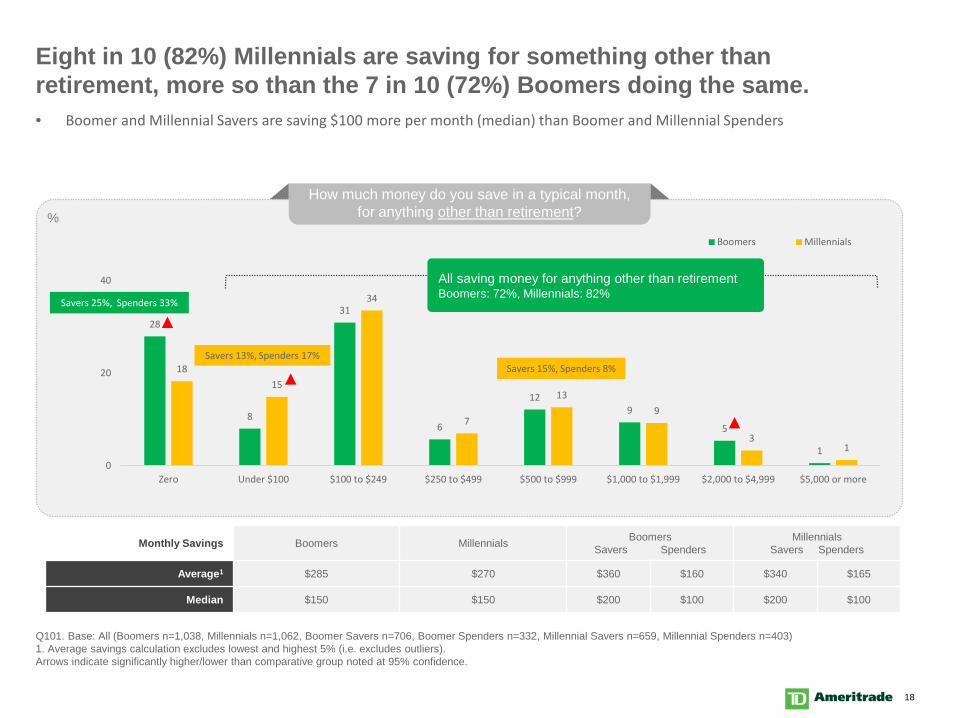
Eight in 10 (82%) Millennials are saving for something other than retirement, more so than the 7 in 10 (72%) Boomers doing the same.
Q101. Base: All (Boomers n=1,038, Millennials n=1,062, Boomer Savers n=706, Boomer Spenders n=332, Millennial Savers n=659, Millennial Spenders n=403)1. Average savings calculation excludes lowest and highest 5% (i.e. excludes outliers).Arrows indicate significantly higher/lower than comparative group noted at 95% confidence.
How much money do you save in a typical month, for anything other than retirement?
28
8
31
6
129
5
1
1815
34
7
139
31
0
20
40
Zero Under $100 $100 to $249 $250 to $499 $500 to $999 $1,000 to $1,999 $2,000 to $4,999 $5,000 or more
Boomers Millennials
All saving money for anything other than retirement Boomers: 72%, Millennials: 82%
Monthly Savings Boomers Millennials Boomers Savers Spenders
MillennialsSavers Spenders
Average1 $285 $270 $360 $160 $340 $165
Median $150 $150 $200 $100 $200 $100
%
• Boomer and Millennial Savers are saving $100 more per month (median) than Boomer and Millennial Spenders
Savers 25%, Spenders 33%
Savers 13%, Spenders 17%Savers 15%, Spenders 8%
19
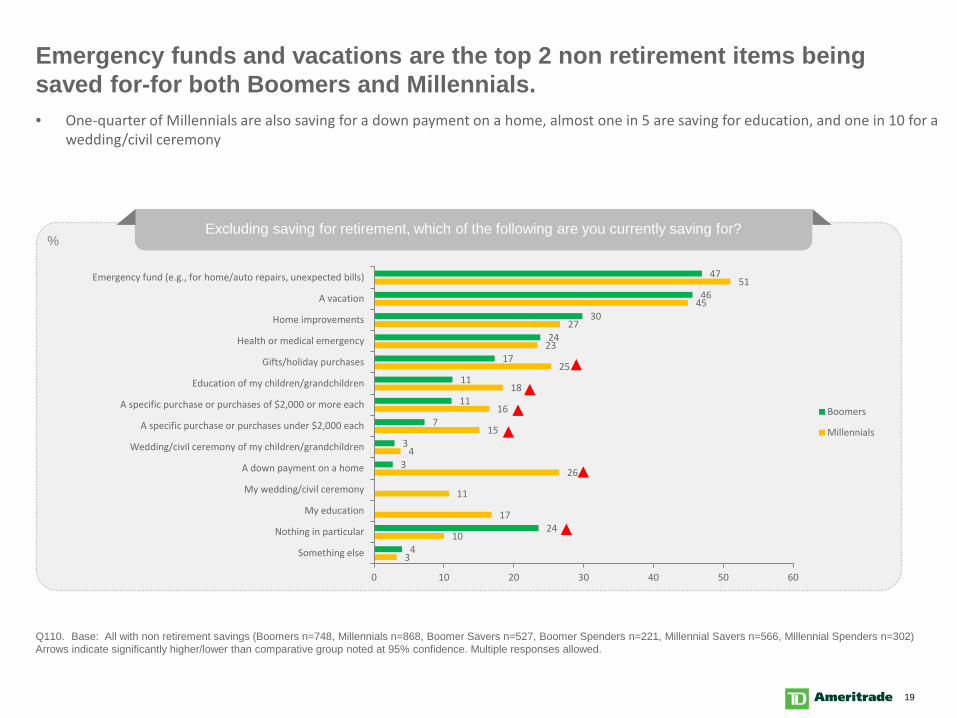
Emergency funds and vacations are the top 2 non retirement items being saved for-for both Boomers and Millennials.
Q110. Base: All with non retirement savings (Boomers n=748, Millennials n=868, Boomer Savers n=527, Boomer Spenders n=221, Millennial Savers n=566, Millennial Spenders n=302)Arrows indicate significantly higher/lower than comparative group noted at 95% confidence. Multiple responses allowed.
Excluding saving for retirement, which of the following are you currently saving for?
3
10
17
11
26
4
15
16
18
25
23
27
45
51
4
24
3
3
7
11
11
17
24
30
46
47
0 10 20 30 40 50 60
Something else
Nothing in particular
My education
My wedding/civil ceremony
A down payment on a home
Wedding/civil ceremony of my children/grandchildren
A specific purchase or purchases under $2,000 each
A specific purchase or purchases of $2,000 or more each
Education of my children/grandchildren
Gifts/holiday purchases
Health or medical emergency
Home improvements
A vacation
Emergency fund (e.g., for home/auto repairs, unexpected bills)
Boomers
Millennials
%
• One-quarter of Millennials are also saving for a down payment on a home, almost one in 5 are saving for education, and one in 10 for a wedding/civil ceremony
20
1
1
1 2
1
2
2
7
6
9
8
17
16
21
24
10
14
30
27
6 7 8 9 10
Not at all happy
Very happy
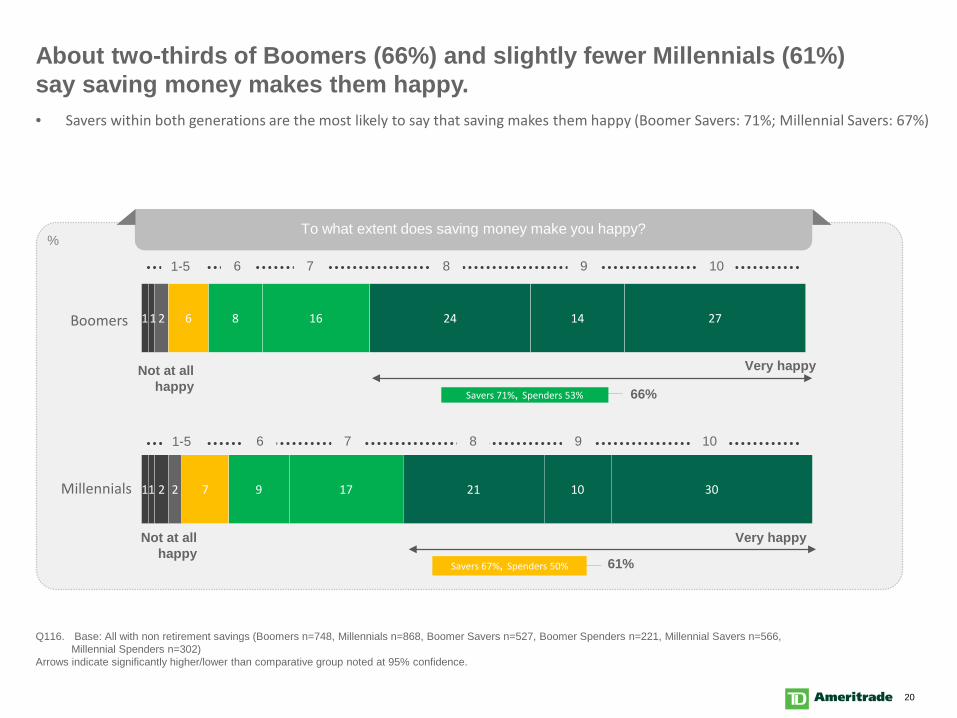
About two-thirds of Boomers (66%) and slightly fewer Millennials (61%) say saving money makes them happy.
Q116. Base: All with non retirement savings (Boomers n=748, Millennials n=868, Boomer Savers n=527, Boomer Spenders n=221, Millennial Savers n=566, Millennial Spenders n=302)
Arrows indicate significantly higher/lower than comparative group noted at 95% confidence.
1-5
To what extent does saving money make you happy?%
Millennials
Boomers
66%
Not at all happy
Very happy
6 7 8 9 101-5
61%
• Savers within both generations are the most likely to say that saving makes them happy (Boomer Savers: 71%; Millennial Savers: 67%)
Savers 71%, Spenders 53%
Savers 67%, Spenders 50%
21
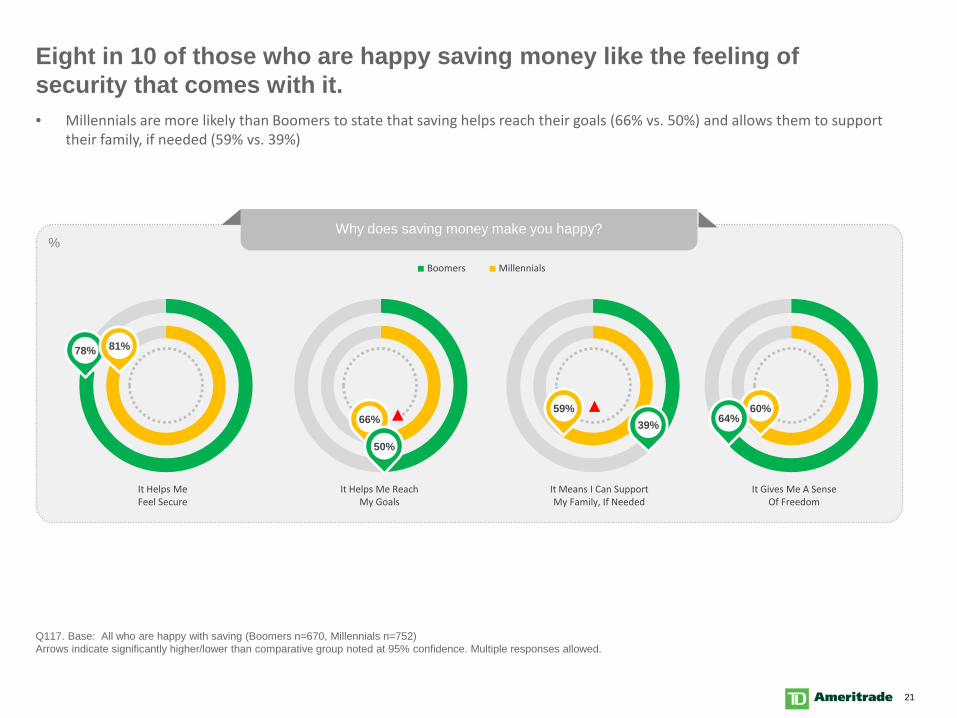
Eight in 10 of those who are happy saving money like the feeling of security that comes with it.
Q117. Base: All who are happy with saving (Boomers n=670, Millennials n=752)Arrows indicate significantly higher/lower than comparative group noted at 95% confidence. Multiple responses allowed.
Why does saving money make you happy?%
• Millennials are more likely than Boomers to state that saving helps reach their goals (66% vs. 50%) and allows them to support their family, if needed (59% vs. 39%)
It Gives Me A SenseOf Freedom
It Helps MeFeel Secure
It Helps Me ReachMy Goals
It Means I Can SupportMy Family, If Needed
78% 81%
66%
50%
59%39%
60%64%
Boomers Millennials
22
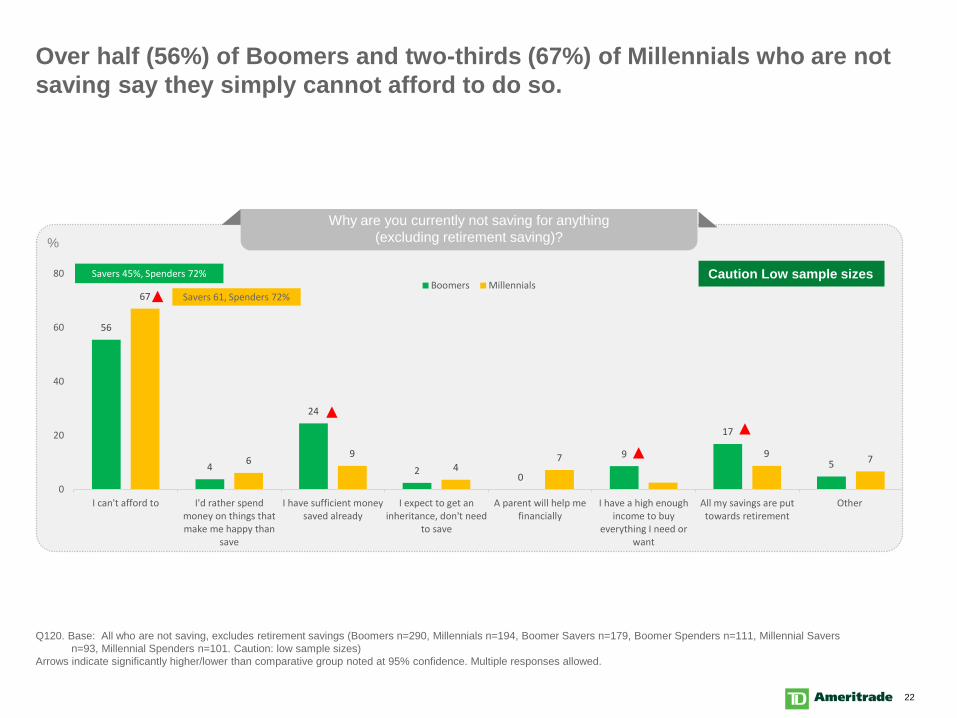
Over half (56%) of Boomers and two-thirds (67%) of Millennials who are not saving say they simply cannot afford to do so.
Q120. Base: All who are not saving, excludes retirement savings (Boomers n=290, Millennials n=194, Boomer Savers n=179, Boomer Spenders n=111, Millennial Savers n=93, Millennial Spenders n=101. Caution: low sample sizes)
Arrows indicate significantly higher/lower than comparative group noted at 95% confidence. Multiple responses allowed.
Why are you currently not saving for anything(excluding retirement saving)?
56
4
24
2 0
9
17
5
67
69
47 9 7
0
20
40
60
80
I can't afford to I'd rather spendmoney on things thatmake me happy than
save
I have sufficient moneysaved already
I expect to get aninheritance, don't need
to save
A parent will help mefinancially
I have a high enoughincome to buy
everything I need orwant
All my savings are puttowards retirement
Other
Boomers Millennials
%
Savers 45%, Spenders 72%
Savers 61, Spenders 72%
Caution Low sample sizes
23
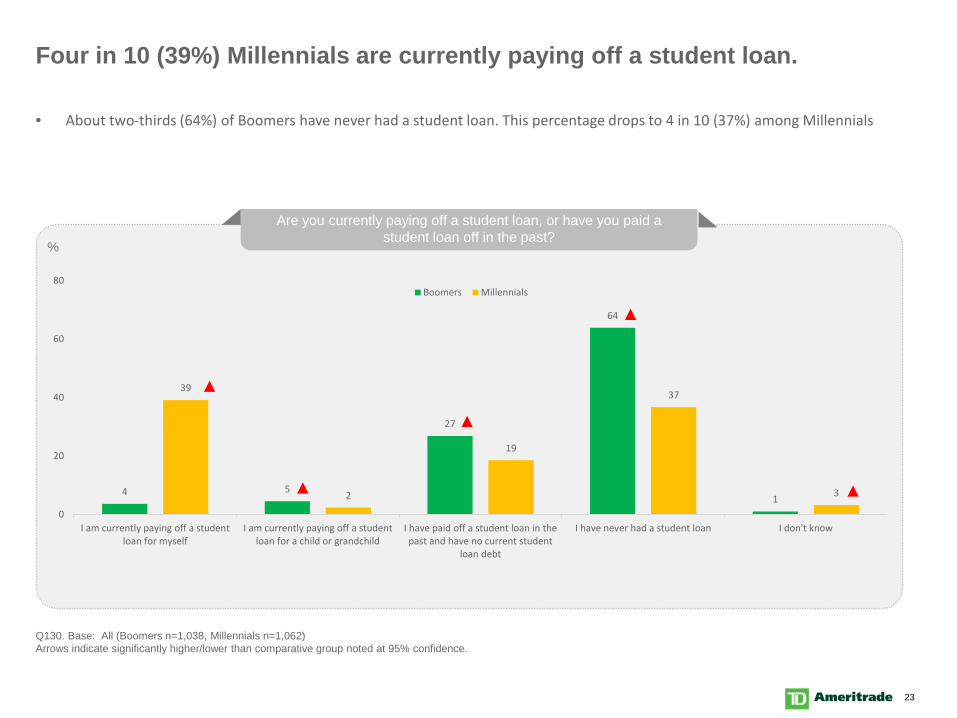
Four in 10 (39%) Millennials are currently paying off a student loan.
Q130. Base: All (Boomers n=1,038, Millennials n=1,062)Arrows indicate significantly higher/lower than comparative group noted at 95% confidence.
Are you currently paying off a student loan, or have you paid a student loan off in the past?
4 5
27
64
1
39
2
19
37
3
0
20
40
60
80
I am currently paying off a studentloan for myself
I am currently paying off a studentloan for a child or grandchild
I have paid off a student loan in thepast and have no current student
loan debt
I have never had a student loan I don't know
Boomers Millennials
%
• About two-thirds (64%) of Boomers have never had a student loan. This percentage drops to 4 in 10 (37%) among Millennials
24
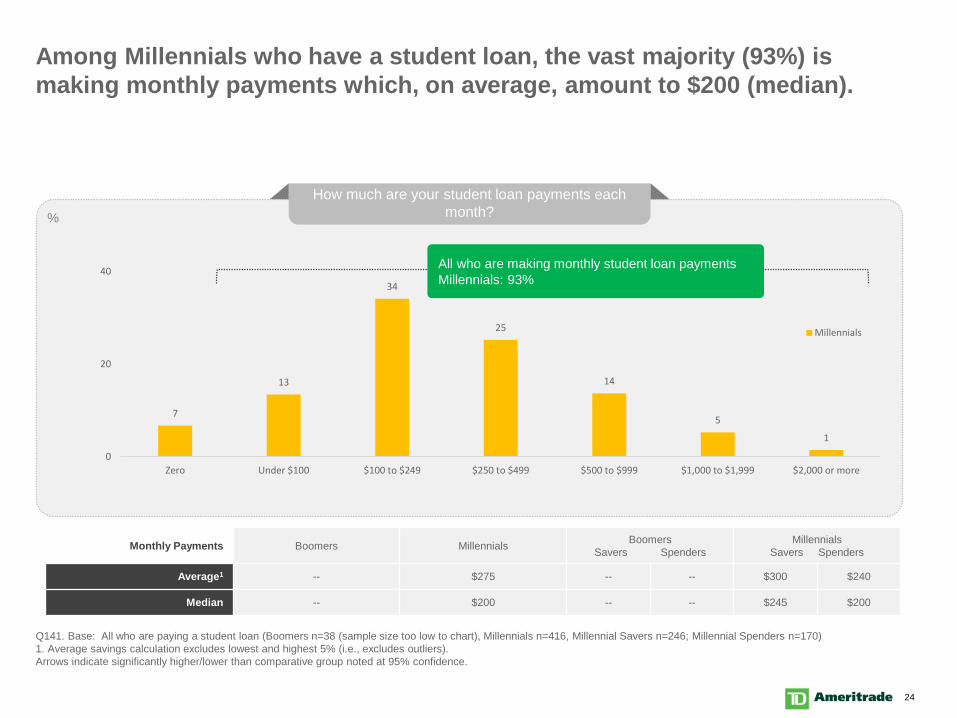
Among Millennials who have a student loan, the vast majority (93%) is making monthly payments which, on average, amount to $200 (median).
Q141. Base: All who are paying a student loan (Boomers n=38 (sample size too low to chart), Millennials n=416, Millennial Savers n=246; Millennial Spenders n=170)1. Average savings calculation excludes lowest and highest 5% (i.e., excludes outliers).Arrows indicate significantly higher/lower than comparative group noted at 95% confidence.
How much are your student loan payments each month?
7
13
34
25
14
5
1
0
20
40
Zero Under $100 $100 to $249 $250 to $499 $500 to $999 $1,000 to $1,999 $2,000 or more
Millennials
Monthly Payments Boomers Millennials Boomers Savers Spenders
MillennialsSavers Spenders
Average1 -- $275 -- -- $300 $240
Median -- $200 -- -- $245 $200
%
All who are making monthly student loan paymentsMillennials: 93%
25
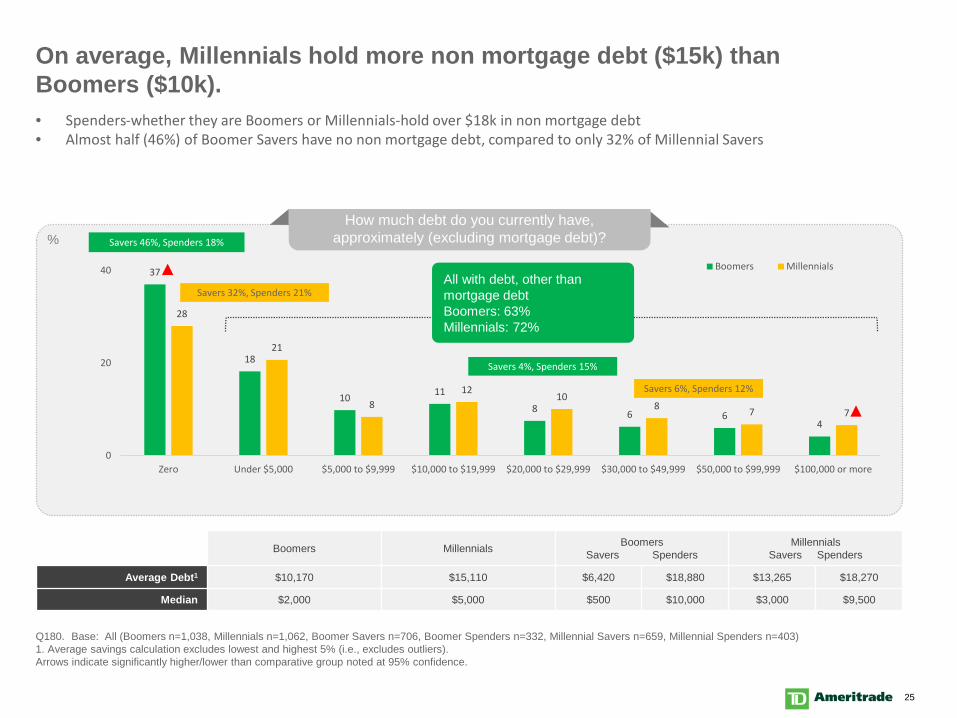
On average, Millennials hold more non mortgage debt ($15k) than Boomers ($10k).
Q180. Base: All (Boomers n=1,038, Millennials n=1,062, Boomer Savers n=706, Boomer Spenders n=332, Millennial Savers n=659, Millennial Spenders n=403) 1. Average savings calculation excludes lowest and highest 5% (i.e., excludes outliers).Arrows indicate significantly higher/lower than comparative group noted at 95% confidence.
37
18
10 11
8 6 64
28
21
812
108 7 7
0
20
40
Zero Under $5,000 $5,000 to $9,999 $10,000 to $19,999 $20,000 to $29,999 $30,000 to $49,999 $50,000 to $99,999 $100,000 or more
Boomers Millennials
Boomers Millennials Boomers Savers Spenders
MillennialsSavers Spenders
Average Debt1 $10,170 $15,110 $6,420 $18,880 $13,265 $18,270
Median $2,000 $5,000 $500 $10,000 $3,000 $9,500
All with debt, other than mortgage debtBoomers: 63%Millennials: 72%
How much debt do you currently have, approximately (excluding mortgage debt)? % Savers 46%, Spenders 18%
• Spenders-whether they are Boomers or Millennials-hold over $18k in non mortgage debt• Almost half (46%) of Boomer Savers have no non mortgage debt, compared to only 32% of Millennial Savers
Savers 32%, Spenders 21%
Savers 4%, Spenders 15%
Savers 6%, Spenders 12%
26
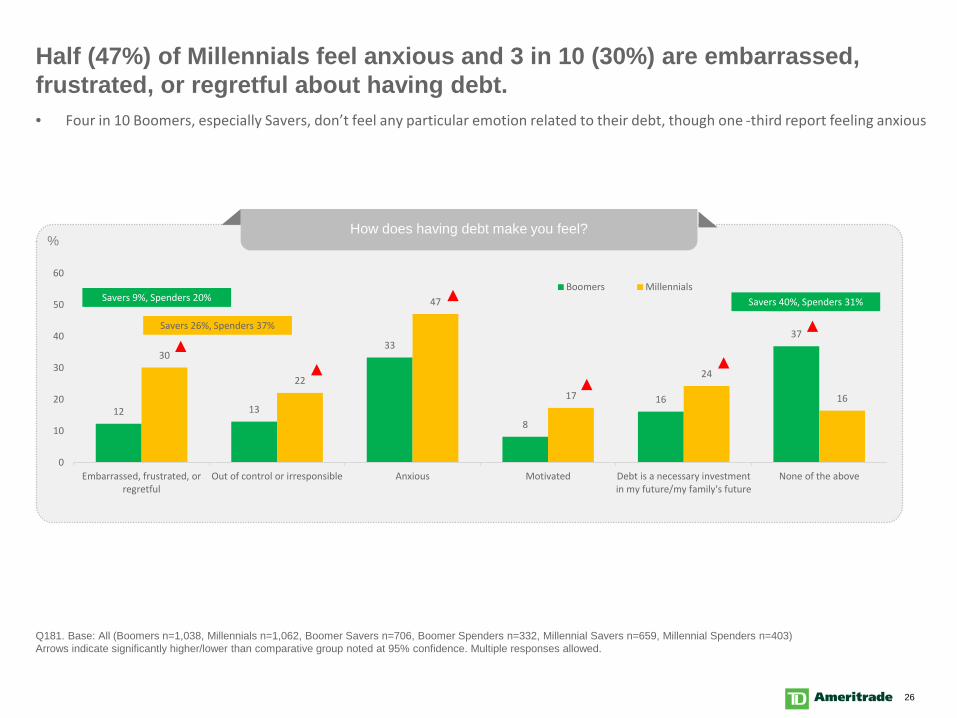
Half (47%) of Millennials feel anxious and 3 in 10 (30%) are embarrassed, frustrated, or regretful about having debt.
Q181. Base: All (Boomers n=1,038, Millennials n=1,062, Boomer Savers n=706, Boomer Spenders n=332, Millennial Savers n=659, Millennial Spenders n=403)Arrows indicate significantly higher/lower than comparative group noted at 95% confidence. Multiple responses allowed.
How does having debt make you feel?
12 13
33
8
16
37
30
22
47
17
24
16
0
10
20
30
40
50
60
Embarrassed, frustrated, orregretful
Out of control or irresponsible Anxious Motivated Debt is a necessary investmentin my future/my family's future
None of the above
Boomers Millennials
%
• Four in 10 Boomers, especially Savers, don’t feel any particular emotion related to their debt, though one -third report feeling anxious
Savers 26%, Spenders 37%
Savers 9%, Spenders 20% Savers 40%, Spenders 31%

27
Spending Habits
28
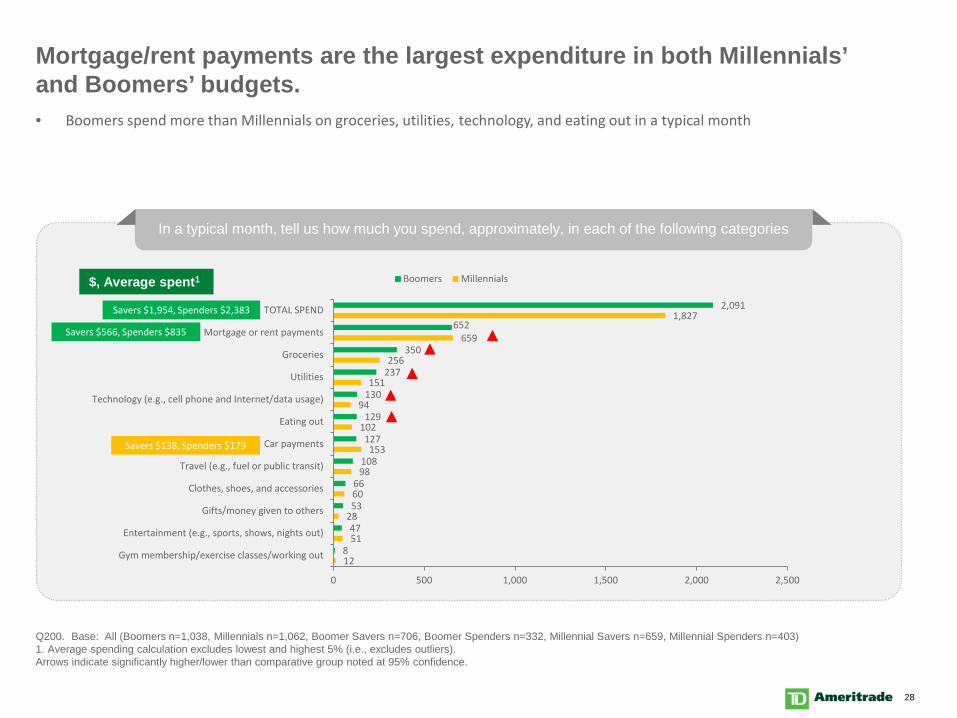
Mortgage/rent payments are the largest expenditure in both Millennials’ and Boomers’ budgets.
Q200. Base: All (Boomers n=1,038, Millennials n=1,062, Boomer Savers n=706, Boomer Spenders n=332, Millennial Savers n=659, Millennial Spenders n=403)1. Average spending calculation excludes lowest and highest 5% (i.e., excludes outliers).Arrows indicate significantly higher/lower than comparative group noted at 95% confidence.
In a typical month, tell us how much you spend, approximately, in each of the following categories
12
51
28
60
98
153
102
94
151
256
659
1,827
8
47
53
66
108
127
129
130
237
350
652
2,091
0 500 1,000 1,500 2,000 2,500
Gym membership/exercise classes/working out
Entertainment (e.g., sports, shows, nights out)
Gifts/money given to others
Clothes, shoes, and accessories
Travel (e.g., fuel or public transit)
Car payments
Eating out
Technology (e.g., cell phone and Internet/data usage)
Utilities
Groceries
Mortgage or rent payments
TOTAL SPEND
Boomers Millennials$, Average spent1
Savers $138, Spenders $179
• Boomers spend more than Millennials on groceries, utilities, technology, and eating out in a typical month
Savers $566, Spenders $835
Savers $1,954, Spenders $2,383
29
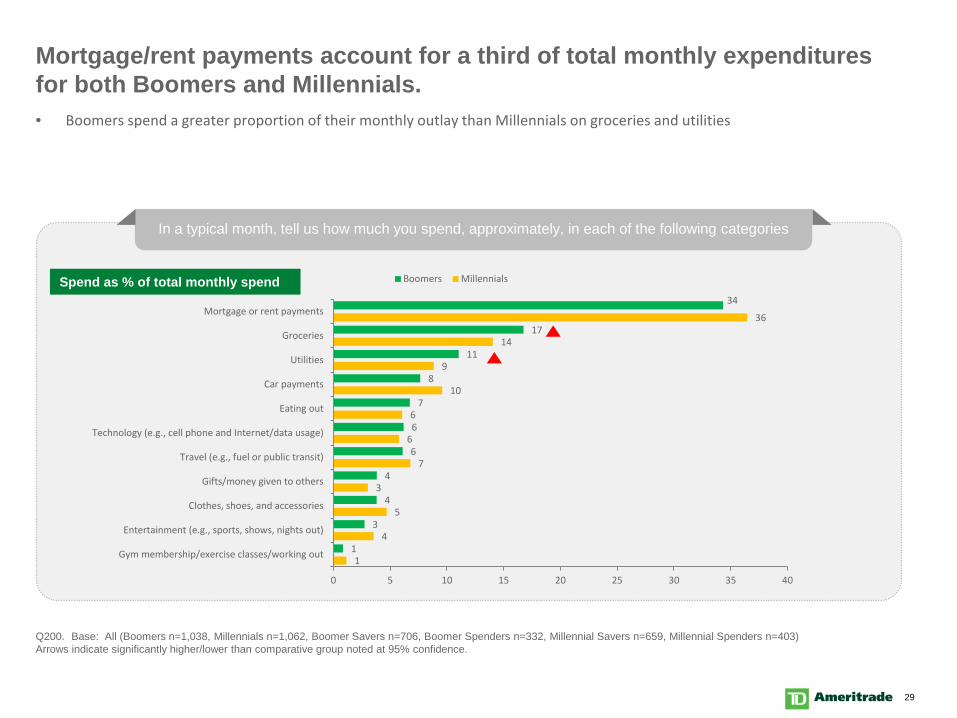
Mortgage/rent payments account for a third of total monthly expenditures for both Boomers and Millennials.
Q200. Base: All (Boomers n=1,038, Millennials n=1,062, Boomer Savers n=706, Boomer Spenders n=332, Millennial Savers n=659, Millennial Spenders n=403)Arrows indicate significantly higher/lower than comparative group noted at 95% confidence.
In a typical month, tell us how much you spend, approximately, in each of the following categories
1
4
5
3
7
6
6
10
9
14
36
1
3
4
4
6
6
7
8
11
17
34
0 5 10 15 20 25 30 35 40
Gym membership/exercise classes/working out
Entertainment (e.g., sports, shows, nights out)
Clothes, shoes, and accessories
Gifts/money given to others
Travel (e.g., fuel or public transit)
Technology (e.g., cell phone and Internet/data usage)
Eating out
Car payments
Utilities
Groceries
Mortgage or rent payments
Boomers MillennialsSpend as % of total monthly spend
• Boomers spend a greater proportion of their monthly outlay than Millennials on groceries and utilities
30
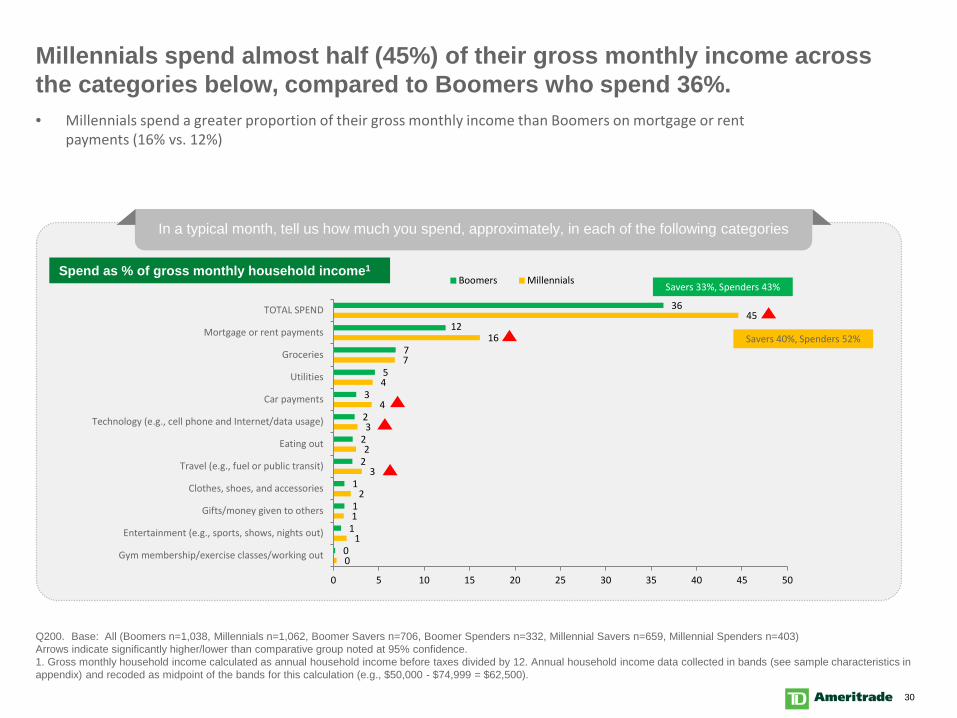
Millennials spend almost half (45%) of their gross monthly income across the categories below, compared to Boomers who spend 36%.
Q200. Base: All (Boomers n=1,038, Millennials n=1,062, Boomer Savers n=706, Boomer Spenders n=332, Millennial Savers n=659, Millennial Spenders n=403)Arrows indicate significantly higher/lower than comparative group noted at 95% confidence.1. Gross monthly household income calculated as annual household income before taxes divided by 12. Annual household income data collected in bands (see sample characteristics in appendix) and recoded as midpoint of the bands for this calculation (e.g., $50,000 - $74,999 = $62,500).
In a typical month, tell us how much you spend, approximately, in each of the following categories
0
1
1
2
3
2
3
4
4
7
16
45
0
1
1
1
2
2
2
3
5
7
12
36
0 5 10 15 20 25 30 35 40 45 50
Gym membership/exercise classes/working out
Entertainment (e.g., sports, shows, nights out)
Gifts/money given to others
Clothes, shoes, and accessories
Travel (e.g., fuel or public transit)
Eating out
Technology (e.g., cell phone and Internet/data usage)
Car payments
Utilities
Groceries
Mortgage or rent payments
TOTAL SPEND
Boomers MillennialsSpend as % of gross monthly household income1
• Millennials spend a greater proportion of their gross monthly income than Boomers on mortgage or rent payments (16% vs. 12%)
Savers 40%, Spenders 52%
Savers 33%, Spenders 43%
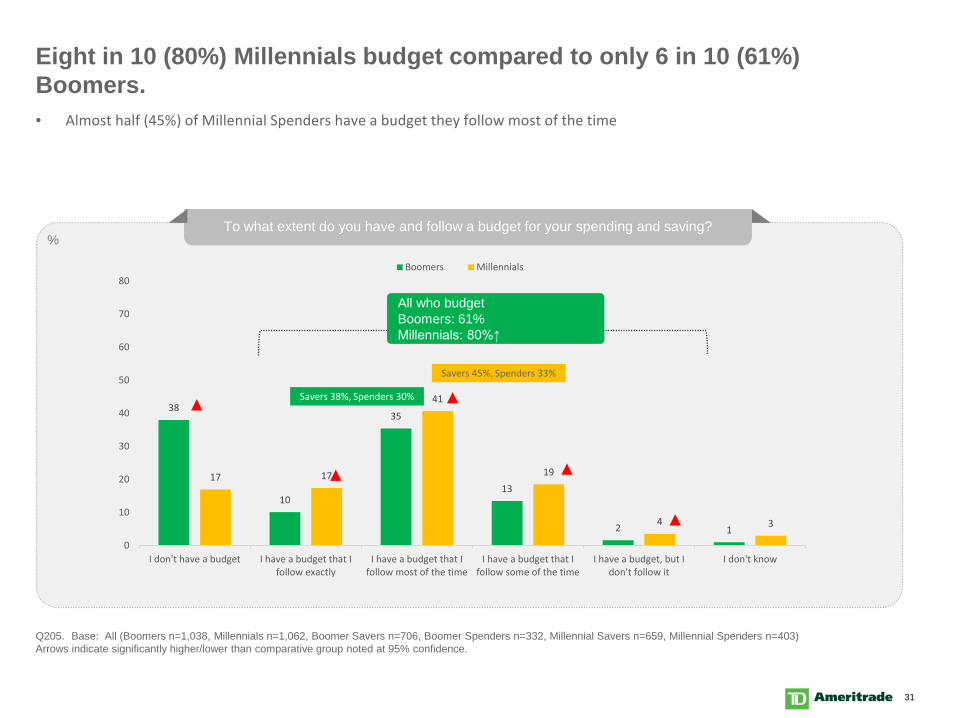
31
To what extent do you have and follow a budget for your spending and saving?
Eight in 10 (80%) Millennials budget compared to only 6 in 10 (61%) Boomers.
Q205. Base: All (Boomers n=1,038, Millennials n=1,062, Boomer Savers n=706, Boomer Spenders n=332, Millennial Savers n=659, Millennial Spenders n=403)Arrows indicate significantly higher/lower than comparative group noted at 95% confidence.
38
10
35
13
2 1
17 17
41
19
4 3
I don't have a budget I have a budget that Ifollow exactly
I have a budget that Ifollow most of the time
I have a budget that Ifollow some of the time
I have a budget, but Idon't follow it
I don't know0
10
20
30
40
50
60
70
80Boomers Millennials
All who budgetBoomers: 61%Millennials: 80%↑
%
• Almost half (45%) of Millennial Spenders have a budget they follow most of the time
Savers 45%, Spenders 33%
Savers 38%, Spenders 30%
32
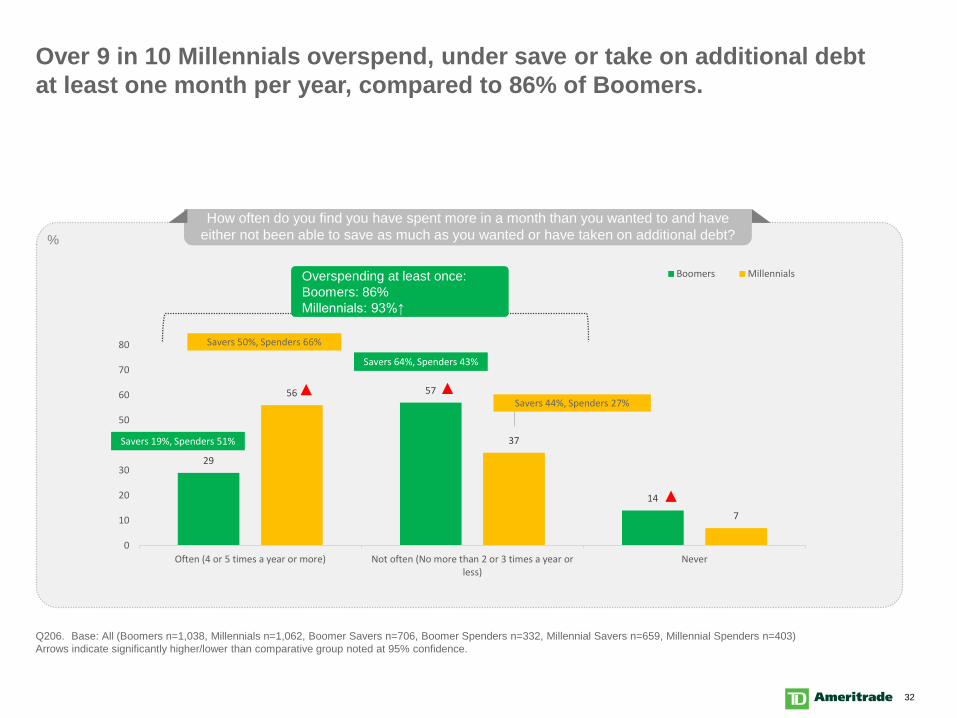
How often do you find you have spent more in a month than you wanted to and have either not been able to save as much as you wanted or have taken on additional debt?
Over 9 in 10 Millennials overspend, under save or take on additional debt at least one month per year, compared to 86% of Boomers.
Q206. Base: All (Boomers n=1,038, Millennials n=1,062, Boomer Savers n=706, Boomer Spenders n=332, Millennial Savers n=659, Millennial Spenders n=403)Arrows indicate significantly higher/lower than comparative group noted at 95% confidence.
29
57
14
56
37
7
Often (4 or 5 times a year or more) Not often (No more than 2 or 3 times a year orless)
Never0
10
20
30
40
50
60
70
80
Boomers Millennials
%
Savers 19%, Spenders 51%
Overspending at least once:Boomers: 86%Millennials: 93%↑
Savers 44%, Spenders 27%
Savers 64%, Spenders 43%
Savers 50%, Spenders 66%
33
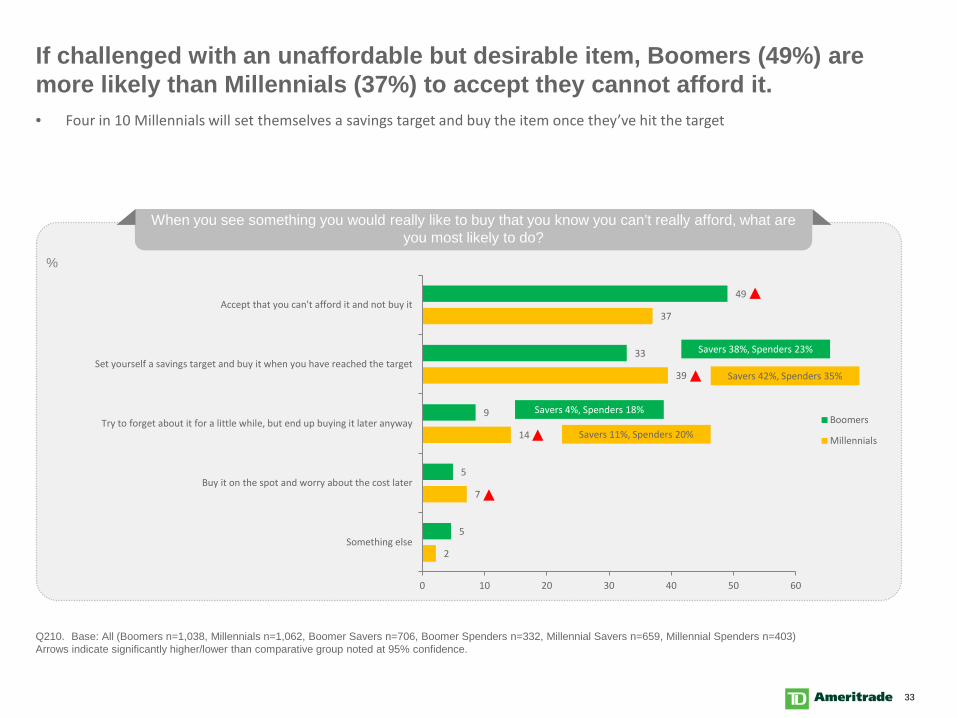
If challenged with an unaffordable but desirable item, Boomers (49%) are more likely than Millennials (37%) to accept they cannot afford it.
Q210. Base: All (Boomers n=1,038, Millennials n=1,062, Boomer Savers n=706, Boomer Spenders n=332, Millennial Savers n=659, Millennial Spenders n=403) Arrows indicate significantly higher/lower than comparative group noted at 95% confidence.
When you see something you would really like to buy that you know you can’t really afford, what are you most likely to do?
2
7
14
39
37
5
5
9
33
49
0 10 20 30 40 50 60
Something else
Buy it on the spot and worry about the cost later
Try to forget about it for a little while, but end up buying it later anyway
Set yourself a savings target and buy it when you have reached the target
Accept that you can't afford it and not buy it
Boomers
Millennials
%
• Four in 10 Millennials will set themselves a savings target and buy the item once they’ve hit the target
Savers 42%, Spenders 35%
Savers 4%, Spenders 18%
Savers 11%, Spenders 20%
Savers 38%, Spenders 23%
34
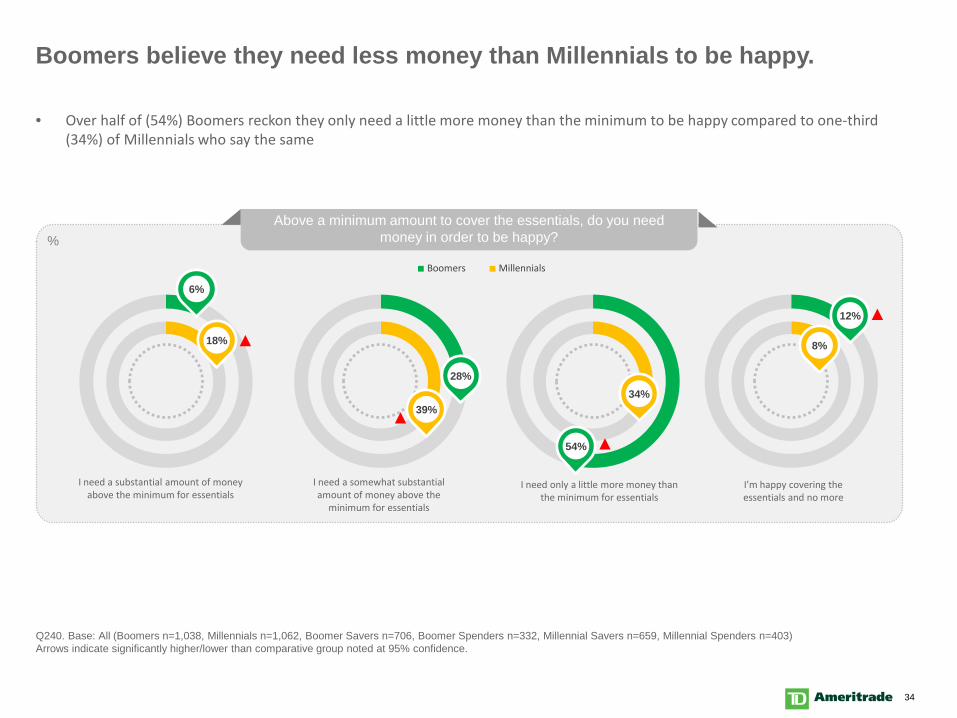
Boomers believe they need less money than Millennials to be happy.
Q240. Base: All (Boomers n=1,038, Millennials n=1,062, Boomer Savers n=706, Boomer Spenders n=332, Millennial Savers n=659, Millennial Spenders n=403) Arrows indicate significantly higher/lower than comparative group noted at 95% confidence.
Above a minimum amount to cover the essentials, do you need money in order to be happy?%
• Over half of (54%) Boomers reckon they only need a little more money than the minimum to be happy compared to one-third (34%) of Millennials who say the same
6%
18%
39%
28%34%
54%
8%
12%
I'm happy covering the essentials and no more
I need a substantial amount of money above the minimum for essentials
I need a somewhat substantial amount of money above the
minimum for essentials
I need only a little more money than the minimum for essentials
Boomers Millennials
35
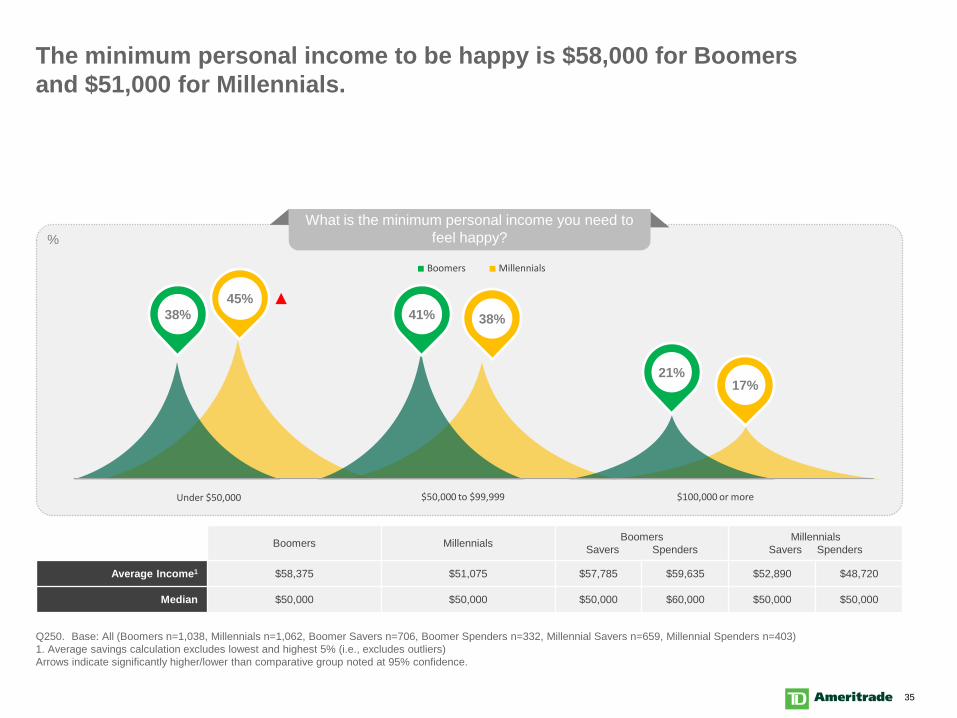
The minimum personal income to be happy is $58,000 for Boomers and $51,000 for Millennials.
Q250. Base: All (Boomers n=1,038, Millennials n=1,062, Boomer Savers n=706, Boomer Spenders n=332, Millennial Savers n=659, Millennial Spenders n=403) 1. Average savings calculation excludes lowest and highest 5% (i.e., excludes outliers)Arrows indicate significantly higher/lower than comparative group noted at 95% confidence.
Boomers Millennials BoomersSavers Spenders
MillennialsSavers Spenders
Average Income1 $58,375 $51,075 $57,785 $59,635 $52,890 $48,720
Median $50,000 $50,000 $50,000 $60,000 $50,000 $50,000
What is the minimum personal income you need to feel happy?%
38%45%
41% 38%
21%17%
$100,000 or moreUnder $50,000 $50,000 to $99,999
Boomers Millennials
36
29
58
6
14
10
9
10
5
11
5
10
3
10
2
6
2
3
1
4
1
2 8-10
Do not feel any pressure Definitely feel pressure
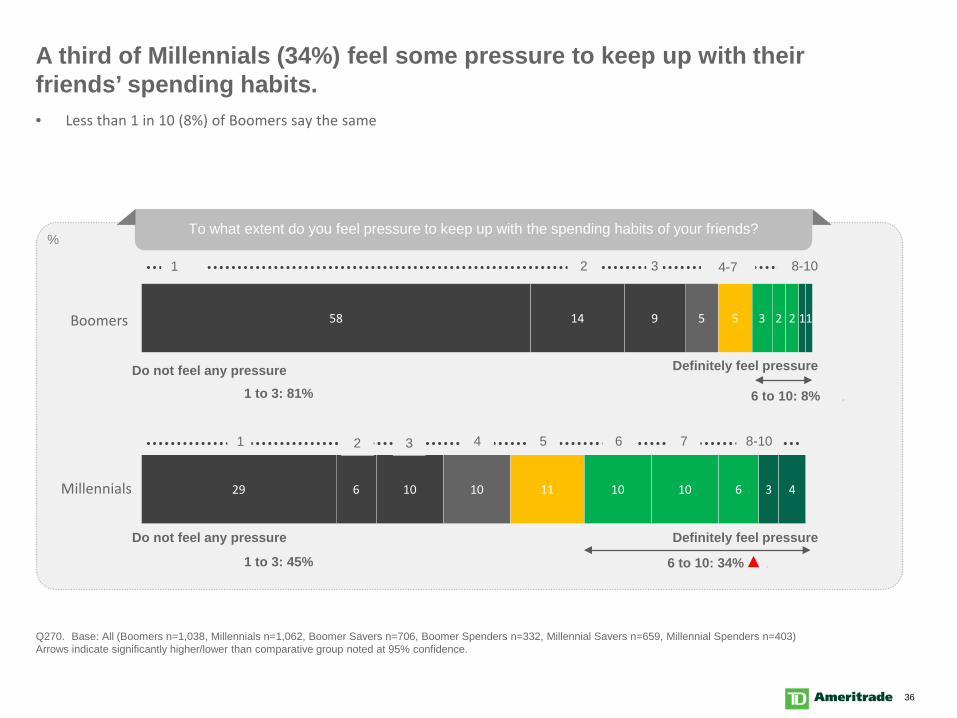
A third of Millennials (34%) feel some pressure to keep up with their friends’ spending habits.
Q270. Base: All (Boomers n=1,038, Millennials n=1,062, Boomer Savers n=706, Boomer Spenders n=332, Millennial Savers n=659, Millennial Spenders n=403) Arrows indicate significantly higher/lower than comparative group noted at 95% confidence.
1
To what extent do you feel pressure to keep up with the spending habits of your friends?%
Millennials
Boomers
6 to 10: 8% .
Do not feel any pressure Definitely feel pressure
4 5 6 7 8-101
1 to 3: 45%
3 4-7
2 3
• Less than 1 in 10 (8%) of Boomers say the same
6 to 10: 34% .
1 to 3: 81%
37
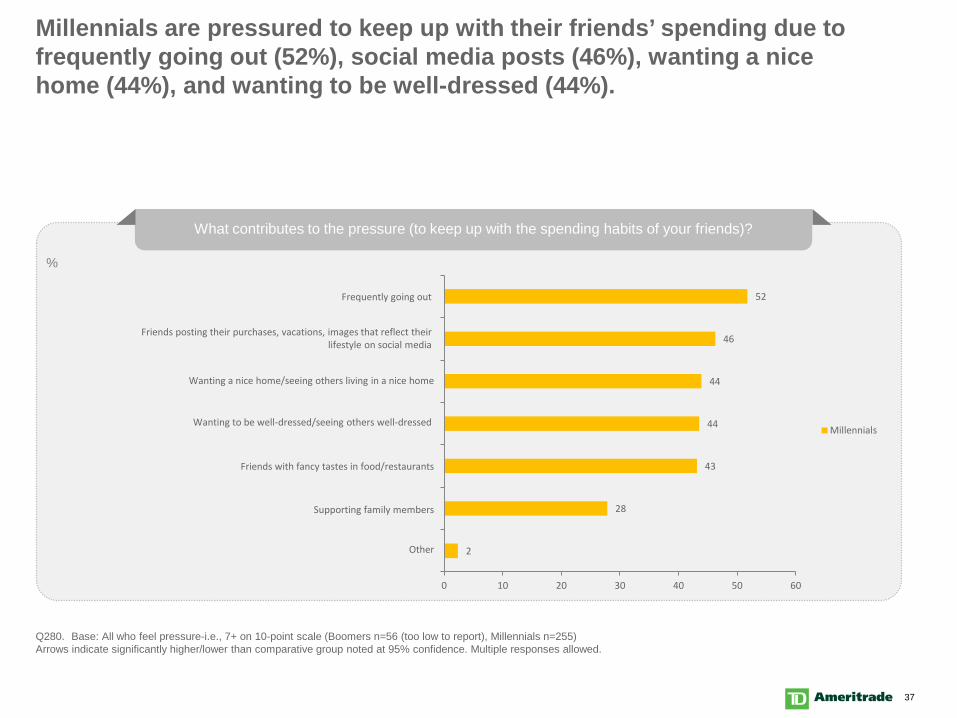
Millennials are pressured to keep up with their friends’ spending due to frequently going out (52%), social media posts (46%), wanting a nice home (44%), and wanting to be well-dressed (44%).
Q280. Base: All who feel pressure-i.e., 7+ on 10-point scale (Boomers n=56 (too low to report), Millennials n=255)Arrows indicate significantly higher/lower than comparative group noted at 95% confidence. Multiple responses allowed.
What contributes to the pressure (to keep up with the spending habits of your friends)?
2
28
43
44
44
46
52
0 10 20 30 40 50 60
Millennials
%
Frequently going out
Friends posting their purchases, vacations, images that reflect their lifestyle on social media
Supporting family members
Wanting a nice home/seeing others living in a nice home
Wanting to be well-dressed/seeing others well-dressed
Friends with fancy tastes in food/restaurants
Other
38
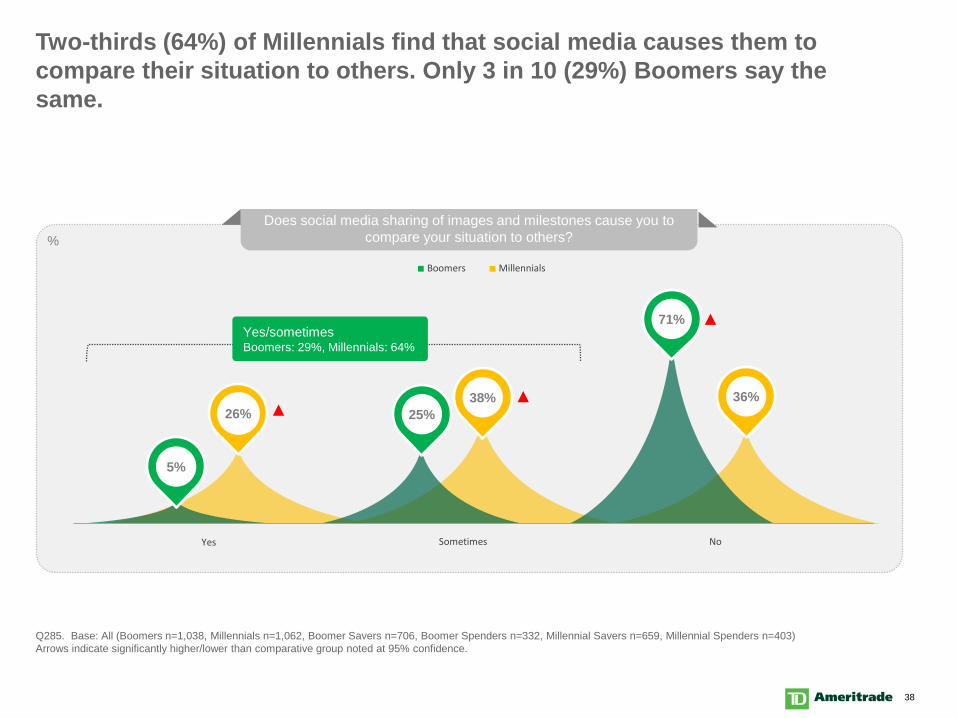
Two-thirds (64%) of Millennials find that social media causes them to compare their situation to others. Only 3 in 10 (29%) Boomers say the same.
Q285. Base: All (Boomers n=1,038, Millennials n=1,062, Boomer Savers n=706, Boomer Spenders n=332, Millennial Savers n=659, Millennial Spenders n=403) Arrows indicate significantly higher/lower than comparative group noted at 95% confidence.
Does social media sharing of images and milestones cause you to compare your situation to others?%
26% 25%38%
71%
36%
NoYes Sometimes
5%
Yes/sometimesBoomers: 29%, Millennials: 64%
Boomers Millennials
39
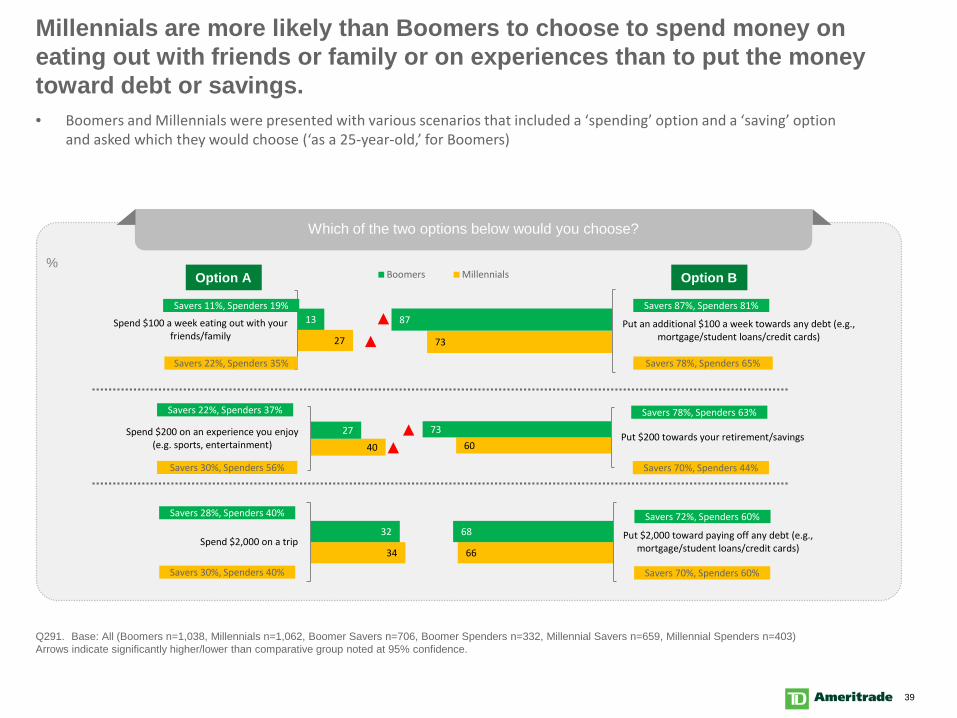
Millennials are more likely than Boomers to choose to spend money on eating out with friends or family or on experiences than to put the money toward debt or savings.
Q291. Base: All (Boomers n=1,038, Millennials n=1,062, Boomer Savers n=706, Boomer Spenders n=332, Millennial Savers n=659, Millennial Spenders n=403) Arrows indicate significantly higher/lower than comparative group noted at 95% confidence.
Which of the two options below would you choose?
27
13Spend $100 a week eating out with yourfriends/family
%
40
27Spend $200 on an experience you enjoy(e.g. sports, entertainment)
73
87 Put an additional $100 a week towards any debt (e.g.,mortgage/student loans/credit cards)
6073
Put $200 towards your retirement/savings
Option A Option B
Savers 22%, Spenders 35% Savers 78%, Spenders 65%
Savers 30%, Spenders 56% Savers 70%, Spenders 44%
Savers 70%, Spenders 60%Savers 30%, Spenders 40%
Savers 87%, Spenders 81%Savers 11%, Spenders 19%
Savers 22%, Spenders 37% Savers 78%, Spenders 63%
Savers 28%, Spenders 40% Savers 72%, Spenders 60%
34
32Spend $2,000 on a trip
• Boomers and Millennials were presented with various scenarios that included a ‘spending’ option and a ‘saving’ option and asked which they would choose (‘as a 25-year-old,’ for Boomers)
66
68 Put $2,000 toward paying off any debt (e.g.,mortgage/student loans/credit cards)
Boomers Millennials
40
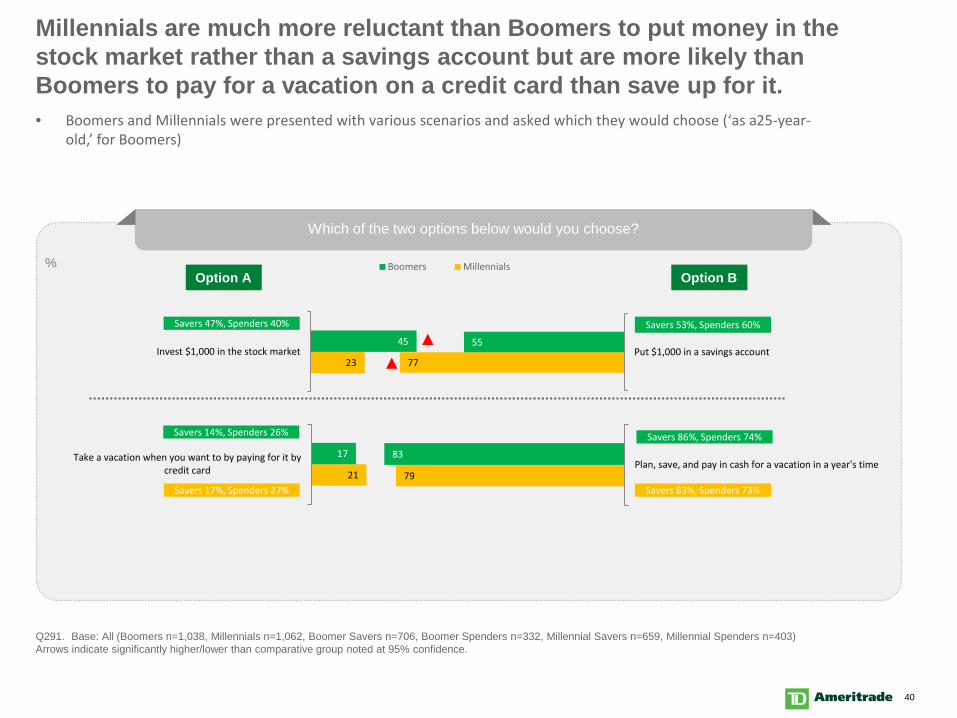
Millennials are much more reluctant than Boomers to put money in the stock market rather than a savings account but are more likely than Boomers to pay for a vacation on a credit card than save up for it.
Q291. Base: All (Boomers n=1,038, Millennials n=1,062, Boomer Savers n=706, Boomer Spenders n=332, Millennial Savers n=659, Millennial Spenders n=403) Arrows indicate significantly higher/lower than comparative group noted at 95% confidence.
Which of the two options below would you choose?
% Boomers Millennials
Savers 47%, Spenders 40% Savers 53%, Spenders 60%
Savers 14%, Spenders 26% Savers 86%, Spenders 74%
23
45Invest $1,000 in the stock market
21
17Take a vacation when you want to by paying for it bycredit card
• Boomers and Millennials were presented with various scenarios and asked which they would choose (‘as a 25-year-old,’ for Boomers)
77
55Put $1,000 in a savings account
79
83Plan, save, and pay in cash for a vacation in a year's time
Savers 83%, Spenders 73%Savers 17%, Spenders 27%
Option A Option B

41
Goal Setting
42
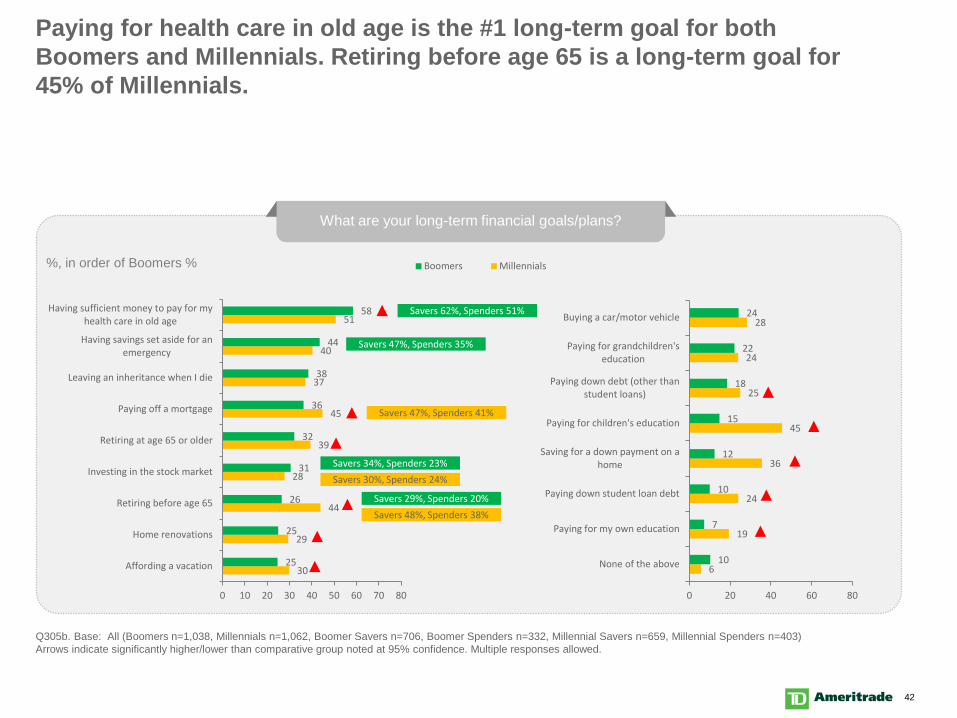
Paying for health care in old age is the #1 long-term goal for both Boomers and Millennials. Retiring before age 65 is a long-term goal for 45% of Millennials.
Q305b. Base: All (Boomers n=1,038, Millennials n=1,062, Boomer Savers n=706, Boomer Spenders n=332, Millennial Savers n=659, Millennial Spenders n=403) Arrows indicate significantly higher/lower than comparative group noted at 95% confidence. Multiple responses allowed.
What are your long-term financial goals/plans?
30
29
44
28
39
45
37
40
51
25
25
26
31
32
36
38
44
58
0 10 20 30 40 50 60 70 80
Affording a vacation
Home renovations
Retiring before age 65
Investing in the stock market
Retiring at age 65 or older
Paying off a mortgage
Leaving an inheritance when I die
Having savings set aside for anemergency
Having sufficient money to pay for myhealth care in old age
%, in order of Boomers % Boomers Millennials
Savers 47%, Spenders 41%
Savers 62%, Spenders 51%
Savers 47%, Spenders 35%
Savers 34%, Spenders 23%Savers 30%, Spenders 24%
Savers 29%, Spenders 20%Savers 48%, Spenders 38%
6
19
24
36
45
25
24
28
10
7
10
12
15
18
22
24
0 20 40 60 80
None of the above
Paying for my own education
Paying down student loan debt
Saving for a down payment on ahome
Paying for children's education
Paying down debt (other thanstudent loans)
Paying for grandchildren'seducation
Buying a car/motor vehicle
43
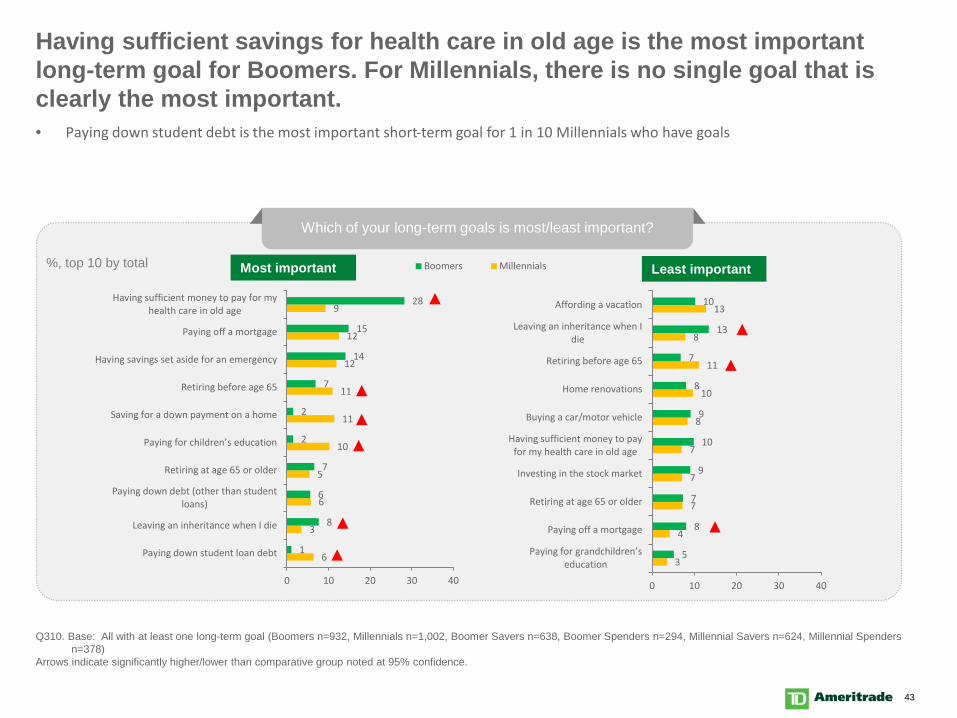
Having sufficient savings for health care in old age is the most important long-term goal for Boomers. For Millennials, there is no single goal that is clearly the most important.
Q310. Base: All with at least one long-term goal (Boomers n=932, Millennials n=1,002, Boomer Savers n=638, Boomer Spenders n=294, Millennial Savers n=624, Millennial Spenders n=378)
Arrows indicate significantly higher/lower than comparative group noted at 95% confidence.
Which of your long-term goals is most/least important?
6
3
6
5
10
11
11
12
12
9
1
8
6
7
2
2
7
14
15
28
0 10 20 30 40
Paying down student loan debt
Leaving an inheritance when I die
Paying down debt (other than studentloans)
Retiring at age 65 or older
Paying for children’s education
Saving for a down payment on a home
Retiring before age 65
Having savings set aside for an emergency
Paying off a mortgage
Having sufficient money to pay for myhealth care in old age
%, top 10 by total
3
4
7
7
7
8
10
11
8
13
5
8
7
9
10
9
8
7
13
10
0 10 20 30 40
Paying for grandchildren’s education
Paying off a mortgage
Retiring at age 65 or older
Investing in the stock market
Having sufficient money to payfor my health care in old age
Buying a car/motor vehicle
Home renovations
Retiring before age 65
Leaving an inheritance when Idie
Affording a vacation
Boomers MillennialsMost important Least important
• Paying down student debt is the most important short-term goal for 1 in 10 Millennials who have goals
44
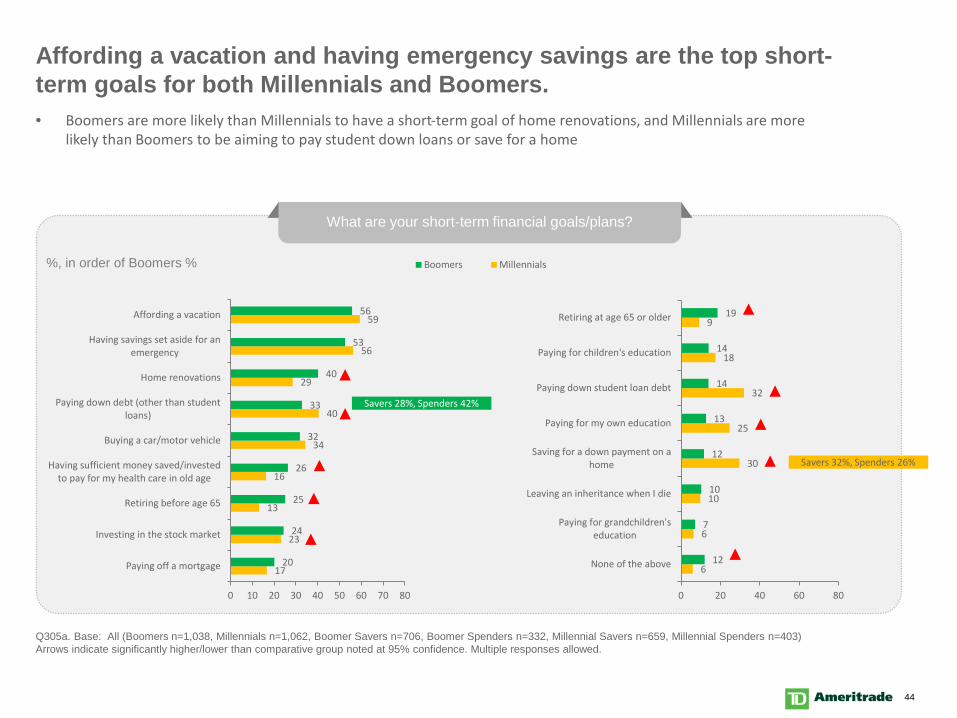
Affording a vacation and having emergency savings are the top short-term goals for both Millennials and Boomers.
Q305a. Base: All (Boomers n=1,038, Millennials n=1,062, Boomer Savers n=706, Boomer Spenders n=332, Millennial Savers n=659, Millennial Spenders n=403) Arrows indicate significantly higher/lower than comparative group noted at 95% confidence. Multiple responses allowed.
What are your short-term financial goals/plans?
17
23
13
16
34
40
29
56
59
20
24
25
26
32
33
40
53
56
0 10 20 30 40 50 60 70 80
Paying off a mortgage
Investing in the stock market
Retiring before age 65
Having sufficient money saved/investedto pay for my health care in old age
Buying a car/motor vehicle
Paying down debt (other than studentloans)
Home renovations
Having savings set aside for anemergency
Affording a vacation
%, in order of Boomers % Boomers Millennials
Savers 32%, Spenders 26%
Savers 28%, Spenders 42%
6
6
10
30
25
32
18
9
12
7
10
12
13
14
14
19
0 20 40 60 80
None of the above
Paying for grandchildren'seducation
Leaving an inheritance when I die
Saving for a down payment on ahome
Paying for my own education
Paying down student loan debt
Paying for children's education
Retiring at age 65 or older
• Boomers are more likely than Millennials to have a short-term goal of home renovations, and Millennials are more likely than Boomers to be aiming to pay student down loans or save for a home
45
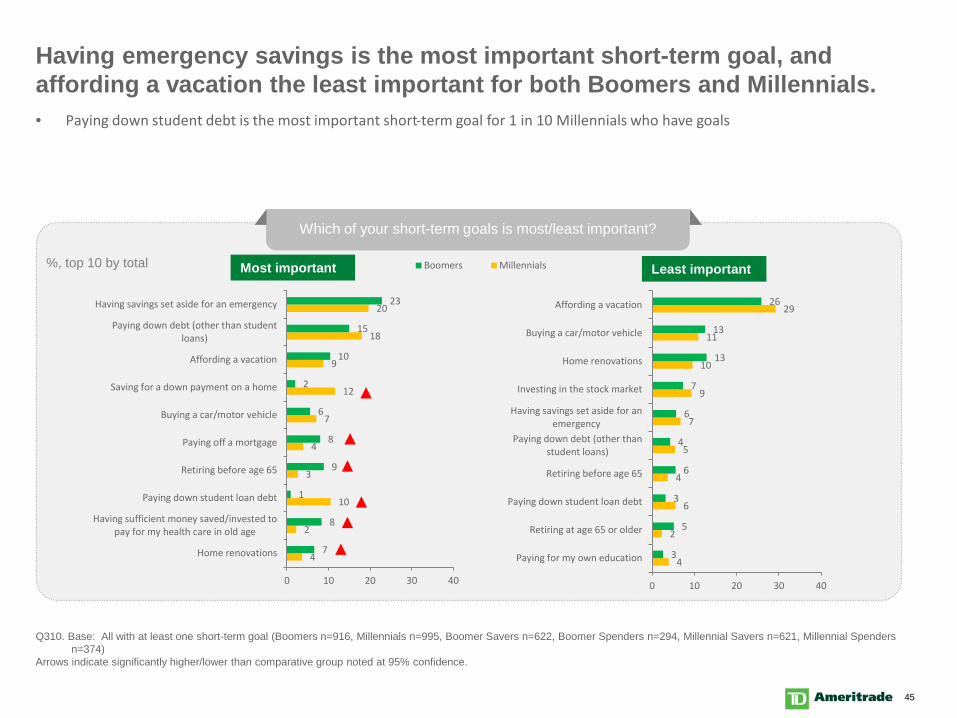
Having emergency savings is the most important short-term goal, and affording a vacation the least important for both Boomers and Millennials.
Q310. Base: All with at least one short-term goal (Boomers n=916, Millennials n=995, Boomer Savers n=622, Boomer Spenders n=294, Millennial Savers n=621, Millennial Spenders n=374)
Arrows indicate significantly higher/lower than comparative group noted at 95% confidence.
Which of your short-term goals is most/least important?
4
2
10
3
4
7
12
9
18
20
7
8
1
9
8
6
2
10
15
23
0 10 20 30 40
Home renovations
Having sufficient money saved/invested topay for my health care in old age
Paying down student loan debt
Retiring before age 65
Paying off a mortgage
Buying a car/motor vehicle
Saving for a down payment on a home
Affording a vacation
Paying down debt (other than studentloans)
Having savings set aside for an emergency
%, top 10 by total
4
2
6
4
5
7
9
10
11
29
3
5
3
6
4
6
7
13
13
26
0 10 20 30 40
Paying for my own education
Retiring at age 65 or older
Paying down student loan debt
Retiring before age 65
Paying down debt (other thanstudent loans)
Having savings set aside for anemergency
Investing in the stock market
Home renovations
Buying a car/motor vehicle
Affording a vacation
Boomers MillennialsMost important Least important
• Paying down student debt is the most important short-term goal for 1 in 10 Millennials who have goals
46
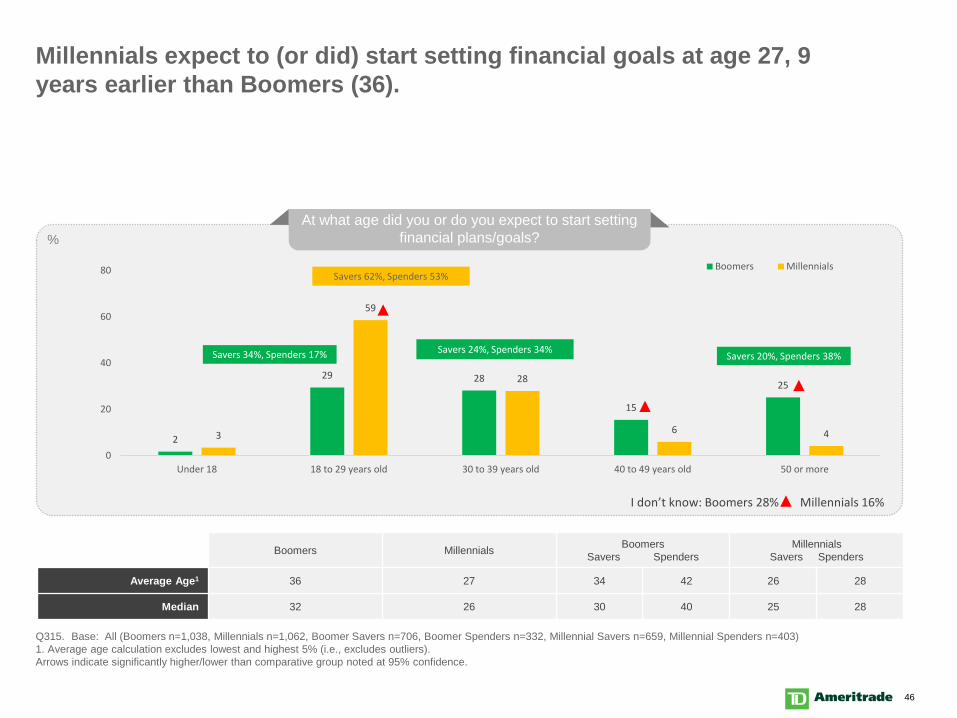
Millennials expect to (or did) start setting financial goals at age 27, 9 years earlier than Boomers (36).
Q315. Base: All (Boomers n=1,038, Millennials n=1,062, Boomer Savers n=706, Boomer Spenders n=332, Millennial Savers n=659, Millennial Spenders n=403) 1. Average age calculation excludes lowest and highest 5% (i.e., excludes outliers).Arrows indicate significantly higher/lower than comparative group noted at 95% confidence.
2
29 28
15
25
3
59
28
6 4
0
20
40
60
80
Under 18 18 to 29 years old 30 to 39 years old 40 to 49 years old 50 or more
Boomers Millennials
At what age did you or do you expect to start setting financial plans/goals? %
Savers 62%, Spenders 53%
Savers 20%, Spenders 38% Savers 34%, Spenders 17% Savers 24%, Spenders 34%
I don’t know: Boomers 28% Millennials 16%
Boomers Millennials BoomersSavers Spenders
MillennialsSavers Spenders
Average Age1 36 27 34 42 26 28
Median 32 26 30 40 25 28
47
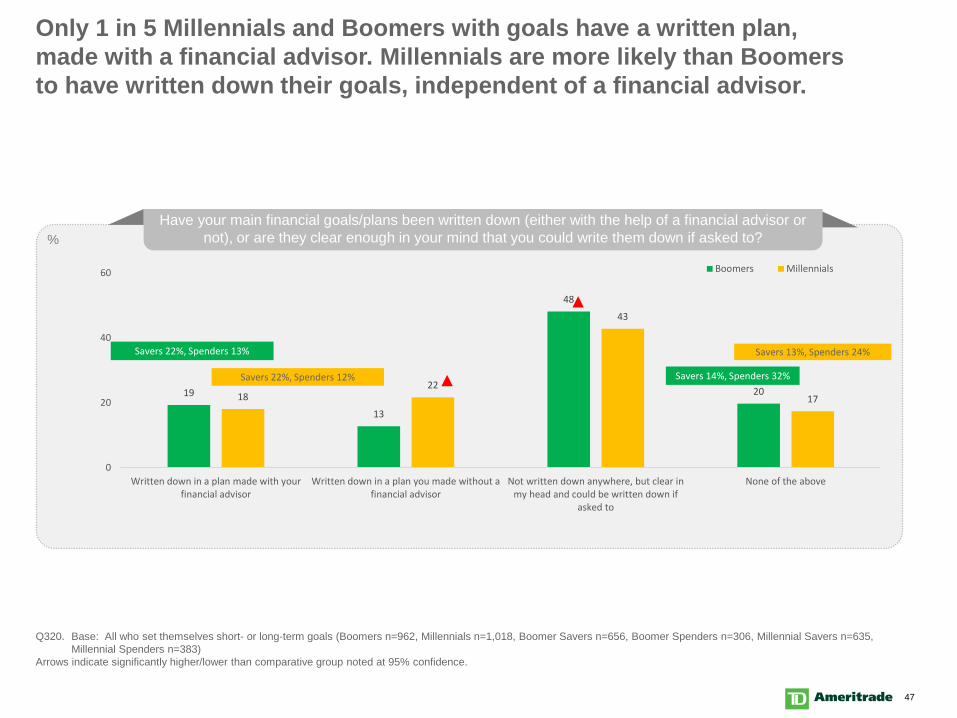
Only 1 in 5 Millennials and Boomers with goals have a written plan, made with a financial advisor. Millennials are more likely than Boomers to have written down their goals, independent of a financial advisor.
Q320. Base: All who set themselves short- or long-term goals (Boomers n=962, Millennials n=1,018, Boomer Savers n=656, Boomer Spenders n=306, Millennial Savers n=635, Millennial Spenders n=383)
Arrows indicate significantly higher/lower than comparative group noted at 95% confidence.
19
13
48
201822
43
17
0
20
40
60
Written down in a plan made with yourfinancial advisor
Written down in a plan you made without afinancial advisor
Not written down anywhere, but clear inmy head and could be written down if
asked to
None of the above
Boomers Millennials
Have your main financial goals/plans been written down (either with the help of a financial advisor or not), or are they clear enough in your mind that you could write them down if asked to?%
Savers 22%, Spenders 12% Savers 14%, Spenders 32%
Savers 22%, Spenders 13% Savers 13%, Spenders 24%

48
Boomers are more likely than Millennials to be ahead with their short-term goals (30% vs. 21%).
Q330. Base: All who set themselves short-term financial goals (Boomers n=908, Millennials n=995, Boomer Savers n=617, Boomer Spenders n=291, Millennial Savers n=622, Millennial Spenders n=373)
Arrows indicate significantly higher/lower than comparative group noted at 95% confidence.
1712
40
19
11912
39
30
11
0
20
40
60
I am very far ahead I am slightly far ahead I am on track I am slightly far behind I am very far behind
Boomers Millennials
To what extent are you on track to meet your short-term goals/plans?%
BehindBoomers: 30%Millennials: 40%
AheadBoomers: 30%Millennials: 21%
Savers 5%, Spenders 19%Savers 24%, Spenders 4%
Savers 6%, Spenders 21%
49
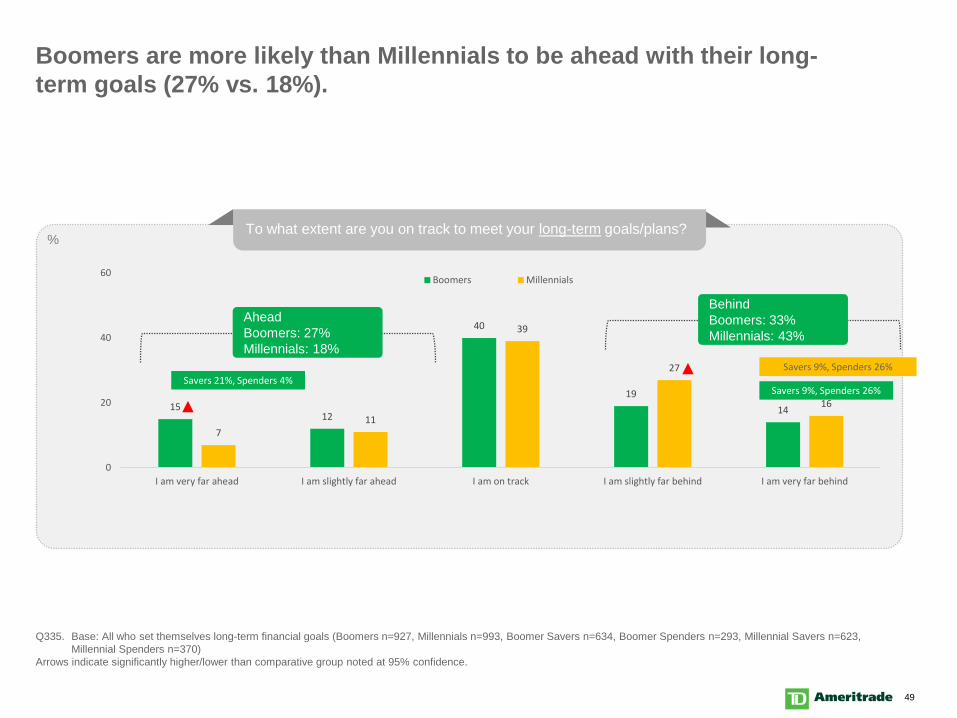
Boomers are more likely than Millennials to be ahead with their long-term goals (27% vs. 18%).
Q335. Base: All who set themselves long-term financial goals (Boomers n=927, Millennials n=993, Boomer Savers n=634, Boomer Spenders n=293, Millennial Savers n=623, Millennial Spenders n=370)
Arrows indicate significantly higher/lower than comparative group noted at 95% confidence.
1512
40
1914
711
39
27
16
0
20
40
60
I am very far ahead I am slightly far ahead I am on track I am slightly far behind I am very far behind
Boomers Millennials
To what extent are you on track to meet your long-term goals/plans?%
BehindBoomers: 33%Millennials: 43%
AheadBoomers: 27%Millennials: 18%
Savers 9%, Spenders 26%Savers 21%, Spenders 4%
Savers 9%, Spenders 26%
50
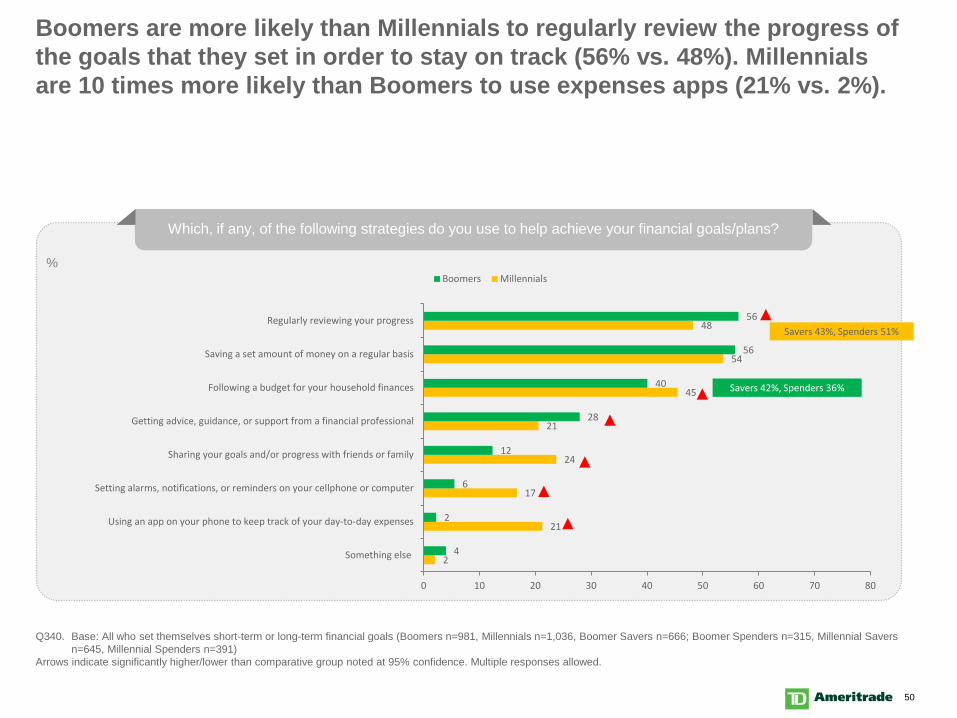
Boomers are more likely than Millennials to regularly review the progress of the goals that they set in order to stay on track (56% vs. 48%). Millennials are 10 times more likely than Boomers to use expenses apps (21% vs. 2%).
Q340. Base: All who set themselves short-term or long-term financial goals (Boomers n=981, Millennials n=1,036, Boomer Savers n=666; Boomer Spenders n=315, Millennial Savers n=645, Millennial Spenders n=391)
Arrows indicate significantly higher/lower than comparative group noted at 95% confidence. Multiple responses allowed.
Which, if any, of the following strategies do you use to help achieve your financial goals/plans?
2
21
17
24
21
45
54
48
4
2
6
12
28
40
56
56
0 10 20 30 40 50 60 70 80
Something else
Using an app on your phone to keep track of your day-to-day expenses
Setting alarms, notifications, or reminders on your cellphone or computer
Sharing your goals and/or progress with friends or family
Getting advice, guidance, or support from a financial professional
Following a budget for your household finances
Saving a set amount of money on a regular basis
Regularly reviewing your progress
Boomers Millennials%
Savers 42%, Spenders 36%
Savers 43%, Spenders 51%
51
3
5
2
2
3 3
2
9
4
7
3
10
6
16
13
12
15
35
50
8 10
Not at all important Extremely important
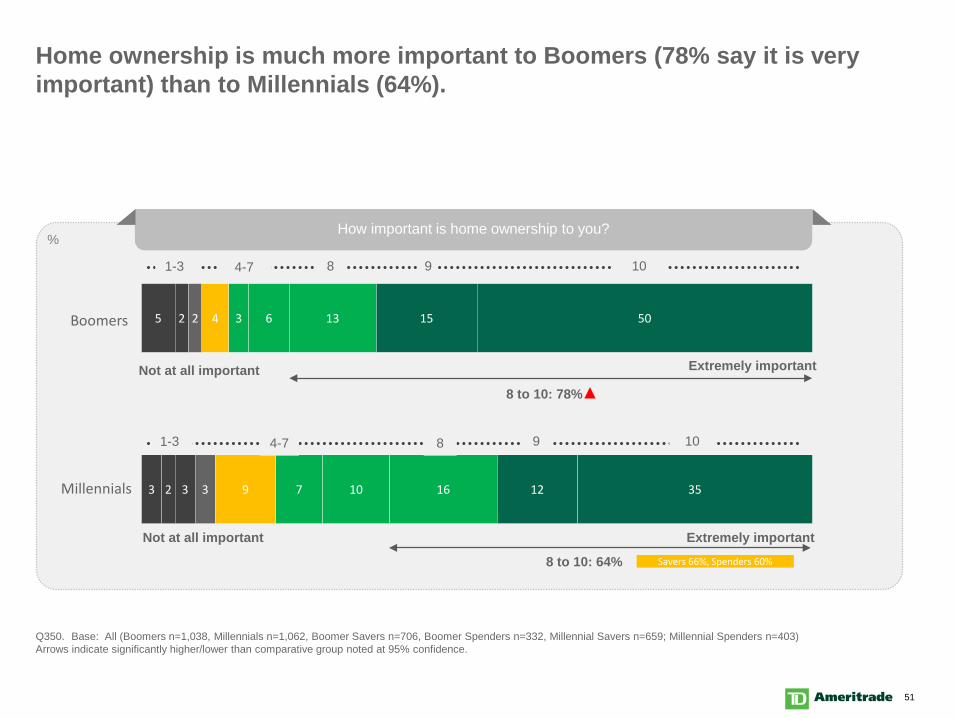
Home ownership is much more important to Boomers (78% say it is very important) than to Millennials (64%).
Q350. Base: All (Boomers n=1,038, Millennials n=1,062, Boomer Savers n=706, Boomer Spenders n=332, Millennial Savers n=659; Millennial Spenders n=403)Arrows indicate significantly higher/lower than comparative group noted at 95% confidence.
1-3
How important is home ownership to you?%
Millennials
Boomers
8 to 10: 78%
Not at all important Extremely important
9 101-3
8 to 10: 64%
94-7
4-7 8
Savers 66%, Spenders 60%
52
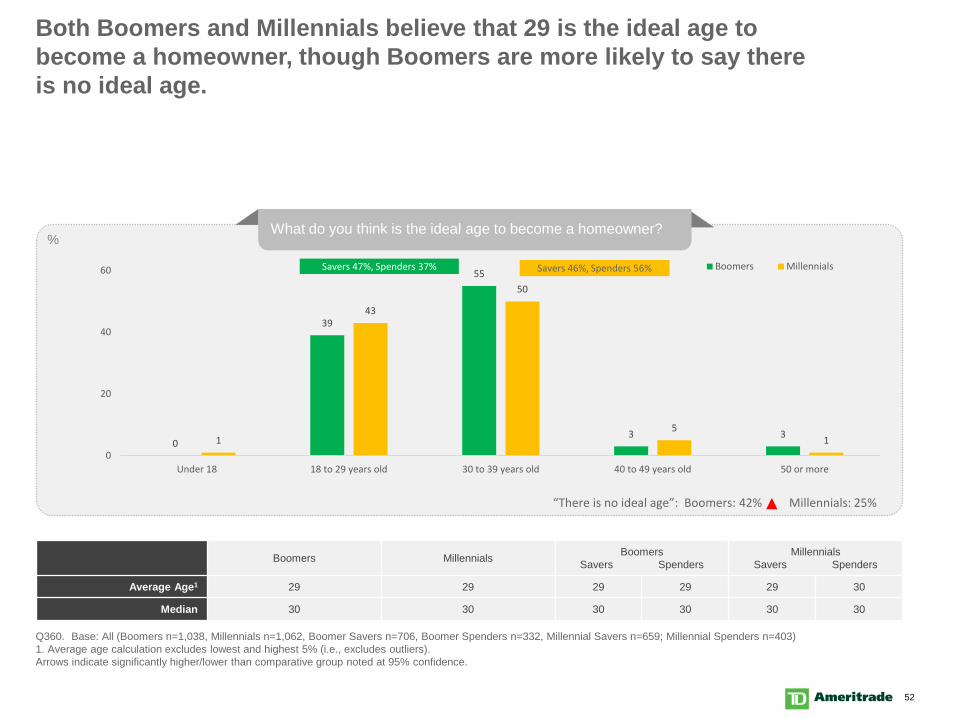
Both Boomers and Millennials believe that 29 is the ideal age to become a homeowner, though Boomers are more likely to say there is no ideal age.
Q360. Base: All (Boomers n=1,038, Millennials n=1,062, Boomer Savers n=706, Boomer Spenders n=332, Millennial Savers n=659; Millennial Spenders n=403)1. Average age calculation excludes lowest and highest 5% (i.e., excludes outliers).Arrows indicate significantly higher/lower than comparative group noted at 95% confidence.
0
39
55
3 31
43
50
51
0
20
40
60
Under 18 18 to 29 years old 30 to 39 years old 40 to 49 years old 50 or more
Boomers Millennials
Boomers Millennials BoomersSavers Spenders
MillennialsSavers Spenders
Average Age1 29 29 29 29 29 30
Median 30 30 30 30 30 30
What do you think is the ideal age to become a homeowner?%
Savers 47%, Spenders 37% Savers 46%, Spenders 56%
“There is no ideal age”: Boomers: 42% Millennials: 25%
53
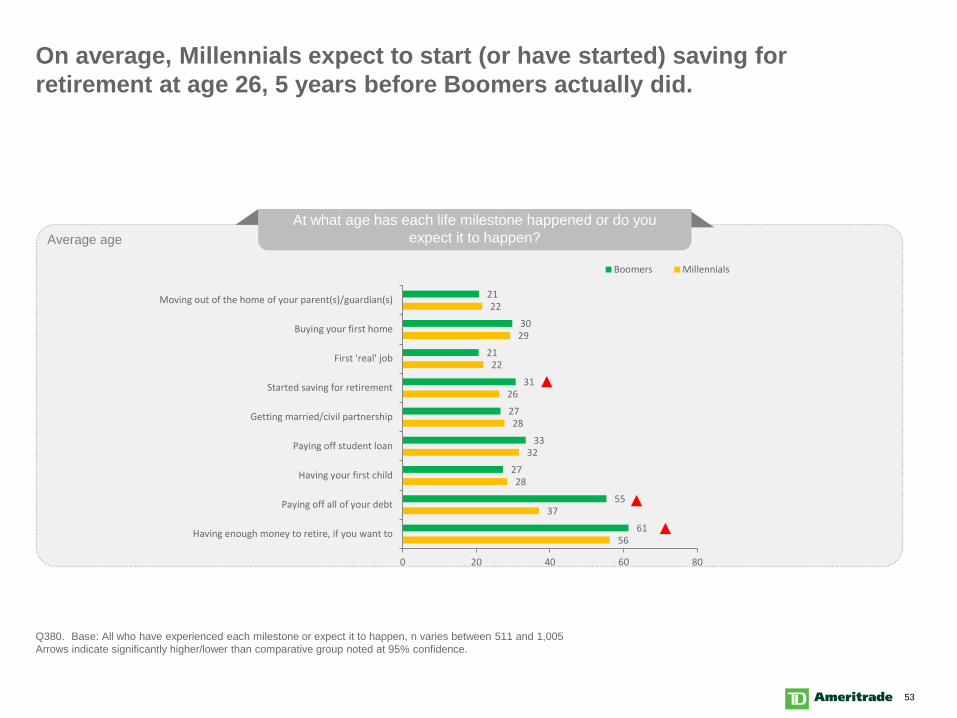
On average, Millennials expect to start (or have started) saving for retirement at age 26, 5 years before Boomers actually did.
Q380. Base: All who have experienced each milestone or expect it to happen, n varies between 511 and 1,005Arrows indicate significantly higher/lower than comparative group noted at 95% confidence.
At what age has each life milestone happened or do you expect it to happen?Average age
56
37
28
32
28
26
22
29
22
61
55
27
33
27
31
21
30
21
0 20 40 60 80
Having enough money to retire, if you want to
Paying off all of your debt
Having your first child
Paying off student loan
Getting married/civil partnership
Started saving for retirement
First 'real' job
Buying your first home
Moving out of the home of your parent(s)/guardian(s)
Boomers Millennials
54
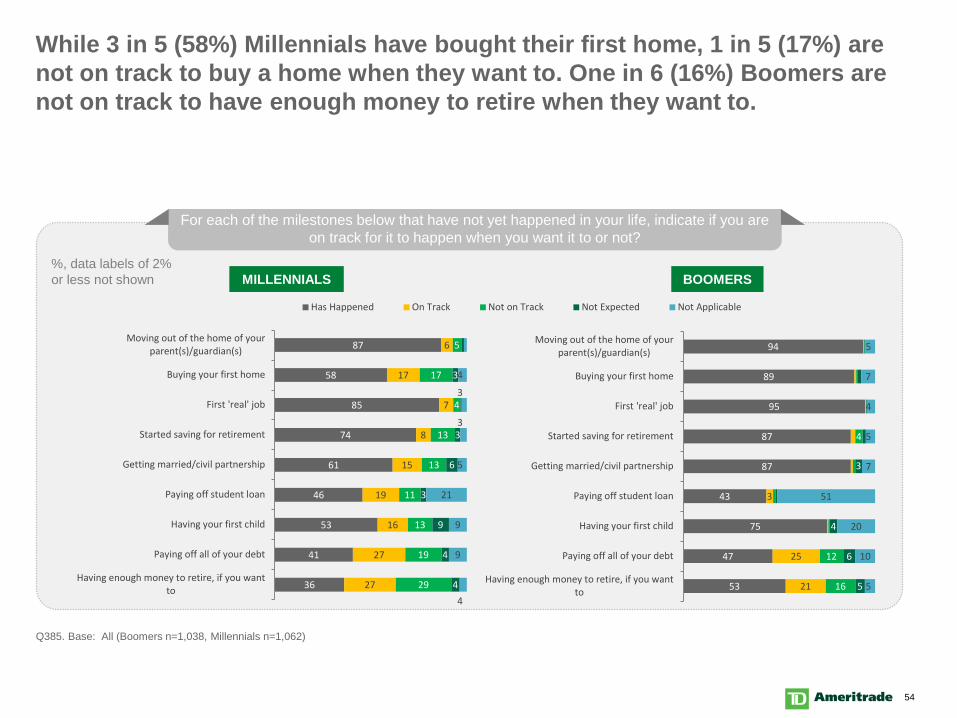
While 3 in 5 (58%) Millennials have bought their first home, 1 in 5 (17%) are not on track to buy a home when they want to. One in 6 (16%) Boomers are not on track to have enough money to retire when they want to.
Q385. Base: All (Boomers n=1,038, Millennials n=1,062)
For each of the milestones below that have not yet happened in your life, indicate if you are on track for it to happen when you want it to or not?
36
41
53
46
61
74
85
58
87
27
27
16
19
15
8
7
17
6
29
19
13
11
13
13
4
17
5
4
4
9
3
6
3
3
4
9
9
21
5
3
3
4
Having enough money to retire, if you wantto
Paying off all of your debt
Having your first child
Paying off student loan
Getting married/civil partnership
Started saving for retirement
First 'real' job
Buying your first home
Moving out of the home of yourparent(s)/guardian(s)
%, data labels of 2%or less not shown
53
47
75
43
87
87
95
89
94
21
25
3
16
12
4
5
6
4
3
5
10
20
51
7
5
4
7
5
Having enough money to retire, if you wantto
Paying off all of your debt
Having your first child
Paying off student loan
Getting married/civil partnership
Started saving for retirement
First 'real' job
Buying your first home
Moving out of the home of yourparent(s)/guardian(s)
Has Happened On Track Not on Track Not Expected Not Applicable
MILLENNIALS BOOMERS

55
Retirement Plans
56
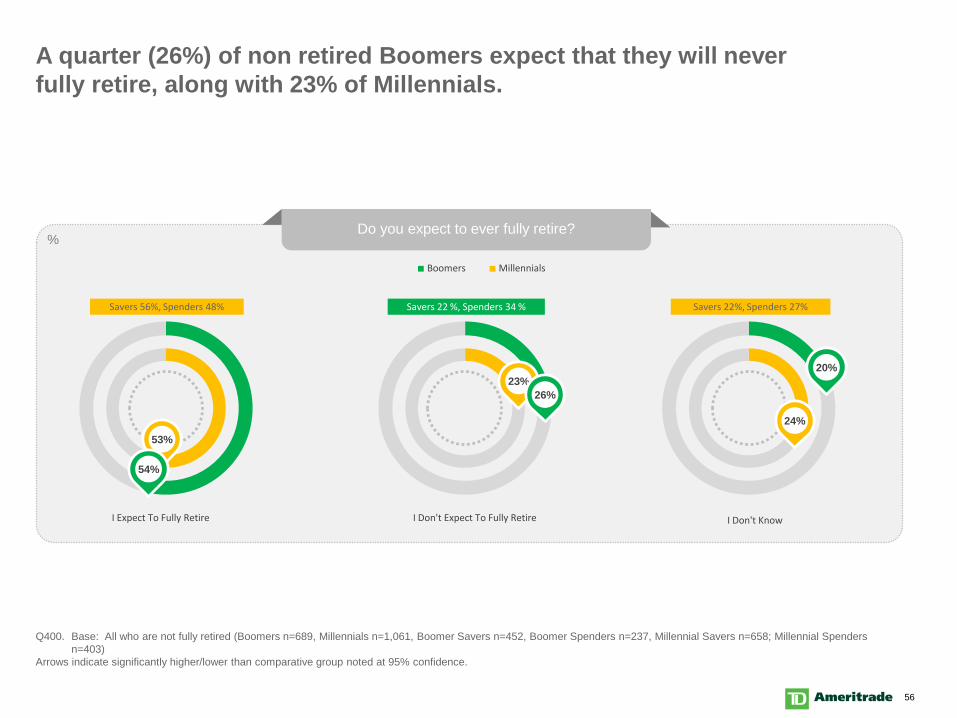
A quarter (26%) of non retired Boomers expect that they will never fully retire, along with 23% of Millennials.
Q400. Base: All who are not fully retired (Boomers n=689, Millennials n=1,061, Boomer Savers n=452, Boomer Spenders n=237, Millennial Savers n=658; Millennial Spenders n=403)
Arrows indicate significantly higher/lower than comparative group noted at 95% confidence.
Do you expect to ever fully retire? %
53%
23%26%
24%
20%
I Expect To Fully Retire I Don't Expect To Fully Retire I Don't Know
Boomers Millennials
54%
Savers 56%, Spenders 48% Savers 22 %, Spenders 34 % Savers 22%, Spenders 27%
57
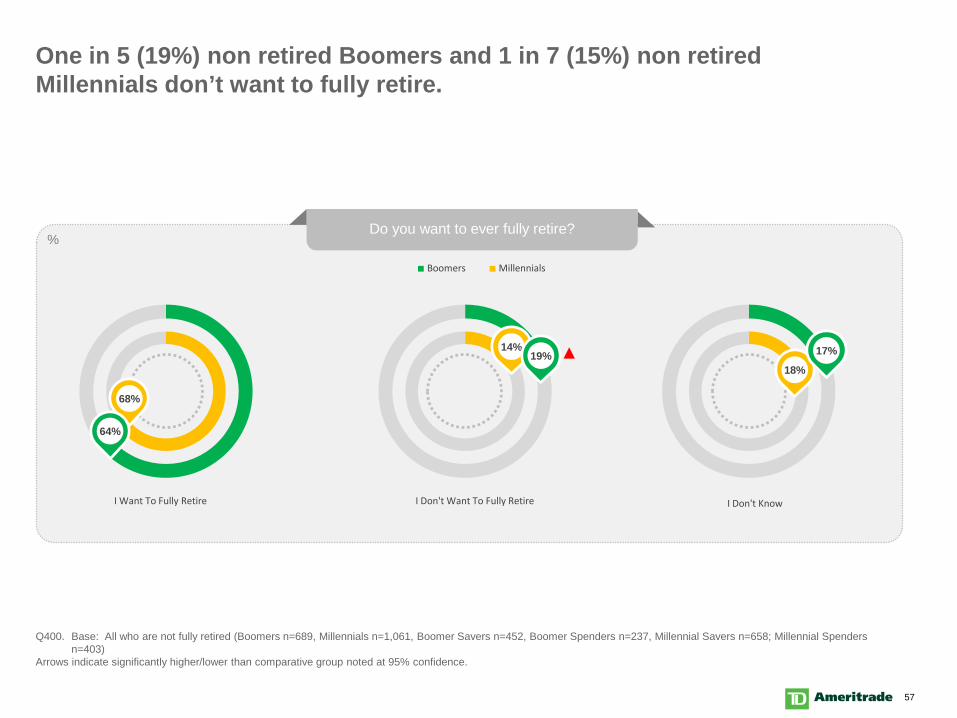
One in 5 (19%) non retired Boomers and 1 in 7 (15%) non retired Millennials don’t want to fully retire.
Q400. Base: All who are not fully retired (Boomers n=689, Millennials n=1,061, Boomer Savers n=452, Boomer Spenders n=237, Millennial Savers n=658; Millennial Spenders n=403)
Arrows indicate significantly higher/lower than comparative group noted at 95% confidence.
Do you want to ever fully retire? %
68%
14%19%
18%
17%
I Want To Fully Retire I Don't Want To Fully Retire I Don't Know
Boomers Millennials
64%
58
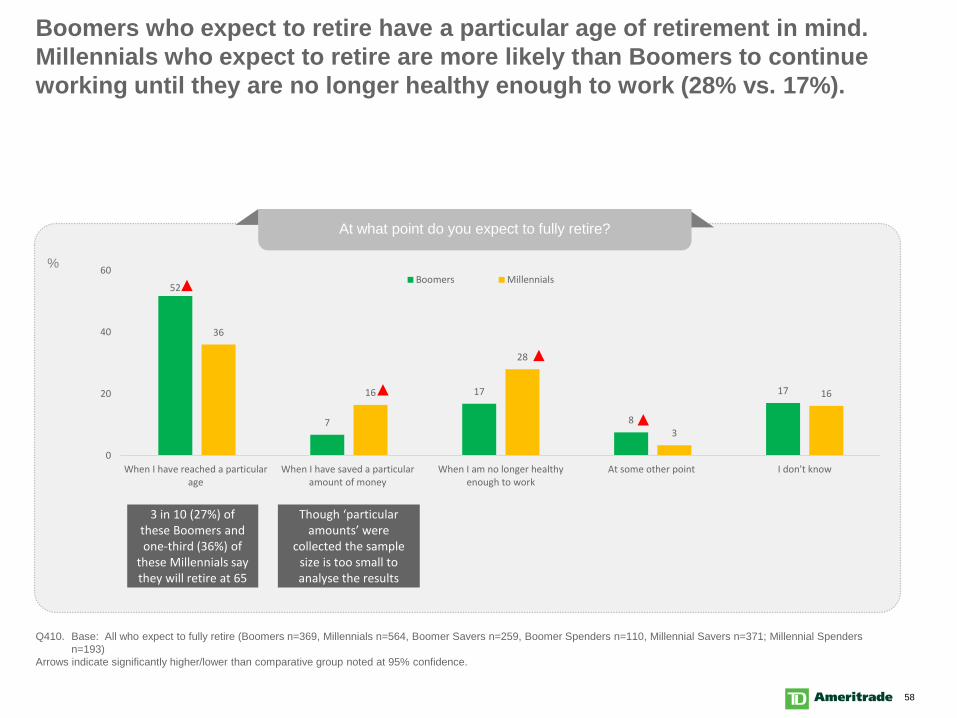
Boomers who expect to retire have a particular age of retirement in mind. Millennials who expect to retire are more likely than Boomers to continue working until they are no longer healthy enough to work (28% vs. 17%).
Q410. Base: All who expect to fully retire (Boomers n=369, Millennials n=564, Boomer Savers n=259, Boomer Spenders n=110, Millennial Savers n=371; Millennial Spenders n=193)
Arrows indicate significantly higher/lower than comparative group noted at 95% confidence.
52
7
17
8
17
36
16
28
3
16
0
20
40
60
When I have reached a particularage
When I have saved a particularamount of money
When I am no longer healthyenough to work
At some other point I don't know
Boomers Millennials
At what point do you expect to fully retire?
%
3 in 10 (27%) of these Boomers and one-third (36%) of
these Millennials say they will retire at 65
Though ‘particular amounts’ were
collected the sample size is too small to analyse the results
59
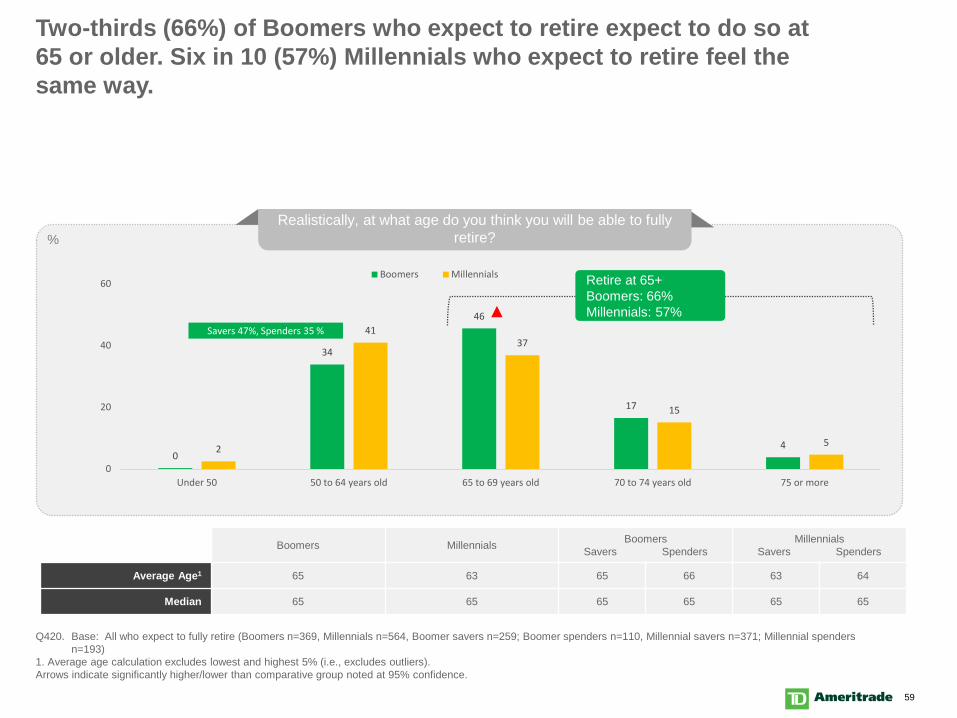
Two-thirds (66%) of Boomers who expect to retire expect to do so at 65 or older. Six in 10 (57%) Millennials who expect to retire feel the same way.
Q420. Base: All who expect to fully retire (Boomers n=369, Millennials n=564, Boomer savers n=259; Boomer spenders n=110, Millennial savers n=371; Millennial spenders n=193)
1. Average age calculation excludes lowest and highest 5% (i.e., excludes outliers).Arrows indicate significantly higher/lower than comparative group noted at 95% confidence.
0
34
46
17
42
4137
15
5
0
20
40
60
Under 50 50 to 64 years old 65 to 69 years old 70 to 74 years old 75 or more
Boomers Millennials
Boomers Millennials BoomersSavers Spenders
MillennialsSavers Spenders
Average Age1 65 63 65 66 63 64
Median 65 65 65 65 65 65
Realistically, at what age do you think you will be able to fully retire?%
Savers 47%, Spenders 35 %
Retire at 65+Boomers: 66%Millennials: 57%
60
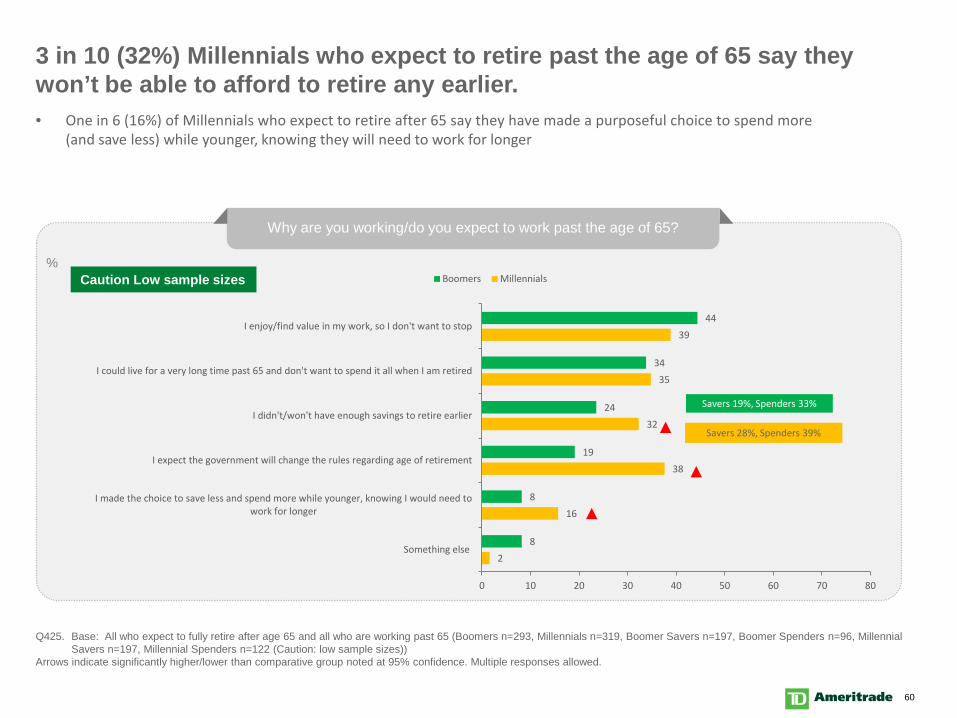
3 in 10 (32%) Millennials who expect to retire past the age of 65 say they won’t be able to afford to retire any earlier.
Q425. Base: All who expect to fully retire after age 65 and all who are working past 65 (Boomers n=293, Millennials n=319, Boomer Savers n=197, Boomer Spenders n=96, Millennial Savers n=197, Millennial Spenders n=122 (Caution: low sample sizes))
Arrows indicate significantly higher/lower than comparative group noted at 95% confidence. Multiple responses allowed.
Why are you working/do you expect to work past the age of 65?
2
16
38
32
35
39
8
8
19
24
34
44
0 10 20 30 40 50 60 70 80
Something else
I made the choice to save less and spend more while younger, knowing I would need towork for longer
I expect the government will change the rules regarding age of retirement
I didn't/won't have enough savings to retire earlier
I could live for a very long time past 65 and don't want to spend it all when I am retired
I enjoy/find value in my work, so I don't want to stop
Boomers Millennials%
Savers 19%, Spenders 33%
Savers 28%, Spenders 39%
• One in 6 (16%) of Millennials who expect to retire after 65 say they have made a purposeful choice to spend more (and save less) while younger, knowing they will need to work for longer
Caution Low sample sizes
61
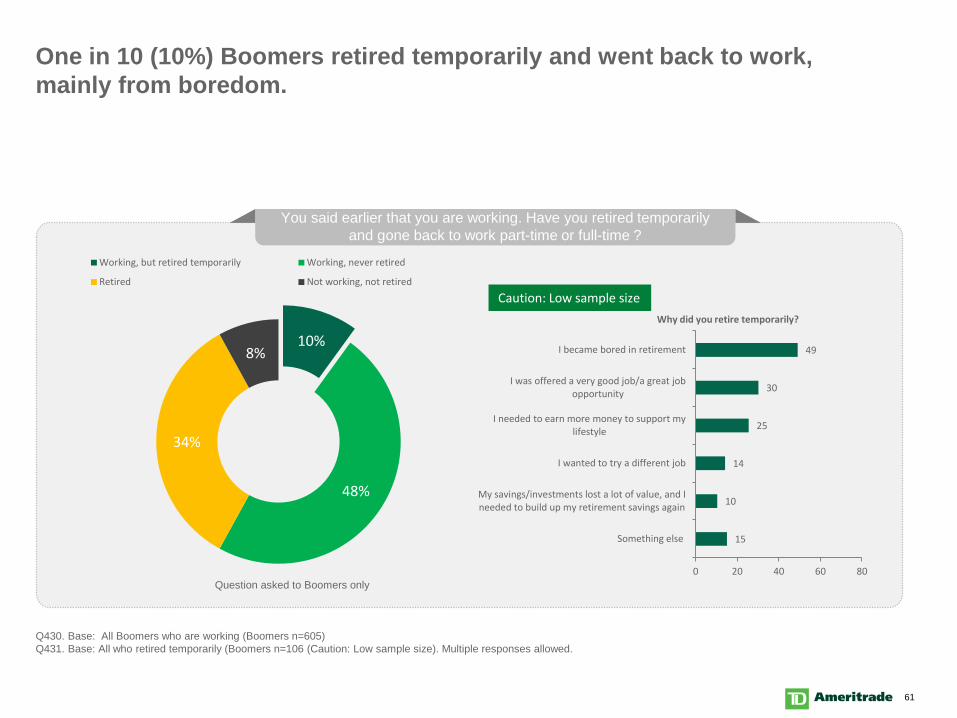
You said earlier that you are working. Have you retired temporarily and gone back to work part-time or full-time ?
One in 10 (10%) Boomers retired temporarily and went back to work, mainly from boredom.
Q430. Base: All Boomers who are working (Boomers n=605)Q431. Base: All who retired temporarily (Boomers n=106 (Caution: Low sample size). Multiple responses allowed.
10%
48%
34%
8%
Working, but retired temporarily Working, never retired
Retired Not working, not retired
Question asked to Boomers only
Caution: Low sample size
15
10
14
25
30
49
0 20 40 60 80
Something else
My savings/investments lost a lot of value, and Ineeded to build up my retirement savings again
I wanted to try a different job
I needed to earn more money to support mylifestyle
I was offered a very good job/a great jobopportunity
I became bored in retirement
Why did you retire temporarily?
62
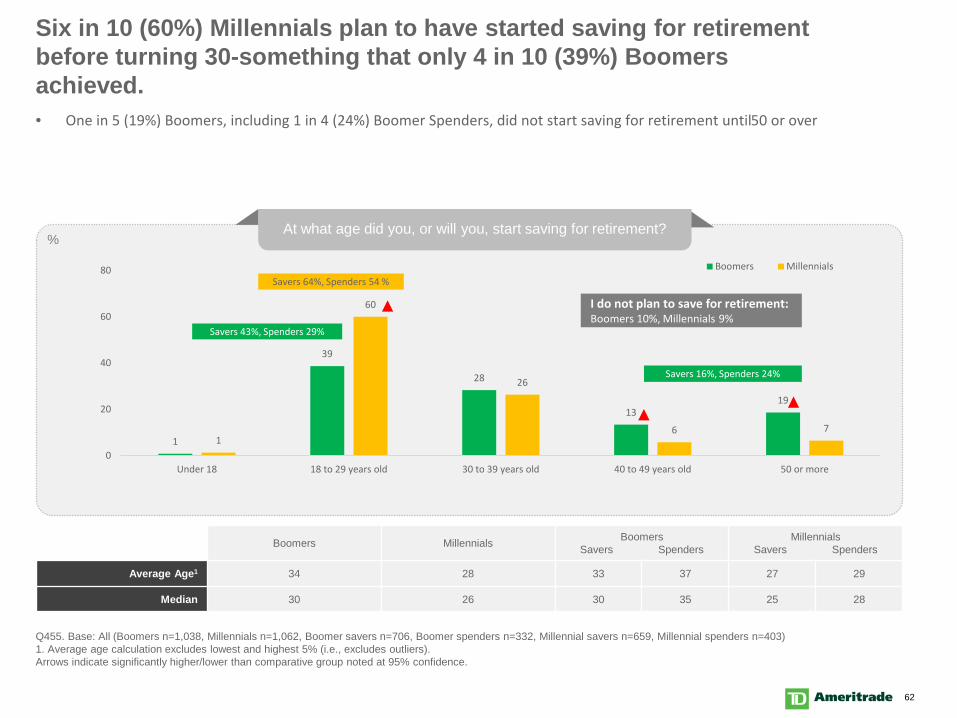
Six in 10 (60%) Millennials plan to have started saving for retirement before turning 30-something that only 4 in 10 (39%) Boomers achieved.
Q455. Base: All (Boomers n=1,038, Millennials n=1,062, Boomer savers n=706, Boomer spenders n=332, Millennial savers n=659, Millennial spenders n=403)1. Average age calculation excludes lowest and highest 5% (i.e., excludes outliers).Arrows indicate significantly higher/lower than comparative group noted at 95% confidence.
1
39
28
1319
1
60
26
6 7
0
20
40
60
80
Under 18 18 to 29 years old 30 to 39 years old 40 to 49 years old 50 or more
Boomers Millennials
Boomers Millennials BoomersSavers Spenders
MillennialsSavers Spenders
Average Age1 34 28 33 37 27 29
Median 30 26 30 35 25 28
At what age did you, or will you, start saving for retirement?%
Savers 64%, Spenders 54 %
I do not plan to save for retirement:Boomers 10%, Millennials 9%
Savers 43%, Spenders 29%
Savers 16%, Spenders 24%
• One in 5 (19%) Boomers, including 1 in 4 (24%) Boomer Spenders, did not start saving for retirement until 50 or over
63
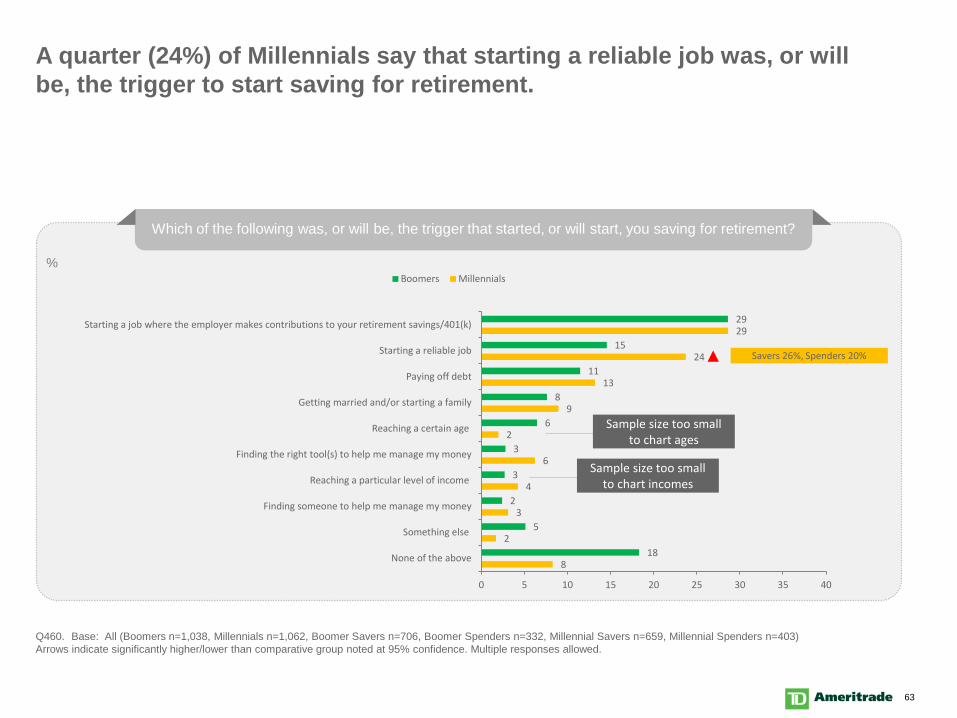
A quarter (24%) of Millennials say that starting a reliable job was, or will be, the trigger to start saving for retirement.
Q460. Base: All (Boomers n=1,038, Millennials n=1,062, Boomer Savers n=706, Boomer Spenders n=332, Millennial Savers n=659, Millennial Spenders n=403)Arrows indicate significantly higher/lower than comparative group noted at 95% confidence. Multiple responses allowed.
Which of the following was, or will be, the trigger that started, or will start, you saving for retirement?
8
2
3
4
6
2
9
13
24
29
18
5
2
3
3
6
8
11
15
29
0 5 10 15 20 25 30 35 40
None of the above
Something else
Finding someone to help me manage my money
Reaching a particular level of income
Finding the right tool(s) to help me manage my money
Reaching a certain age
Getting married and/or starting a family
Paying off debt
Starting a reliable job
Starting a job where the employer makes contributions to your retirement savings/401(k)
Boomers Millennials%
Savers 26%, Spenders 20%
Sample size too small to chart incomes
Sample size too small to chart ages
64
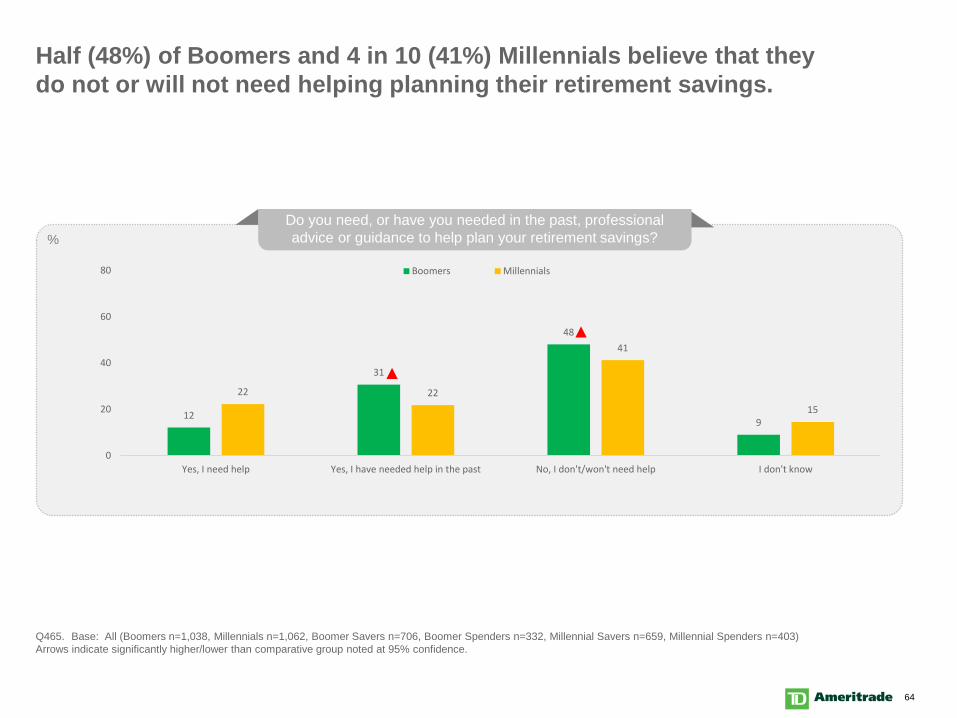
Half (48%) of Boomers and 4 in 10 (41%) Millennials believe that they do not or will not need helping planning their retirement savings.
Q465. Base: All (Boomers n=1,038, Millennials n=1,062, Boomer Savers n=706, Boomer Spenders n=332, Millennial Savers n=659, Millennial Spenders n=403)Arrows indicate significantly higher/lower than comparative group noted at 95% confidence.
12
31
48
9
22 22
41
15
0
20
40
60
80
Yes, I need help Yes, I have needed help in the past No, I don't/won't need help I don't know
Boomers Millennials
Do you need, or have you needed in the past, professional advice or guidance to help plan your retirement savings?%
65
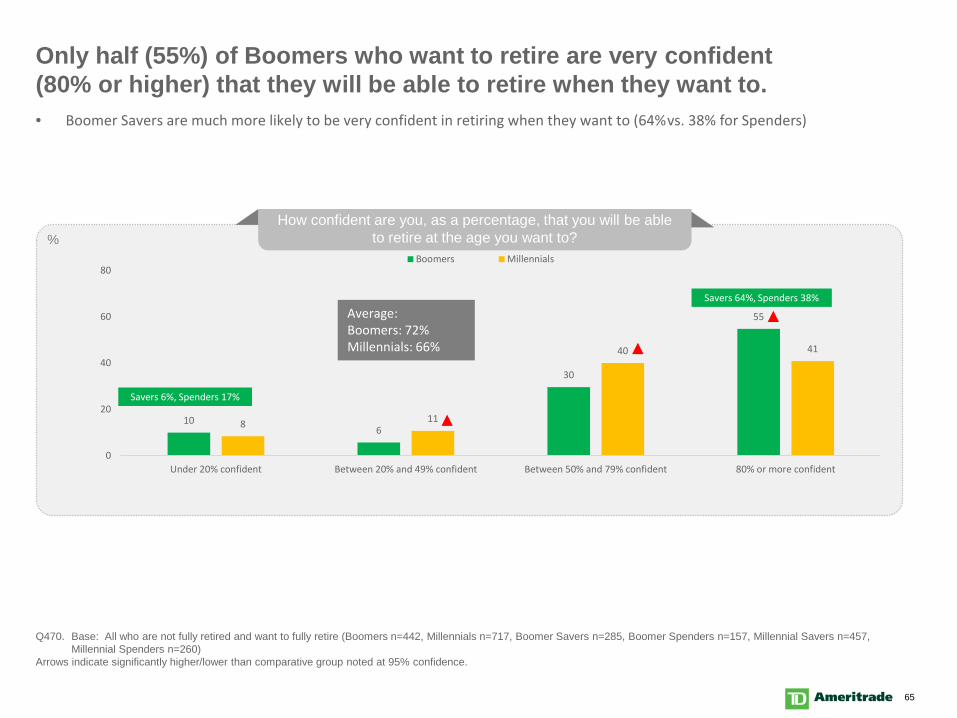
Only half (55%) of Boomers who want to retire are very confident (80% or higher) that they will be able to retire when they want to.
Q470. Base: All who are not fully retired and want to fully retire (Boomers n=442, Millennials n=717, Boomer Savers n=285, Boomer Spenders n=157, Millennial Savers n=457, Millennial Spenders n=260)
Arrows indicate significantly higher/lower than comparative group noted at 95% confidence.
106
30
55
8 11
40 41
0
20
40
60
80
Under 20% confident Between 20% and 49% confident Between 50% and 79% confident 80% or more confident
Boomers Millennials
How confident are you, as a percentage, that you will be able to retire at the age you want to?%
Savers 6%, Spenders 17%
Savers 64%, Spenders 38%
• Boomer Savers are much more likely to be very confident in retiring when they want to (64% vs. 38% for Spenders)
Average:Boomers: 72%Millennials: 66%
66
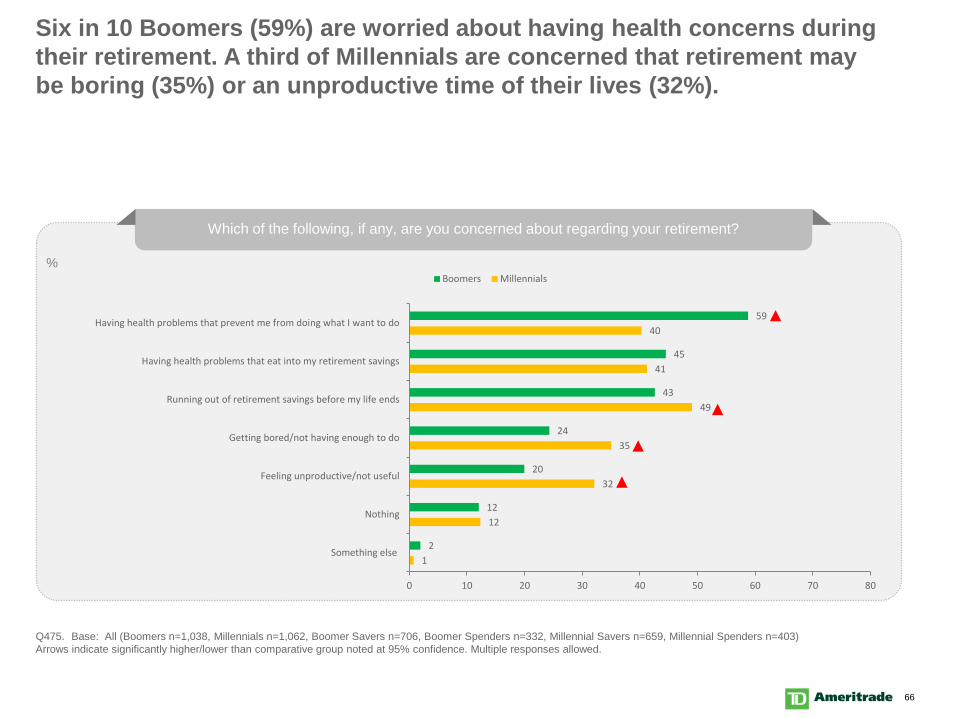
Six in 10 Boomers (59%) are worried about having health concerns during their retirement. A third of Millennials are concerned that retirement may be boring (35%) or an unproductive time of their lives (32%).
Q475. Base: All (Boomers n=1,038, Millennials n=1,062, Boomer Savers n=706, Boomer Spenders n=332, Millennial Savers n=659, Millennial Spenders n=403)Arrows indicate significantly higher/lower than comparative group noted at 95% confidence. Multiple responses allowed.
Which of the following, if any, are you concerned about regarding your retirement?
1
12
32
35
49
41
40
2
12
20
24
43
45
59
0 10 20 30 40 50 60 70 80
Something else
Nothing
Feeling unproductive/not useful
Getting bored/not having enough to do
Running out of retirement savings before my life ends
Having health problems that eat into my retirement savings
Having health problems that prevent me from doing what I want to do
Boomers Millennials%
67
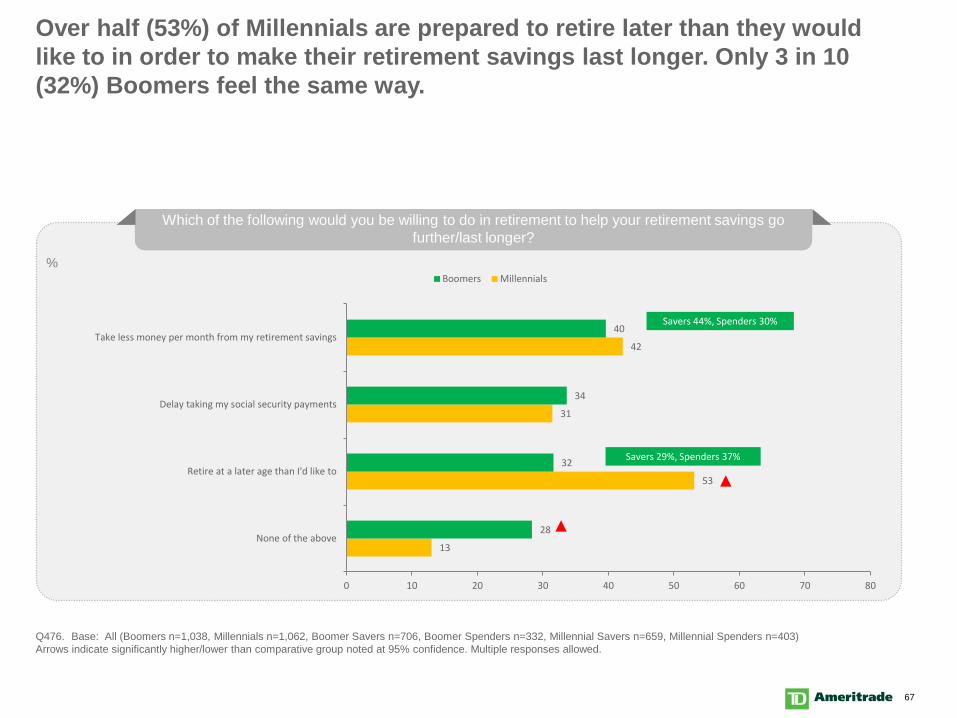
Over half (53%) of Millennials are prepared to retire later than they would like to in order to make their retirement savings last longer. Only 3 in 10 (32%) Boomers feel the same way.
Q476. Base: All (Boomers n=1,038, Millennials n=1,062, Boomer Savers n=706, Boomer Spenders n=332, Millennial Savers n=659, Millennial Spenders n=403)Arrows indicate significantly higher/lower than comparative group noted at 95% confidence. Multiple responses allowed.
Which of the following would you be willing to do in retirement to help your retirement savings go further/last longer?
13
53
31
42
28
32
34
40
0 10 20 30 40 50 60 70 80
None of the above
Retire at a later age than I'd like to
Delay taking my social security payments
Take less money per month from my retirement savings
Boomers Millennials%
Savers 29%, Spenders 37%
Savers 44%, Spenders 30%
68
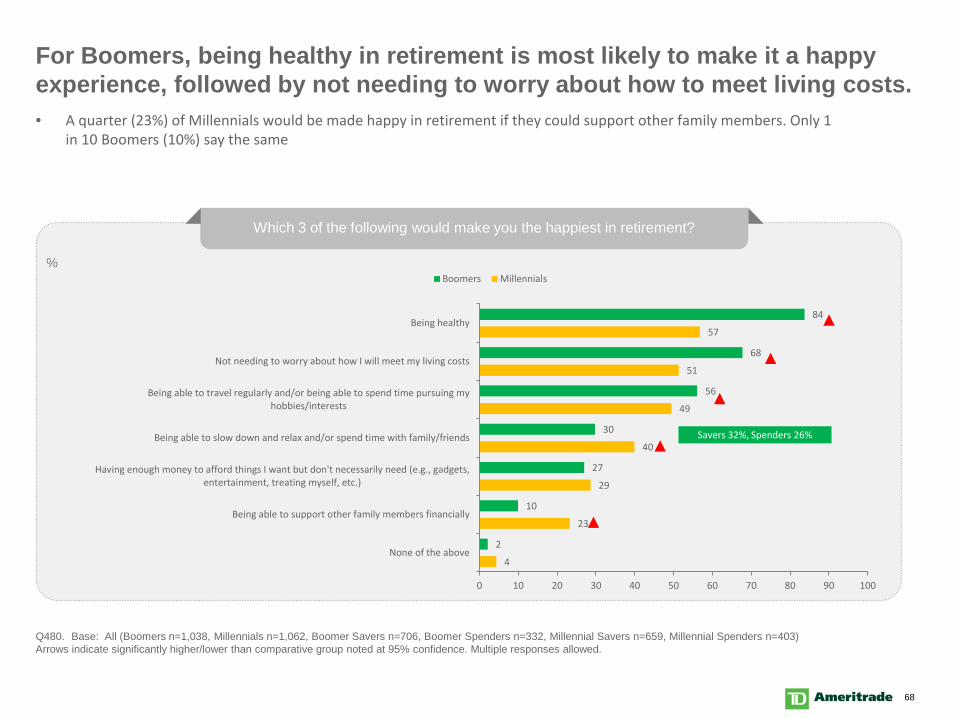
For Boomers, being healthy in retirement is most likely to make it a happy experience, followed by not needing to worry about how to meet living costs.
Q480. Base: All (Boomers n=1,038, Millennials n=1,062, Boomer Savers n=706, Boomer Spenders n=332, Millennial Savers n=659, Millennial Spenders n=403)Arrows indicate significantly higher/lower than comparative group noted at 95% confidence. Multiple responses allowed.
Which 3 of the following would make you the happiest in retirement?
4
23
29
40
49
51
57
2
10
27
30
56
68
84
0 10 20 30 40 50 60 70 80 90 100
None of the above
Being able to support other family members financially
Having enough money to afford things I want but don't necessarily need (e.g., gadgets,entertainment, treating myself, etc.)
Being able to slow down and relax and/or spend time with family/friends
Being able to travel regularly and/or being able to spend time pursuing myhobbies/interests
Not needing to worry about how I will meet my living costs
Being healthy
Boomers Millennials%
Savers 32%, Spenders 26%
• A quarter (23%) of Millennials would be made happy in retirement if they could support other family members. Only 1 in 10 Boomers (10%) say the same

69
Financial Security
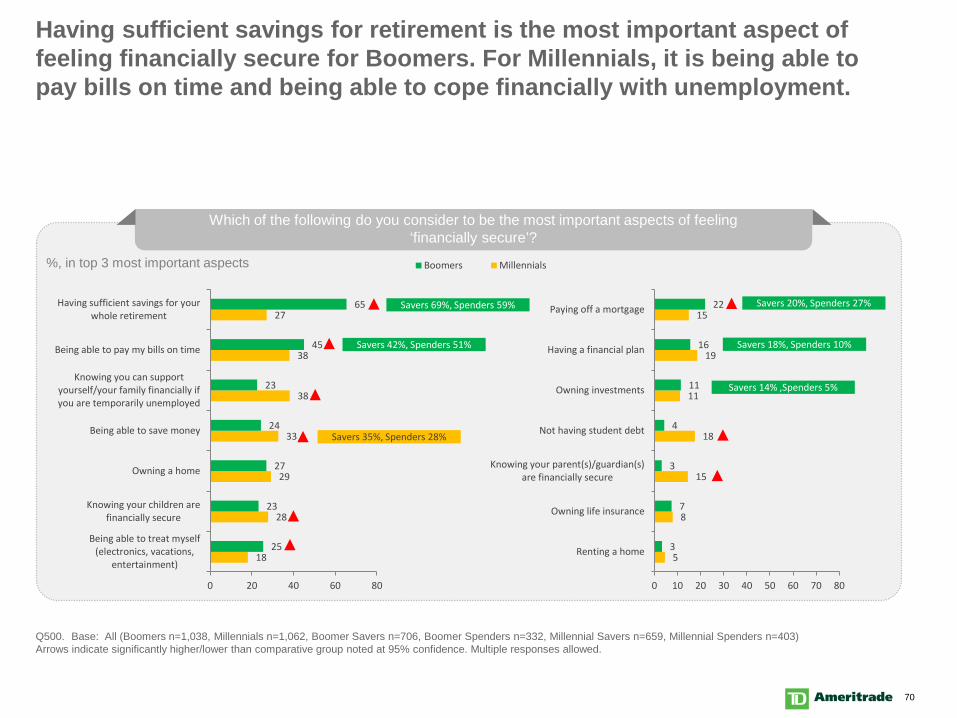
70
Having sufficient savings for retirement is the most important aspect of feeling financially secure for Boomers. For Millennials, it is being able to pay bills on time and being able to cope financially with unemployment.
Which of the following do you consider to be the most important aspects of feeling‘financially secure’?
18
28
29
33
38
38
27
25
23
27
24
23
45
65
0 20 40 60 80
Being able to treat myself(electronics, vacations,
entertainment)
Knowing your children arefinancially secure
Owning a home
Being able to save money
Knowing you can supportyourself/your family financially ifyou are temporarily unemployed
Being able to pay my bills on time
Having sufficient savings for yourwhole retirement
%, in top 3 most important aspects Boomers Millennials
Savers 69%, Spenders 59%
5
8
15
18
11
19
15
3
7
3
4
11
16
22
0 10 20 30 40 50 60 70 80
Renting a home
Owning life insurance
Knowing your parent(s)/guardian(s)are financially secure
Not having student debt
Owning investments
Having a financial plan
Paying off a mortgage
Savers 42%, Spenders 51%
Savers 14% ,Spenders 5%
Savers 35%, Spenders 28%
Savers 18%, Spenders 10%
Savers 20%, Spenders 27%
Q500. Base: All (Boomers n=1,038, Millennials n=1,062, Boomer Savers n=706, Boomer Spenders n=332, Millennial Savers n=659, Millennial Spenders n=403)Arrows indicate significantly higher/lower than comparative group noted at 95% confidence. Multiple responses allowed.
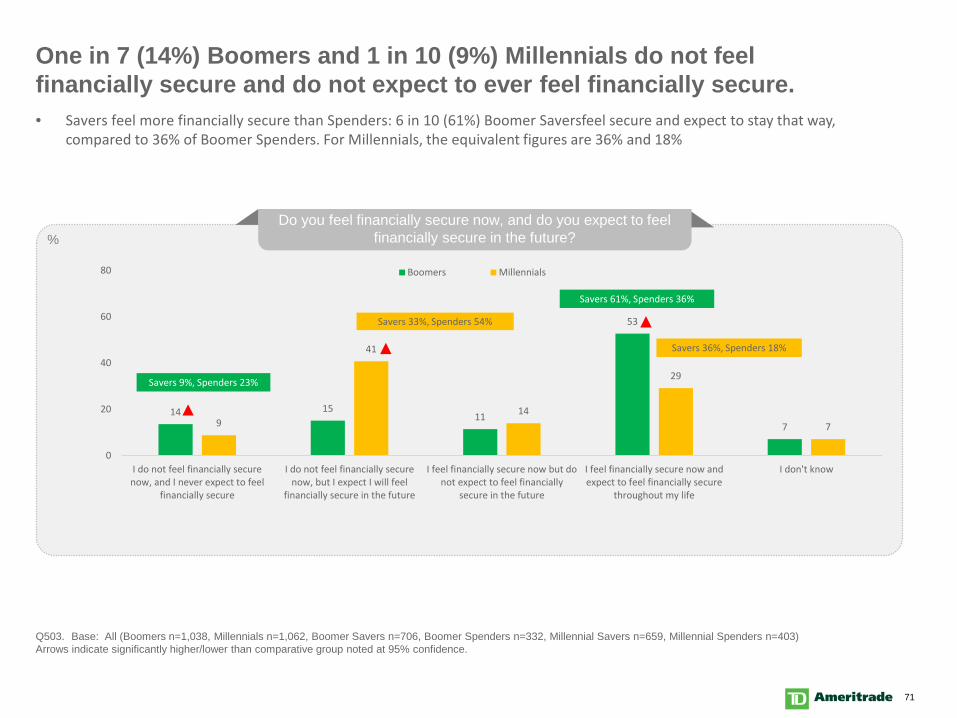
71
One in 7 (14%) Boomers and 1 in 10 (9%) Millennials do not feel financially secure and do not expect to ever feel financially secure.
Q503. Base: All (Boomers n=1,038, Millennials n=1,062, Boomer Savers n=706, Boomer Spenders n=332, Millennial Savers n=659, Millennial Spenders n=403)Arrows indicate significantly higher/lower than comparative group noted at 95% confidence.
14 1511
53
79
41
14
29
7
0
20
40
60
80
I do not feel financially securenow, and I never expect to feel
financially secure
I do not feel financially securenow, but I expect I will feel
financially secure in the future
I feel financially secure now but donot expect to feel financially
secure in the future
I feel financially secure now andexpect to feel financially secure
throughout my life
I don't know
Boomers Millennials
Do you feel financially secure now, and do you expect to feel financially secure in the future?%
Savers 9%, Spenders 23%
Savers 33%, Spenders 54%
Savers 61%, Spenders 36%
Savers 36%, Spenders 18%
• Savers feel more financially secure than Spenders: 6 in 10 (61%) Boomer Savers feel secure and expect to stay that way, compared to 36% of Boomer Spenders. For Millennials, the equivalent figures are 36% and 18%
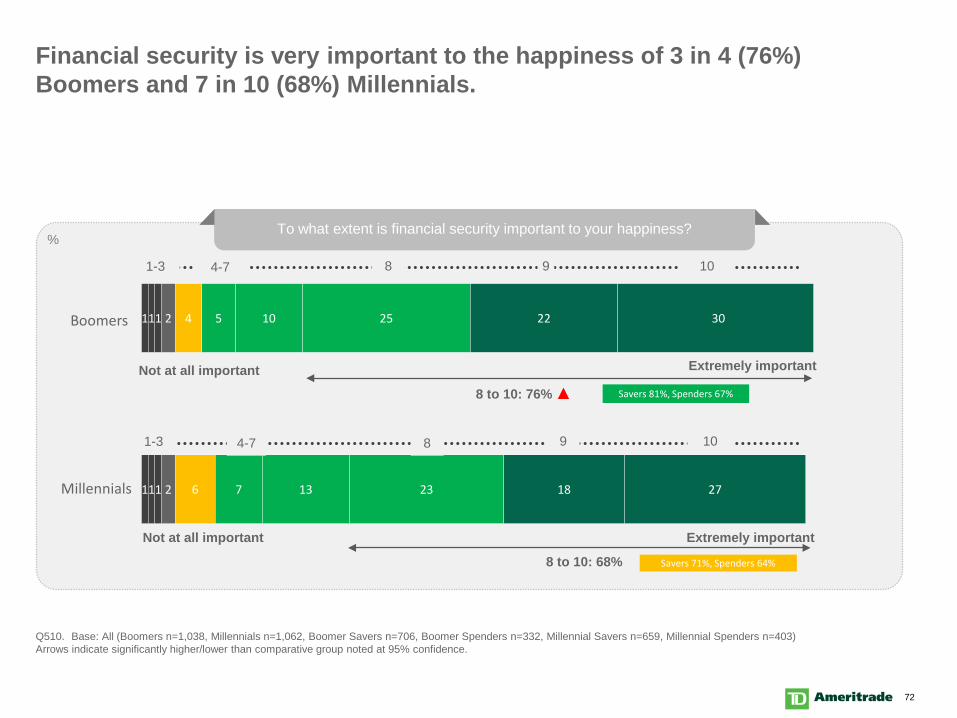
72
1
1
1
1
1
1
2
2
6
4
7
5
13
10
23
25
18
22
27
30
8 10
Not at all important Extremely important
Financial security is very important to the happiness of 3 in 4 (76%) Boomers and 7 in 10 (68%) Millennials.
Q510. Base: All (Boomers n=1,038, Millennials n=1,062, Boomer Savers n=706, Boomer Spenders n=332, Millennial Savers n=659, Millennial Spenders n=403) Arrows indicate significantly higher/lower than comparative group noted at 95% confidence.
1-3
To what extent is financial security important to your happiness?%
Millennials
Boomers
8 to 10: 76%
Not at all important Extremely important
9 101-3
8 to 10: 68%
94-7
4-7 8
Savers 81%, Spenders 67%
Savers 71%, Spenders 64%

73
Financial Advice
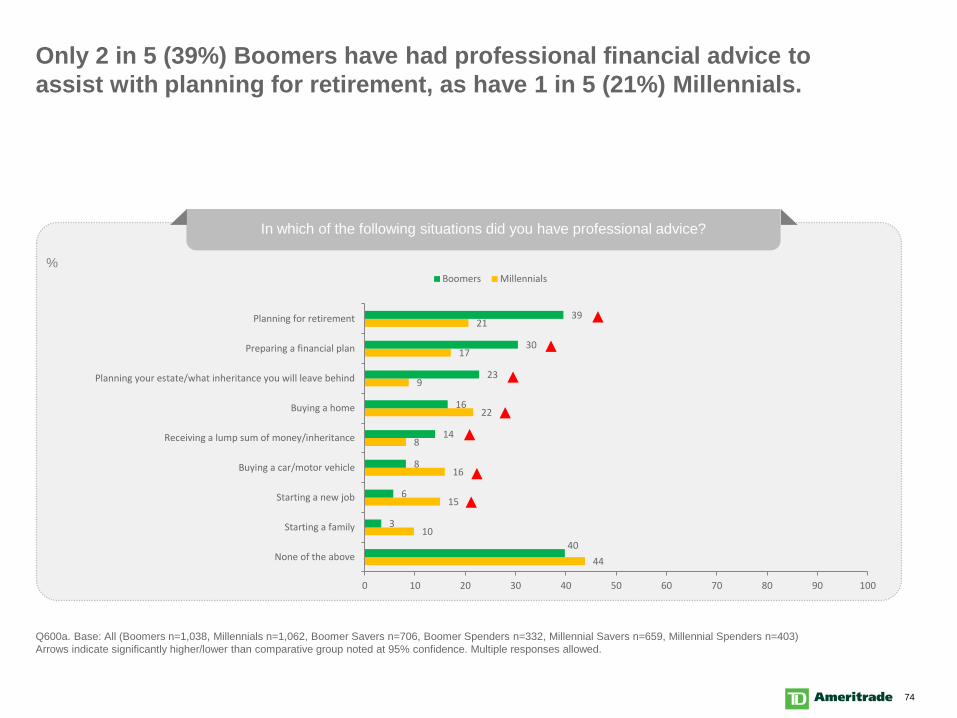
74
Only 2 in 5 (39%) Boomers have had professional financial advice to assist with planning for retirement, as have 1 in 5 (21%) Millennials.
Q600a. Base: All (Boomers n=1,038, Millennials n=1,062, Boomer Savers n=706, Boomer Spenders n=332, Millennial Savers n=659, Millennial Spenders n=403)Arrows indicate significantly higher/lower than comparative group noted at 95% confidence. Multiple responses allowed.
In which of the following situations did you have professional advice?
44
10
15
16
8
22
9
17
21
40
3
6
8
14
16
23
30
39
0 10 20 30 40 50 60 70 80 90 100
None of the above
Starting a family
Starting a new job
Buying a car/motor vehicle
Receiving a lump sum of money/inheritance
Buying a home
Planning your estate/what inheritance you will leave behind
Preparing a financial plan
Planning for retirement
Boomers Millennials%
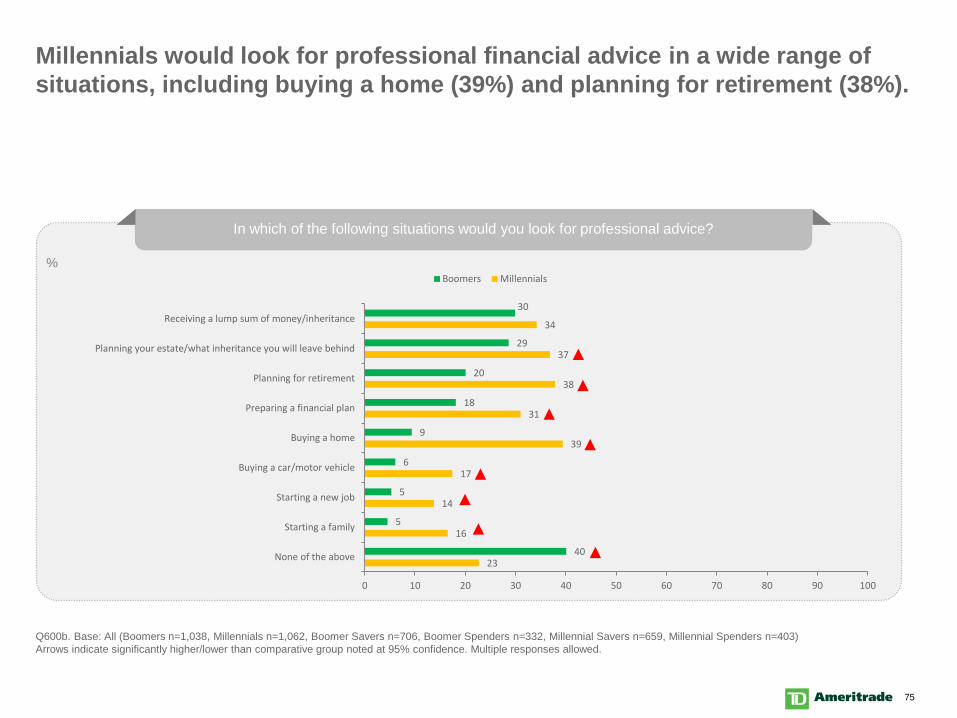
75
Millennials would look for professional financial advice in a wide range of situations, including buying a home (39%) and planning for retirement (38%).
Q600b. Base: All (Boomers n=1,038, Millennials n=1,062, Boomer Savers n=706, Boomer Spenders n=332, Millennial Savers n=659, Millennial Spenders n=403)Arrows indicate significantly higher/lower than comparative group noted at 95% confidence. Multiple responses allowed.
In which of the following situations would you look for professional advice?
23
16
14
17
39
31
38
37
34
40
5
5
6
9
18
20
29
30
0 10 20 30 40 50 60 70 80 90 100
None of the above
Starting a family
Starting a new job
Buying a car/motor vehicle
Buying a home
Preparing a financial plan
Planning for retirement
Planning your estate/what inheritance you will leave behind
Receiving a lump sum of money/inheritance
Boomers Millennials%
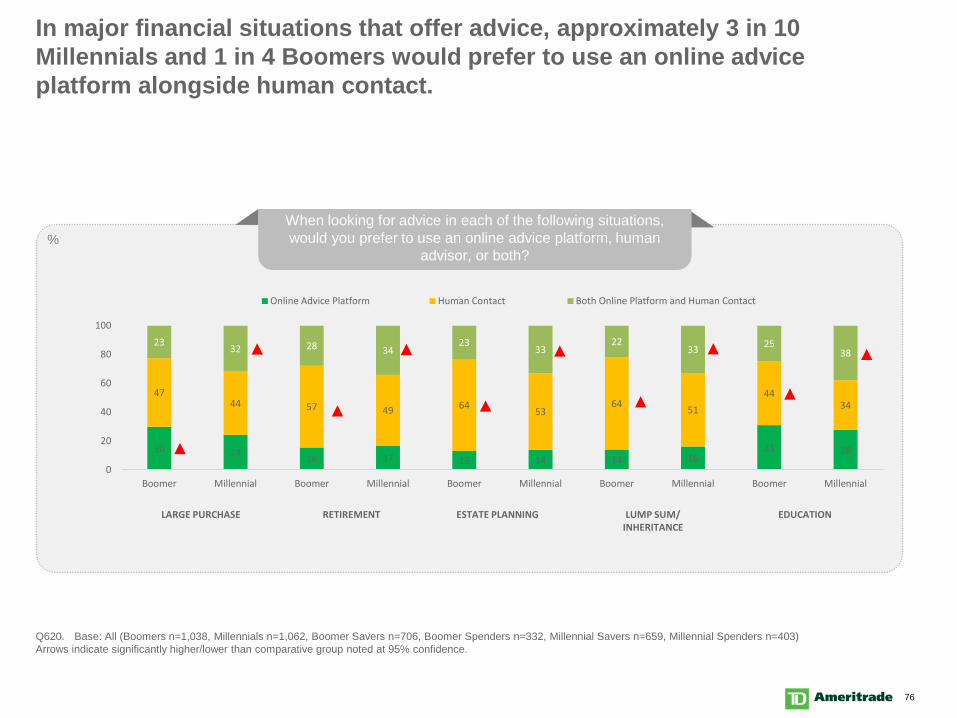
76
In major financial situations that offer advice, approximately 3 in 10 Millennials and 1 in 4 Boomers would prefer to use an online advice platform alongside human contact.
Q620. Base: All (Boomers n=1,038, Millennials n=1,062, Boomer Savers n=706, Boomer Spenders n=332, Millennial Savers n=659, Millennial Spenders n=403)Arrows indicate significantly higher/lower than comparative group noted at 95% confidence.
30 24 16 17 13 14 14 1631 28
4744 57 49 64 53
64 5144
34
23 32 28 3423
3322
33 2538
0
20
40
60
80
100
Boomer Millennial Boomer Millennial Boomer Millennial Boomer Millennial Boomer Millennial
Online Advice Platform Human Contact Both Online Platform and Human Contact
When looking for advice in each of the following situations, would you prefer to use an online advice platform, human
advisor, or both?%
LARGE PURCHASE RETIREMENT ESTATE PLANNING LUMP SUM/ INHERITANCE
EDUCATION
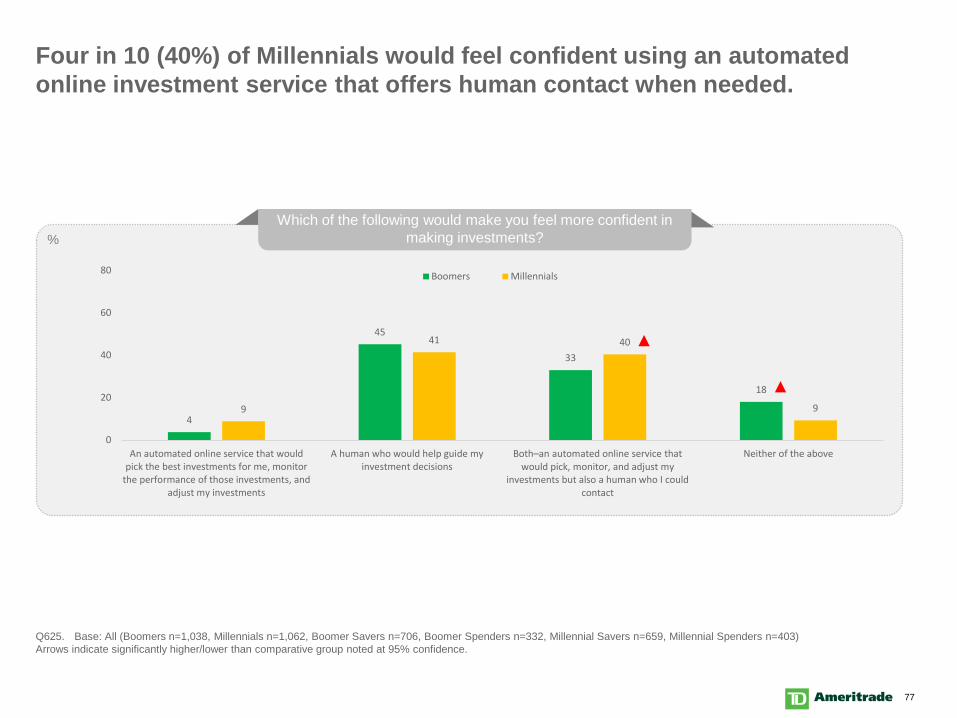
77
Four in 10 (40%) of Millennials would feel confident using an automated online investment service that offers human contact when needed.
Q625. Base: All (Boomers n=1,038, Millennials n=1,062, Boomer Savers n=706, Boomer Spenders n=332, Millennial Savers n=659, Millennial Spenders n=403)Arrows indicate significantly higher/lower than comparative group noted at 95% confidence.
4
45
33
18
9
41 40
9
0
20
40
60
80
An automated online service that wouldpick the best investments for me, monitor
the performance of those investments, andadjust my investments
A human who would help guide myinvestment decisions
Both–an automated online service that would pick, monitor, and adjust my
investments but also a human who I could contact
Neither of the above
Boomers Millennials
Which of the following would make you feel more confident in making investments?%
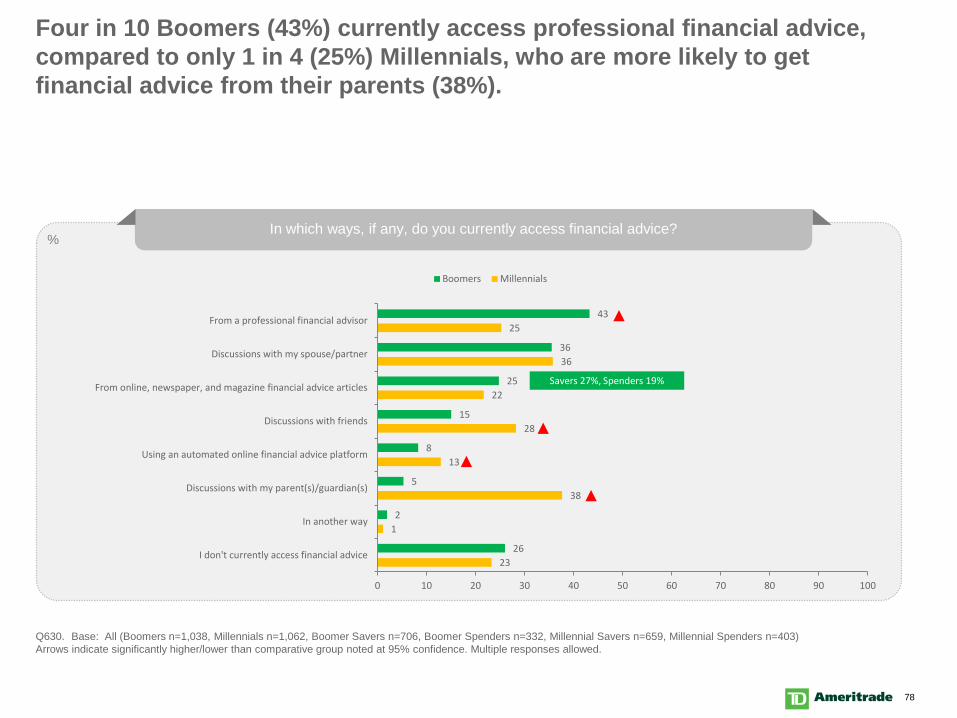
78
Four in 10 Boomers (43%) currently access professional financial advice, compared to only 1 in 4 (25%) Millennials, who are more likely to get financial advice from their parents (38%).
Q630. Base: All (Boomers n=1,038, Millennials n=1,062, Boomer Savers n=706, Boomer Spenders n=332, Millennial Savers n=659, Millennial Spenders n=403)Arrows indicate significantly higher/lower than comparative group noted at 95% confidence. Multiple responses allowed.
In which ways, if any, do you currently access financial advice?
23
1
38
13
28
22
36
25
26
2
5
8
15
25
36
43
0 10 20 30 40 50 60 70 80 90 100
I don't currently access financial advice
In another way
Discussions with my parent(s)/guardian(s)
Using an automated online financial advice platform
Discussions with friends
From online, newspaper, and magazine financial advice articles
Discussions with my spouse/partner
From a professional financial advisor
Boomers Millennials
%
Savers 27%, Spenders 19%
79
Appendix
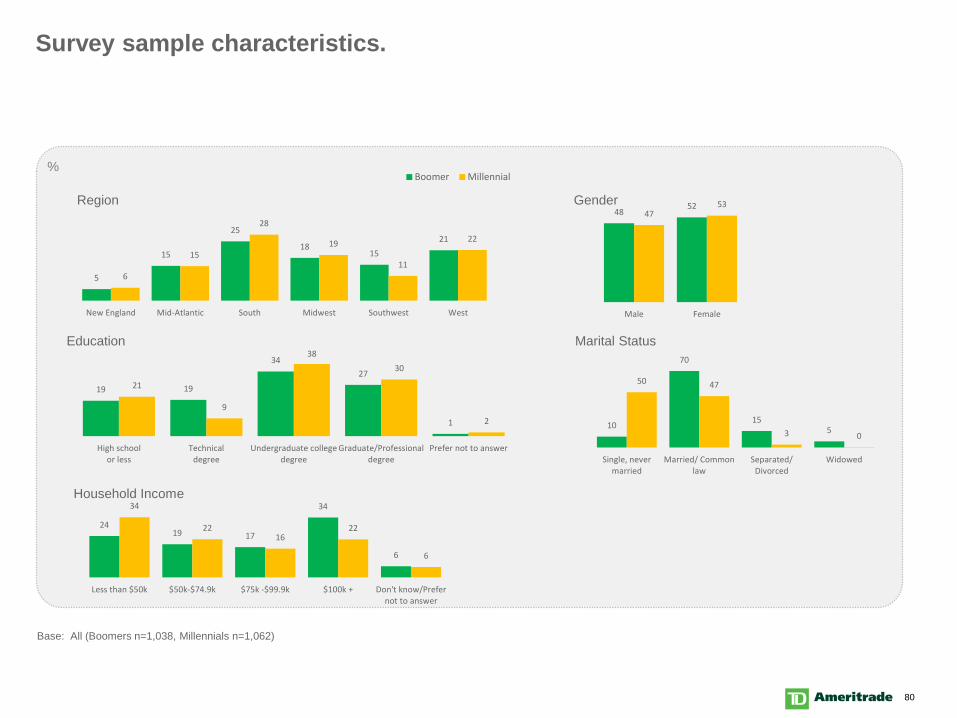
80
Survey sample characteristics.
Base: All (Boomers n=1,038, Millennials n=1,062)
5
15
25
1815
21
6
15
28
19
11
22
New England Mid-Atlantic South Midwest Southwest West
Region
19 19
3427
1
21
9
3830
2
High schoolor less
Technicaldegree
Undergraduate collegedegree
Graduate/Professionaldegree
Prefer not to answer
Education
2419 17
34
6
34
2216
22
6
Less than $50k $50k-$74.9k $75k -$99.9k $100k + Don't know/Prefernot to answer
Household Income
Marital Status
10
70
155
50 47
3 0
Single, nevermarried
Married/ Commonlaw
Separated/Divorced
Widowed
4852
4753
Male Female
Gender
%Boomer Millennial