Embed Size (px)
Citation preview

Milk River Main Channel
Channel Losses and Gains Assessment
Field Study 2007
Supplementary Report
Prepared by:
Greg MacCulloch Jerry Wagner-Watchel
Environment Canada
Meteorological Service of Canada Water Survey Division
Calgary, Alberta
For: Milk River Technical Working Group
February, 2011


i
Executive Summary The report, “Milk River Main Channel, Channel Losses and Gains Assessment, Field Study 2007”, provides the results of the field measurements and a preliminary analysis of the field study conducted to investigate changes in streamflow along the Canadian reach of the river. This supplementary report presents an analysis of factors affecting the streamflow measurements at the time of the field work. Rather than relying only on the flow measurements to assess channel losses and gains, additional analysis considers factors related to consumptive water use, evaporation / evapotranspiration, and precipitation at the time of the field surveys. When accounting for consumptive use, evaporative loss and precipitation, the August 2007 survey shows a west to east decline in flow magnitude, with the largest portion of unaccounted flow losses appearing to occur at two specific reaches of the river. The analysis of the flow measurements taken during the October 2007 survey, when accounting for consumptive use, evaporative loss and precipitation, shows a west to east increasing trend in flow magnitude with consistent gains in streamflow along the entire reach of the river. This report recommends a further irrigation-season investigation of the discontinuities of unaccounted flow losses at two specific reaches of the river, as a follow-up to the analysis of the August 2007 survey. Further investigation of increasing flows shown in the October 2007 survey in the reach near the Eastern Crossing of the International Boundary could provide a better understanding of the channel gains, possibly providing information related to channel seepage and releases from bank storage.

ii

iii
Contributors Don Bischoff (USGS) Eric Chase (MDNRC) Shane Christiansen (EC) Larry Dolan (MDNRC) Beau Hawkings (EC) Werner Herrera (ADOE) Vir Khanna (EC) Greg MacCulloch (EC) Norm Midtlyng (USGS) Dave Moncur (EC) Wayne Tice (USGS)
Abbreviations AENV – Alberta Department of the Environment EC – Environment Canada MDNRC – Montana Department of Natural Resources and Conservation MRTWG – Milk River Technical Working Group USGS – United States Geological Survey
Acknowledgements The authors would like to thank all the individual land owners and lease holders who aided the study team in allowing access to the river across their lands. The authors would also like to thank Clayton Weiss, Geomatics Technologist from Alberta Environment (AENV) Water Management Operations, for providing excellent mapping and relevant data for the study. Appreciation is expressed to the members of the Milk River Technical Working Group for their reviews of this report and the preliminary report: Milk River Main Channel, Channel Losses and Gains Assessment, Field Study 2007.

iv

v
Table of Contents Executive Summary ............................................................................................... i Contributors ......................................................................................................... iii Abbreviations ....................................................................................................... iii Acknowledgements.............................................................................................. iii Introduction ...........................................................................................................1 Methodology .........................................................................................................2 Results..................................................................................................................5
1. Total Difference between Upstream and Downstream Measured Discharge for August 14-17, 2007..............................................................5
2. Impact of Variable Flow for August 14-17, 2007 ........................................5 3. Impact of Evaporation and Precipitation for August 14-17, 2007 ...............5 4. Impact of Consumptive Use for August 14-17, 2007:.................................9 5. Unaccounted for Flow for August 14-17, 2007: ..........................................9 6. Impact of Distance Downstream for August 14-17, 2007 .........................12 7. Comparison of August and October 2007 Surveys: .................................18
Summary and Discussion ...................................................................................24 Recommendations ..............................................................................................26 Concluding Statements.......................................................................................27 References .........................................................................................................28

vi

vii
List of Figures Figure 1. Flow Accounting Schematic...................................................................3 Figure 2: Streamflow Record for North Milk River near the International
Boundary, August 2007 ...........................................................................8 Figure 3: Milk River Stream Width Progression, August 14-17, 2007 ...................8 Figure 4: Milk River Streamflow Progression Accounting for Thompson (1986)
Consumptive Use Values, Evaporation and Precipitation August 14-17, 2007 ...............................................................................12
Figure 5: Progressive Unaccounted for Losses to Milk River Streamflow Accounting for Thompson (1986) Consumptive Use Values, Evaporation and Precipitation, August 14-17, 2007...............................13
Figure 6: Milk River Streamflow Progression Accounting for Metered Consumptive Use, Evaporation, and Precipitation August 14-17, 2007 ...............................................................................14
Figure 7: Milk River Streamflow Categories Accounting for Metered Consumptive Use, Evaporation and Precipitation, August 14-17, 2007 ...............................................................................15
Figure 8: Progressive Unaccounted for Losses to Milk River Streamflow Accounting for Metered Consumptive Use, Evaporation, and Precipitation, August 14-17, 2007..........................................................16
Figure 9: Categories of Unaccounted for Losses to Milk River Streamflow Accounting for Metered Consumptive Use, Evaporation and Precipitation August 14 – 17, 2007 ............................................................................17
Figure 10: Milk River Streamflow Progression, October 1- 4, 2007 ....................22 Figure 11: Progressive Gains to Milk River Streamflow Accounting for
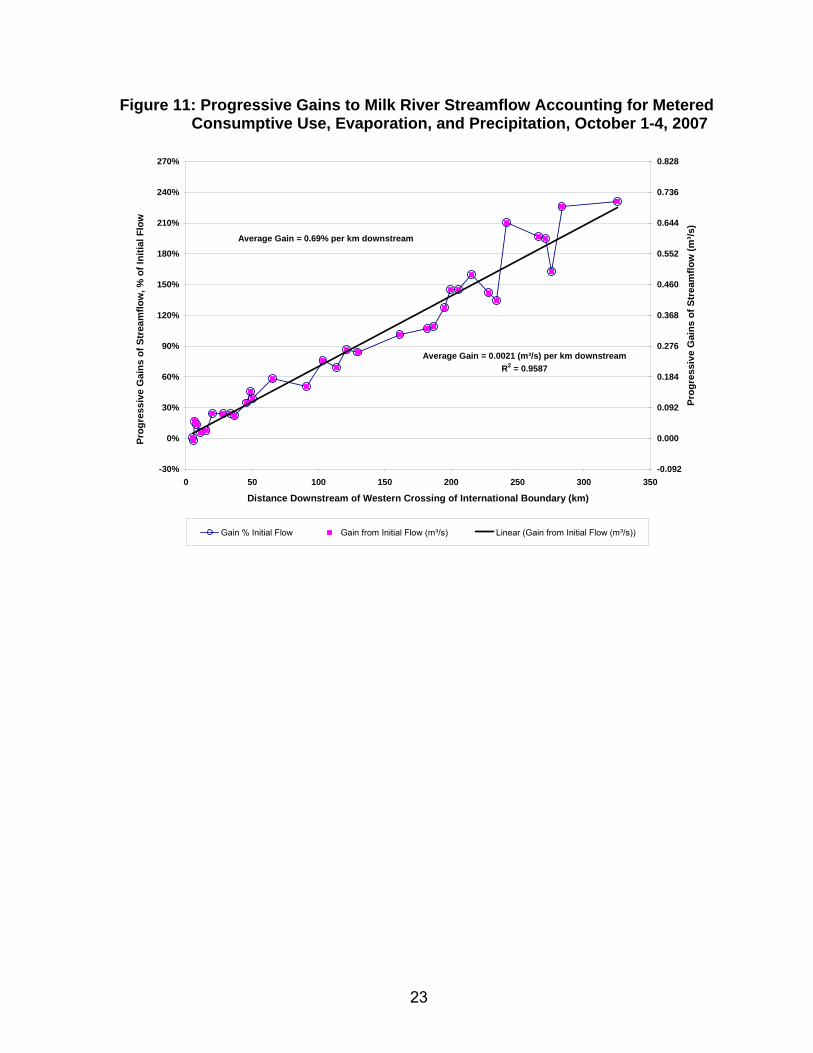
Metered Consumptive Use, Evaporation, and Precipitation, October 1-4, 2007..................................................................................23
List of Tables and Appendix Table 1: Measurements and Evaporation, August 14-17, 2007 ............................7 Table 2: Flows Accounting for Evaporation and Consumptive Use Based on
Thompson, August 14–17, 2007............................................................10 Table 3: Flows Accounting for Evaporation and Metered Consumptive Use,
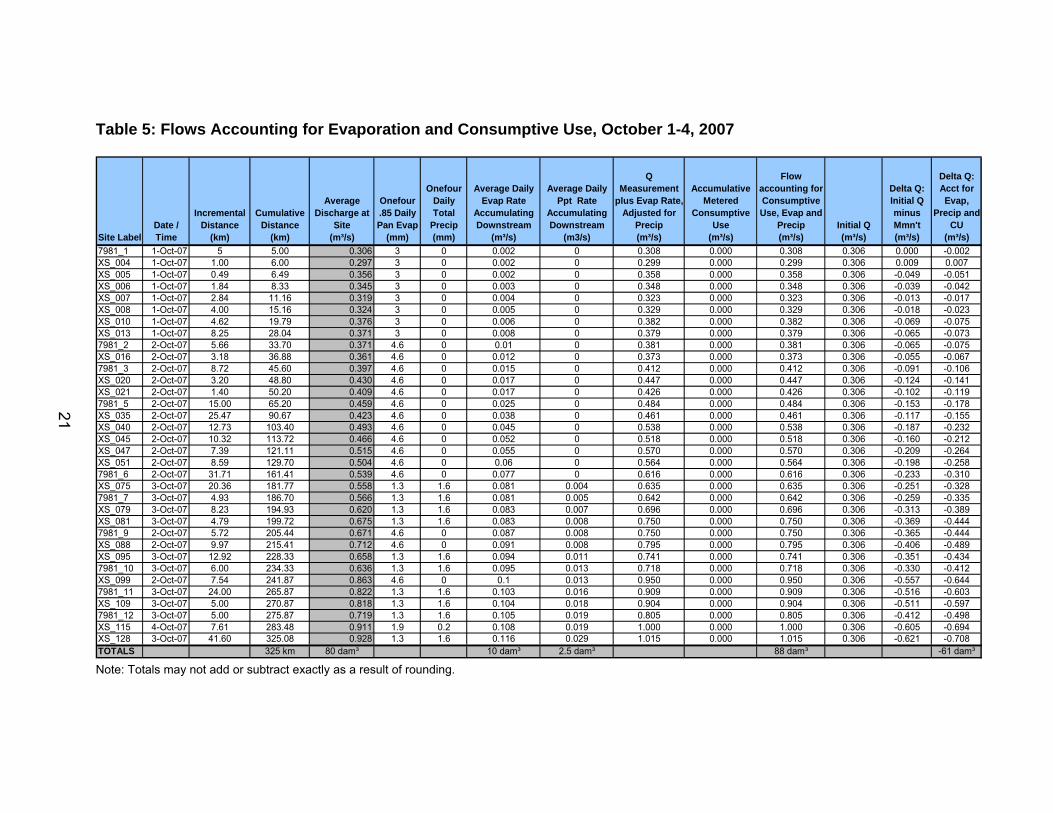
August 14-17, 2007 ...............................................................................11 Table 4: Measurements, Evaporation and Precipitation, October 1- 4, 2007......20 Table 5: Flows Accounting for Evaporation and Consumptive Use,
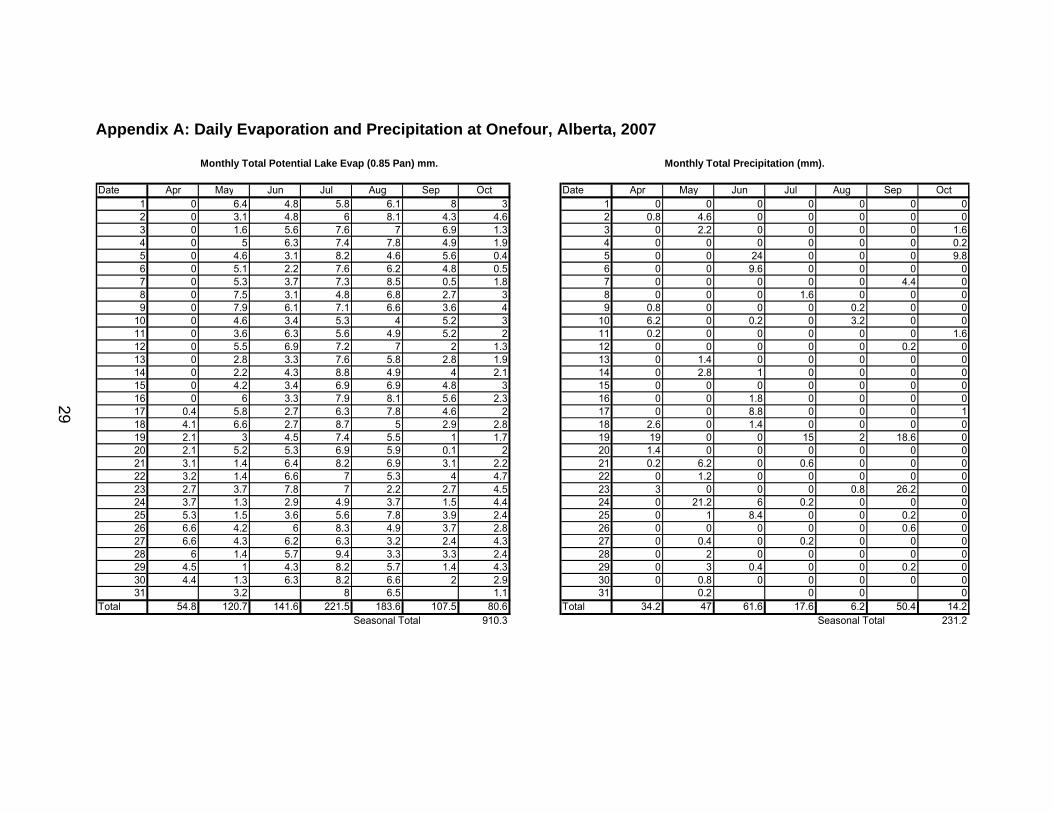
October 1-4, 2007..................................................................................21 Appendix A: Daily Evaporation and Precipitation at Onefour, Alberta, 2007.......29

viii

1
Introduction Following the initial report on the findings from the field streamflow measurements, the Milk River Technical Working Group (MRTWG) requested further analysis of the data found in the study. Specifically, the streamflow measurements during the August 2007 survey demonstrate a clear declining trend of streamflow as the measurements progress from upstream to downstream along the 335 km Canadian portion of the stream. Conversely, streamflow measurements made during the October 2007 survey show the opposite effect with flows increasing as the measurements progress downstream. Clearly, it would be of value to investigate these trends and draw some conclusions for further study. This supplementary report is provided to the MRTWG as a first attempt at this work.

2
Methodology Generally, natural channels accumulate streamflow volume as the channel progresses downstream. This is contrary to what was observed in the Milk River in August 2007, but it is not an unexpected finding. One obvious consideration is that the Milk River in Canada is not a natural channel: there is a significant diversion of water from St. Mary River into the stream above North Milk River near the International Boundary, there are withdrawals along the reach for irrigation and other use1, and in this particular part of the prairie landscape it can be shown that losses due to evapotranspiration can exceed precipitation2. An investigation, as to whether or not the losses can be accounted for, is considered to be an important first step in understanding the data. To determine if there are any unaccounted losses, an account was made of known and estimated contributions and losses. Figure 1 describes the basic flow accounting scheme that was applied to assess channel losses and gains. As shown in Figure 1, elements considered in the Milk River accounting scheme include:
1. Upstream measured (or gauged) flow at North Milk River near International Boundary (11AA001) and Milk River at Western Crossing of International Boundary (11AA025) in the stream channel
2. Changes in storage (impoundments or storage in reservoirs either along the main stem or off stream)
3. Estimates of natural losses from the system due to channel seepage and evapotranspiration
4. Estimates of natural gains to the system due to precipitation, snow melt, and ground water inflow
5. Net diversions from the stream and/or into the stream 6. Net consumptive use 7. Return flow to the stream from irrigation 8. Downstream measured (or gauged) flow at Milk River at Eastern Crossing
of International Boundary(11AA031) in the stream channel.
1 Thompson, R. E. 1986. Natural flow and water consumption in the Milk River basin, Montana and Alberta, Canada. [Helena, Mont.]: U.S. Geological Survey. 2 Canadian National Committee for the International Hydrological Decade. (1978). Hydrological atlas of Canada = Atlas hydrologique du Canada. [Ottawa]: Fisheries and Environment Canada.

3
Figure 1. Flow Accounting Schematic
For the streamflow surveys the following assumptions and considerations were made:
1. The lag between upstream and downstream is between 4 and 5 days; 2. Surveys progressed from upstream to downstream over 4 days to reduce
the impact of varying flow over the period; 3. Stream inflow at North Milk River near the International Boundary was
more or less steady during the time of the surveys; 4. Measured flows that did not follow the protocol outlined in the Channel
Loss and Gains Assessment main report have been removed from the analysis;
5. Initial estimates of consumptive water use were made using values provided in Thompson (1986)3. Later, the metered consumptive use data, as provided by Alberta Environment (AENV), was also applied in the analysis;
3 Thompson, R. E. 1986. Natural flow and water consumption in the Milk River basin, Montana and Alberta, Canada. Helena, Montana: U.S. Geological Survey.
4
6. Using the Thompson (1986) values: the estimate of total consumptive use was distributed over the reach based on distance downstream of North Milk River near the International Boundary. Consumptive use at the upstream end was zero, and the total at the Milk River at Eastern Crossing of the International Boundary (335 km downstream) was set to be 0.42 m3/s for a rate of 0.001254 m3/s per km;
7. For the metered consumptive use data: The consumptive use values were distributed along the reach of river in accordance with the location of the use of the water;
8. The quantity of return flow was considered to be negligible because the irrigation systems are primarily centre-pivot sprinkler;
9. Evaporation (dam3) from the stream surface was computed as: River Surface Area (km2)*(0.85* Net Onefour, Alberta Pan evaporation data (mm));
10. Precipitation to the river surface was considered in the net evaporation pan result;
11. Precipitation runoff from the land surface was considered to be negligible; 12. Stream width at each measuring site was determined by taking the
average of the A and B sample widths; 13. Stream reach length used was as provided by AENV for the proposed
sampling cross-sections; 14. Total stream surface area used for the calculation of evaporative losses
was calculated for each reach by taking the distance between measurement points multiplied by the average of the upstream and downstream mean channel width;
15. Flow measurements for the August 2007 survey were similar in magnitude for the first 65 km downstream of North Milk River near the International Boundary, and therefore the average was used to describe initial flow conditions in the channel.

5
Results 1. Total Difference between Upstream and Downstream Measured
Discharge for August 14-17, 2007:
Table 1 shows a loss of 3.5 m3/s from upstream to downstream (17.0 to 13.5 m3/s). This amounts to a loss in streamflow of about 302.4 dam3/day along the 335 km reach.
2. Impact of Variable Flow for August 14-17, 2007:
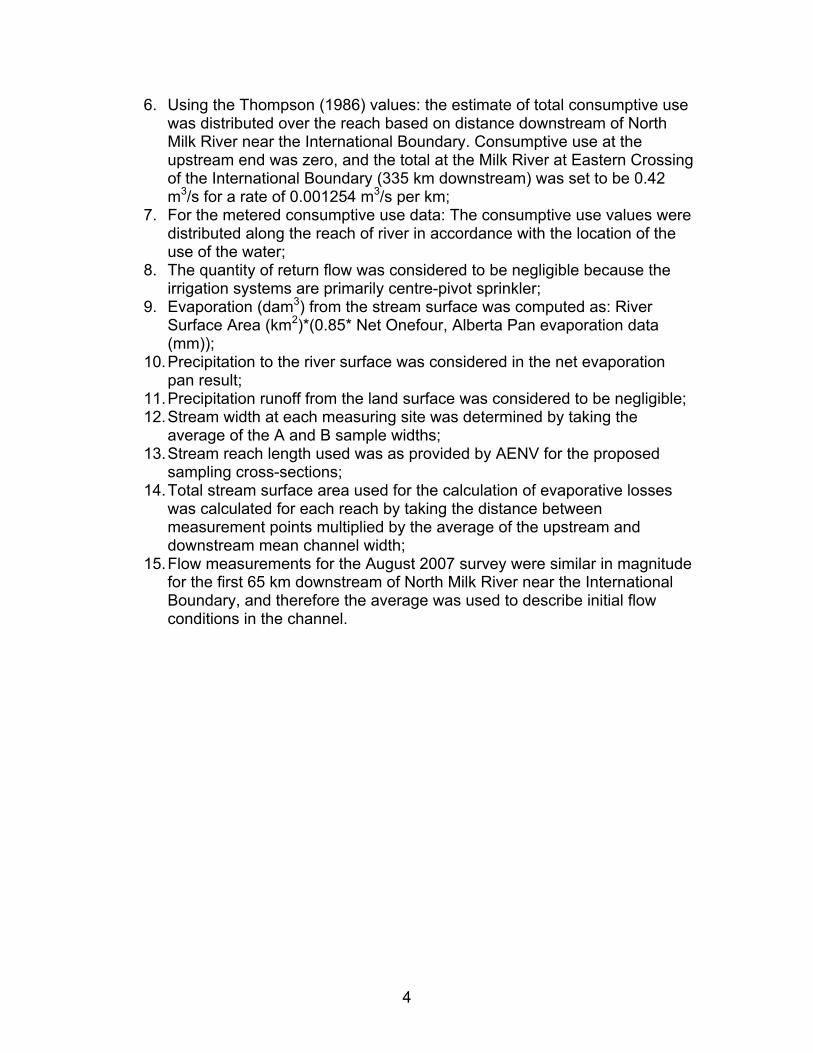
Mean daily streamflow record for the North Milk River near the International Boundary is plotted in Figure 2. This plot demonstrates that over the 4 days during which the August 2007 survey occurred, the flow at the upstream end changed from 16.8 m3/s to 16.6 m3/s. This declining trend may have been influential in the overall assessment of unaccounted losses between the upstream and downstream parts of the reach. However, for this time of year the Procedures Manual4 recommends a time of travel from west to east of approximately 5 days. Since the flow rates on August 13 and 14 were considered equal (16.8 m3/s) and the flow at the Milk River at the Eastern Crossing of the International Boundary that was measured on August 17 would be closer to the flow observed at the North Milk River near the International Boundary on August 12 (mean of 16.9 m3/s), then the worse case scenario is that we under represent the flow by 0.1 m3/s (0.5 % of the flow or 2.6% of the losses) at North Milk River near the International Boundary. However, as shown in Figure 3, the stream width increases downstream suggesting that even if the flow is held constant, that the hydraulic efficiency of the channel is reduced. This will likely attenuate the flow rate to some degree so that we may expect that the impact of not having a precisely constant streamflow through the course of the survey is less than the 0.1 m3/s actual difference between the upstream values.
3. Impact of Evaporation and Precipitation for August 14-17, 2007:
Table 1 shows the calculations used to assign incrementally increasing evaporation, during the August 2007 flow measurements, from the river surface progressing from upstream to downstream. As described in the
4 U.S. Geological Survey and Water Survey of Canada (2003), “Procedures for the Division of the Waters of the St. Mary and Milk Rivers”, Helena, MT. and Calgary, AB., Unpublished manual.

6
Procedures Manual (2003), evapotranspiration is determined by applying a factor of 0.85 to the net pan data derived at the Agriculture Canada Research Site at Onefour, Alberta.5 Refer to Appendix A for the pan derived evaporative data.
Comparing the total estimated evaporative losses of 0.94 m3/s (81 dam3/day) to the streamflow of 17.0 m3/s (1469 dam3/day) at the upstream end of the reach and to the 13.5 m3/s (1166 dam3/day) at the downstream end of the reach amounts to 5.5% and 6.9% of the flow at the upstream and downstream sites, respectively.
No precipitation was observed at the Onefour research station during the August 2007 surveys.
5 Agriculture and Agri-Food Canada. (2007). Pan Evaporation Data from Onefour, AB. Unpublished data

7
Table 1: Measurements and Evaporation, August 14-17, 2007
Site LabelDate / Time
Incremental Distance
(km)
Cumulative Distance
(km)
Average Discharge at
Site
(m3/s)
River Width
(m)
Onefour .85 Daily Pan Evap
(mm)
Onefour Daily Total
Precip (mm)
Incremental River Area
(km²)
Incremental River Daily
Evap (dam³)
Accumulating River Surface Evaporation
(dam³)
7981_1 14-Aug-07 5.0 5.0 17.0 26.2 4.9 0 0.1 0.6 0.6XS_004 14-Aug-07 1.0 6.0 17.0 26.2 4.9 0 0.0 0.1 0.8XS_005 14-Aug-07 0.5 6.5 16.8 28.7 4.9 0 0.0 0.1 0.87981_2 14-Aug-07 27.2 33.7 16.8 27.4 4.9 0 0.7 3.7 4.57981_3 14-Aug-07 11.9 45.6 17.2 26.5 4.9 0 0.3 1.5 6.0XS_020 14-Aug-07 3.2 48.8 17.2 34.0 4.9 0 0.1 0.5 6.6XS_021 14-Aug-07 1.4 50.2 17.2 19.0 4.9 0 0.0 0.1 6.77981_5 14-Aug-07 15.0 65.2 17.2 30.1 4.9 0 0.5 2.2 8.9XS_035 14-Aug-07 25.5 90.7 16.1 17.7 4.9 0 0.5 2.2 11.1XS_040 14-Aug-07 12.7 103.4 16.1 41.1 4.9 0 0.5 2.6 13.7XS_045 15-Aug-07 10.3 113.7 15.8 36.9 6.9 0 0.4 2.6 16.3XS_047 15-Aug-07 7.4 121.1 15.6 30.5 6.9 0 0.2 1.6 17.9XS_051 15-Aug-07 8.6 129.7 15.5 30.8 6.9 0 0.3 1.8 19.77981_6 15-Aug-07 31.7 161.4 15.2 31.7 6.9 0 1.0 6.9 26.6XS_075 15-Aug-07 20.4 181.8 15.5 27.7 6.9 0 0.6 3.9 30.57981_7 15-Aug-07 4.9 186.7 15.6 38.4 6.9 0 0.2 1.3 31.8XS_079 15-Aug-07 8.2 194.9 15.3 35.0 6.9 0 0.3 2.0 33.8XS_081 15-Aug-07 4.8 199.7 15.3 28.5 6.9 0 0.1 0.9 34.8XS_084 15-Aug-07 6.6 206.3 15.6 40.3 6.9 0 0.3 1.8 36.67981_10 16-Aug-07 28.1 234.3 14.3 52.1 8.1 0 1.5 11.8 48.47981_11 16-Aug-07 31.5 265.9 15.0 56.5 8.1 0 1.8 14.4 62.97981_12 16-Aug-07 10.0 275.9 14.3 27.5 8.1 0 0.3 2.2 65.1XS_128 17-Aug-07 49.2 325.1 13.9 32.8 7.8 0 1.6 12.6 77.7E_Crossing 17-Aug-07 9.9 335.0 13.5 39.0 7.8 0 0.4 3.0 80.7TOTALS 335 km 1162 dam³ 11.6 km² 81 dam³
7
Note: Totals may not add or subtract exactly as a result of rounding. Assumption: For the evaporation calculations, the width of the river at North Milk River near the International Boundary was assumed to be the same width as at the first streamflow measurement site.
8
Figure 2:6 Streamflow Record for North Milk River near the International Boundary, August 2007
16.0
16.5
17.0
17.5
12-Aug-07 13-Aug-07 14-Aug-07 15-Aug-07 16-Aug-07 17-Aug-07 18-Aug-07
Date
Mean
Dai
ly Q
m3 /s Mean Daily August 14/07
16.8 m³/s
Mean Daily August 17/0716.6 m³/s
Figure 3: Milk River Stream Width Progression, August 14-17, 2007
y = 0.047x + 26.061
R2 = 0.279
0.0
10.0
20.0
30.0
40.0
50.0
60.0
0 50 100 150 200 250 300 350 400
Distance Downstream of Western Crossing of International Boundary (km)
Str
eam
wid
th (
m)
6 Canada, Meteorological Service of Canada, & Water Survey of Canada. (2007). HYDAT Surface water and sediment data. Ottawa: Environment Canada. Water Survey of Canada website (2007) http://www.wsc.ec.gc.ca/products/main_e.cfm?cname=products_e.cfm

9
4. Impact of Consumptive Use for August 14-17, 2007:
Thompson (1986) Consumptive Use Values: Table 2, with values based on average consumptive use, shows that a total of 0.42 m3/s (36 dam3/day) was estimated to be lost due to consumptive use for the August 2007 flow measurements.
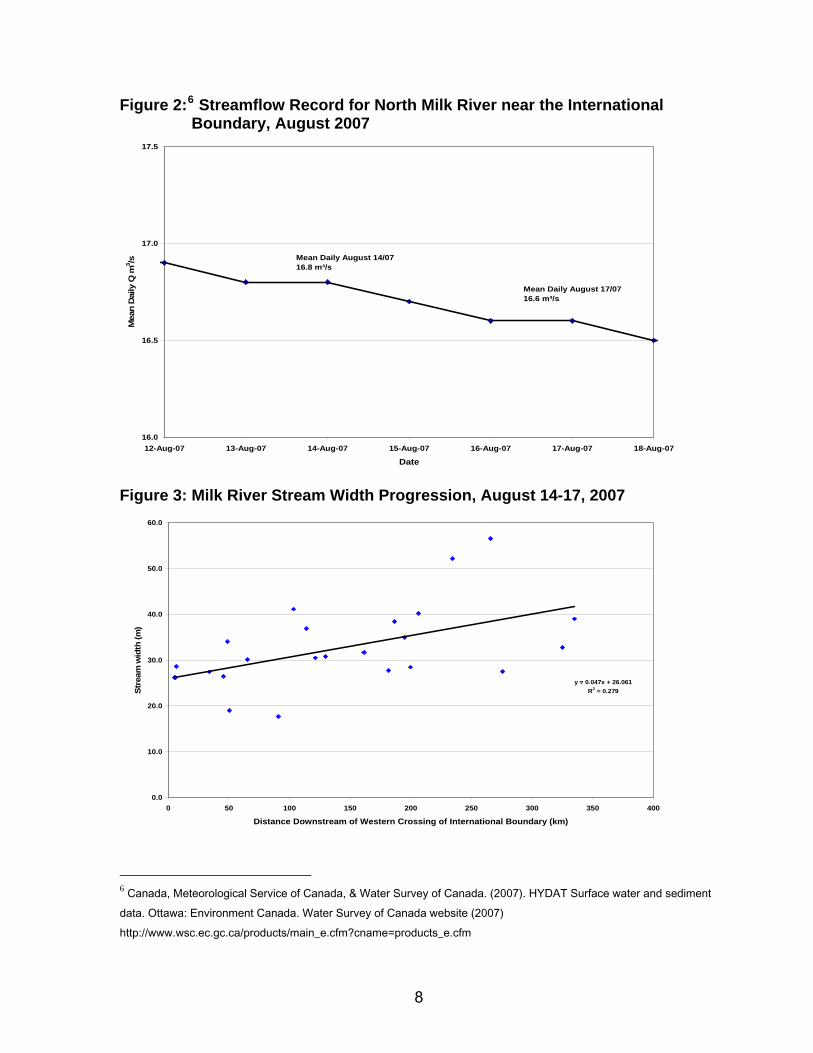
Metered Consumptive Use Data: The metered consumptive use data for August 14-17, 2007, as provided by AENV, was applied at corresponding streamflow measurement sites along the river channel. Refer to Table 3. The consumptive use data consist of records of usage at various time intervals during the day, expressed as a volumetric flow (acre-feet). The recorded consumptive use was summed for each day of the field study for application at a particular flow measurement site. The daily volumetric flow was converted into a flow rate (m3/s) for accounting purposes with streamflow measurements and for comparison with Thompson (1986) consumptive use estimates. A total of 0.83 m3/s (71 dam3/day) was diverted, during the August survey, from the streamflow by metered consumptive use for irrigation.
5. Unaccounted Flow for August 14-17, 2007:
Using Thompson (1986) Consumptive Use Values: As shown in Table 2, accounting for time of travel, precipitation, evaporation, and Thompson estimates of consumptive use over the 4 days in August 2007 results in 2.23 m3/s (193 dam3/day) of unaccounted flow by the time the study team measured the flow at the Milk River at Eastern Crossing of the International Boundary site. This amounts to 13% of the original 17.0 m3/s (1469 dam3/day) that was found at North Milk River near the International Boundary approximately 3 days earlier.
Using Metered Consumptive Use Data: Similarly, as shown in Table 3, accounting for time of travel, precipitation, evaporation, and metered consumptive use over the 4 days in August 2007 results in an unaccounted flow of 1.83 m3/s (158 dam3/day) by the time the study team measured the flow at Milk River at Eastern Crossing of International Boundary. This amounts to 11% of the original 17.0 m3/s (1469 dam3/day), found at the North Milk River near the International Boundary site approximately 3 days earlier.

10
Table 2: Flows Accounting for Evaporation and Consumptive Use Based on Thompson, August 14–17, 2007
Site LabelDate / Time
Incremental Distance (km)
Cumulative Distance
(km)
Average Discharge at
Site
(m3/s)
Average Daily Evap Rate Accumulating
Downstream (m³/s)
Q Measurement
Plus Evap Rate (m³/s)
Accumulative Thompson's Consumptive
Use (m³/s)
Flow Accounting for Consumptive
Use and Surface
Evaporation (m³/s)
Q Average First 65 Km
(m³/s)
Delta Q: Intial Q minus Mmn't (m³/s)
Delta Q: Acct for Evap,
Precip and CU
(m³/s)
7981_1 14-Aug-07 5.0 5.0 17.0 0.007 16.977 0.006 17.0 17.0 0.1 0.1XS_004 14-Aug-07 1.0 6.0 17.0 0.009 17.057 0.008 17.1 17.0 0.0 0.0XS_005 14-Aug-07 0.5 6.5 16.8 0.01 16.826 0.008 16.8 17.0 0.2 0.27981_2 14-Aug-07 27.2 33.7 16.8 0.052 16.852 0.042 16.9 17.0 0.2 0.27981_3 14-Aug-07 11.9 45.6 17.2 0.07 17.271 0.057 17.3 17.0 -0.2 -0.3XS_020 14-Aug-07 3.2 48.8 17.2 0.076 17.273 0.061 17.3 17.0 -0.1 -0.3XS_021 14-Aug-07 1.4 50.2 17.2 0.078 17.230 0.063 17.3 17.0 -0.1 -0.27981_5 14-Aug-07 15.0 65.2 17.2 0.103 17.299 0.082 17.4 17.0 -0.1 -0.3XS_035 14-Aug-07 25.5 90.7 16.1 0.129 16.202 0.114 16.3 17.0 1.0 0.7XS_040 14-Aug-07 12.7 103.4 16.1 0.158 16.301 0.130 16.4 17.0 0.9 0.6XS_045 15-Aug-07 10.3 113.7 15.8 0.189 15.982 0.143 16.1 17.0 1.3 0.9XS_047 15-Aug-07 7.4 121.1 15.6 0.207 15.782 0.152 15.9 17.0 1.5 1.1XS_051 15-Aug-07 8.6 129.7 15.5 0.228 15.699 0.163 15.9 17.0 1.6 1.27981_6 15-Aug-07 31.7 161.4 15.2 0.308 15.534 0.202 15.7 17.0 1.8 1.3XS_075 15-Aug-07 20.4 181.8 15.5 0.353 15.854 0.228 16.1 17.0 1.5 1.07981_7 15-Aug-07 4.9 186.7 15.6 0.369 15.978 0.234 16.2 17.0 1.4 0.8XS_079 15-Aug-07 8.2 194.9 15.3 0.392 15.704 0.244 15.9 17.0 1.7 1.1XS_081 15-Aug-07 4.8 199.7 15.3 0.402 15.656 0.250 15.9 17.0 1.8 1.1XS_084 15-Aug-07 6.6 206.3 15.6 0.423 16.040 0.259 16.3 17.0 1.4 0.77981_10 16-Aug-07 28.1 234.3 14.3 0.561 14.900 0.294 15.2 17.0 2.7 1.97981_11 16-Aug-07 31.5 265.9 15.0 0.728 15.703 0.333 16.0 17.0 2.1 1.07981_12 16-Aug-07 10.0 275.9 14.3 0.753 15.077 0.346 15.4 17.0 2.7 1.6XS_128 17-Aug-07 49.2 325.1 13.9 0.899 14.773 0.408 15.2 17.0 3.2 1.9E_Crossing 17-Aug-07 9.9 335.0 13.5 0.934 14.388 0.420 14.8 17.0 3.6 2.2TOTALS 335 km 1162 dam³ 81 dam³ 1243 dam³ 36 dam³ 1279 dam³ 1473 dam³ 310 dam³ 193 dam³
10
Note: Totals may not add or subtract exactly as a result of rounding. Assumption: For the evaporation calculations, the width of the river at North Milk River near the International Boundary was assumed to be the same width as at the first streamflow measurement site.
11
Table 3: Flows Accounting for Evaporation and Metered Consumptive Use, August 14-17, 2007
Site LabelDate / Time
Incremental Distance
(km)
Cumulative Distance
(km)
Average Discharge at
Site
(m3/s)
Average Daily Evap Rate
Accumulating Downstream
(m³/s)
Q Measurement Plus Evap Rate
(m³/s)
Metered Consumptive
Use (m³/s)
Accumulative Metered
Consumptive Use
(m³/s)
Flow Accounting for Consumptive
Use and Surface
Evaporation (m³/s)
Q Average First 65 Km
(m³/s)
Delta Q: Intial Q minus Mmn't (m³/s)
Delta Q: Acct for Evap, Precip and CU (m³/s)
7981_1 14-Aug-07 5.0 5.0 17.0 0.007 16.977 0.000 0.000 17.0 17.0 0.1 0.1XS_004 14-Aug-07 1.0 6.0 17.0 0.009 17.057 0.000 0.000 17.1 17.0 0.0 0.0XS_005 14-Aug-07 0.5 6.5 16.8 0.01 16.826 0.000 0.000 16.8 17.0 0.2 0.27981_2 14-Aug-07 27.2 33.7 16.8 0.052 16.852 0.000 0.000 16.9 17.0 0.2 0.27981_3 14-Aug-07 11.9 45.6 17.2 0.07 17.271 0.000 0.000 17.3 17.0 -0.2 -0.2XS_020 14-Aug-07 3.2 48.8 17.2 0.076 17.273 0.000 0.000 17.3 17.0 -0.1 -0.2XS_021 14-Aug-07 1.4 50.2 17.2 0.078 17.230 0.000 0.000 17.2 17.0 -0.1 -0.27981_5 14-Aug-07 15.0 65.2 17.2 0.103 17.299 0.000 0.000 17.3 17.0 -0.1 -0.3XS_035 14-Aug-07 25.5 90.7 16.1 0.129 16.202 0.048 0.048 16.2 17.0 1.0 0.8XS_040 14-Aug-07 12.7 103.4 16.1 0.158 16.301 0.000 0.048 16.3 17.0 0.9 0.7XS_045 15-Aug-07 10.3 113.7 15.8 0.189 15.982 0.000 0.048 16.0 17.0 1.3 1.0XS_047 15-Aug-07 7.4 121.1 15.6 0.207 15.782 0.025 0.073 15.9 17.0 1.5 1.2XS_051 15-Aug-07 8.6 129.7 15.5 0.228 15.699 0.183 0.256 16.0 17.0 1.6 1.17981_6 15-Aug-07 31.7 161.4 15.2 0.308 15.534 0.000 0.256 15.8 17.0 1.8 1.3XS_075 15-Aug-07 20.4 181.8 15.5 0.353 15.854 0.122 0.378 16.2 17.0 1.5 0.87981_7 15-Aug-07 4.9 186.7 15.6 0.369 15.978 0.068 0.446 16.4 17.0 1.4 0.6XS_079 15-Aug-07 8.2 194.9 15.3 0.392 15.704 0.101 0.547 16.3 17.0 1.7 0.8XS_081 15-Aug-07 4.8 199.7 15.3 0.402 15.656 0.042 0.589 16.2 17.0 1.8 0.8XS_084 15-Aug-07 6.6 206.3 15.6 0.423 16.040 0.000 0.589 16.6 17.0 1.4 0.47981_10 16-Aug-07 28.1 234.3 14.3 0.561 14.900 0.238 0.827 15.7 17.0 2.7 1.37981_11 16-Aug-07 31.5 265.9 15.0 0.728 15.703 0.000 0.827 16.5 17.0 2.1 0.57981_12 16-Aug-07 10.0 275.9 14.3 0.753 15.077 0.000 0.827 15.9 17.0 2.7 1.1XS_128 17-Aug-07 49.2 325.1 13.9 0.899 14.773 0.000 0.827 15.6 17.0 3.2 1.4E_Crossing 17-Aug-07 9.9 335.0 13.5 0.934 14.388 0.000 0.827 15.2 17.0 3.6 1.8TOTALS 335 km 1162 dam³ 81 dam³ 1243 dam³ 71 dam³ 71 dam³ 1315 dam³ 1473 dam³ 310 dam³ 158 dam³
11
Note: Totals may not add or subtract exactly as a result of rounding.

12
6. Impact of Distance Downstream for August 14-17, 2007:
Thompson (1986) Values: Both the streamflow measurements and the measurements adjusted for consumptive use, evaporative losses, and precipitation are shown in Figure 4. The consumptive use losses were distributed equally with distance downstream. The streamflow measurement data on this chart are the mean of the A and B samples at each measuring point plotted against their distance downstream of North Milk River near the International Boundary.
Figure 4: Milk River Streamflow Progression Accounting for Thompson (1986)
Consumptive Use Values, Evaporation and Precipitation August 14-17, 2007
0 km to 335 km Q adjusted for Evap and Thompson's CU
R2 = 0.5916
0 km to 335 kmMeasured Q in field
R2 = 0.8278
8.0
12.0
16.0
20.0
24.0
0 50 100 150 200 250 300 350 400
Distance Downstream of Western Crossing of International Boundary (km)
Mil
k R
iver
Str
eam
flo
w (
m³/
s),
Au
gu
st
14 -
17,
2007
Measured Q (m³/s) Q adjusted for Evap and CU (m³/s)
Linear (Q adjusted for Evap and CU (m³/s)) Linear (Measured Q (m³/s) )
Figure 5 demonstrates the unaccounted losses of streamflow with progression downstream. As previously described, when considering consumptive uses based on Thompson (1986) and the evaporative losses, 13% of the flow cannot be accounted at Milk River at Eastern Crossing of the International Boundary.

13
Figure 5: Progressive Unaccounted for Losses to Milk River Streamflow Accounting for Thompson (1986) Consumptive Use Values, Evaporation and Precipitation, August 14-17, 2007
Average Unaccounted for Losses = 0.0067 (m³/s) per km downstream
R2 = 0.7646
-5%
-3%
-1%
1%
3%
5%
7%
9%
11%
13%
15%
0 50 100 150 200 250 300 350 400
Distance Downstream of Western Crossing of International Boundary (km)
Pro
gre
ssiv
e U
nac
cou
nte
d f
or
Lo
sses
of
Str
eam
flo
w
% o
f In
itia
l Flo
w
-0.85
-0.51
-0.17
0.17
0.51
0.85
1.19
1.53
1.87
2.21
2.55
Pro
gre
ssiv
e U
nac
cou
nte
d f
or
Lo
sses
of
Str
eam
flo
w
(m³/
s)
Δ Q acct CU and Evap as % of Initial Q Δ Q acct CU and Evap (m³/s) Linear (Δ Q acct CU and Evap (m³/s))
Average Unaccounted for Losses = 0.04% per km downstream
Metered Consumptive Use: Figure 6 shows the streamflow measurements and the measurements with accounting for metered consumptive use, evaporative losses, and precipitation. The consumptive use values were spatially referenced, corresponding to streamflow measurement sites along the river channel. The metered consumptive uses were located from 90 km to 234 km downstream of North Milk River near the International Boundary. The streamflow measurement data on this chart are the mean of the A and B samples at each measuring site plotted against their distance downstream of North Milk River near the International Boundary.

14
Figure 6: Milk River Streamflow Progression Accounting for Metered Consumptive Use, Evaporation, and Precipitation August 14-17, 2007
0 km to 335 kmMeasured Q in field
R2 = 0.8278
0 km to 335 kmQ adjusted for Evap and Metered CU
R2 = 0.5943
8.0
12.0
16.0
20.0
24.0
0 50 100 150 200 250 300 350 400
Distance Downstream of Western Crossing of International Boundary (km)
Mil
k R
ive
r S
trea
mfl
ow
(m
³/s)
, A
ug
ust
14
- 1
7, 2
007
Measured Q (m³/s) Q adjusted for Evap and Metered CU (m³/s)
Linear (Measured Q (m³/s) ) Linear (Q adjusted for Evap and Metered CU (m³/s))
The direct flow measurements appear in 4 distinct groups along the river channel, as displayed in Figure 7. These groups of measurements are located downstream from North Milk River near the International Boundary as follows:
1. 0 km to 65 km, steady with an average flow about 17.0 m3/s (1469 dam3/day)
2. 90 km to 130 km, measured flows are in steady decline 3. 130 km to 220 km, measured flows appear steady 4. 234 km to 335 km, measured flows are in steady decline.

15
Figure 7: Milk River Streamflow Categories Accounting for Metered Consumptive Use, Evaporation and Precipitation, August 14-17, 2007
0 km to 335 kmMeasured Q in field
R2 = 0.8278
90 km to 130 kmMeasured Q in field
R2 = 0.852
234 km to 335 kmMeasured Q in field
R2 = 0.5831
0 km to 335 kmQ adjusted for Evap and Metered CU
R2 = 0.5943
8.0
12.0
16.0
20.0
24.0
0 50 100 150 200 250 300 350 400
Distance Downstream of Western Crossing of International Boundary (km)
Milk
Riv
er S
trea
mfl
ow
(m
³/s)
, Au
gu
st 1
4 -
17, 2
007
Measured Q (m³/s) zero to 65 km90 to 130 km 234 to 335 km1st 65 km avg Q adjusted for Evap and Metered CU (m³/s)130 to 220 km Linear (Measured Q (m³/s) )Linear (90 to 130 km) Linear (234 to 335 km)Linear (Q adjusted for Evap and Metered CU (m³/s)) Linear (130 to 220 km)
Group 1
Group 2Group 3
Group 4
Figure 8 shows the unaccounted losses of streamflow as measurements progress downstream from North Milk River near the International Boundary to the Milk River at Eastern Crossing of the International Boundary. When accounting for metered consumptive use, evaporative losses and precipitation, the unaccounted for losses are 1.83 m3/s, or approximately 11% of the flow, at the Milk River at Eastern Crossing of the International Boundary.

16
Figure 8: Progressive Unaccounted for Losses to Milk River Streamflow Accounting for Metered Consumptive Use, Evaporation, and Precipitation, August 14-17, 2007
Average Unaccounted for Losses = 0.0055 (m³/s) per km downstream
R2 = 0.5943
-5%
-3%
-1%
1%
3%
5%
7%
9%
11%
13%
15%
0 50 100 150 200 250 300 350 400
Distance Downstream of Western Crossing of International Boundary (km)
Pro
gre
ssiv
e U
na
cco
un
ted
fo
r L
os
ses
of
Str
eam
flo
w,
% o
f In
itia
l Flo
w
-0.85
-0.51
-0.17
0.17
0.51
0.85
1.19
1.53
1.87
2.21
2.55
Pro
gre
ssi
ve U
nac
cou
nte
d f
or
Lo
sse
s o
f S
tre
amfl
ow
(m
³/s)
Loss % Initial Flow Loss from Initial Flow (m³/s) Linear (Loss from Initial Flow (m³/s))
0
Average Unaccounted for Losses = 0.03% per km downstream
To further demonstrate the distribution of the unaccounted losses along the channel of the river, the losses in streamflow were arranged in categories. As shown in Figure 9, the unaccounted losses appear to be located along the river in 3 distinct groups, downstream from North Milk River near the International Boundary, as follows:
1. 0 km to 65 km 2. 90 km to 325 km 3. 325 km to 335 km.
In Group 1, the unaccounted losses are within about +/-1% of the average unaccounted losses in the first 65 km of the river. In Group 2, the unaccounted losses are within about +/-3% of the average unaccounted losses in the reach between 90 km and 325 km. In Group 3, the unaccounted losses are within about +/-1% of the average unaccounted losses in the reach between 325 km and 335 km.

17
In the reach between 65 km and 90 km, between Group 1 and 2, there is a relatively large increase in unaccounted losses. This discontinuity of unaccounted losses between the two groups is displayed in Figure 9. Also, between Group 2 and Group 3, there is a discontinuity of unaccounted losses. Although Group 3 has been grouped with only two survey sites, the measurement near the Milk River at Eastern Crossing of International Boundary has not been disregarded. There were 3 flow measurements taken at this site in August 2007, one Sontek Flowtracker and 2 conventional measurements. The difference in the magnitude of the 3 measurements at the site was within 5% relative percent difference.
Figure 9: Categories of Unaccounted for Losses to Milk River Streamflow Accounting for Metered Consumptive Use, Evaporation and Precipitation August 14 – 17, 2007
-5%
-3%
-1%
1%
3%
5%
7%
9%
11%
13%
15%
0 50 100 150 200 250 300 350 400
Distance Downstream of Western Crossing of International Boundary (km)
Un
acc
ou
nte
d f
or
Lo
sse
s o
f S
tre
am
flo
w,
% o
f In
itia
l Flo
w
-0.85
-0.51
-0.17
0.17
0.51
0.85
1.19
1.53
1.87
2.21
2.55
Un
acco
un
ted
fo
r L
oss
es o
f S
trea
mfl
ow
(m
³/s)
Group 1
Group 2
Group 3
Loss % Initial Flow first 65km avg 90 to 325 km avg Loss from Initial Flow (m³/s)

18
7. Comparison of August and October 2007 Surveys:
October 2007 streamflow measurements were compared to the August 2007 streamflow measurements with a number of important considerations:
i. There was no United States diversion from the St. Mary River to the North Milk River during the October survey, whereas there was a steady 16.6 m3/s daily diversion during the August survey.
ii. The flow magnitude was approximately 40 times less in October than in August.
iii. Stream width in October was approximately 1/3 the width measured in August.
iv. In October, there was no consumptive water use applied to flow measurements, whereas in August a balance was carried out for both the Thompson’s values and the metered consumptive use.
v. In October, the potential evaporation was approximately 0.12 m3/s (10 dam3/day), as shown in Table 4. The calculations assign incrementally increasing evaporation from the river surface progressing from upstream to downstream. Similar to the August calculations, as described in the Procedures Manual (2003), evapotranspiration was determined by applying a factor of 0.85 to the pan data derived at the Agriculture Canada Research Site at Onefour, Alberta.7 In August, the evaporative loss as estimated in Table 1 was 0.94 m3/s (81 dam3/day).
vi. Precipitation did not occur during the August flow measurements. In October there was rainfall during the field survey, 1.6 mm on October 3 and 0.2 mm on October 4. As shown in Table 4, the accumulating precipitation downstream amounted to 0.029 m3/s (2.5 dam3/day) on the river surface. The quantity of precipitation contributing to the surface water of the river was subtracted from the accounting so as not to confuse the issue of channel losses/gains. Expectations are that runoff would be negligible unless large amounts of rainfall occurred.
vii. Flows, during the October field study, for Milk River at Western Crossing of International Boundary were as follows:
October 1: 0.015 m3/s
October 2: 0.021 m3/s
October 3: 0.019 m3/s
October 4: 0.014 m3/s.
There were no flows at Milk River at Western Crossing of International Boundary during the August field work.
7 Agriculture and Agri-Food Canada. (2007). Pan Evaporation Data from Onefour, AB. Unpublished data

19
viii. Table 5 shows that the measured flows during the October surveys increased by a factor of 3.0, or from 0.306 m3/s to 0.928 m3/s (26 to 80 dam3/day), from North Milk River near the International Boundary to Milk River at Eastern Crossing of the International Boundary. In contrast, the flows measured during August decreased by a factor of 0.8, or from 17.0 m3/s to 13.5 m3/s (1469 to 1166 dam3/day), from North Milk River near the International Boundary to the Milk River at Eastern Crossing of the International Boundary, as shown in Table 1.
ix. Also shown in Table 5, the October flow measurements with accounting for consumptive use, evaporation, and precipitation increased by a factor of 3.3 along the reach, from 0.308 m3/s to 1.015 m3/s (27 to 88 dam3/day), gaining 0.707 m3/s (61 dam3/day). In contrast, when accounting for metered consumptive use, evaporative losses and precipitation, the August flows decreased by a factor of 0.9 along the reach, from 17.0 m3/s to 15.2 m3/s (1469 to 1313 dam3/day), decreasing by 1.83 m3/s (158 dam3/day), as shown in Table 3.

20
Table 4: Measurements, Evaporation and Precipitation, October 1- 4, 2007
Site LabelDate / Time
Incremental Distance
(km)
Cumulative Distance
(km)
Average Discharge at
Site
(m3/s)
River Width
(m)
Onefour .85 Daily Pan Evap
(mm)
Onefour Daily Total
Precip (mm)
Incremental River Area
(km²)
Incremental River Daily
Evap (dam³)
Accumulating River Surface
Evap (dam³)
Average Daily Evap Rate
Accumulating Downstream
(m3/s)
Incremental River Daily
Precip (dam³)
Accumulating River Surface
Precip (dam³)
7981_1 1-Oct-07 5 5.00 0.306 10.8 3 0 0.054 0.162 0.162 0.002 0 0XS_004 1-Oct-07 1.00 6.00 0.297 8.5 3 0 0.008 0.024 0.186 0.002 0 0XS_005 1-Oct-07 0.49 6.49 0.356 7.8 3 0 0.004 0.012 0.198 0.002 0 0XS_006 1-Oct-07 1.84 8.33 0.345 10.1 3 0 0.018 0.054 0.252 0.003 0 0XS_007 1-Oct-07 2.84 11.16 0.319 9.9 3 0 0.028 0.084 0.336 0.004 0 0XS_008 1-Oct-07 4.00 15.16 0.324 6.7 3 0 0.027 0.081 0.417 0.005 0 0XS_010 1-Oct-07 4.62 19.79 0.376 5.7 3 0 0.026 0.078 0.495 0.006 0 0XS_013 1-Oct-07 8.25 28.04 0.371 6.4 3 0 0.053 0.159 0.654 0.008 0 07981_2 2-Oct-07 5.66 33.70 0.371 7.2 4.6 0 0.041 0.189 0.843 0.01 0 0XS_016 2-Oct-07 3.18 36.88 0.361 13.2 4.6 0 0.042 0.193 1.036 0.012 0 07981_3 2-Oct-07 8.72 45.60 0.397 7.5 4.6 0 0.065 0.299 1.335 0.015 0 0XS_020 2-Oct-07 3.20 48.80 0.430 7.9 4.6 0 0.025 0.115 1.450 0.017 0 0XS_021 2-Oct-07 1.40 50.20 0.409 8.5 4.6 0 0.012 0.055 1.505 0.017 0 07981_5 2-Oct-07 15.00 65.20 0.459 9.1 4.6 0 0.137 0.63 2.135 0.025 0 0XS_035 2-Oct-07 25.47 90.67 0.423 9.9 4.6 0 0.252 1.159 3.294 0.038 0 0XS_040 2-Oct-07 12.73 103.40 0.493 9.8 4.6 0 0.124 0.57 3.864 0.045 0 0XS_045 2-Oct-07 10.32 113.72 0.466 12.8 4.6 0 0.132 0.607 4.471 0.052 0 0XS_047 2-Oct-07 7.39 121.11 0.515 8.4 4.6 0 0.062 0.285 4.756 0.055 0 0XS_051 2-Oct-07 8.59 129.70 0.504 11.3 4.6 0 0.097 0.446 5.202 0.06 0 07981_6 2-Oct-07 31.71 161.41 0.539 10.0 4.6 0 0.317 1.458 6.660 0.077 0 0XS_075 3-Oct-07 20.36 181.77 0.558 11.8 1.3 1.6 0.240 0.312 6.972 0.081 0.384 0.3847981_7 3-Oct-07 4.93 186.70 0.566 10.2 1.3 1.6 0.050 0.065 7.037 0.081 0.080 0.464XS_079 3-Oct-07 8.23 194.93 0.620 10.2 1.3 1.6 0.084 0.109 7.146 0.083 0.134 0.598XS_081 3-Oct-07 4.79 199.72 0.675 9.4 1.3 1.6 0.045 0.059 7.205 0.083 0.072 0.6707981_9 2-Oct-07 5.72 205.44 0.671 10.4 4.6 0 0.059 0.271 7.476 0.087 0.000 0.670XS_088 2-Oct-07 9.97 215.41 0.712 8.4 4.6 0 0.084 0.386 7.862 0.091 0.000 0.670XS_095 3-Oct-07 12.92 228.33 0.658 14.0 1.3 1.6 0.181 0.235 8.097 0.094 0.290 0.9607981_10 3-Oct-07 6.00 234.33 0.636 17.8 1.3 1.6 0.107 0.139 8.236 0.095 0.171 1.131XS_099 2-Oct-07 7.54 241.87 0.863 12.8 4.6 0 0.097 0.446 8.682 0.1 0.000 1.1317981_11 3-Oct-07 24.00 265.87 0.822 7.6 1.3 1.6 0.183 0.238 8.920 0.103 0.293 1.424XS_109 3-Oct-07 5.00 270.87 0.818 12.3 1.3 1.6 0.062 0.081 9.001 0.104 0.099 1.5237981_12 3-Oct-07 5.00 275.87 0.719 12.6 1.3 1.6 0.063 0.082 9.083 0.105 0.101 1.624XS_115 4-Oct-07 7.61 283.48 0.911 16.5 1.9 0.2 0.126 0.239 9.322 0.108 0.025 1.649XS_128 3-Oct-07 41.60 325.08 0.928 12.3 1.3 1.6 0.514 0.668 9.990 0.116 0.822 2.471TOTALS 325 km 80 dam³ 3.4 km² 0.116 m³/s 10 dam³ 0.029 m³/s
20
Note: Totals may not add or subtract exactly as a result of rounding.
21
Table 5: Flows Accounting for Evaporation and Consumptive Use, October 1-4, 2007
Site LabelDate / Time
Incremental Distance
(km)
Cumulative Distance
(km)
Average Discharge at
Site (m³/s)
Onefour .85 Daily Pan Evap
(mm)
Onefour Daily Total
Precip (mm)
Average Daily Evap Rate
Accumulating Downstream
(m³/s)
Average Daily Ppt Rate
Accumulating Downstream
(m3/s)
Q Measurement
plus Evap Rate, Adjusted for
Precip (m³/s)
Accumulative Metered
Consumptive Use
(m³/s)
Flow accounting for Consumptive Use, Evap and
Precip (m³/s)
Initial Q (m³/s)
Delta Q: Initial Q minus Mmn't (m³/s)
Delta Q: Acct for Evap,
Precip and CU
(m³/s)
7981_1 1-Oct-07 5 5.00 0.306 3 0 0.002 0 0.308 0.000 0.308 0.306 0.000 -0.002XS_004 1-Oct-07 1.00 6.00 0.297 3 0 0.002 0 0.299 0.000 0.299 0.306 0.009 0.007XS_005 1-Oct-07 0.49 6.49 0.356 3 0 0.002 0 0.358 0.000 0.358 0.306 -0.049 -0.051XS_006 1-Oct-07 1.84 8.33 0.345 3 0 0.003 0 0.348 0.000 0.348 0.306 -0.039 -0.042XS_007 1-Oct-07 2.84 11.16 0.319 3 0 0.004 0 0.323 0.000 0.323 0.306 -0.013 -0.017XS_008 1-Oct-07 4.00 15.16 0.324 3 0 0.005 0 0.329 0.000 0.329 0.306 -0.018 -0.023XS_010 1-Oct-07 4.62 19.79 0.376 3 0 0.006 0 0.382 0.000 0.382 0.306 -0.069 -0.075XS_013 1-Oct-07 8.25 28.04 0.371 3 0 0.008 0 0.379 0.000 0.379 0.306 -0.065 -0.0737981_2 2-Oct-07 5.66 33.70 0.371 4.6 0 0.01 0 0.381 0.000 0.381 0.306 -0.065 -0.075XS_016 2-Oct-07 3.18 36.88 0.361 4.6 0 0.012 0 0.373 0.000 0.373 0.306 -0.055 -0.0677981_3 2-Oct-07 8.72 45.60 0.397 4.6 0 0.015 0 0.412 0.000 0.412 0.306 -0.091 -0.106XS_020 2-Oct-07 3.20 48.80 0.430 4.6 0 0.017 0 0.447 0.000 0.447 0.306 -0.124 -0.141XS_021 2-Oct-07 1.40 50.20 0.409 4.6 0 0.017 0 0.426 0.000 0.426 0.306 -0.102 -0.1197981_5 2-Oct-07 15.00 65.20 0.459 4.6 0 0.025 0 0.484 0.000 0.484 0.306 -0.153 -0.178XS_035 2-Oct-07 25.47 90.67 0.423 4.6 0 0.038 0 0.461 0.000 0.461 0.306 -0.117 -0.155XS_040 2-Oct-07 12.73 103.40 0.493 4.6 0 0.045 0 0.538 0.000 0.538 0.306 -0.187 -0.232XS_045 2-Oct-07 10.32 113.72 0.466 4.6 0 0.052 0 0.518 0.000 0.518 0.306 -0.160 -0.212XS_047 2-Oct-07 7.39 121.11 0.515 4.6 0 0.055 0 0.570 0.000 0.570 0.306 -0.209 -0.264XS_051 2-Oct-07 8.59 129.70 0.504 4.6 0 0.06 0 0.564 0.000 0.564 0.306 -0.198 -0.2587981_6 2-Oct-07 31.71 161.41 0.539 4.6 0 0.077 0 0.616 0.000 0.616 0.306 -0.233 -0.310XS_075 3-Oct-07 20.36 181.77 0.558 1.3 1.6 0.081 0.004 0.635 0.000 0.635 0.306 -0.251 -0.3287981_7 3-Oct-07 4.93 186.70 0.566 1.3 1.6 0.081 0.005 0.642 0.000 0.642 0.306 -0.259 -0.335XS_079 3-Oct-07 8.23 194.93 0.620 1.3 1.6 0.083 0.007 0.696 0.000 0.696 0.306 -0.313 -0.389XS_081 3-Oct-07 4.79 199.72 0.675 1.3 1.6 0.083 0.008 0.750 0.000 0.750 0.306 -0.369 -0.4447981_9 2-Oct-07 5.72 205.44 0.671 4.6 0 0.087 0.008 0.750 0.000 0.750 0.306 -0.365 -0.444XS_088 2-Oct-07 9.97 215.41 0.712 4.6 0 0.091 0.008 0.795 0.000 0.795 0.306 -0.406 -0.489XS_095 3-Oct-07 12.92 228.33 0.658 1.3 1.6 0.094 0.011 0.741 0.000 0.741 0.306 -0.351 -0.4347981_10 3-Oct-07 6.00 234.33 0.636 1.3 1.6 0.095 0.013 0.718 0.000 0.718 0.306 -0.330 -0.412XS_099 2-Oct-07 7.54 241.87 0.863 4.6 0 0.1 0.013 0.950 0.000 0.950 0.306 -0.557 -0.6447981_11 3-Oct-07 24.00 265.87 0.822 1.3 1.6 0.103 0.016 0.909 0.000 0.909 0.306 -0.516 -0.603XS_109 3-Oct-07 5.00 270.87 0.818 1.3 1.6 0.104 0.018 0.904 0.000 0.904 0.306 -0.511 -0.5977981_12 3-Oct-07 5.00 275.87 0.719 1.3 1.6 0.105 0.019 0.805 0.000 0.805 0.306 -0.412 -0.498XS_115 4-Oct-07 7.61 283.48 0.911 1.9 0.2 0.108 0.019 1.000 0.000 1.000 0.306 -0.605 -0.694XS_128 3-Oct-07 41.60 325.08 0.928 1.3 1.6 0.116 0.029 1.015 0.000 1.015 0.306 -0.621 -0.708TOTALS 325 km 80 dam³ 10 dam³ 2.5 dam³ 88 dam³ -61 dam³
21
Note: Totals may not add or subtract exactly as a result of rounding.

22
x.In October, both the streamflow measurements and the measurements adjusted for consumptive use, evaporative losses, and precipitation are shown in Figure 10. The streamflow measurement data on this chart are the mean of the A and B samples at each measuring site plotted against their distance downstream from North Milk River near the International Boundary.
Figure 10: Milk River Streamflow Progression, October 1- 4, 2007
Q accounting for Evaporation, Precipitation, and Consumptive Use
R2 = 0.9587
Q measured in field
R2 = 0.9352
0.000
0.200
0.400
0.600
0.800
1.000
1.200
0 50 100 150 200 250 300 350
Distance Downstream of Western Crossing of International Boundary (km)
Mil
k R
iver
Str
eam
flo
w (
m³/
s),
Oct
ob
er 1
- 4
, 20
07
Measured Streamflow (m³/s) Streamflow adjusted for Evap, Precip and CU (m³/s)
Linear (Streamflow adjusted for Evap, Precip and CU (m³/s)) Linear (Measured Streamflow (m³/s) )
Figure 11 demonstrates the progressive gains in streamflow as the field measurements, in October 2007, moved downstream from North Milk River near the International Boundary to Milk River at Eastern Crossing of the International Boundary. There were no consumptive uses during the October surveys, and when considering the evaporative losses and precipitation, the streamflow increased by 0.707 m3/s (61 dam3/day), approximately 230% of the initial flow of 0.308 m3/s (27 dam3/day). The progressive gains in streamflow appear to increase consistently, as flow measurements move from west to east. However, in the reach between 275 km and 325 km downstream from North Milk River near the International Boundary, the average gain in flow is 0.21 m3/s or 0.0042 m3/s per km, twice the average gain along the entire river, 0.0021 m3/s per km.
23
Figure 11: Progressive Gains to Milk River Streamflow Accounting for Metered Consumptive Use, Evaporation, and Precipitation, October 1-4, 2007
Average Gain = 0.0021 (m³/s) per km downstream
R2 = 0.9587
-30%
0%
30%
60%
90%
120%
150%
180%
210%
240%
270%
0 50 100 150 200 250 300 350
Distance Downstream of Western Crossing of International Boundary (km)
Pro
gre
ssiv
e G
ain
s o
f S
trea
mfl
ow
, %
of
Init
ial
Flo
w
-0.092
0.000
0.092
0.184
0.276
0.368
0.460
0.552
0.644
0.736
0.828
Pro
gre
ssiv
e G
ain
s o
f S
trea
mfl
ow
(m
³/s)
Gain % Initial Flow Gain from Initial Flow (m³/s) Linear (Gain from Initial Flow (m³/s))
Average Gain = 0.69% per km downstream

24
Summary and Discussion For the August 2007 survey, when time of travel, consumptive use based on Thompson (1986) values, evaporation and precipitation are taken into account, there remains 13% of the initial streamflow that has unaccounted losses. When the metered consumptive use along with evaporation and precipitation are applied to the August 2007 flow measurements, approximately 11% of the initial streamflow remains as unaccounted losses at Milk River at Eastern Crossing of International Boundary. The metered consumptive uses exceeded the estimates determined with Thompson’s (1986) values associated with the August 14-17, 2007 field measurements. The metered consumptive uses were 0.83 m3/s (71 dam3/day), as compared to 0.42 m3/s (36 dam3/day) using Thompson’s values. The metered consumptive use, August 14-17, 2007 was concentrated in a specific channel length, from 90 km to 234 km downstream from North Milk River near the International Boundary (Table 3). The direct flow measurements, in August 2007, between 0 km and 65 km downstream of North Milk River near the International Boundary show consistent steady flow measurements, with an average of 17.0 m3/s (1469 dam3/day). However, between 65 km and 90 km there is a significant decline in the magnitude of the flow measurements, and the decline continues to 130 km downstream of North Milk River near the International Boundary (Figure 7). With no consumptive use in this reach of the river, between 65 km and 90 km, a discontinuity in unaccounted for losses was observed (Figure 9). Likewise, in August 2007, there was no consumptive use in the channel between 325 km and 335 km downstream of North Milk River near the International Boundary and a discontinuity in unaccounted losses is shown in this reach of the river (Figure 9). As noted previously, there were 3 flow measurements taken near the Milk River at Eastern Crossing of the International Boundary (335 km), and these measurements were within a 5% allowance for error of measurement. For the August 2007 flow measurements, the unaccounted losses within each group are between +/-5%, an allowable error of measurement distributed on either side of the average for each specific group (Figure 9). In Group 1 the unaccounted losses range between approximately +/- 1% of the group average, in Group 2 the unaccounted losses range between about +/- 3% of the group average, and in Group 3 the unaccounted losses are within about +/-1% of the group average. The sample size of flow measurements is small within each group (Figure 9) and caution is needed when projecting a trend within a group.

25
In the October 2007 field survey, the gain in streamflow appears to increase consistently as measurements moved downstream from North Milk River near the International Boundary, without any reaches of the river showing discontinuity in the increases of flow (Figure 11). There is no discontinuity in the streamflow gains between 65 km and 90 km as comparable to the discontinuity of unaccounted losses associated in this reach for the August 2007 survey. If there was channel seepage in this reach of the river during the August 2007 survey, some water could be expected to return to the stream during the October 2007 survey due to releases from bank storage in this reach of the river. Although there are no evident discontinuities of gain for the October 2007 survey, the reach of the river between 275 km and 325 km downstream of North Milk River near the International Boundary is characterized by an increase in magnitude of flow twice the average gain along the entire river (Figure 11). The analysis of the flow measurements taken in October 2007, with gradual increasing flows along the river, demonstrates similarities with a study by Thompson (1986), reporting a gradual increasing trend in the flow along the channel. The two studies were conducted at a similar time in the year, in October after the shutdown of the diversion to the St. Mary Canal. Thompson’s study October 13-15, 1981, was conducted about 2 weeks after the shutdown of the canal and the October 2007 survey was conducted about 3 weeks after the shutdown of the canal. In the October 2007 survey, the streamflow increased from 0.3 m3/s to 0.9 m3/s (26 to 78 dam3/day), a total increase of 0.6 m3/s (52 dam3/day). In Thompson’s study October 13-15, 1981 the streamflow increased from 1.7 m3/s to 2.5 m3/s (147 to 216 dam3/day), a total increase of 0.8 m3/s (69 dam3/day). In another study by Thompson, October 25-26, 1982, conducted more than 2 months after the canal shutoff, the measured flows increased from 0.93 m3/s to 1.08 m3/s (80 to 93 dam3/day), a total increase of 0.15 m3/s (13 dam3day). In this study, using specific-conductance measurements, Thompson (1986) attributes streamflow increases to discharge from alluvium.

26
Recommendations Conclusion 1: The analysis of the August 2007 flow measurements with accounting for consumptive use, evaporative losses, and precipitation identified a discontinuity of unaccounted losses in streamflow in the reach between 65 km and 90 km downstream of North Milk River near the International Boundary. Additional information related to the unaccounted losses in streamflow may be attained with further investigation at this specific reach of the river. Although the discontinuity of unaccounted losses in flow for August 2007 does not have a complementary streamflow gain in October 2007 in the reach between 65 km and 90 km, worthwhile information may be obtained by investigating channel seepage, local geology, and aquifer characteristics in this reach of the river.
Recommendation 1: Conduct additional streamflow measurements and investigate channel seepage, in a July/August time-frame, in the reach of the river between approximately 65 km and 90 km downstream from North Milk River near the International Boundary. Conclusion 2: The August 2007 flow measurements with accounting for consumptive use, evaporative losses, and precipitation revealed large flow losses in the reach between 325 km and 335 km downstream of North Milk River near the International Boundary. Additional understanding may be gained with an investigation of this reach of the river in more detail.
Recommendation 2: Conduct additional streamflow measurements and investigate channel seepage, in a July/August time-frame, in the reach of the river between approximately 325 km and 335 km downstream from North Milk River near the International Boundary. Collect and review data related to evaporative loss estimates in this reach of the river. An alternative: study this reach of the river during April, a time when there is diversion in the St. Mary Canal and evaporation is relatively low. The accuracy of evaporation computations would be a less critical factor at this time of year. Conclusion 3: Although there are no evident discontinuities of gain for the October 2007 survey, an analysis of the reach of the river between 275 km and 325 km downstream of North Milk River near the International Boundary showed an increase in magnitude of flow twice the average gain along the river. An understanding of the reasons for the increasing trend of streamflow as the measurements progressed downstream would require investigation of the source of the consistently increasing flows in October. Investigation of this specific reach of the river may provide insight into groundwater interaction: channel seepage and releases from bank storage.
Recommendation 3: Conduct additional streamflow measurements and investigate the occurrence of flow releases from bank storage, in an October time-frame, in the reach of the river between approximately 275 km and 325 km downstream from North Milk River near the International Boundary.

27
Concluding Statements The analysis of the flow measurements taken in August 2007 and October 2007 with accounting for consumptive use, evaporative losses, and precipitation provides additional information for the assessment of channel losses and gains along the Milk River channel. In reference to unaccounted streamflow losses and gains:
1. Analysis of the August 2007 survey demonstrates three distinct groups of unaccounted flow losses (Figure 9), and within each group the unaccounted losses ranged within +/- 5% of the group average, an allowable error of measurement;
2. Although the unaccounted losses within a particular group (August 2007 survey) ranged within +/-5% of the group average (Figure 9), there is an overall west to east increasing trend in unaccounted losses (Figure 8);
3. Analysis of the October 2007 survey demonstrates consistent streamflow gains with no evident discontinuities of gain in flow (Figure 11).
This report recommends further investigation and analysis of two discontinuities of unaccounted losses at specific reaches of the river, downstream from the North Milk River near the International Boundary:
1. approximately 50 km to 110 km 2. approximately 300 km to 335 km.
Also, this report recommends further investigation of the source of channel gains in a specific reach of the river, approximately 250 km to 325 km downsteam from the North Milk River near the International Boundary.

28
References Thompson, R. E. 1986. Natural flow and water consumption in the Milk River basin, Montana and Alberta, Canada. Helena, Montana: U.S. Geological Survey.
Canadian National Committee for the International Hydrological Decade. (1978). Hydrological atlas of Canada = Atlas hydrologique du Canada. [Ottawa]: Fisheries and Environment Canada.
U.S. Geological Survey and Water Survey of Canada (2003), “Procedures for the Division of the Waters of the St. Mary and Milk Rivers”, Helena, MT. and Calgary, AB., Unpublished manual. Agriculture and Agri-Food Canada. (2007). Pan Evaporation Data from Onefour, AB. Unpublished data Canada, Meteorological Service of Canada, & Water Survey of Canada. (2007). HYDAT Surface water and sediment data. Ottawa: Environment Canada. Water Survey of Canada website (2007) http://www.wsc.ec.gc.ca/products/main_e.cfm?cname=products_e.cfm
29
Monthly Total Potential Lake Evap (0.85 Pan) mm. Monthly Total Precipitation (mm).
Date Apr Ma
Appendix A: Daily Evaporation and Precipitation at Onefour, Alberta, 2007
y Jun Jul Aug Sep Oct Date Apr May Jun Jul Aug Sep Oct1 0 6.4 4.8 5.8 6.1 8 3 1 0 0 0 0 0 0 02 0 3.1 4.8 6 8.1 4.3 4.6 2 0.8 4.6 0 0 0 0 03 0 1.6 5.6 7.6 7 6.9 1.3 3 0 2.2 0 0 0 0 1.64 0 5 6.3 7.4 7.8 4.9 1.9 4 0 0 0 0 0 0 0.25 0 4.6 3.1 8.2 4.6 5.6 0.4 5 0 0 24 0 0 0 9.86 0 5.1 2.2 7.6 6.2 4.8 0.5 6 0 0 9.6 0 0 0 07 0 5.3 3.7 7.3 8.5 0.5 1.8 7 0 0 0 0 0 4.4 08 0 7.5 3.1 4.8 6.8 2.7 3 8 0 0 0 1.6 0 0 09 0 7.9 6.1 7.1 6.6 3.6 4 9 0.8 0 0 0 0.2 0 0
10 0 4.6 3.4 5.3 4 5.2 3 10 6.2 0 0.2 0 3.2 0 011 0 3.6 6.3 5.6 4.9 5.2 2 11 0.2 0 0 0 0 0 1.612 0 5.5 6.9 7.2 7 2 1.3 12 0 0 0 0 0 0.2 013 0 2.8 3.3 7.6 5.8 2.8 1.9 13 0 1.4 0 0 0 0 014 0 2.2 4.3 8.8 4.9 4 2.1 14 0 2.8 1 0 0 0 015 0 4.2 3.4 6.9 6.9 4.8 3 15 0 0 0 0 0 0 016 0 6 3.3 7.9 8.1 5.6 2.3 16 0 0 1.8 0 0 0 017 0.4 5.8 2.7 6.3 7.8 4.6 2 17 0 0 8.8 0 0 0 118 4.1 6.6 2.7 8.7 5 2.9 2.8 18 2.6 0 1.4 0 0 0 019 2.1 3 4.5 7.4 5.5 1 1.7 19 19 0 0 15 2 18.6 020 2.1 5.2 5.3 6.9 5.9 0.1 2 20 1.4 0 0 0 0 0 021 3.1 1.4 6.4 8.2 6.9 3.1 2.2 21 0.2 6.2 0 0.6 0 0 022 3.2 1.4 6.6 7 5.3 4 4.7 22 0 1.2 0 0 0 0 023 2.7 3.7 7.8 7 2.2 2.7 4.5 23 3 0 0 0 0.8 26.2 024 3.7 1.3 2.9 4.9 3.7 1.5 4.4 24 0 21.2 6 0.2 0 0 025 5.3 1.5 3.6 5.6 7.8 3.9 2.4 25 0 1 8.4 0 0 0.2 026 6.6 4.2 6 8.3 4.9 3.7 2.8 26 0 0 0 0 0 0.6 027 6.6 4.3 6.2 6.3 3.2 2.4 4.3 27 0 0.4 0 0.2 0 0 028 6 1.4 5.7 9.4 3.3 3.3 2.4 28 0 2 0 0 0 0 029 4.5 1 4.3 8.2 5.7 1.4 4.3 29 0 3 0.4 0 0 0.2 030 4.4 1.3 6.3 8.2 6.6 2 2.9 30 0 0.8 0 0 0 0 031 3.2 8 6.5 1.1 31 0.2 0 0 0
Total 54.8 120.7 141.6 221.5 183.6 107.5 80.6 Total 34.2 47 61.6 17.6 6.2 50.4 14.2Seasonal Total 910.3 Seasonal Total 231.2
29